Gold Investor Pro Guide to Junior Canadian/American Resource Companies with Limited Reserves - Granada Gold Mine Inc.
←
→
Page content transcription
If your browser does not render page correctly, please read the page content below

Gold Investor Pro
                                                                               November 13, 2017

          Gold Investor Pro
     Guide to Junior Canadian/American
         Resource Companies with
              Limited Reserves

Page 1          Get Additional Ubika Research Reports on SmallCapPower.com      Ver. 1.01
Gold Investor Pro
                                                                                                                                               November 13, 2017

Table of Contents

Overview - Unusual Gold Market Behaviour is a Rare Opportunity for Investors................... 3-7
  Valuation Discussion - Psst... There Are Ways Other Than P/NAV & EV/oz to Value Resource Developers!............ 5
  Competitor Chart - EV/Resource Ounce................................................................................................6
  Competitor Chart - Adjusted EV/Resource Ounce................................................................................... 7
Tear Sheets .............................................................................................................................. 8-14
   Alto Ventures Ltd - Exploring New Gold Frontiers in Canada......................................................................................... 8
   Granada Gold Mine Inc. - Searching for the Right Mill.................................................................................................. 9
   GTA Resources and Mining Inc. - Duck... Duck... Gold?............................................................................................. 10
   Maritime Resources Corp. - Hammering Into Production ............................................................................................ 11
   Rockhaven Resources Ltd - Yukon Deposit Ripe for Growth ....................................................................................... 12
   Treasury Metals Inc. - Digging To That Shiny Chest..................................................................................................... 13
   West Red Lake Gold Mines Inc. - Making an Old Mine New Again ........................................................................... 14
Full Competitor List .................................................................................................................. 15

Page 2                                                  Get Additional Ubika Research Reports on SmallCapPower.com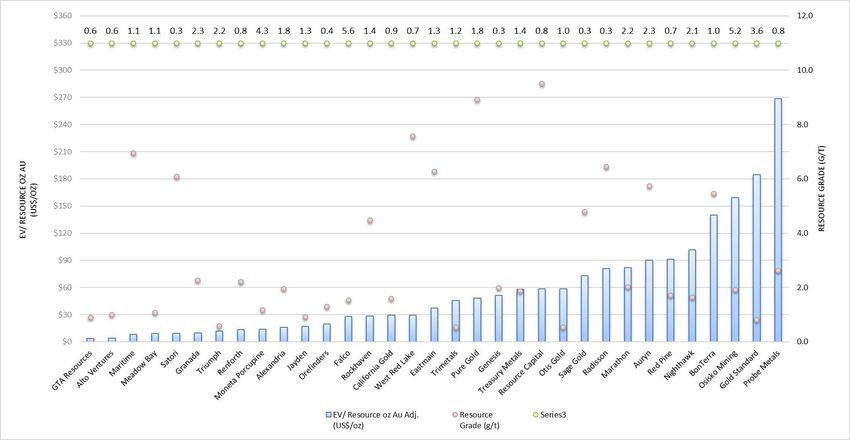
Gold Investor Pro
                                                                                                                                       November 13, 2017

                                                Gold Investor Pro
                                                November 13, 2017

                                                 Chris Thompson | Head of Research | Ubika Research | Chris@ubikaresearch.com | 1 (416) 574-0469
 Gold Investor Pro
 November 13, 2017                               Patrick Smith | Analyst | Ubika Research | Patrick@ubikaresearch.com | 1 (647) 444-5506

 Unusual Gold Market Behaviour is a Rare Opportunity for Investors
 In general, demand for gold is increasing after a post-election U.S. fallout. In only nine months, the price of gold has increased to a
 peak of US$1,351/oz on September 8, 2017, from its bottom of US$1,133/oz on December 22, 2016. Although gold is trading strongly in
 the US$1,250-$1,350/oz range, many gold equities have not followed suit as they did in early 2016 to a high of US$1,373/oz on August
 2, 2016, from a low of US$1,054/oz on December 2, 2015. In our view, this unusual market behaviour is a rare opportunity for investors,
 providing an extended entry point to the low end of what could be a medium to long-term positive trend in gold equities.
 Opportunity to pick up gold stocks near their lows, once               Figure 1: NASDAQ-100 vs. GDXJ 1-Year Performance
 again. Gold equities recorded a slight bounce back but not
 with the strong correlation seen during the bull market from
 Dec. to Sept., primarily since the U.S. stock market has
 performed very well over the same period. In the past year,
 as shown in Figure 1, the NASDAQ-100 outperformed the
 VanEck Vectors Junior Gold Miners ETF (GDXJ) by 47%.
 Precious metal equities have not followed the gold price
 predictably. For example, when gold reached its high of
 US$1,373/oz on August 2, 2016 (three-year high), the GDXJ
 reached a high of US$48.28. However, on September 8, after
 a steep correction in the gold price and a return to its closest
 price to the previous three-year high in approximately one
 year at US$1,351/oz, the GDXJ closed at only US$36.96.
 Unfortunately for investors in gold stocks, the rise in the
 gold price has not had a positive correlation in equities; as
 shown by the significant difference in the price of the GDXJ, Source: Quotestream (Fig. 1 & 2)
 , there are many gold stocks that are well-below their 52-week highs. To illustrate further, Figure 2 is a small sample set of eight producing
 and development companies, which are well-covered by sell-side analysts. Although there has been some negative news for these companies
 in this intermediate period, the sustained decrease in their share prices are not justified in the short term.
 Gold equities remain a hedge to global security risk, a possible U.S. market Figure 2: Gold Co. Trading Near 52-Week Lows
 downturn, and/or the U.S. dollar. Any negative catalyst to knock the U.S.                                    52-   52-
 market from its record highs should send gold equities higher like in early 2016.            Company Week Week Close To                 To
 We have already seen significant US$10-$50/oz spikes in the gold prices thanks                  Name        High Low Price Low High
 to “Fat Man and Little Boy” (Trump & Kim John Un – Bill Maher) threatening                      Alacer      $3.11 $1.75 $2.11 -17% 47%
 to annihilate each other. Regardless, on a fiscal policy stand point, the Federal              B2 Gold      $4.64 $2.69 $3.35 -20% 39%
 Reserve is seesawing on what they want to do, and the U.S. and Canadian markets
                                                                                            Gold Standard $3.85 $1.61 $2.01 -20% 92%
 have reacted strangely. For example, the Federal Reserve (Fed) decided to cut
                                                                                                Guyana       $8.12 $3.96 $4.43 -11% 83%
 its balance sheet but the bond market did not react as expected by economists.
                                                                                                Klondex      $7.73 $3.16 $3.16 0% 145%
 Yields stood in-line as the market demonstrated it was a non-issue. The next major
                                                                                                Roxgold      $1.67 $1.03 $1.16 -11% 44%
 catalyst for gold is the expectation of a U.S. rate hike on December 13. According
                                                                                               Wesdome $4.40 $1.77 $1.81 -2% 143%
 to CME Group, there is a 92% probability of a 1.25-1.50% rate hike.
                                                                                                  Yamana        $5.10 $2.84 $3.39 -16% 50%

Page 3                                           Get Additional Ubika Research Reports on SmallCapPower.com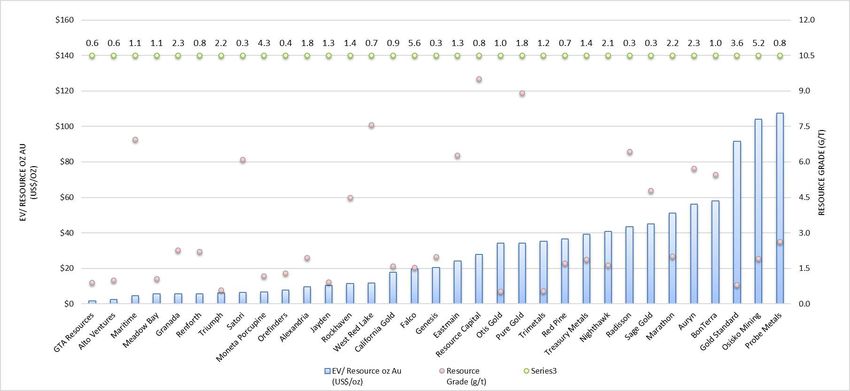
Gold Investor Pro
                                                                                                                                     November 13, 2017

  M&A transactions are picking up – who’s next? With Eldorado’s takeout of Integra (at $120/oz or $291/oz M&I), Alamos’s recent
  agreement to acquire Richmont, and Goldfield’s investment of 9% in Cardinal Resources, where else can the majors to mid-caps go?
  Fortunately, margins for gold producers are expanding but equity price for junior gold exploration companies remain sluggish, giving
  a significant opportunity for larger companies to flaunt their growing balance sheets and feed their appetites for earlier stage projects.
  Investors should remain vigilant of small cap developers since those are where premiums historically are the most attractive. In this
  precious metals update, we provide an update for seven select development/explorer companies (Prefeasibility (PFS) or pre-PFS) in solid
  jurisdictions (Canada & the US), that represent an investment opportunity due to the quality of its asset relative to its peers. Refer to a full
  competitor sheet with 33 companies on Page 15 of this report.
  What premiums are received for junior takeouts – what is the upside? It Figure 3: Select Comparable Transactions
  depends, but the short answer is substantial. The primary factors in a developing gold
  company’s valuation are quality and the stage of development with respect to the spot
  gold price, which are “priced-in” into any stock (efficient market theory) based on
  varying levels of speculation. However, there are wildcards. For example, investors
  sometimes search for what they consider as essentially “free options” in exploration
  upside, which are not priced-in, or are heavily discounted. An example would be an
  upcoming step-out hole drilled in an unexplored area. If these types of holes hit, it is
  like winning a straight-flush hand in poker, which you could cash out right away or
  continue playing. As a result, an investor should attempt to buy stocks with the most
  and/or largest option potential to leverage additional upside on top of the underlying
  fundamentals of a company’s assets (in some cases, this could be just land and cash).
  But remember, the larger the company, the more significant the discovery needs to
  be to move the needle. Figure 3 illustrates select comparable transactions up to the
  acquisition of Integra by Eldorado. The average premium and EV/oz paid was 55%
  and $52/oz. In terms of median, it was 43% and $34/oz. On takeouts, generally, the
  earlier stage, the higher the premium because the company costs less to an acquirer.
  To discover which stock could have the most upside, the next step is for an investor
  to decide which hold the most discounted value because these drastically change over
  time. Alternatively, a Feasibility-stage company financed to production will not have
  as much leverage, and will commonly trade with the price of gold and not much else.
  One of the best junior gold investments over the past three years occurred mid-
  2015. Osisko Mining (FNA Oban Mining) bid for Eagle Hill Exploration (Windfall
  Lake) and Temex Resources (Whitney & Juby) at 224% and 23% premiums, at
  $14/oz and $3/oz, respectively. These discounted per ounce valuations are similar
                                                                                           Source: Company Reports, Ubika Research
  to the companies written about in this report. Furthermore, at the time, Temex was
  a $13M explore company trading around $0.07, with more ounces in the ground Figure 4: Junior Mining Cycle
  than Eagle Hill, but at an earlier stage of development. Temex was later overbid by
  Lake Shore Gold, at 86% premium at $5/oz. The rest is history, as Lake Shore was
  eventually acquired by Tahoe Resources, roughly 80% higher than when Lake Shore
  acquired Temex. Alternatively, Osisko Mining has increased from a ~$50M market
  cap trading around $1.00 at $5/oz in early 2016, to a Canadian developer giant we see
  today with a market cap of $785M, trading at a premium of $3.79/share at US$104/
  oz. The Company progressed over the course of two years to host one of the largest
  drill programs in Canada at 800,000m with 24 rigs on site at its Windfall Lake/Urban
  Barry projects (most juniors only have one or two). In our opinion, these were two of
  the best gold trades in 2015 had an investor sold in a one to two-year window. What
  could the next big trade be?
                                                                                             Source: Brent Cook (Exploration Insights), Lassonde
  What's the best way to trade junior gold stocks? With a general overview of the gold space and what companies are worth, in context
  to the market, an investor is armed to succeed. However, as shown in Brent Cook's illustration of the junior mining cycle (Fig.4), there
  are optimal times to buy and to sell. The majority of companies we review at Ubika, such as the ones written in this article, are in the one
  to five-year speculative "BUY" period in the chart. As such, investors should attempt for awareness of a company's position in the cycle.

Page 4                                             Get Additional Ubika Research Reports on SmallCapPower.com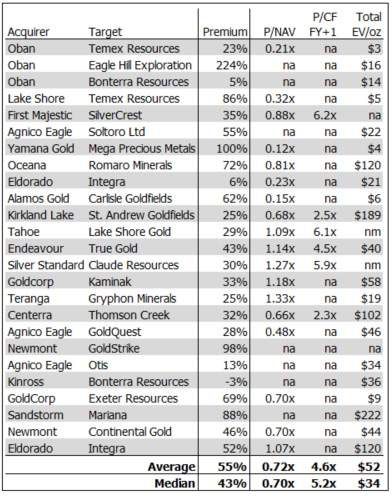
Gold Investor Pro
                                                                                                                                      November 13, 2017

 Psst... There Are Ways Other Than P/NAV & EV/oz to Value Resource Developers!
 EV/adjusted ounce is a normalized valuation that adjusts for the high variability of the three main Figure 5: Difference in Categories
 resource ounce categories called Inferred, Indicated, and Measured. In our opinion, lesser quality
 Inferred ounces should be a primary concern to investors when evaluating a resource development
 company. Although it is difficult to quantify, as a company advances a project, it will only convert
 a portion of its Inferred to Indicated or Measured. Eventually, in the later stages of development, a
 Company may publish a “Pre-Feasibility” or “Feasibility” Study, which outlines reserves for the first
 time. Like a Preliminary Economic Assessment (PEA), but more precise, these studies take a portion
 of the Indicated and or Measured Resource, and then convert into Proven and Probable Reserves
 ounces, which are very likely to be formulated using the most accurate mythologies (dependent
 on the technical report contractor). Generally, these ounces are widely accepted by the mining and
 investment community as the highest quality ounces, which could then be used in mine models
 assuming minimal dilutive factors, resulting in a more transparent asset. A mining company will
 always trade at a strong premium on an EV/P&P oz. basis compared to its EV/resource oz value.
 In stark contrast to Reserve ounces, there is no guideline for what is                   Figure 6: Resource Category Guideline
 established as an “Inferred ounce;” in terms of drill spacing, depth, grade
 consistency, extraction method, recoveries, payables, etc. Consequently,
 some mining companies will have misleading valuations, thus appearing
 undervalued, whereas they could be trading at much different “real”
 valuation in the market. As such, in this adjusted method, Inferred, Indicated,
 and Measured ounces are multiplied by 60%, 70%, and 80%. As a result, in
 all cases, the EV/adjusted oz valuations are higher than the regular EV/oz
                                                                                                 Source (Figures 5 & 6): Prof. Dr. Harraz (Tanta U., Egypt)
 metrics, however, rankings in value on a per-ounce basis will fluctuate using
 this adjusted method, due primarily to a strong discount to Inferred ounces. Investors should always remember if a company trades at a
 discount or premium to the average or median, it does not necessarily mean the stock is worth or less than what it is currently trading at. It
 is simply a measurement of value to bring relative context to peers to the Company’s stock price.
 Relativity to median is a metric that shows how many ounces the market believes the Company has. This is based on the median
 of its peer group. Median is the best normalizing value in this case because it removes outliers. This technique gives an investor another
 relative way to value a company, showing the upside or downside in context with the market. For example, Gold Standard Ventures is in
 the early stages of exploration, is relatively financed, and will likely be a while until it has its sights on production. It is well covered, has
 two major gold producer investors, and has very high upside on its land package. Consequently, the stock trades at a premium on an EV/
 oz. basis at US$92/oz compared to the median at US$21/oz, like it has 12.9M more oz than its current resource at 3.6M oz. While it seems
 extreme, in context it makes sense, as GSV has the potential to host several Carlin-style large deposits over its large land package, which
 could ideally be mined at low open-pit costs. Furthermore, the most important question to investors in this case would be, with analysis of
 the investment thesis, “Do I believe the Company can outline another 11.4M more ounces?” In which case, if you do believe it, it would
 be a buy candidate, if not, you would move on. It also brings context to the story, if an updated resource is released and its trend is not on
 pace to 12.9M more ounces (could take a long time), the stock might go down. In reference to the food industry, GSV is like eating a well-
 prepared French cooked meal, it is expensive but there is little surprises and you get what you want. With other less popular junior gold
 explorers, it is like eating special-of-the-day discounted meals from chefs training in school; it could be great or regrettable, but customers
 continue to sit down hoping for a pleasant surprise, knowing exactly what they paid for. With this fundamental context to a stock, trading
 gold stocks become far more conceptual than just hitting the buy trigger and crossing your fingers.
 Junior exploration/development that offer the highest returns. As shown in Figures 7 & 8 on the next two pages, for the exception
 of Treasury Metals, all the companies outlined in this report are located on the left quadrant of the chart. Typically, companies with
 exceptionally low EV/oz values that trade at a discount to the average or median represent the highest returns for investments. Importantly,
 as shown in Figure 3, smaller explorers/developers generally receive the highest share premiums on a takeout basis. Of interest, year-
 to-date, the 16 companies under the current average of US$22/oz outperformed the other 16 companies that are above by 16%. During
 the gold bull period between December 22, 2016 to September 8, 2017, the companies that initially traded below US$22/oz once again
 outperformed its higher premium peers by a significant margin of 30% (97% return vs. 67%). As a result, it does pay to pick discounted
 stocks!

Page 5                                               Get Additional Ubika Research Reports on SmallCapPower.com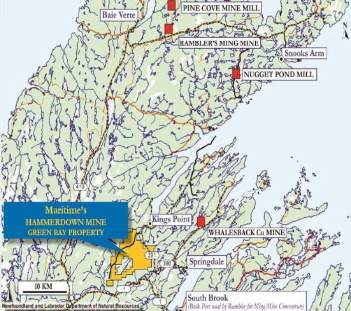
Canadian and US Gold Developers
Figure 7: EV (US$) / Resource oz Au

          Source: Thomson Reuters, Ubika Research

 Page 6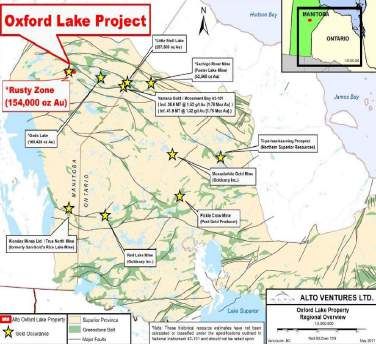
Canadian and US Gold Developers
Figure 8: Adjusted EV (US$) / Resource oz Au

          Source: Thomson Reuters, Ubika Research

 Page 7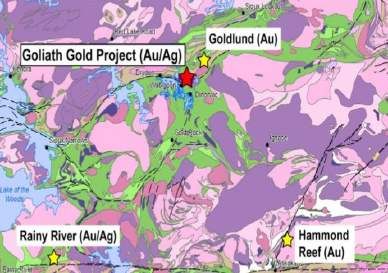
Equity Research
Metals & Mining, Exploration | Canadian Small Cap
November 13, 2017
Alto Ventures Ltd Chris Thompson | Head of Research | Ubika Research
Chris@UbikaResearch.com | 1 (416) 574-0469
(TSXV:ATV) Patrick Smith | Analyst | Ubika Research
Patrick@UbikaResearch.com | 1 (647) 444-5506
Exploring New Gold Frontiers in Canada Price Performance
$0.14 2,000
Company Description $0.12
1,800
1,600
Alto Ventures Ltd (TSXV:ATV; “Alto”) is a gold explorer advancing its Oxford Lake project
Daily Volume (thousands)
$0.10 1,400
1,200
in Manitoba and its Destiny project located 100km NE of Val d’Or, Quebec. Destiny hosts $0.08
1,000
10.8Mt Indicated grading 1.05 g/t Au for 365K oz Au and 8.3Mt Inferred grading 0.92 g/t $0.06
800
600
Au for 248K oz. To-date, Alto and previous operators have spent $7M on the project. The
$0.04
400
$0.02
Company is currently investigating the possibilities of a high-grade underground resource $0.00
200
-
potential. Alto also has a third project called Miner Lake in Ontario. The Company is Jul-16 Sep-16 Nov-16 Jan-17 Mar-17 May-17 Jul-17 Sep-17
currently seeking a JV partner for its Destiny project.
Market Data (TSXV:ATV)
Investment Highlights Price (November 10, 2017 close) $0.065
52 Week Range $0.045 - $0.14
• Recent samples show promise. During September and October, Alto released grab- Market Cap (M) $3.2
sample results from its 2017 summer campaign at its Oxford Lake project, which Current Shares Outstanding (basic, M) 49.1
covers 36K Ha. A total of 803 grab samples were collected and are currently being Current Shares Outstanding (fully diluted, M) 64.8
Free Float 94%
reviewed prior to a new drill campaign, expected to follow in 2018. Oxford Lake is the Average Daily Volume (3 months) 27K
main focus for the Company as it believes the geology is an iron formation, which is Total Debt (M) $0.0
similar to the Back River and Musselwhite deposits. Highlights from Hyers Island and Current Cash (M) $1.2
Cat Eye Bay include samples up to 109 g/t Au, 16.9 g/t Ag, 0.7% Cu, and 24% Zn, as Total Assets (M) $4.2
well as 37.8 g/t Au, 71.9 g/t Ag, 2.5% Cu and 2.5% Zn. The deposit hosts a historical Headquarters Vancouver, BC., Canada
resource (Noranda) of 800Kt grading 6 g/t Au for ~154K oz Au. Previous Alto drilling Top Shareholders
from 2012 intersected 6.7 g/t Au over 2.7m and 5.7 g/t Au over 6.8m. Results from the Gravitas Funds 12.8%
Accilent Capital 9.4%
Rusty gold deposit (included in the Oxford Lake package) are pending. Gold 3000 6.5%
• Recent sale enhances organic Figure 9: Sample Results Location Management 6.0%
exploration opportunity. On May Management
24, 2017, Alto announced the sale Rick Mazur CEO & Director
Marian Koziol President & Director
of its 100% interest in the Windfall David Cowan Director
East project located in Quebec Gary Zak Director
to Beaufield Resources (TSXV: Jeannine Webb CFO
Jacqueline Collins Corporate Secretary
BFD) for $300K, 2.75M Beaufield
shares, and Alto retained a 1% All figures in CAD unless otherwise stated.
NSR (buyback provision for 0.5% Source: Company Reports, Thomson Reuters
for $1M). In addition, Beaufield Figure 10: Location of Oxford Lake
subscribed to ~2.9M shares of Alto
at $0.12/share for gross proceeds of Source: Company Reports
$350K. Proceeds were mainly used towards advancing Oxford Lake in its summer
exploration program (geological mapping, prospecting, and soil/rock sampling).
• Trades at a steep discount. Alto trades at US$3/oz compared to the mean at US$30/
oz and the median at US$21/oz. In the near-term, this valuation gap with peers could
close if the Company follows up with positive results from Oxford Lake grab samples.
Upcoming Catalysts
• Ongoing results from summer exploration at Oxford Lake. Alto is currently
investigating underexplored areas at its Oxford Lake project to identify the different
types of mineralization in the area. Alto's main target is the Rusty-Blue Jay BIF Trend.
The results from 2017 work are expected to be reviewed in preparation of a drill
campaign, which is expected to begin in early 2018.
Source: Company Presentation
Page 8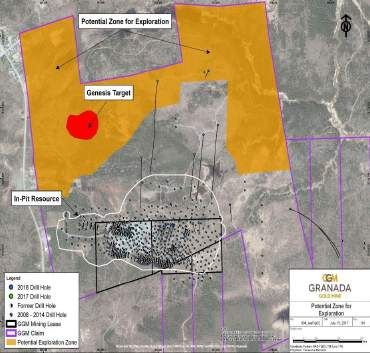
Equity Research
                                                                                                             Metals & Mining, Exploration | Canadian Small Cap
                                                                                                                                            November 13, 2017

Granada Gold Mine Inc.                                                                              Chris Thompson | Head of Research | Ubika Research
                                                                                                    Chris@UbikaResearch.com | 1 (416) 574-0469
(TSXV:GGM)                                                                                          Patrick Smith | Analyst | Ubika Research
                                                                                                    Patrick@UbikaResearch.com | 1 (647) 444-5506
Searching For The Right Mill                                                                        Price Performance
Company Description                                                                                  $0.09                                                                   3,000

                                                                                                     $0.08

Granada Gold Mine Inc. (TSXV:GGM; “GGM”) is a developer advancing its ~2,500 Ha                      $0.07
                                                                                                                                                                             2,500

                                                                                                                                                                                      Daily Volume (thousands)
Granada gold property located in Quebec. The Company hosts a solid mineral resource                  $0.06                                                                   2,000

                                                                                                     $0.05
base, good exploration upside, and the permits to operate a small startup scenario, but had          $0.04
                                                                                                                                                                             1,500

issues finding a mill to process its ore. However, developments of late have shed light onto         $0.03                                                                   1,000

the project, revitalizing it once again as a near-term producer.
                                                                                                     $0.02
                                                                                                                                                                             500
                                                                                                     $0.01

Investment Highlights
                                                                                                     $0.00                                                                   -
                                                                                                         Nov-16   Jan-17   Mar-17   May-17      Jul-17     Sep-17   Nov-17

•     Near-term production could be a possibility. On September 8, 2017, Granada signed
      a Memorandum of Understanding (MOU) with Castle Silver Resources (TSXV:CSR),                  Market Data (TSXV:GGM)
                                                                                                    Price (November 10, 2017 close)                     $0.04
      a non-arm’s length sister company, for the consideration of processing 579Kt grading          52 Week Range                              $0.035 - $0.09
      4.24 g/t Au for ~75,000 oz (assuming 95% recovery). This includes an option to                Market Cap (M)                                      $16.0
                                                                                                    Current Shares Outstanding (basic, M)               401.1
      process an additional 2Mt of material over the next three years. Included in the MOU,
                                                                                                    Current Shares Outstanding (fully diluted, M)       490.0
      is the agreement for CSR to install a 600tpd gravity flotation plant at one of its northern   Free Float                                           95%
      Ontario assets. Castle Silver is expected to release a follow-up study in Q4/17. Recall,      Average Daily Volume (3 months)                     240K
      a PFS, assuming a similar startup scenario, was released in 2014 outlining a potential        Total Debt (M)                                                                 $0.9
      “Rolling Start” at Granada utilizing a custom milling agreement at a rate of 550 tpd          Current Cash (M)                                                               $0.5
                                                                                                    Total Assets (M)                                                               $3.6
      with IAMGOLD, which did not come to light, due primarily to delays in the Quebec
                                                                                                    Headquarters                         Rouyn-Noranda, QC, Canada
      permitting process. The 2014 PFS estimated ~25K oz/year for three years with an all-
      in sustaining cost (AISC) of US$797/oz, with a post-tax NPV6% of $20M, an IRR of              Top Shareholders
                                                                                                    Marquest Asset Management Inc.                                                   8%
      139%, with capex of $6.7M. In our view, this is an important development; if Granada          Frank J. Basa                                                                    4%
      successfully pursues an agreement without the need for additional equity/debt to build        Roger Thomas                                                                     1%
      a mill, it would be a solid starting point to achieve near-term cash flow. This would         Management
      bode well to advance the project organically through further exploration/development          Frank J. Basa                            Preisdent, CEO & Chairman
                                                                                                    Thomas P. Devlin                                               CFO
      expansion with minimal dilution.
                                                                                                    Tina White                                       Corporate Secretary
•     Mine life should not be problem. On May 16, 2017, Granada released an updated                 Jacques F. Monette                                          Director
                                                                                                    Ronald Goguen, Sr.                                          Director
      mineral resource estimate, hosting 21.6Mt in-pit M&I grading 1.16 g/t Au for 808K             Dianne Tookenay                                             Director
      oz Au, with another 10.4Mt underground Inferred mineral resource grading 4.56 g/t
      for 1.5M oz Au. The Inferred underground ounces are located up to 1km north of the            All figures in CAD unless otherwise stated.
                                                                                                    Source: Company Reports, Thomson Reuters
      open-pit resource and are outlined from surface to 1km at depth. The Company is
      already permitted for an initial open-pit operation (stockpiled material on site).
                                                                                                                       Figure 11: Genesis Target
•     Untested potential. The LONG Bars zone included in the 2017 resource hosts 17.1M
      t grading 1.14 g/t Au for 625K oz. However, note that 80% of the LONG Bars area
      outside of the open-pit resource shell has not been explored yet, and remains open in
      all directions and at depth.
•     Trades significantly lower than its peers. At US$6/oz, Granada trades at a significant
      discount to peers at a mean of US$30/oz and a median of US$21/oz. In our opinion,
      the stock is trading as if the option for the near-term “rolling start” were free. Should
      Granada execute its MOU with Castle Silver or another mill option, near-term cash
      flow would de-risk the story immensely, and this gap in valuation to peers would likely
      close.
Upcoming Catalysts
•     Results from Genesis. The next main target for the Company, as shown on Figure 12,
      is the undrilled Genesis target, known as the “heat engine” for Granada mineralization.
•     Updated PFS. Using the newly-released resource estimate, GGM plans to update its              Source: Company Presentation
      2014 PFS, which is expected to include changes to the mining scenario.
    Page 9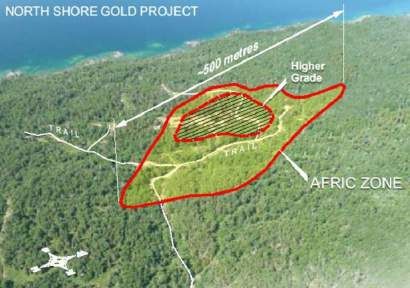
Equity Research
Metals & Mining, Exploration | Canadian Small Cap
November 13, 2017
GTA Resources and Mining Inc. Chris Thompson | Head of Research | Ubika Research
Chris@UbikaResearch.com | 1 (416) 574-0469
(TSXV:GTA) Patrick Smith | Analyst | Ubika Research
Patrick@UbikaResearch.com | 1 (647) 444-5506
Duck... Duck... Gold? Price Performance
$0.20 4,000
Company Description $0.18
3,500
$0.16
GTA Resources and Mining Inc. (TSXV:GTA; “GTA”) is advancing two main projects, 3,000
Daily Volume (thousands)
$0.14
2,500
the Northshore & Big Duck Lake projects located in northern Ontario. GTA owns a 54% $0.12
$0.10 2,000
interest in Northshore (Balmoral 46%), and is located 115km west of Hemlo and 200km $0.08
1,500
east of Thunder Bay. The deposit hosts 391K oz Au Indicated mineral resource and 824K
$0.06
1,000
$0.04
oz Au Inferred mineral resource for a combined grade of 0.90 g/t Au and mineral resource $0.02
500
$0.00 -
of 1.2M oz Au. Jul-16 Sep-16 Nov-16 Jan-17 Mar-17 May-17 Jul-17 Sep-17
Investment Highlights Market Data (TSXV:GTA)
• On August 29, GTA announced it expects to begin exploring at Big Duck Lake. Price (November 10, 2017 close) $0.035
52 Week Range $0.035 - $0.12
Big Duck Lake is located 4km east of this project in the Winston Lake mine, which Market Cap (M) $1.5
produced 2.68Mt grading 1.05% Cu, 12.05% Zn, 1.07 g/t Au and 31.37 g/t Ag over 11 Current Shares Outstanding (basic, M) 42.5
years. Note, Big Duck hosts a historic mineral resource of 53.7K t grading 10.7 g/t Au Current Shares Outstanding (fully diluted, M) 46.0
Free Float 94%
for ~18.5K oz Au. GTA can earn a 100% interest in the property by paying $45,000 to Average Daily Volume (3 months) 41K
the vendor and by issuing 750K shares over a six-month period, including a 2% NSR
Total Debt (M) $0.0
(can buyback 1% for $1M). Current Cash (M) $0.1
Total Assets (M) $5.8
• Northshore is envisioned as a large open-pit project. Highlights include 3.21 g/t
Au over 149.5m (uncut). GTA is contemplating two shallow pits (East and West pits). Headquarters Burlington, Ont., Canada
GTA is finalizing plans to begin permitting and to recover a 50,000 t bulk sample and Top Shareholders
Marquest Asset Management Inc. 7%
is pursuing a custom mill contract with a local party. The Company is focusing on a Robert Duess 2%
higher-grade zone within the centre of the Afric zone. Highlights include 12.49 g/t James Macintosh 1%
over 33.2m and 4.35 g/t Au over 14.6m. GTA has also completed some preliminary Brian Crawford 1%
metallurgical work; recoveries ranged from 94.8% to 99.6% using conventional Management
cyanidation. Peter M. Clausi Preisdent, CEO & Director
Brian Crawford CFO & Director
• Other early-stage projects. GTA has three other properties with early stage work; Wayne Reid VP, Exploration & Director
Birks Bovaird Chairman
these are Big Duck Lake (Gold - northern Ontario), Burnt Pond (zinc - silver - Julio Digirolamo Director
Newfoundland) and Auden (Option to own 100% - Gold - Ontario - historic resource).
All figures in CAD unless otherwise stated.
• Trades at a discount. Approximately 19,500m, or 100 holes (GTA 52 holes), have Source: Company Reports, Thomson Reuters
been included in the current 2014 mineral resource estimate. At Northshore, GTA
completed 103 holes to-date and has 491K oz Au Indicated and 824k oz Au of Inferred
for a combined 1.2M oz Au (or 659K oz attributable interest). GTA trades at US$2/ Figure 12: Location of the Afric Zone Deposit
attributable oz, a significant discount to the average and the median at US$30/oz and
US$21/oz.
Upcoming Catalysts
• Results from Big Duck Lake. High copper-zinc samples from Big Duck Lake could
provide a positive catalyst for the stock price. Big Duck Lake should provide ongoing
catalysts for the stock.
• Initiation of permitting at Northshore. The Company is expected to begin permitting
for a large bulk sample from the Afric Zone. Completion of a bulk sample would de-
risk the project by providing analysis on metallurgical and the economics of a potential
project.
Source: Company Presentation
Page 10Equity Research
Metals & Mining, Exploration | Canadian Small Cap
November 13, 2017
Maritime Resources Corp. Chris Thompson | Head of Research | Ubika Research
Chris@UbikaResearch.com | 1 (416) 574-0469
(TSXV:MAE) Patrick Smith | Analyst | Ubika Research
Patrick@UbikaResearch.com | 1 (647) 444-5506
Hammering Down Into Production Price Performance
$0.35 800
Company Description $0.30 700
Maritime Resources Corp. (TSXV:MAE; “Maritime”) is a PFS-stage developer advancing 600
Daily Volume (thousands)
$0.25
500
its 12,775 Ha Green Bay property located in Newfoundland. The Company has two main $0.20
400
deposits called Hammerdown and Orion (effective 2013), which on a combined basis host $0.15
300
1.8Mt M&I mineral resource grading 7.31 g/t for 429K oz Au and 3.1Mt Inferred mineral $0.10
200
resource grading 6.72 g/t for 661K oz Au. Both deposits are accessible via highway and
$0.05 100
$0.00 -
logging road and have access to local supplies, labour, and power. Jul-16 Sep-16 Nov-16 Jan-17 Mar-17 May-17 Jul-17 Sep-17 Nov-17
Investment Highlights Market Data (TSXV:MAE)
• The Company’s primary goal is the restart the Hammerdown gold mine. The Price (November 10, 2017 close) $0.10
52 Week Range $0.09 - $0.24
Company currently has an agreement with Rambler Metals for a toll milling and Market Cap (M) $6.9
tailings option at the Nugget Pond mill. The Hammerdown gold deposit was previously Current Shares Outstanding (basic, M) 68.9
mined by Richmont between 2000-2004 when gold was ~US$325/oz. The mine was Current Shares Outstanding (fully diluted, M) 94.5
Free Float 77%
then shutdown due to low gold prices. A total of 291Kt were mined at an average Average Daily Volume (3 months) 63K
grade of 15.8 g/t Au for 143K oz Au at recoveries of 97.1%. Importantly, there are
Total Debt (M) $0.5
existing underground workings available down to 300m. The ore was then processed Current Cash (M) $1.0
at the Nugget Pond mill, which is now owned by Rambler Metals and Mining PLC Total Assets (M) $6.1
(TSXV:RAB). Headquarters Vancouver, BC, Canada
• PFS to start. Maritime has an engineering agreement with Ramble to complete a Top Shareholders
Commander Resources Ltd 10%
PFS to reopen the Hammerdown mine. Results were released on March 2, 2017. Rambler Metals and Mining PLC 9%
The PFS utilizes a 400 tpd scenario at US$1,250/oz using 0.80 US/CAD exchange Allan W. Williams 1%
rate, estimating 34,800 oz Au/year over five years with average cash costs of $558/ Douglas A. Fulcher 1%
oz, generating an after-tax NPV8% of $44.2M and an IRR of 34.8%. Development is Management
estimated to take three years and cost $27.4M in initial capital. Allan W. Williams Chairman & Director
Douglas Fulcher President, CEO & Director
• Cashed up for the near-term. On September 25, Maritime closed a $1.0M financing. Andrew Pooler COO & Director
Bernard H. Kahlert VP Exploration
This follows a bridge $500K financing (one-year term), which was announced in April. Peter Mercer Director
Proceeds are expected to be used for road, portal, and underground development, as Jacqueline Colins Corporate Secretary
well as a 2,000m drill program. Niina Makela CFO
• Trades at a discount. Maritime trades at US$5/oz compared to the mean and median All figures in CAD unless otherwise stated.
of its peers, which trade at US$30/oz and US$21/oz, respectively. As MAE highlights Source: Company Reports, Thomson Reuters
some clarity on how it plans to finance the Hammerdown mine, the valuation gap Figure 13: Location of the Hammerdown Mine
would likely close.
Upcoming Catalysts
• Updates from ongoing work at Hammerdown. Ongoing work includes opening the
portal, trenching, permitting, and a 2,000m drill program.
• Results from work program at its Whisker project. Maritime recently acquired
the Au-Ag-Cu-Pb Whisker project located in Newfoundland. On October 12, 2017,
the Company released highlights of a new vein system with high-grade grab samples,
highlighted by 89.7 g/t Au, 310 g/t Ag, 0.1% Cu, and 1.5% Pb. The Company is
planning to follow with geophysics and possibily drilling.
Source: Company Presentation
Page 11Equity Research
Metals & Mining, Exploration | Canadian Small Cap
November 13, 2017
Rockhaven Resources Ltd Chris Thompson | Head of Research | Ubika Research
Chris@UbikaResearch.com | 1 (416) 574-0469
(TSXV:RK) Patrick Smith | Analyst | Ubika Research
Patrick@UbikaResearch.com | 1 (647) 444-5506
Yukon Deposit Ripe for Growth Price Performance
$0.30 900
Company Description $0.25
800
700
Rockhaven Resources Ltd (TSXV:RK; “Rockhaven”) is a PEA-stage developer advancing
Daily Volume (thousands)
$0.20 600
its gold-silver-lead-zinc Klaza project located in the Yukon. Rockhaven spent over $30M, $0.15
500
or 94,000m, in exploration to-date. Since publishing this resource, Rockhaven completed $0.10
400
300
more than 24,000m of additional drilling. Since 2010, the Klaza property has grown in size 200
$0.05
to 287km2 from 4km2. There are no mineral royalties granted on the property. 100
$0.00 -
Sep-16 Nov-16 Jan-17 Mar-17 May-17 Jul-17 Sep-17
Investment Highlights
• Current program yielded positive results to date. To-date, as part of its 16,000m Market Data (TSXV:RK)
drill program, Rockhaven has released results from 56 holes intended to further Price (November 10, 2017 close) $0.155
52 Week Range $0.12 - $0.22
define and expand near-surface mineralization via infill and step-out. Results have Market Cap (M) $24.3
been positive, highlighted by 182 g/t Au and 231 g/t Ag over 0.61m, which was the Current Shares Outstanding (basic, M) 152.1
Company’s highest-grade intercept ever drilled. Current Shares Outstanding (fully diluted, M) 171.2
Free Float 50%
• Strong multi-metal minerals resource base set to grow. Rockhaven released its Average Daily Volume (3 months) 59K
last mineral resource estimate in December 2015, using drill results up to September Total Debt (M) $0.0
of that year. The deposit hosts a combined pit-constrained and underground Inferred Current Cash (M) $4.6
Total Assets (M) $35.3
mineral resource of 9.4Mt grading 4.48 g/t Au, 89.0 g/t Ag, 0.75% Pb, and 0.95% Zn
for a contained 1.36M oz Au, 27.0M oz Ag, 155.4M lbs Pb, and 197.9M lbs Zn. Headquarters Vancouver, BC, Canada
Top Shareholders
• PEA a decent starting point. Klaza’s PEA was released in March 2016 using the Strategic Metals Ltd 39%
December 2015 Inferred mineral resource using metal prices of US$1,200/oz Au, W. Douglas Eaton 9%
US$16/oz Ag, US$0.80/lb Pb and US$0.85/lb Zn at an US/CAD exchange rate of Tocqueville Asset Management LP 3%
Marquest Asset Management Inc. 2%
0.75. Utilizing a 1,500 tpd process plant facility, the PEA estimated a post-tax NPV5%
of $86mm (~$0.56/basic share) and an IRR of 14% over a 14-year mine life, producing Management
Matthew A. Turner Preisdent, CEO & Director
a life-of-mine (LOM) payable average of 45k oz Au, 81k oz Ag, 3.7M lbs Pb, and Larry Donaldson CFO
3.7M Zn with an average cash cost of US$652/oz AuEq (AISC of US$966/oz AuEq) Ian J. Talbot COO
Robert C. Carne Director
per year. The capital cost for the project was estimated at $292M with LOM sustaining Randy C. Turner Director
capital of $6.9M/year. As shown in Figure 14, we estimate the project’s revenue spilt Glenn R. Yeadon Director
by metal is 73% Au, 18% Ag, 5% Zn and 4% Pb. Importantly, we note since the last R. Allan Doherty Director
David G. Skoglund Director
PEA report, metal prices have seen a general rebound, with significant changes in base Bradley J. Shisler Director
metals. Using spot prices, in comparison to the PEA, gold, silver, lead, and zinc prices Bruce Youngman Director
have increased 9%, 8%, 40%, and 68%, respectively. In our opinion, using the same
All figures in CAD unless otherwise stated.
recovery and payable estimates as the PEA, this would result in ~13% higher LOM Source: Company Reports, Thomson Reuters
payable revenue. Regardless, in our view, there are many opportunities to improve the
Figure 14: LOM Value Spilt By Commodity
potential economics of Klaza project. The most important is outlining additional near- (PEA Prices)
surface mineralization via exploration/delineation.
• Trades at a discount to its peers. Rockhaven currently trades at US$11/oz compared
to the peer average at US$30/oz and the median at US$21/oz. As highlighted above,
the potential for exploration upside, combined with the economic advantage of a
multi-metal deposit, present substantial opportunity for revaluation. As Rockhaven
continues to drill to upgrade and find new ounces, this gap should close.
Upcoming Catalysts
• Ongoing drill results. A total of 40 holes, both infill and step-out holes, are pending.
Further success from pending step-out holes could have very positive implications
towards outlining another open-pit shell.
Source: PEA, Ubika Research
Page 12Equity Research
Metals & Mining, Exploration | Canadian Small Cap
November 13, 2017
Treasury Metals Inc. Chris Thompson | Head of Research | Ubika Research
Chris@UbikaResearch.com | 1 (416) 574-0469
(TSX:TML) Patrick Smith | Analyst | Ubika Research
Patrick@UbikaResearch.com | 1 (647) 444-5506
Digging To That Shiny Chest Price Performance
$1.00 1,400
Company Description $0.90
1,200
$0.80
Treasury Metals Inc. (TSX:TML; “Treasury”) is a PEA-stage (Feasibility work in progress)
Daily Volume (thousands)
$0.70 1,000
company developing its flagship Goliath gold project located in the Kenora/Dryden district $0.60
$0.50
800
in NW Ontario. The project is close to Winnipeg, Thunder Bay and the northern U.S. and $0.40
600
offers plenty of skilled labour. Goliath is also in close proximity Goldcorp’s Red Lake and
$0.30 400
$0.20
Musselwhite mines, Barrick’s Hemlo mine, and Newgold’s Rainy River project, which is
200
$0.10
$0.00 -
in its later stages of development. TML continues to advance to receiving its Provincial and Nov-16 Jan-17 Mar-17 May-17 Jul-17 Sep-17 Nov-17
Federal Mine Permits in 2018. From mid-2017 to the end of 2018, the Company anticipates
completion of 30,000m of infill and expansion work to culminate into a Feasibility Study Market Data (TSX:TML)
Price (November 10, 2017 close) $0.62
in preparation to raise financing for construction.
52 Week Range $0.51 - $0.90
Market Cap (M) $72.3
Investment Highlights Current Shares Outstanding (basic, M) 116.6
• Solid baseline economics to build a mine. On March 8, 2017, Treasury Metals Current Shares Outstanding (fully diluted, M) 143.0
Free Float 91%
released an updated PEA using a gold price of US$1,225/oz and US$17/oz Ag and an Average Daily Volume (3 months) 91K
CAD/USD exchange rate of 0.76. Utilizing an open-pit/underground mine scenario,
Total Debt (M) $4.4
the PEA estimates producing an average of 87,850 oz Au and 160,000 oz Ag/year with Current Cash (M) $5.0
average cash costs of US$518/oz (AISC US$611/oz) over a mine life of 13 years. Total Assets (M) $76.3
The project requires an initial capex of $133.2M, equating to an after-tax NPV10% of Headquarters Toronto, Ont., Canada
$167.7M and an IRR of 25.1%. Construction is expected to begin in 2019 and take two Top Shareholders
years, with commercial production anticipated for Q4/2020. Extract 5%
DSC 5%
• Lots of mine-life and potential to grow. TML hosts open pit M&I of 18.2M t grading Marc C. Henderson 4%
1.26 g/t Au and 5.3 g/t Ag for 738K oz Au and 3.1M oz Ag, and underground M&I Gravitas 3%
Laramide 3%
of 2.4Mt grading 4.95 g/t Au and 14.7 g/t Ag for 377K oz Au and 1.12M oz Ag. Blaise F. Yerly 3%
Additionally, there remains a combined open pit and underground Inferred resource
Management
of 3.5Mt grading 2.96 g/t Au and 8.3 g/t Ag for 330K oz Au and 989K oz Ag. On Chris Stewart Preisdent, CEO & Director
October 2, 2017, Treasury Metals released positive results from its completed 4,360m Dennis Gibson CFO
condemnation and exploration drill program. Highlights include 11.37 g/t Au over Greg Ferron VP Corp. Development IR
Robert MacDonald VP Goliath Gold Project
4.2m, and 31.4 g/t over 3.0m. Mark Wheeler Director, Projects
Adam Larsen Senior Project Geologist
• Enough cash for the near-term. In May 2017, the Company completed an $8M Marc Henderson Chairman
offering at $0.65/unit (incl. one half warrant with a $0.95 strike for two years). As of Bill Fisher Director
July 1, the Company’s cash position stood at $5M. Doug Bache Director
Flora Wood Director
• Trades at a premium to peers. TML trades at US$39/oz compared to the mean and Christophe Vereecke Director
Blaise Yerly Director
median of its peers, which trade at US$30/oz and $21/oz, respectively. In our opinion,
TML’s premium is warranted given its later stage of development and its clear path to All figures in CAD unless otherwise stated.
production. Source: Company Reports, Thomson Reuters
Upcoming Catalysts Figure 15: Location of Goliath
• Feasibility Study work & permitting updates. On August 30, 2017, the Company
announced it begun Feasibility efforts at its Goliath gold project. Treasury Metals is
targeting a Q3/2018 release date.
• Ongoing drilling results. First results from Treasury's 15,000m infill program are
expected late October/early November. The Company is aiming to upgrade its Inferred
Resource to Indicated.
• Resource update. Drilling completed post-updated PEA is expected to be utilized in
a new resource update, anticipated for release by year-end.
Page 13 Source: Company PresentationEquity Research
Metals & Mining, Exploration | Canadian Small Cap
November 13, 2017
West Red Lake Gold Mines Inc.
Chris Thompson | Head of Research | Ubika Research
Chris@UbikaResearch.com | 1 (416) 574-0469
(CSE:RLG) Patrick Smith | Analyst | Ubika Research
Patrick@UbikaResearch.com | 1 (647) 444-5506
Making an Old Mine New Again Price Performance
$0.30 700
Company Description $0.25 600
Daily Volume (thousands)
500
West Red Lake Gold Mines Inc. (CSE:RLG; “West Red Lake”) is a developer advancing $0.20
400
its Red Lake project, comprising three former producing gold mines called Rowan, Mount $0.15
300
Jamie, and Red Summit, located 16km NW of Red Lake, Ontario and 25km west of the $0.10
200
Red Lake gold mine operated by Goldcorp. In the same area, Goldcorp’s Red Lake mine $0.05 100
produced 325K oz Au in 2016. $0.00
Oct-16 Dec-16 Feb-17 Apr-17 Jun-17 Aug-17 Oct-17
-
Investment Highlights Market Data (CSE.RLG)
• Exploration is continuing to ramp up. In 2016, the Company completed ~3x as Price (November 10, 2017 close) $0.09
52 Week Range $0.09 - $0.31
much drilling as the previous year, to 5,176m from 1,767m in 2015. West Red Lake Market Cap (M) $10.3
has already completed more than 5,500m to-date this year. Current Shares Outstanding (basic, M) 113.9
Current Shares Outstanding (fully diluted, M) 132.8
• Mineral Resource at Rowan a solid starting point. West Red Lake originally earned Free Float 66%
a 60% interest in the Rowan claims optioned from Goldcorp and now manages the Average Daily Volume (3 months) 69K
asset through a joint-venture agreement with Goldcorp. As of 2016, using US$1,150/ Current Cash (M) $0.5
oz Au, Rowan hosts an Inferred mineral resource of 4.5Mt grading 7.57 g/t Au for Total Debt (M) $0.0
Total Assets (M) $12.8
1.1M oz covering a 1.8km strike length drilled to a depth of ~300-350m. The deposit
Headquarters Toronto, Ont., Canada
at Rowan remains open at depth and along strike. The Company also intends to explore
the deposit, targeting high-grade zones, and in the future upgrade some of the existing Top Shareholders
Accilent Capital Management Inc. 30%
Inferred mineral resource to Indicated. The last set of results released from Rowan John Kontak 3%
were in April, as part of its 3,014m program completed in early 2017. Highlights from Tom Meredith 2%
this program include 72.6 g/t Au over 3.0m and 21.9 g/t Au over 1.0m. Management
Tom Meredith Execuative Chairman
• The Mount Jamie mine had positive results to-date. The 100%-owned Mount Jamie John Kontak President & Director
mine historically produced from a 770 ft deep shaft during the 1930s and is adjacent Ken Guy Exploration Manager
to the west of the Rowan mine. On August 31, 2017, as part of its 2,544m program Daniel Crandall Director
conducted between June and July, RLG released its last set of drill results, highlighted All figures in CAD unless otherwise stated.
by 26.2 g/t Au over 1.0m, 11.8 g/t Au over 1.5m, and 7.6 g/t Au over 3.0m. There is a Source: Company Reports, Thomson Reuters
3% NSR on the property (2% buyback – $1M for each 1%).
Figure 16: Red Lake Project Map
• Red Summit, the third option. The 100%-owned Red Summit mine consists of two
claims and was originally acquired from Claude Resources. It is subject to a 3% NSR
(1% buyback for $500K). There remain several known gold zones and a 575-foot
shaft, which was last in production during the 1930s, producing at an average grade
of 14.6 g/t Au.
• Trades at a discount. RLG trades at US$12/oz (attributable), a discount compared
to peers, which trade at a mean of US$30/oz and a median of US$21/oz. As RLG
continues to expand both Rowan and Mount Jamie, most importantly by outlining
further ounces at depth, this gap should close.
Upcoming Catalysts
• Drill results from Rowan. RLG's current program began the first week of November.
The Company plans to test further potential at its Rowan Mine Zones, as well as the
area of the Structural Intersection located ~1km east. RLG is planning to follow up
on the success of Hole RLG-17-45, which returned 72.6 g/t over 3.0m at the Rowan Source: Company Presentation
Mine Shaft.
Page 14Canadian and US Gold Developers
Figure 17: Full Competitor Table
November 10, 2017
Capitalization
#/oz
Canadian & US Gold Developers Shares rel. to Total Total Oz
Last (Basic) Market Cash Debt median Grade (Attrib.) EV/T. oz EV/Adj.
Ticker Company Name Price (M) Cap (M) EV (M) (M) (M) (M) (Au g/t) (M) (USD) oz (USD) Project Name Location
AZX.V Alexandria Minerals Corp $0.06 478.6 $28.7 $21.9 $6.8 $0.0 0.84 1.96 1.79 $10 $16 Cadillac Break Quebec/Ontario
ATV.V Alto Ventures Ltd $0.07 49.1 $3.2 $2.0 $1.2 $0.0 0.08 0.99 0.61 $3 $4 DAC & Destiny Quebec
AUG.TO Auryn Resources Inc $2.09 78.5 $164.0 $161.6 $2.5 $0.0 6.21 5.73 2.28 $56 $90 Committee Bay Nunavut Territory
BTR.V BonTerra Resources Inc $0.52 162.1 $84.3 $70.6 $13.7 $0.0 2.71 5.46 0.96 $58 $140 West Arena Quebec
CGM.V California Gold Mining Inc $0.50 40.2 $20.1 $19.9 $0.2 $0.0 0.76 1.59 0.88 $18 $30 Fremont California
ER.TO Eastmain Resources Inc $0.29 193.1 $56.0 $39.6 $16.4 $0.0 1.52 6.28 1.29 $24 $37 Clearwater Quebec
FPC.V Falco Resources Ltd $1.01 180.5 $182.3 $138.9 $53.4 $10.0 5.34 1.54 5.62 $20 $28 Horne Quebec
GIS.V Genesis Metals Corp $0.12 71.9 $8.3 $7.7 $0.6 $0.0 0.30 1.99 0.30 $21 $51 Chevrier Quebec
GSV.V Gold Standard Ventures Corp $2.01 233.5 $469.3 $415.7 $53.6 $0.0 15.97 0.80 3.59 $92 $185 Dark Star & Pinion Nevada
GGM.V Granada Gold Mine Inc $0.040 401.1 $16.0 $16.4 $0.5 $0.9 0.63 2.27 2.33 $6 $10 Granada Quebec
GTA.V GTA Resources and Mining Inc $0.035 42.5 $1.5 $1.4 $0.1 $0.0 0.05 0.90 0.62 $2 $4 Northshore Ontario
JDN.V Jayden Resources Inc $0.21 88.2 $18.5 $17.2 $1.3 $0.0 0.66 0.91 1.32 $10 $17 Silver Coin Arizona
MOZ.TO Marathon Gold Corp $1.05 140.8 $147.9 $139.4 $8.5 $0.0 5.36 2.02 2.15 $51 $82 Valentine Lake Newfoundland
MAE.V Maritime Resources Corp $0.10 68.9 $6.9 $6.4 $1.0 $0.5 0.25 6.94 1.09 $5 $8 Green Bay Newfoundland
MAY.TO Meadow Bay Gold Corp $0.08 99.2 $7.9 $7.8 $0.1 $0.0 0.30 1.07 1.12 $6 $9 Atlanta Nevada
ME.TO Moneta Porcupine Mines Inc $0.19 239.0 $45.4 $36.9 $8.5 $0.0 1.42 1.17 4.30 $7 $14 Golden Highway Ontario
NHK.TO Nighthawk Gold Corp $0.65 188.5 $122.6 $108.2 $14.3 $0.0 4.16 1.64 2.10 $41 $102 Colomac Yellowknife
ORX.V Orefinders Resources Inc $0.08 58.7 $4.7 $4.4 $0.3 $0.0 0.17 1.29 0.44 $8 $20 Mirado Ontario
OSK.TO Osisko Mining Inc $3.79 207.1 $784.8 $688.5 $96.3 $0.0 26.45 1.91 5.23 $104 $159 Windfall Lake Quebec
OOO.V Otis Gold Corp $0.27 162.4 $43.0 $42.6 $0.4 $0.0 1.64 0.53 0.98 $34 $59 Kilgore Idaho
PRB.V Probe Metals Inc $1.43 93.9 $134.2 $104.6 $29.6 $0.0 4.02 2.62 0.77 $107 $269 Val D'Or East Quebec
PGM.V Pure Gold Mining Inc $0.50 191.6 $95.8 $79.3 $16.5 $0.0 3.05 8.91 1.83 $34 $48 Madsen Ontario
RDS.V Ressources Minieres Radisson Inc$0.15 115.6 $17.3 $16.9 $0.4 $0.0 0.65 6.44 0.31 $43 $81 O'Brien Quebec
RPX.V Red Pine Exploration Inc $0.12 264.8 $31.8 $30.1 $1.6 $0.0 1.16 1.71 0.65 $37 $91 Wawa Ontario
RFR.CD Renforth Resources Inc $0.06 102.4 $5.6 $5.6 $0.0 $0.0 0.22 2.21 0.78 $6 $14 New Alger Quebec
RCG.V Resource Capital Gold Corp $0.12 145.1 $17.4 $27.8 $0.3 $10.7 1.07 9.51 0.79 $28 $58 Dufferin & Tangier Nova Scotia
RK.V Rockhaven Resources Ltd $0.16 152.1 $24.3 $19.7 $4.6 $0.0 0.76 4.48 1.36 $11 $29 Klaza Yukon
SGX.V Sage Gold Inc $0.19 80.1 $14.8 $18.0 $0.5 $3.6 0.69 4.78 0.32 $45 $73 Clavos Ontario
BUD.V Satori Resources Inc $0.10 28.2 $2.7 $2.3 $0.4 $0.0 0.09 6.09 0.28 $7 $9 Tartan Lake Manitoba
TML.TO Treasury Metals Inc $0.62 116.6 $72.3 $71.7 $5.0 $4.4 2.75 1.87 1.44 $39 $58 Goliath Ontario
TMI.TO Trimetals Mining Inc $0.19 293.2 $54.2 $53.4 $2.3 $1.5 2.05 0.54 1.19 $35 $46 Gold Springs Nevada/Utah
TIG.V Triumph Gold Corp $0.31 60.7 $18.5 $17.2 $1.3 $0.0 0.66 0.59 2.18 $6 $12 Freegold Mountain Yukon
RLG.CD West Red Lake Gold Mines Inc $0.09 113.9 $10.3 $9.8 $0.5 $0.0 0.37 7.57 0.65 $12 $30 West Red Lake Ontario
MEAN $30 $57
MEDIAN $21 $37
STANDARD DEVIATION $28 $59
Sample Size 33
Note: 1) #/oz rel. to median (M) is how many implied total ounces relative to the stock price and the median
2) EV/Adj oz is adjusted for 90% for Measured, 75% for Indicated, and 40% for Inferred
3) All prices are in CAD unless otherwise noted - US prices are calculated at an exchange of 0.79/CAD
Page 15 4) Shares, cash and debt are last reportedGold Investor Pro
November 13, 2017
Important Disclosure
Smallcappower.com is owned and operated by Ubika Corporation whose divisions include Ubika Research and Ubika Communications. Ubika Corp. is a wholly
owned subsidiary of Gravitas Financial Inc. The following terms and conditions (“Terms of Use”) govern the use of this website (“site”) www.SmallCapPower.com.
By accessing this site, you agree to comply with and be legally bound by the Terms of Use as set out herein. Ubika reserves the right to seek all remedies available
at law and in equity for violations of these Terms of Use, including the right to block access from a particular internet address to our site.
Disclaimer
Ubika Corporation and its affiliates or partners will seek to provide services to companies mentioned on the smallcappower.com website. Hence, all information
available on smallcappower.com should be considered as commercial advertisement and not an endorsement, offer or recommendation to buy or sell securities.
Ubika Corporation and its related companies (including its directors, employees and representatives) or a connected person may have ownership/stock positions in,
or options on the securities detailed in this report, and may buy, sell or offer to purchase or sell such securities from time to time.
Ubika and/or its affiliates and/or their respective officers, directors or employees may from time to time acquire, hold or sell securities and/or commodities and/
or commodity futures contracts in certain underlying companies mentioned in this site and which may also be clients of Ubika’s affiliates. In such instances, Ubika
and/or its affiliates and/or their respective officers, directors or employees will use all reasonable efforts to avoid engaging in activities that would lead to conflicts
of interest and Ubika and/or its affiliates will use all reasonable efforts to comply with conflicts of interest disclosures and regulations to minimize the conflict.
Specifically all companies mentioned or listed as “Analyst Covered Companies” at smallcappower.com and which are shown under the heading “Analyst Covered
Companies” on the page: http://www.smallcappower.com/companies have entered into a commercial relationship with Ubika Corporation or our affiliates for
capital market services and have paid fees and/or shares or stock options or warrants for being featured and mentioned in smallcappower.com. Hence these
“Analyst Covered Companies” at smallcappower.com are shown at the website as an advertisement only and any mention of these companies does not and will
not constitute an offer to buy or sell securities in the featured companies. Ubika Corporation, its affiliates or partners will seek to provide services to companies
mentioned in smallcappower.com website. Hence, all information available on smallcappower.com should be considered as commercial advertisement and not an
endorsement, offer or recommendation to buy or sell securities.
Ubika Corporation and its divisions Ubika Communication and Ubika Research (collectively, “Ubika”) are not registered with any financial or securities regulatory
authority in Ontario or Canada, and do not provide nor claims to provide investment advice or recommendations to any visitor of this site or readers of any content
on this site.
The information on this site is for informational purposes only. This site, including the data, information, research reports, press releases, findings, comments,
views and opinions of Ubika’s analysts, columnists, speakers or commentators, and other contents contained in it, is not intended to be: investment, tax, banking,
accounting, legal, financial or other professional or expert advice of Ubika or its affiliates, or a recommendation, solicitation or offer by Ubika or its affiliates to
buy or sell any securities, futures, options or other financial instruments, and such information should not be relied upon for such advice. Every user of this site is
advised to seek professional advice before acting or omitting to act on any information contained in the site.
Research reports and newsletters have been prepared without reference to any particular user’s investment requirements or financial situation. Where reference
is made to estimate of value or relative value of a specific company, there is no guarantee that these estimates are reliable or will materialize. Readers of these
reports and newsletters are advised to conduct their own due diligence before making any investment decisions. Ubika does not make independent investigation
or inquiry as to the accuracy and completeness of any information provided by the Analyst Covered companies. Although the content has been obtained from
sources believed to be reliable, this website could include technical or other inaccuracies or typographical errors and it is provided to you on an “as is” basis
without warranties or representations of any kind. Ubika and its affiliates make no representation and disclaim all express and implied warranties and conditions
of any kind, including without limitation, representations, warranties or conditions regarding accuracy, timeliness, completeness, non-infringement, satisfactory
quality, merchantability, merchantable quality or fitness for any particular purpose or those arising by law, statute, usage of trade, or course of dealing. Ubika and
its affiliates assume no responsibility to you or any third party for the consequences of any errors or omissions.
Information in this site is subject to change without notice. Ubika assumes no liability for any inaccurate, delayed or incomplete information, nor for any actions
taken in reliance thereon.
Ubika, its affiliates and their respective directors, officers, employees, or agents expressly disclaim any liability for losses or damages, whether direct, indirect,
special, or consequential, or other consequences, howsoever caused, arising out of any use or reproduction of this site or any decision made or action taken in
reliance upon the content of this site, whether authorized or not. By accessing this site, each user of this site releases Ubika, its affiliates and their respective
officers, directors, agents and employees from all claims and proceedings for such losses, damages or consequences.
Ubika and its affiliates do not endorse or recommend any securities issued by any companies identified on, or linked through, this site. Please seek professional
advice to evaluate specific securities or other content on this site. Links, if any, to third party sites are for informational purposes only and not for trading purposes.
Ubika and its affiliates have not prepared, reviewed or updated any content on third party sites and assume no responsibility for the information posted on them.
Ubika and/or its affiliates and/or their respective officers, directors or employees may from time to time acquire, hold or sell securities and/or commodities and/or
commodity futures contracts mentioned in this site.
This site may include forward-looking statements about objectives, strategies and expected financial results of companies featured in this site or where research
reports are available on companies displayed and/or featured on this site. Such forward-looking statements are inherently subject to uncertainties beyond
the control of such companies. The users of this site are cautioned that the company’s actual performance could differ materially from such forward-looking
statements.
World Wide Web sites accessed by hypertext links (“hyperlinks”) appearing in this site have been independently developed by parties other than Ubika and Ubika
has no control over information in any hyperlinked site. Ubika is providing hyperlinks to users of this site only as a convenience. Ubika makes no representation and
is not responsible for the quality, content or reliability of any information in any hyperlinked site. The inclusion of any hyperlink in this site should not be construed
as an endorsement by Ubika of the information in such hyperlinked site and does not imply that Ubika has investigated, verified or monitored the information in
any such hyperlinked site. Should you wish to inquire about creating a link from your World Wide Web site to this site, contact SCP marketing via e-mail at: info@
smallcappower.com. for written authorization.
See our full disclaimer here.
Page 4 Get Additional Ubika Research Reports on SmallCapPower.comYou can also read