Sheela Foam Ltd Initiating Coverage - Axis Direct
←
→
Page content transcription
If your browser does not render page correctly, please read the page content below
Initiating Coverage

Sheela Foam Ltd
18 SEP 2018 Company Report
BUY
Target Price: Rs. 2,039
CMP : Rs 1,650
Potential Upside : 24%
MARKET DATA
No. of Shares : 4.88 Cr.
Market Cap : Rs. 8,049 Cr.
Sheela Foam Ltd
Free float : 14%
Avg. daily vol (6mth) : 17588
52-w High / Low : 1850/1275
Bloomberg : SFL:IN
Polyurethane Foam and Mattresses
Promoter holding : 85.68%
FII / DII : 11.05%
Price performance
140
120
100
80
Sep-17 Jan-18 May-18 Sep-18
Sensex Sheela Foam
Financial Summary Shareholding pattern
Y/E Sales EBITDA PAT EPS Change RoCE Jun-18 Mar-18
P/E (x) RoE (%) EV/EBITDA
March (Rs Cr) (Rs Cr) (Rs Cr) (Rs) (%) (%)
FY16 Promoter & Promoter group 85.7% 85.7%
1,696 176 105 32.2 145.4 - 35.9 42.1 -
MFs/UTI 9.0% 8.9%
FY1 7 1,912 195 125 25.6 (20.5) - 31.1 39.0 - FPI 2.5% 2.6%
FY18 2,004 216 134 27.4 7.1 - 25.2 33.2 - Public 2.8% 2.9%
FY19E 2,202 285 180 36.8 34.3 44.8 26.1 35.0 27.4 Others 0.0% 0.0%
FY20E 2,478 387 249 51.0 38.5 32.4 27.6 37.7 19.7 Banks/FIs 0.0% 0.0%
Source: Company, Axis Securities; CMP as on 18 SEP 2018
Kumar Nihal - Manager | kumar.nihal@axissecurities.in | (+91 22 4267 1747) 2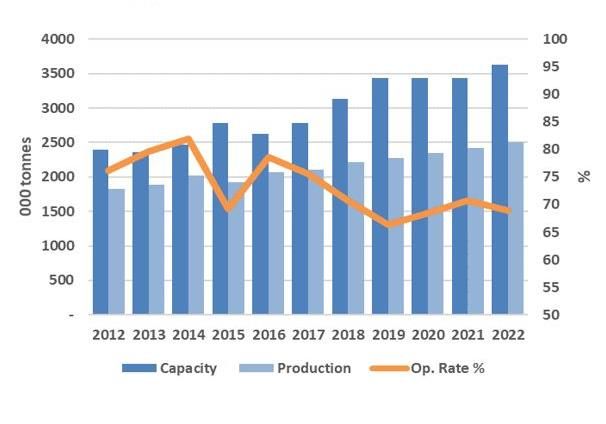
18 SEP 2018 Sheela Foam
Sector: Home Improvement
Investment Rationale
Incorporated in 1971, Sheela Foam Ltd. (SFL) is India’s largest Polyurethane foam (PU) manufacturer. They are also
amongst the leaders in mattress market and sell under the flagship brand of ‘SLEEPWELL’. The Company manufactures
other foam-based home comfort products focusing primarily at Indian retail consumers, as well as technical grades of
polyurethane (PU) foam for end use in a range of industries. It has 10 manufacturing units Pan India and 5 units in
Australia. 85% of the revenue comes from Indian operation whereas 15% is contributed by Australian subsidiary. It has
extensive distribution network with more than 6360 exclusive distributor, retail dealers and multi-brand outlets
cumulatively.
Sheela Foam is expected to be big beneficiary of the shift in taste following urbanization and changing lifestyle. Being
one of the top 3 players, SFL would be riding the growth wave due to shift from unorganized to organized segment,
product innovation and under penetration. We estimate revenue to grow at CAGR of 11% over FY18-FY20E and PAT to
grow at CAGR of 36% over FY18-FY20E driven by:
Strong brand awareness among the consumers giving the company competitive edge over its peers
Pan India distribution network along with manufacturing plants situated in proximity to market
Product expansion, introduction of low price products with sub-brands and utilizing the knowhow to produce higher margin
products
New plant setup and investment in existing plants to be supported by strong cash flow position
Expected fall in price of major raw material TDI to further increase the EBITDA margin from existing 10-11%
We initiate coverage with “BUY” rating with a target price of Rs 2,039 i.e 24% upside (implies 40x FY20E)
3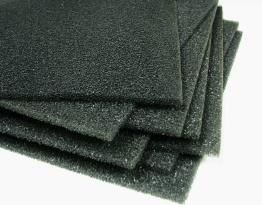
18 SEP 2018    Sheela Foam

                                                                                         Sector: Home Improvement
Investment Rationale

Growing industry
- The Rs 10,000 Crore mattress industry is growing at 11% CAGR and a shift from unorganized to organized market in
  mattress industry would provide opportunities for Sheela Foam to grow. Population growth, nuclearisation, increase in
  disposable income, urbanization as well as growth in end user industry (household, hospitality and hospital) would be
  the factors driving mattress sales growth.

Brand recognition
- Mattress and Home comfort products of Sheela Foam sells under the flagship brand SLEEPWELL which is well recognized
  by the consumer. The Company is looking forward to consolidate customer recall of various customized product sub-
  brands such as My Mattress and Perfect Match. This will result in increase in customer and revenue.

Pan India distribution network

- Sheela Foam has a wide distribution network of more than 110 exclusive distributors, 3,350 plus exclusive retail dealers
  and upwards of 3,250 multi-brand outlets. The company targets to have more than 4000 Exclusive brand outlets (EBO)
  by FY20. During Q1FY19 company added 685 EBO’s.

Proximity to market
- Sheela Foam has pan India manufacturing facility to enable it save on freight cost as its product is voluminous in nature
  and freight cost eats into profits beyond certain radius. SFL has 10 manufacturing plants are well spread across the
  country with 1 plant in west, 2 in east, 5 in north and 2 in South. This enables the company to service the markets better.
  The company enjoys higher sales compared to peer because of manufacturing plants in proximity to market.

                                                                                                                          4
18 SEP 2018    Sheela Foam

                                                                                 Sector: Home Improvement
Investment Rationale

Product portfolio

- Sheela Foam introduced economy model mattress “Starlite” and Mid Level Mattress “Feather Foam” in July
  2017 and Feb. 2018 respectively. The Company intends to leverage the existing range of products, the
  knowhow and manufacturing capabilities to produce niche and higher-margin products, including more
  sophisticated grades of technical PU foam. They are also planning to create baseline products at lower price
  points, targeting the rural customer. On the furniture side of the business, the Company has tied up with
  carpenters & upholsters under “Anmol Bandhan Scheme”.

Raw material cost
- The overall foam based industry has been facing stress because of rising price of one of the important raw
  material i.e. TDI in foam production. Sheela Foam has performed well during these stressed period with 10-11%
  EBITDA Margin. With TDI supply getting back on track, TDI prices have eased from Rs 310/Kg in June’18 to Rs
  250/Kg in August’18. Demand and supply is discussed on page 13. While some of the benefits would be
  passed on to customers, branded mattresses would gain margins owing to SFL’s pricing power.

Focus on R&D

- Sheela foam has been able to continuously increase foam yield. The foam produced from Vertical Variable
  Pressure Foaming plant is used for quilting to provide extra comfort, to all kinds of Sleepwell Mattresses. This
  Award winning technology has proved to be a game changer for quilting comfort for Sheela Foam.

                                                                                                               5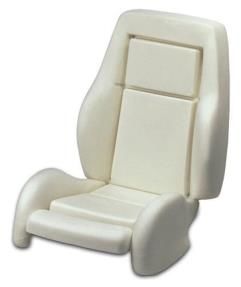
18 SEP 2018 Sheela Foam
Sector: Home Improvement
Mattress Industry
Major Types of Mattress
Cotton Mattress which is roughly estimated
to be used by 70% of the population is
considered as an alternative to mattress
and has not been accounted in the
Rubberised Coir PU Foam Spring Mattress Industry
Market Classification
The Size of Indian Non-Cotton mattress market at
present is ~ Rs 10,000Cr comprising
20% Polyurethane(PU) foam, Rubberized coir and Spring
30% 65%
35% 50% mattresses
70% 30% Around Rs 6500 Cr of total mattress market belongs
to unorganized sector and Rs 3500 Cr is organized
PU foam mattresses dominated the overall organized
Organised Unorganised Foam Coir Spring market capturing 50% share followed by coir and
Cotton Mattress Non Cotton Mattress
spring mattresses constituting 30% and 20% share
Source: Company, Axis Securities respectively
PU Foam mattress is growing fast with consumer understanding the need for comfortable sleep & is replacing coir mattress with the Foam mattress
6
18 SEP 2018 Sheela Foam
Sector: Home Improvement
Mattress Market
Mattress Market Growth Growth : Organized Sector to capture share in growth
13,000- 14,000 Cr The non-cotton mattress market is estimated to reach the
150
market size of Rs 13000-14000 Cr by 2021 growing at a
CAGR of 8-10%
10,000 Cr
100
12-14%
Organized sector would gain market share from 35% at
6,250 Cr
50
9-11% present to 40% in FY21E, growing at a CAGR of 11-13%
6-8%
7-9% Unorganized sector which accounts for 65% of the market
0 would loose its share and grow at CAGR 6-8%
2011-12 2015-16 2017-2018E 2020-21E
Implementation of GST narrowed down the pricing gap
Unorganised Organised enabling organized player to capture the share of
unorganized market
Distribution Channels Distribution Channel: Dependence on Distributor and Retailers
2%
Based on distribution channel, the mattress market is
dominated by distributor/dealer network followed by
10% own/franchisee stores and online mode accounting for
nearly 88%, 10% and around 2% of the total sales
respectively
88% Organized players have started online sales by way of
partnerships with online portals and also by establishing
their own websites
Distributors/Dealers Owned/Franchise Online
Owing to demographic factors such as rising youth
population and rising standard of living, the demand for
Source: Company, Axis Securities mattress from e-commerce portals is expected to increase
7
18 SEP 2018    Sheela Foam

                                                                                                 Sector: Home Improvement
 Mattress Industry: Growth Prospects

                                   Population growth and nuclearisation of families
                                   Population of India is expected to be at 138 cr by CY20 which will increase the consumption.
                                   The new India is slowly shifting towards nuclearisation of families due to job prospects,
                                   standard of living and urbanization which will drive the demand for mattress

                                   Urbanization and increase in disposable income
                                   About 34% of India's population is now urbanized ( 3% increase since the 2011 Census) and
                                   would reach 36% by CY20. This is likely to shift the consumer preference from cotton mattress
                                   to the non-cotton mattress. Rural income level and disposable income is also on the rise which
                                   is envisaged to increase the affordability thereby leading to rise in consumption of lifestyle
                                   products

                                   Increase in awareness
                                   As people are becoming more health conscious and aspiring luxury lifestyle, there is an
                                   evident rise in the awareness of the relation between good sleep and a good quality mattress
                                   especially among the youth. Urban consumers are moving towards quality mattress as a
                                   measure to compensate for the increasing stress

Source: Company, Axis Securities

                                                                                                                               8
18 SEP 2018 Sheela Foam
Sector: Home Improvement
Mattress Industry: Growth Prospects
Growth in End User Industry
Housing Segment Hospitality segment Healthcare segment
18 lakh houses to be built across Premium hotel rooms inventory to Bed density in the hospitals of India is
top 10 cities significantly increase by 28% to lower than its peer developing
reach 66,400 rooms by FY20 countries
11 lakh units (approx.) are
expected to be ready for possession Leisure destinations supply is Potential exists for mattress sales as
by CY18 envisaged to increase from 14,200 the current density of 1.3 beds (per
rooms in FY16 to 17,300 rooms by 1000 people) gets rectified to 3.5
Housing growth represents a
FY20 beds defined by WHO
significant potential demand for the
mattress industry Growth in the Indian hospitability Govt. to establish 1.5 lakh Health
sector is expected to affect mattress and Wellness Centers over next 5-10
sales years
The hospitality sector in India is expected to grow at 16% CAGR to reach at Rs 28 lakh crore by 2022.
This portends tremendous growth potential for mattress industry
Source: Company, Axis Securities
918 SEP 2018 Sheela Foam
Sector: Home Improvement
Mattress Industry: Growth Prospects
Potential for Non-Cotton Mattress to replace Cotton Mattress
Economy segment at presents account for 25% of Non-cotton mattress Cotton mattress estimated price chart*
5% Single Bed Double Bed
20% 25% Quantity
Price 10Kg/5M 15Kg/5M 20Kg/8M 30Kg/8M
per unit used
Rs90#/Rs80* 2500 2950 3640 4540
50%
Rs100/Rs100 2700 3200 4200 5000
Rs110/Rs120 2900 3450 4360 5460
Economy (up to Rs 8,000) Mid-segment (Rs 8,000-30,000)
Rs120/Rs150 3150 3750 4800 6000
Premium (Rs 30,000-75,000) Luxury (Above Rs 75,000)
#Cotton price per Kg/ * Cloth price per meter
Note: Inclusive of average labor cost of Rs 1200 per mattress (Mumbai)
‘Economy model’ Non-cotton mattress to take away cotton mattress market share
Economy model Non cotton mattress are available at Rs 2,500 onwards giving competition to Cotton mattresses
Infrastructure development would increase the market penetration for Non-cotton mattress which are more durable
Health awareness and Rural development would be driving consumer towards Non-cotton mattress
Non-Cotton stuffed mattresses do not develop clots or de-shape after a certain period thus relaxing the spine
The share of Non-cotton economy model mattress would significantly increase as price differentiation with cotton mattresses is reducing
Source: Company, Axis Securities
1018 SEP 2018 Sheela Foam
Sector: Home Improvement
Polyurehane Foam Industry
Key Application
Mattresses, Furniture, Carpet, Underlay,
Slabstock Bedding, Acoustic, Insulation,
Garments & Footwear, Automotive
Flexible Foam
Moulded Automotive Seating
Polyurethane
Foam
Refrigeration, Industrial insulations,
Rigid Foam Furniture
Global PU foam market is expected to reach USD 25.1bn in 2020 from USD 17.3bn in 2015 growing at 7.8% CAGR. Asia
Pacific is the dominant market, with China being the leading manufacturer and consumer of PU foam. Increasing demand from
bedding & furniture industry owing to rising urban population in emerging economies of Asia Pacific such as China, India, and
Indonesia is anticipated to drive growth over the forecasted period
The Indian flexible PU Foam industry is significantly unorganized; market is dominated by small and medium scale manufacturers
in every region, mainly owing to transporting issues
The Indian flexible PU foam industry is estimated at Rs 6500 Cr. The flexible PU foam is manufactured as Slabstock Foam and
Moulded Foam. Major part of the PU foam market is dominated by Slabstock foam (around 65-70%). Flexible Slabstock foam
mainly finds application in mattress and furniture, whereas Moulded Foam is mostly used in automotive Industry
1118 SEP 2018 Sheela Foam
Sector: Home Improvement
PU Foam making process
RM (Polyol, TDI, Foaming
Block Storage
Catalyst) Process
Reticulation
Peeling Cutting/Shaping/Sizing
Coating
Spring
Manufacturing
Lamination
Form cores
Technical Used in Pillows, Quilting, Coverage
Furniture for Mattress
Uses like Lingerie, Bolsters, Sofa & Tape Edging
Cushioning Furniture
cum bed etc.
Sound Shoes, Cushion etc.
Absorption, Automotive,
Filter Helmets
Mattress of Form,
Spring & Coir
Dispatch
Source: Company, Axis Securities
1218 SEP 2018 Sheela Foam
Sector: Home Improvement
Raw Material - TDI
Toluene di-isocyanate (TDI) is a major raw material used in the production of Foam. Price of TDI is highly volatile
and price movement depends on demand-supply gap.
Global Supply: 3.1 MT (FY18) operating at 70-75% Global2700
Demand : 2.3 MT (FY18)
2600
2500
000 tonnes
2400
2300
2200
2100
2000
2016 2017 2018 2019 2020
Source: Axis Securities, ICIS Source: Axis Securities
Reasons for TDI price rise during 2016-2018 Additional supply to ensure lower TDI price
While Global capacity is around 3 MT, operating rate is Global TDI player BASF re-started 300,000 tonne/year
around 70-75% causing tightness in market capacity from Q2FY19
Hazardous nature of TDI results in frequent shutdown of 200,000 tonnes/year Sadara facility in Saudi Arabia is
plants in case of leakages also to be operational soon
Low operating rate created supply pressure and price Expected demand of 2.6 MT by 2021 would be
rose during 2016-2018 comfortably supplied by expected capacity of 3.6 MT even
at 70% operating rate
Source: Company, Axis Securities
1318 SEP 2018 Sheela Foam
Sector: Home Improvement
Raw Material - TDI
Average monthly TDI price
350 325
312
300 300 298 298 300 305 295
300 275 275 275 275
260 258 265
250 250 243
235 238 232 240
Rs per Kg
250
200 166
154 163 158
144
150 125
100
Aug'16
Oct'16
Nov'16
Aug'17
Aug'18
Oct'18
Nov'18
Jun'16
Jan'17
Oct'17
Nov'17
Mar'17
Jun'17
Jan'18
Mar'18
Jun'18
Apr'16
May'16
Dec'16
Dec'18
Jul'16
Feb'17
Apr'17
May'17
Dec'17
Jul'17
Feb'18
Apr'18
May'18
Jul'18
Sep'16
Sep'17
Sep'18
Source: Company, Axis Securities
During April’16 and June’18, a series of shutdowns and force majeure added to the supply tightness causing prices to soar. TDI
price rose sharply from Rs118/Kg on April 1, 2016 to Rs 300/Kg on April 1, 2018
TDI price saw its peak in February 2018 when it reached to the level of Rs 335/Kg due to multiple plants being shutdown for
different period during years mentioned above
From June’18, prices have started to fall in anticipation of Northeast Asian plants to restart from their shutdowns. TDI price stands
at Rs 255/Kg as on 24th July 2018
Toluene di-isocyanate (TDI) prices globally are likely to fall further as the market moves from a sustained period of tightness into
overcapacity. The company management expects TDI to be around Rs 240 by the end of 2018
Source: Company, Axis Securities
1418 SEP 2018 Sheela Foam
Sector: Home Improvement
Sheela Foam
Introduction Shareholding pattern
MFs/UTI,
Established in 1971, Sheela Foam Limited manufactures 9.0%
mattresses, other foam-based home comfort products and
FPI, 2.5%
technical grades of PU Foam: Promoter and
Promoter Public, 2.8%
Its home comfort line consists of products, such as group, 85.7%
furniture-cushioning, cushions and sofa-cum-beds, as
well as PU Foam
Its mattress line, offered under its ‘Sleepwell’ brand,
includes pure foam mattresses, as well as hybrids of
spring and coir Manufacturing Plants
Its furniture-cushioning line, offered under ‘Sleepwell’
SFL has 10 plants in India for foam production out of which
and ‘Feather Foam’ brands, consists of PU Foam that
constitutes upholstery material of various densities it manufactures foam in 5 plant for a total of 1,23,000
tonne p.a. capacity. SFL also has annual foam production
Sheela Foam has a strong presence in Australia through
capacity of 10,500 tonnes in Australia.
its wholly owned subsidiary, Joyce Foam Pty Ltd and
Location Capacity (Tonne)
manufactures PU foam.
Greater Noida (U.P.) 60,000
Distribution network Hyderabad (Telangana) 13,000
Erode (Tamil Nadu) 16,000
Strong retail presence with 110+ exclusive Distributors,
Talwada (Gujarat) 28,000
3,350+ exclusive retail dealers and 3,500+ multi-brand
Jalpaiguri (West Bengal) 6,000
outlets. SFL targets to have 4,000+ exclusive outlet by FY20 Total 123,000
Source: Company, Axis Securities
1518 SEP 2018 Sheela Foam
Sector: Home Improvement
Sheela Foam - Experienced Management Team
Mrs. Sheela Gautam Dr. Mahesh N. Gopalasamudram
- She is an avid entrepreneur, renowned social worker & - COO, is a bachelor of Science from Sri Sathya Institute of
philanthropist. She founded Sheela Foam in 1971 and has been Higher Learning, Master of Science (Chemistry) from University
actively involved in growing the organization of Madras and a PhD in Chemistry from University of Madras.
He has more than 15 years of experience in chemical industry
Mr. Rahul Gautam
Mr. Dhruv Mathur
- Managing Director, Chemical Engineer from IIT, Kanpur with
Masters Degree in Chemical Engineering from Polytechnic - CFO, a fellow member of Institute of Chartered Accountants of
Institute of New York, USA and 40+ years of experience in India and Institute of Cost Accountants of India. He has more
home comfort products than 36 years of experience in various industries
Mrs. Namita Gautam
Mr. Rakesh Chahar
- Executive Director, a professionally qualified and experienced
Human Resource Specialist with extensive knowledge and skills - Director- Sales and Marketing, has more than 20 years of
in Training and Development, Project Management, Media and experience in designing and marketing of P.U. Foam products
Communication
Mr. Tushar Gautam Mr. Frank Van Gogh
- Executive Director, a bachelor of Industrial Management and - CEO, Joyce Foam, is a bachelor of Mechanical Engineering
Industrial Engineering from Purdue University, USA. He have from University of New South Wales, Master of Business
14+ years of experience in heading production and research Administration from University of Technology, Sydney
and development
Source: Company, Axis Securities
1618 SEP 2018 Sheela Foam
Sector: Home Improvement
Diversified revenues segments
Mattress & Home Comfort Revenue Breakup (FY18)
Mattress Segment accounted for 41% of revenue in FY18
Sheela Foam have highest share in Premium & Mid
Segment 19%
84% 41%
Sheela Foam has introduced two models Starlite(Aug 16%
20%
2017) and Feather foam(Feb 2018) to take on
unorganized market of foam and spring mattress 18%
Economy model would drive the volume by 5% whereas
push for ultra premium products will increase realization Mattress Furniture Foam
Indian Subsidiary
by 3-4% Technical foam Foam Core
Technical Foam Furniture Foam
The Company has increased sale of Technical Foam by Furniture market has also been unorganized so far
increasing its customer base Sleepwell is associating with carpenters to influence its
The Company has been able to develop different kinds foam sales for Furniture cushioning and partners with
of high quality technical foams through constant smaller furniture manufacturers
Research & Development The market is expected to expand at a CAGR of 13%
Demand driver would be end user industry which are during the forecast period of 2016-2023
Automotive Industries, Sound Industry, Garment & Shoe Furniture Segment for the company is expected to grow at
industry 18-20%
Being a leading foam supplier, Sheela Foam would be ultimate beneficiary of highly growing furniture market
Source: Company, Axis Securities
1718 SEP 2018 Sheela Foam
Sector: Home Improvement
Subsidiaries’ performance expected to improve in near future
Foam Core
Foam Core is the Unbranded Foam of Sheela Foam that is sold to local manufactures who further repackage it and sell as
finished mattress product
This provides company the opportunity to capture a substantial unorganized market
With consumer awareness of using foam mattress as compared to traditional one, this segment will also attract good demand in
future
Joyce Foam Subsidiaries Performance *
320 16
Joyce Foam is a leading manufacturer of flexible
polyurethane foam with more than 35% market share in 310 14
Australia 300 12
290 10
(In Rs Cr)
(In Rs Cr)
Supplies its high quality Foam to Global Mattresses and 280 8
Furnishing Companies 270 6
260 4
Joyce recorded a turnover of 63.28 Million Australian 250 2
Dollars (AUD) in FY 2017-18, recording a growth of
240 0
more than 2% FY13 FY14 FY15 FY16 FY17 FY18
Margins contracted in FY18 as TDI price were constantly Net Sales (LHS) PAT (RHS)
rising, with expected fall in TDI price Joyce bottom line is
likely to improve in near future Note: Figures are arrived by subtracting standalone numbers from consolidated
Export operations would be leveraged to sell higher volumes of technical foam to manufacturers in SAARC nations
Source: Company, Axis Securities
1818 SEP 2018 Sheela Foam
Sector: Home Improvement
Strong Brand Recognition
The brand Sleepwell was launched in1993. Sleepwell has consistently built its brand over these year and has a strong
brand recall. It is associated with comfortable sleep and is expected to reap its benefit when consumers are realizing the
importance of quality mattress required for better sleep and health
Sleepwell branded mattresses enjoy ~20-23% share in the organized Indian mattress market as of FY16
The other winning brands of Sheela Foam are: Feather
Foam, a pure PU Foam and Lamiflex, a superior quality
Polyester foam for lamination. These are ranked as largest
selling PU foam in the country.
It has launched Sleepwell Perfect match: An initiative
whereby mattresses are suggested that are best suited to
an individual’s body structure, weight and pressure
distribution, based on diagnostic and statistical sleep
Advertisement Expense (Cr) measurements recorded on a senso-bed.
80 5% Sheela Foam is changing the dynamics of Industry, where
60 4% mattress were mainly pushed by dealers it is now driven
3% by consumer demand because of strong brand built by
40
2% the company.
20 1%
0 0% Company plans to further invest in advertisement to
FY12 FY13 FY14 FY15 FY16 FY17 FY18 increase footfalls in its outlets and be ahead in
Advertisement Expense (Cr) (LHS) As % of Sales (RHS) brand recognition in the competitive market
Source: Company, Axis Securities
1918 SEP 2018 Sheela Foam
Sector: Home Improvement
Innovation through R&D
Radio frequency identification (“RFID”)
chips Tracks Unauthorized sales
Breathable visco-elastic SANtech
(Memory foam) Maintains improved air-
Reduces stress, ensures flow, thereby enhancing
correct sleep posture and the firmness and
improves blood circulation; durability of the
Also induces faster recovery R&D upholstery material
of the mattresses to original
shape
Health Fresh
Zero Turn prevents the breeding of dust
Ensures that mattresses mites, bacteria and fungi
do not require periodic which helps avoid
turning to avoid sagging respiratory problems and is
a boon to asthmatics
The Company has launched Comfort Cell technology to raise the comfort quotient of the consumer
The foam produced from Vertical Variable Pressure Foaming plant is used for quilting to provide extra comfort, to all kinds
of Sleepwell Mattresses. This Award winning technology has proved to be a game changer for quilting Comfort
Source: Company, Axis Securities
2018 SEP 2018 Sheela Foam
Sector: Home Improvement
Distribution Network
Prominent retail presence
Sheela Foam has been associated with most of its distributors for over 20 years
110+
Exclusive distributors are in strategic proximity to the manufacturing facilities, which
Exclusive distributors
helps reduce carriage expenses and minimizes product damage
3350+ The distribution network is well integrated with the Company’s IT platforms, that
Exclusive retail dealers enables tracking secondary sales made by distributors and dealers in real time
Around 150 sales personnel are actively engaged with key distributors
3500+ As against 1101 EBO (Exclusive Branded Outlets) in 2012, Sheela Foam have
Multi Brand outlet
3,558 EBO as on August 2018 and planned to reach 4000+ by March 2020
Exclusive Sleepwell brand outlets
Sleepwell Shoppes Sleepwell Galleries Sleepwell World
Average Size 200 Sq. Ft /1159 Outlets Average Size 600 Sq. Ft/535 Outlets Average Size1000 Sq. Ft/321 Outlets
Source: Company, Axis Securities
2118 SEP 2018 Sheela Foam
Sector: Home Improvement
Manufacturing in Proximity to Market
India: 10 Plants Australia: 5 Plants
Rajpura Kala Amb
Greater Noida
Surajpur
Sahibabad Jalpaiguri
Silvassa
Talwada Perth
Adelaide Sydney
Hyderabad
Canberra
Melbourne
PU Foam manufacturing and Processing
Erode
PU Foam processing
The plants are situated in close proximity to market which Joyce Foam, Australia - Joyce foam, Australia is a 100%
enables fast and better serviceability to customers. subsidiary of the Sheela Group.
Company targets plants to be situated within radius of
300-400 km to ensure low freight cost and SFL is Joyce Foam is a leading manufacturer of flexible
planning to install 2 new plants by FY20 in the location polyurethane foam with more than 35% market share in
such as Indore, Raipur, Rohtak, which are growing as Australia
new market
Manufacturing capacity of Joyce Foams stands at 10,500
Total capacity of 123,000 tonne/year is sufficient to meet tonne/year
any spike in additional demand from the respective
region
Proximity to market is one of the competitive edge for Sheela Foam due to the nature of product. Sheela Foam’s strategy to penetrate the
market further includes both organic as well as inorganic growth prospects
Source: Company, Axis Securities
2218 SEP 2018 Sheela Foam
Sector: Home Improvement
Product Portfolio
Furniture-cushioning Bolsters,
Mattresses Pillows Sofa-cum beds
material cushions and other
Home comfort products
My Mattress, Spring range,
Technology range, Back support
Sleepwell Resitec, Sleepwell Fibre range, Flexi PUF Comfort range Sofa and Bed
range, Flexi PUF range,
Cool Gel, Primo, Feather Foam range, Premium range accessories
Showroom range, Economy
Range
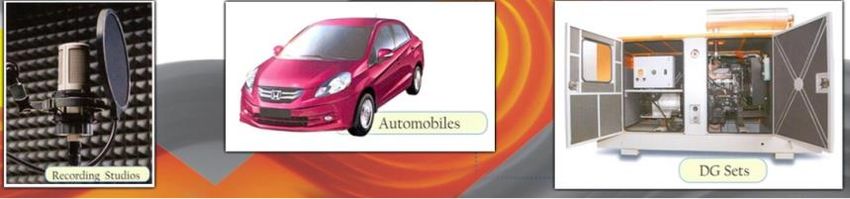
Automotive foams Reticulated foam Ultra Violet Stable foam Silentech foam
Technical foam products
Filtration systems, Ceramic Sportswear, Innerwear and
Seat covers, Sound absorption Automotive, Diesel generator canopies, Theatres, auditoriums,
foam filters, Outdoor furniture, lingerie, Clothing,
systems, Sun visors, Headliners, indoor stadiums, Broadcasting rooms and recording studios,
Microphones and headphones, Swimwear, Comfort
Door trims, Lamination systems Industrial silencers, Acoustic enclosures, Engine testing rooms
Safety fuel tanks, Ink cartridges accessories for shoes
Sheela Foam is leveraging the existing suite of products and manufacturing capabilities to produce niche,
more sophisticated and higher-margin products
Source: Company, Axis Securities
2318 SEP 2018 Sheela Foam
Sector: Home Improvement
Strategic Direction Ahead
1 Continued brand development
2 Focus on personalized products
3 Expansion of product portfolio
Expansion of distribution network and
4 export sales
5 Adoption of advanced production technology
2418 SEP 2018 Sheela Foam
Sector: Home Improvement
Correcting TDI prices to help improve margins
TDI price hiked during 2016-18
325
350 300 300 298 298 312 300 305 295
300 275 275 275 275 265
260 250 258
235 238 250 243 232
250
200 163 158 166
144 154
150 125
100
Jun'16
Jun'17
Jun'18
Jul'16
Mar'17
Jul'17
Mar'18
Jul'18
Apr'16
Sep'16
Feb'17
Apr'17
Nov'16
Sep'17
Feb'18
Apr'18
Jan'17
Nov'17
Jan'18
May'16
Aug'16
Dec'16
May'17
Aug'17
Dec'17
May'18
Oct'16
Oct'17
Source: Company, Axis Securities
RM cost breakup (%) : TDI share rose sharply due to price hike Margins maintained despite TDI price rise
12.0% 10.4% 10.8%
10.2%
10.0%
23% 32% 47%
8.0% 6.53% 6.67%
6.1% 5.9% 6.17%
6.0%
29% 29% 20% 4.0% 2.75%
49% 39% 33% 1.99%
2.0%
0.0%
FY2016 FY2017 FY2018 FY14 FY15 FY16 FY17 FY18
TDI Polyol Other (Coir sheet, chemical, clothe) EBIDTA (%) PAT(%)
TDI share in RM cost would reduce with fall in TDI price, giving boost to SFL’s branded products margins owing to its pricing power
Source: Company, Axis Securities
2518 SEP 2018 Sheela Foam
Sector: Home Improvement
Revenues, realizations to grow at healthy pace
Revenue Revenue Growth: SFL has CAGR of 9.5% over FY14-FY18. We
expect revenue to grow at 11.2% CAGR over FY18-FY20 led
3,000 by increase in target market and growing End-User Industry
2,478
2,500 2,202
1,912 2,004 Mattress Segment is expected to grow 5% in volume
2,000 1,696
1,553 whereas company takes 3-4% price increase annually
Rs (In Cr)
1,396
1,500
1,000
We expect Furniture Foam segment to grow substantially at
20% on a low base
500
0 Technical PU foam is expected to grow at 12% CAGR as
FY14
FY15
FY16
FY17
FY18
FY19E
FY20E
SFL has developed high quality products through R&D
Realization Per Mattress Realization on increasing trend: FY18 saw slight decline in mattress
Expected to
increase at 5% p.a. realization due to introduction of Economy class brand. SFL
6,800
increases price twice a year without facing pressure on
6,600 demand
6,400 Introduction
of Economy Realization growth on mattresses was 3.5% in FY18
6,200 model (excluding economy model). Going forward we expect 5%
Rs
realization growth yearly
6,000
SFL has strong hold in premium and mid-range segment
5,800
5,600 The launch of premium outlets, Sleepwell Emporios would
FY17 FY18 FY19E FY20E help realization growth
Source: Company, Axis Securities Ltd.
2618 SEP 2018 Sheela Foam
Sector: Home Improvement
Debt free company; strong cash flows to back capex
20 Margins on increasing trend
15
We estimate EBITDA margin to be 15.6% by FY20E and PAT to
(%)
10
be at 10.3% by FY20E on back of and incremental production
5
and sales along with increasing efficiency
0
FY14 FY15 FY16 FY17 FY18 FY19E FY20E Going forward we expect TDI price to ease which would further
EBIDTA (%) PAT(%) improve the margins
50 Improving return ratios
40 SFL generated RoE of 25.2% and RoCE of 33.2% in FY18. We
30 expect SFL’s RoE to be at 27.6% and RoCE to be at 37.7% by
(%)
20 FY20E on back of improving margins and operational efficiency.
10
We expect the return ratios to get better on account of improving
0
NPM. The asset turn is currently subdued and as the capacity
FY14 FY15 FY16 FY17 FY18 FY19E FY20E
utilization improves, we expect asset turn to pick up thus further
RoE (%) RoCE (%)
pushing the return ratios nearer to its historical highs.
400
291 Strong Cash flow to back Capex
300 219
Rs (In Cr)
200 134 156 168 SFL has also reduced its long-term debt and is currently debt free
51 71
100
Operating Cash flows would be enough for capex requirements
0
FY14 FY15 FY16 FY17 FY18 FY19E FY20E We expect operating cash flows (before WC changes) to grow at
Operating cash flow (Before WC adjustments) a CAGR of 32 % over FY18-20E
Source: Company, Axis Securities
2718 SEP 2018 Sheela Foam
Sector: Home Improvement
Growth to drive valuations
PE Band Valuations
3000 We estimate SFL to post revenue growth at a CAGR of 11%
2500 and profits at CAGR of 36% over FY18-20E
2000
1500 SFL is well positioned with 20-23% share in mattress market,
1000 strong brand recognition, robust margins and solid
500
financials to support market expansion.
0
May-17
May-18
Dec-16
Jun-17
Dec-17
Jun-18
Mar-17
Apr-17
Aug-17
Sep-17
Mar-18
Apr-18
Aug-18
Jan-17
Jan-18
Nov-17
Feb-17
Feb-18
Jul-17
Oct-17
Jul-18
We value SFL at 40x FY20E given the growth prospects to
arrive at a target price of Rs 2039 (24% upside)
Sheela Foam 25x 35x 45x 55x 65x
12mth fwd P/E (x) Key Risks
60
55
TDI which accounts for ~1/3 of SFL’s raw material cost is
50 highly volatile. Any obstacle in the operation of upcoming
45 capacity as well as existing capacity could push the price
40 up
35
30 Mattress market is highly competitive with more than 20
Aug-17
Mar-17
Oct-17
Nov-17
Mar-18
Dec-16
Jan-17
Jun-17
Dec-17
Jan-18
Jun-18
Apr-17
Jul-17
Apr-18
Feb-17
May-17
Sep-17
Feb-18
May-18
Jul-18
players in the organized sector. Competitors are looking for
funding to expand their market share which could impact
PE Mean +1 STDDEV -1 STDDEV SFL profits
Source: Company, Axis Securities
2818 SEP 2018 Sheela Foam
Sector: Home Improvement
Financials (Consolidated)
Profit & Loss (Rs Cr) Balance Sheet (Rs Cr)
YE March FY16 FY17 FY18 FY19E FY20E YE March FY16 FY17 FY18 FY19E FY20E
Net sales 1,696 1,912 2,004 2,202 2,478
Total assets 499 564 705 882 1,136
Total income 1,696 1,912 2,004 2,202 2,478
Cost of goods sold 1,187 1,348 1,377 1,467 1,595 Net Block 288 317 347 403 481
Contribution (%) 30.0% 29.5% 31.3% 33.4% 35.6% CWIP 11.4 37.5 53.3 78.0 78.0
Other Expense 332.4 368.7 411.4 449.2 495.7
Investments 23.0 16.0 47.5 47.5 47.5
Operating Profit 176 195 216 285 387
Wkg. cap. (excl cash) (41) (16) 99 111 125
Other income 16 22 21 21 23
PBIDT 193 217 237 306 410 Cash / Bank balance 217.2 209.4 158.2 242.5 405.7
Depreciation 29 30 35 39 43
Capital employed 499 564 705 882 1,136
Interest & Fin Chg. 12 10 9 9 10
Equity capital 16.3 24.4 24.4 24.4 24.4
Pre-tax profit 152 177 193 258 358
Tax provision 47 52 60 79 109 Reserves 322 439 573 752 1,001
(-) Minority Interests 0 0 0 0 0 Minority Interests 0.0 0.0 0.0 0.0 0.0
Associates 0 0 0 0 0
Borrowings 158 99 106 103 108
Adjusted PAT 105 125 134 180 249
Reported PAT 105 125 134 180 249 Def tax Liabilities 1.9 1.6 2.0 2.5 3.1
Source: Company, Axis Securities
2918 SEP 2018 Sheela Foam
Sector: Home Improvement
Financials (Consolidated)
Cash Flow (Rs Cr) Ratio Analysis (%)
YE March FY16 FY17 FY18 FY19E FY20E YE March FY16 FY17 FY18 FY19E FY20E
Sources 79 (54) 175 211 292 Sales growth 9.2 12.7 4.9 9.9 12.6
Oper. profit growth 10.4 10.2 10.8 13.0 15.6
Cash profit 146 165 178 227 301
COGS / Net sales 93.7 10.7 10.8 31.9 35.8
(-) Dividends 0 0 0 0 0
Overheads/Net sales 70.0 70.5 68.7 66.6 64.4
Retained earnings 146 165 178 227 301 Depreciation / G. block 19.6 19.3 20.5 20.4 20.0
Effective interest rate 6.0 8.8 8.5 7.7 6.8
Issue of equity (0.0) 8.1 0.0 0.0 0.0
Net wkg.cap / Net sales (0.02) (0.02) 0.02 0.05 0.05
Change in Oth. Reserves (11.0) (9.1) 0.8 0.0 0.0
Net sales / Gr block (x) 3.5 5.5 4.9 4.3 3.9
Borrowings (38) (13) (14) (8) 0 RoCE 42.1 39.0 33.2 35.0 37.7
Others (17) (205) 10 (8) (9) Debt / equity (x) 0.34 0.10 0.06 0.04 0.04
Effective tax rate 31.1 29.4 30.9 30.5 30.5
Applications 79 (54) 175 211 292
RoE 35.9 31.1 25.2 26.1 27.6
Capital expenditure 11.8 (116.9) 82.4 120.0 120.0 Payout ratio (Div/NP) 0.0 0.0 0.0 0.0 0.0
Investments 22.1 (6.9) 92.0 0.0 0.0 EPS (Rs.) 32.2 25.6 27.4 36.8 51.0
EPS Growth 145.4 (20.5) 7.1 34.3 38.5
Net current assets (54.8) 77.9 51.3 6.9 8.8
CEPS (Rs.) 41.2 31.8 34.6 44.8 59.7
Change in cash 100.2 (7.8) (51.1) 84.3 163.2 DPS (Rs.) 0.0 0.0 0.0 0.0 0.0
Source: Company, Axis Securities
3018 SEP 2018 Sheela Foam
Sector: Home Improvement
Disclaimer
Disclosures:
The following Disclosures are being made in compliance with the SEBI Research Analyst Regulations 2014 (herein after referred to as the Regulations).
1. Axis Securities Ltd. (ASL) is a SEBI Registered Research Analyst having registration no. INH000000297. ASL, the Research Entity (RE) as defined in the Regulations, is engaged in the business of
providing Stock broking services, Depository participant services & distribution of various financial products. ASL is a subsidiary company of Axis Bank Ltd. Axis Bank Ltd. is a listed public
company and one of India’s largest private sector bank and has its various subsidiaries engaged in businesses of Asset management, NBFC, Merchant Banking, Trusteeship, Venture Capital,
Stock Broking, the details in respect of which are available on www.axisbank.com.
2. ASL is registered with the Securities & Exchange Board of India (SEBI) for its stock broking & Depository participant business activities and with the Association of Mutual Funds of India (AMFI) for
distribution of financial products and also registered with IRDA as a corporate agent for insurance business activity.
3. ASL has no material adverse disciplinary history as on the date of publication of this report.
4. I/We, Kumar Nihal – Manager, Research, MBA (Finance), author/s and the name/s subscribed to this report, hereby certify that all of the views expressed in this research report accurately reflect
my/our views about the subject issuer(s) or securities. I/We (Research Analyst) also certify that no part of my/our compensation was, is, or will be directly or indirectly related to the specific
recommendation(s) or view(s) in this report. I/we or my/our relative or ASL does not have any financial interest in the subject company. Also I/we or my/our relative or ASL or its Associates may
have beneficial ownership of 1% or more in the subject company at the end of the month immediately preceding the date of publication of the Research Report. Since associates of ASL are
engaged in various financial service businesses, they might have financial interests or beneficial ownership in various companies including the subject company/companies mentioned in this
report. I/we or my/our relative or ASL or its associate does not have any material conflict of interest. I/we have not served as director / officer, etc. in the subject company in the last 12-month
period.
Any holding in stock – No
5. ASL has not received any compensation from the subject company in the past twelve months. ASL has not been engaged in market making activity for the subject company.
6. In the last 12-month period ending on the last day of the month immediately preceding the date of publication of this research report, ASL or any of its associates may have:
i. Received compensation for investment banking, merchant banking or stock broking services or for any other services from the subject company of this research report and / or;
ii. Managed or co-managed public offering of the securities from the subject company of this research report and / or;
iii. Received compensation for products or services other than investment banking, merchant banking or stock broking services from the subject company of this research report;
ASL or any of its associates have not received compensation or other benefits from the subject company of this research report or any other third-party in connection with this report.
Term& Conditions:
This report has been prepared by ASL and is meant for sole use by the recipient and not for circulation. The report and information contained herein is strictly confidential and may not be altered in
any way, transmitted to, copied or distributed, in part or in whole, to any other person or to the media or reproduced in any form, without prior written consent of ASL. The report is based on the
facts, figures and information that are considered true, correct, reliable and accurate. The intent of this report is not recommendatory in nature. The information is obtained from publicly available
media or other sources believed to be reliable. Such information has not been independently verified and no guaranty, representation of warranty, express or implied, is made as to its accuracy,
completeness or correctness. All such information and opinions are subject to change without notice. The report is prepared solely for informational purpose and does not constitute an offer document
or solicitation of offer to buy or sell or subscribe for securities or other financial instruments for the clients. Though disseminated to all the customers simultaneously, not all customers may receive this
report at the same time. ASL will not treat recipients as customers by virtue of their receiving this report.
3118 SEP 2018 Sheela Foam
Sector: Home Improvement
Disclaimer
DEFINITION OF RATINGS
Ratings Expected absolute returns over 12 months
BUY More than 10%
HOLD Between 10% and -10%
Disclaimer: SELL Less than -10%
Nothing in this report constitutes investment, legal, accounting and tax advice or a representation that any investment or strategy is suitable or appropriate to the recipient’s specific circumstances.
The securities and strategies discussed and opinions expressed, if any, in this report may not be suitable for all investors, who must make their own investment decisions, based on their own
investment objectives, financial positions and needs of specific recipient.
This report may not be taken in substitution for the exercise of independent judgment by any recipient. Each recipient of this report should make such investigations as it deems necessary to arrive at
an independent evaluation of an investment in the securities of companies referred to in this report (including the merits and risks involved), and should consult its own advisors to determine the merits
and risks of such an investment. Certain transactions, including those involving futures, options and other derivatives as well as non-investment grade securities involve substantial risk and are not
suitable for all investors. ASL, its directors, analysts or employees do not take any responsibility, financial or otherwise, of the losses or the damages sustained due to the investments made or any
action taken on basis of this report, including but not restricted to, fluctuation in the prices of shares and bonds, changes in the currency rates, diminution in the NAVs, reduction in the dividend or
income, etc. Past performance is not necessarily a guide to future performance. Investors are advice necessarily a guide to future performance. Investors are advised to see Risk Disclosure Document
to understand the risks associated before investing in the securities markets. Actual results may differ materially from those set forth in projections. Forward-looking statements are not predictions and
may be subject to change without notice.
ASL and its affiliated companies, their directors and employees may; (a) from time to time, have long or short position(s) in, and buy or sell the securities of the company(ies) mentioned herein or (b)
be engaged in any other transaction involving such securities or earn brokerage or other compensation or act as a market maker in the financial instruments of the company(ies) discussed herein or
act as an advisor or investment banker, lender/borrower to such company(ies) or may have any other potential conflict of interests with respect to any recommendation and other related information
and opinions. Each of these entities functions as a separate, distinct and independent of each other. The recipient should take this into account before interpreting this document.
ASL and / or its affiliates do and seek to do business including investment banking with companies covered in its research reports. As a result, the recipients of this report should be aware that ASL
may have a potential conflict of interest that may affect the objectivity of this report. Compensation of Research Analysts is not based on any specific merchant banking, investment banking or
brokerage service transactions. ASL may have issued other reports that are inconsistent with and reach different conclusion from the information presented in this report.
Neither this report nor any copy of it may be taken or transmitted into the United State (to U.S. Persons), Canada, or Japan or distributed, directly or indirectly, in the United States or Canada or
distributed or redistributed in Japan or to any resident thereof. If this report is inadvertently sent or has reached any individual in such country, especially, USA, the same may be ignored and brought
to the attention of the sender. This report is not directed or intended for distribution to, or use by, any person or entity who is a citizen or resident of or located in any locality, state, country or other
jurisdiction, where such distribution, publication, availability or use would be contrary to law, regulation or which would subject ASL to any registration or licensing requirement within such
jurisdiction. The securities described herein may or may not be eligible for sale in all jurisdictions or to certain category of investors.
The Disclosures of Interest Statement incorporated in this document is provided solely to enhance the transparency and should not be treated as endorsement of the views expressed in the report. The
Company reserves the right to make modifications and alternations to this document as may be required from time to time without any prior notice. The views expressed are those of the analyst(s)
and the Company may or may not subscribe to all the views expressed therein.
Copyright in this document vests with Axis Securities Limited.
Axis Securities Limited, Corporate office: Unit No. 2, Phoenix Market City, 15, LBS Road, Near Kamani Junction, Kurla (west), Mumbai-400070, Tel No. – 18002100808/022-61480808, Regd.
off.- Axis House, 8th Floor, Wadia International Centre, Pandurang Budhkar Marg, Worli, Mumbai – 400 025. Compliance Officer: Anand Shaha, Email: compliance.officer@axisdirect.in, Tel No:
022-42671582.
32You can also read