The Ant Group IPO Is Coming! - Stroeve Lemberger
←
→
Page content transcription
If your browser does not render page correctly, please read the page content below
The Ant Group IPO Is Coming!
 How the Ant Group IPO is bringing the Chinese internet sector into
the spotlight, the expansion of Southbound Connect, and a potential
   contrarian investment opportunity from US-China headlines.

 Q2 2020
 China Internet Quarterly
 Earnings Report
    europe@kraneshares.com    +31 (6) 492 496 89
europe@kraneshares.com   +31 (6) 492 496 89

Table of Contents
China Internet Recent Highlights                                           3
KWEB Performance                                                           4
KWEB Top 10 Holdings Financials Summary                                    5
KWEB Key Metrics                                                        6-7
Subsector Analysis                                                    8-13
Theme Highlight                                                     13-23
Top 10 KWEB Holdings: Quarterly Earnings Update                     25-36
Tencent                                                             25-26
Alibaba                                                             26-27
Meituan Dianping                                                    27-28
Pinduoduo                                                           28-29
JD.com                                                              30-31
Bilibili                                                            31-32
Ali Health                                                          32-33
TAL Education Group                                                 33-34
Baidu                                                               34-35
Netease                                                             35-36
Citations                                                                37
Definitions                                                              38

kraneshares.eu                                                              2
europe@kraneshares.com   +31 (6) 492 496 89

 China Internet Recent Highlights:
 •   E-Commerce accounted for 30% of all retail sales in China in the
     first half of 2020. The mix of products being sold online changed as
     virus-wary customers bought more daily necessities online rather
     than travelling to a local brick and mortar store. Online sales of
     food increased by 30% year-on-year during the period.1

 •   Prior to the pandemic, China already had one of the highest usage
     rates of online and mobile payments in the world, handling over
     $5 trillion worth of transactions in 2018, compared to under $1
     trillion in the US.16 In response to the pandemic, the Payment &
     Clearing Association of China began an initiative to encourage the
     use of mobile, online, and barcode payments instead of cash to
     lower the risk of infection when transacting in the brick and mortar
     economy.2 The initiative neatly preceded the announcement that
     Ant Group, China’s largest online and mobile payments processor,
     would list publicly in Hong Kong and Shanghai.

 •   We have identified three key areas of focus for the internet sector:
     Ant Group’s pursuit of what may prove to be the largest initial
     public offering (IPO) in world history in Hong Kong and Shanghai,
     the potential for Alibaba’s Hong Kong listing and other recent Hong
     Kong IPOs to be included in Southbound Connect, thereby opening
     their shares up to Mainland Chinese investors for the first time,
     and a potential contrarian investment opportunity stemming from
     US-China headlines. These areas of focus are the subject of this
     edition’s theme highlight.

kraneshares.eu                                                                3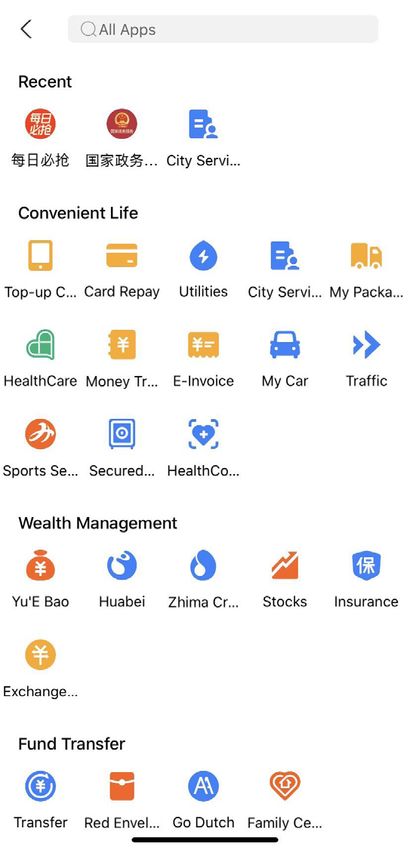
europe@kraneshares.com           +31 (6) 492 496 89

KraneShares CSI China Internet UCITS ETF (Ticker: KWEB)
Performance
Cumulative %                       Data as of: 31/08/2020
                                                        Fund NAV                              Index
1 Month                                                    6.46%                              4.68%
3 Month                                                   35.83%                             33.77%
6 Month                                                   47.20%                             44.79%
Since Inception                                           77.40%                             77.13%

 Avg Annualized %                  Data as of: 31/08/2020
                                                       Fund NAV                               Index
 1 Year                                                    68.12%                           66.20%
 Since Inception                                          38.05%                             37.86%
KWEB’s gross expense ratio is 0.75%. Inception Date: 20/11/2018. The performance data quoted
represents past performance. Past performance does not guarantee future results. The investment
return and principal value of an investment will fluctuate so that an investor’s shares, when sold or
redeemed, may be worth more or less than their original cost and current performance may be lower
or higher than the performance quoted. Shares are bought and sold at market price (not NAV) and are
not individually redeemed from the Fund. Brokerage commissions will reduce returns.

This information is being communicated by KraneShares, which is an appointed representative
of DMS Capital Solutions UK Limited, which is authorised and regulated by the Financial Conduct
Authority in the United Kingdom under the reference number 503325.
Investing involves risk, including possible loss of principal. There can be no assurance that a Fund
will achieve its stated objectives. The Funds are subject to political, social or economic instability
within China which may cause decline in value. Fluctuations in currency of foreign countries may
have an adverse effect to domestic currency values. Emerging markets involve heightened risk
related to the same factors as well as increase volatility and lower trading volume.
Narrowly focused investments typically exhibit higher volatility. Internet companies are subject to
rapid changes in technology, worldwide competition, rapid obsolescence of products and services,
loss of patent protections, evolving industry standards and frequent new product productions. Such
changes may have an adverse impact on performance.
This material is for information only and does not constitute an offer or recommendation to buy
or sell any investment, or subscribe to any investment management or advisory service. It is
not, under any circumstances, intended for distribution to the general public. You are accessing
information which constitutes a financial promotion under section 21 of the Financial Services and
Markets Act 2000 (“FSMA”). In relation to the United Kingdom, this information is only directed at,
and may only be distributed to, persons who are “Investment Professionals” (being persons having
professional experience in matters relating to investments) within the meaning of article 19(5) of
the FSMA (Financial Promotion) Order 2005 (the “Financial Promotion Order ”), persons to whom
any of paragraphs (2)(a) to (d) of article 49 (high net worth companies, unincorporated associations
eatc.) of the financial promotion order apply, or persons to whom distribution may otherwise
lawfully be made.
Any investment, and investment activity or controlled activity, to which this information relates is
available only to such persons and will be engaged in only with such persons. Persons that do not
have professional experience should not rely or act upon this information unless they are persons
to whom any of paragraphs (2)(a) to (d) of article 49 apply to whom distribution of this information
may otherwise lawfully be made.
For additional fund documentation, please visit www.DMSGovernance.com
kraneshares.eu                                                                                          4
europe@kraneshares.com +31 (6) 492 496 89
KWEB Top 10 Holdings Q2 2020
Financials Summary
Top 10 KWEB KWEB Net Revenue Net Earnings
Revenue
Weight Income Growth Margin per Share
Holdings (%)
($ B)
($ B) (%) (%) ($)
Tencent (700 HK) 9.25 16.20 4.67 29 29 0.42
Alibaba (BABA) 9.14 21.69 6.71 34 31 2.45
Meituan Dianping
7.69 3.50 0.31 9 9 0.05
(3690 HK)
Pinduoduo (PDD) 6.80 1.72 -0.13 67 -7 -0.11
JD.com (JD) 6.53 28.40 2.32 34 8 1.48
Bilibili (BILI) 4.37 0.37 -0.08 70 -22 -0.23
Ali Health(00241) 4.18 0.60 0.00 119 -0.5 0.00
TAL Education Group 3.83 6.43 0.08 35 9 0.13
(TAL)
Baidu (BIDU) 3.82 3.67 0.50 -1 14 1.46
NetEase(NTES) 3.81 2.57 0.64 20 25 4.88
Total Weighted Average (%)
59.42 85.15 15.02 39.31 11.96 1.00
Data from
from Bloomberg
Bloombergas
asofof08/31/2020.
31/08/2020.Fund
Fundholdings
holdingsare subject
are to to
subject change.
change.
kraneshares.eu 5europe@kraneshares.com +31 (6) 492 496 89
KWEB Key Metrics
KWEB Valuation vs. US Internet
Price to Earnings Growth (PEG)
1.60
1.40
1.20
1.00
0.80
0.60
0.40
0.20
0.00
31 AR 01 4
30 UN 01 6
31 UL 0 18
31 - 20 9
30 AN 01 5
0
29 UG 015
- A 20
30 EC 013
31 EB 017
31 EC 018
31 AY 013
31 OC T 014
28 OV 016
28 EP 017
31 AY 018
31 OC T 019
29 PR 016
-2
AR 01
ug
-A -2
- M -2
- J -2
- F -2
- J -2
- M -2
- M -2
- -2
- J -2
- N -2
-S -2
- M -2
- -2
- A -2
- D -2
- D -2
31 UL
-J
31
PEG using FY1 PE and FY1 to FY2 Growth
KWEB Average
Dow Jones Internet Composite Index Average
Data
Data from
from Factset as of
Factset as of 9/15/20
15/09/20.
Definitions
Definitions are available
available on
on page
page38.
38.
Average Performance YTD By Subsector
250
200
150
%
100
50
0
-50
l
ce
g
ch
t
e
ss s
Ed ure
n
s
g
n
nl ch
ve
en
ad
in
ar
ed
in
tio
He tio
ar
er
e
an Tra
ve am
am
nm
E- thc
t
i fi
t
ta
a
e
uc
m
in
Se
uc
in
or
G
F
m
re
al
tr
ai
a
sp
Co
as
rt
st
Cl
/O
te
fr
En
al
In
Tr
Li
ci
d
s&
So
ou
Cl
to
Au
Data from Bloomberg as of 20/08/2020
Data from Bloomberg as of 8/20/2020
kraneshares.eu 6europe@kraneshares.com +31 (6) 492 496 89
YoY EPS Growth
300
250
200
150
100
%
50
0
-50
-100
-150
Tr a in s
ds
Se n
So ur e
e
t
tru h
a s on
al Fi e
r e ng
al ng
om are
to En li n h
el
sp e n
ar
& ert ad
io
as arc
c
c
av
fie
er
/ O nte
Cl tati
i
He m i
at
m
ve G am
ct
ftw
eC t hc
e
Tr
m
si
uc
a
or
Ed
n
st
an
fr
t
In
Li
ci
ud
So
o
s
Cl
Au
Data from Bloomberg as of 8/13/2020
Data from Bloomberg as of 13/08/2020
Subsector Weights in KWEB
Autos & Cloud Infrastructure
Transportation 0.78%
2.89%
Fintech Software
Classifieds 2.67% 0.13%
3.16%
Travel
4.07%
Search
4.38%
Live streaming
4.47%
E-Commerce
Gaming 36.92%
6.02%
Education
6.27%
Healthcare
6.74%
Social / Online ads Entertainment
10.44% 11.06%
Data from Bloomberg as of 8/13/20
Data from Bloomberg as of 13/08/2020
kraneshares.eu 7europe@kraneshares.com +31 (6) 492 496 89 Subsector Analysis Cloud Infrastructure has been the top-performing subsector year- to-date based on KWEB’s holdings as of Q2 end. While multiple KWEB holdings are involved in the cloud business, 21 Vianet is the only holding that operates the data centers that are the lifeblood of the business. Investors’ enthusiasm for the company is strong and understandably so considering the increased demand for cloud computing services due to work-from-home. 21 Vianet operates carrier-neutral data centers, which house cloud computing and other types of data that can be accessed using any internet service provider. The company controls 8% of the approximately $23 billion data center market in China. The company has an exclusive contract to house data for Microsoft Azure’s China-based users and counts JD.com and IBM as clients as well.3 Stocks in the online education industry continued their rise since last quarter as quarantine-induced demand for their services remained relatively steady. GSX Techedu has been the star of the subsector so far this year, returning +350% year-to-date. GSX saw net income of RMB 179 million in 2019 after operating at a loss in 2018.4 Investors are excited about the company’s durable business model, which focuses on afterschool classes and supplementary education rather than serving as a replacement for traditional schools. However, the company remains a small player in a highly kraneshares.eu 8
europe@kraneshares.com   +31 (6) 492 496 89

competitive field at approximately half the market capitalization of
TAL Education as of the end of the second quarter

Healthcare stocks also continue to top the charts among China

internet names. Ali Health has seen users of its online pharmacy

increase to 48 million this year, up from 27 million in 2019.15 The

demand for online healthcare services, including check-ups and

prescriptions, skyrocketed during the coronavirus pandemic in

China. This is owed not to covid patients themselves, but rather

those with routine medical needs concerned about becoming

infected at a physical hospital or clinic.

E-Commerce companies unsurprisingly still top the charts this

year among China internet stocks. E-Commerce now makes up for

approximately 30% of all retail in China, the highest penetration
rate in the world. One lesser known E-Commerce company is

Weimob, which provides Software-as-a-service (SaaS) solutions to

companies looking to increase their online footprint for sales and

marketing purposes. Weimob’s share price has risen over +200%

year-to-date as the company’s revenues grew by +46% in the first

half of 20204.

kraneshares.eu                                                                9
europe@kraneshares.com   +31 (6) 492 496 89

Gaming stocks were powered by another stellar quarter for gaming

and social media giant Tencent. Despite negative press surrounding
the potetial WeChat US ban and a ban on game PUBG in India,

Tencent beat estimates in its quarterly earnings report and released

a mobile version of the popular Korean gaming franchise Dungeon &

Fighter. Investors in Hong Kong continue to believe in the longterm

prospects for the company.

Live Streaming and Entertainment companies have kept millions

of Chinese entertained through lockdowns and stocks in these

subsectors are up year-to-date. In particular, Bilibili’s stock price

has risen +124%4 as investors remain confident in the company’s

business model and are energized by the recent announcement of

their content partnership with Sony.

Fintech is now in positive returns territory for the year, after having

exhibited a negative year-to-date change in the first quarter that

made it the laggard of our analysis in Q1. A particularly bright spot

in the industry has been online insurance. KWEB holding Zhong An

Insurance is up +50% year-to-date.4 Zhong An is a fully online and

full-service insurance company. However, not all online insurers
are full service. Some online insurance firms only cover policy

sales for traditional insurers and collect a commission. Yet others

provide back-end support to traditional insurers. Investors are
kraneshares.eu                                                              10
europe@kraneshares.com   +31 (6) 492 496 89

likely energized by the steady increase in insurance premiums in

China over the past ten years, especially among internet insurers.

According to the Insurance Association of China (IAC), the total value

of web-offered policies has increased at a compound annual growth

rate (CAGR) of 83% from 2011 to 2019.5 Likewise, investors may be

encouraged by a penetration rate of only 6.3% for online insurance5,

demonstrating that the industry has ample room to grow.

In next quarter’s analysis, we will treat insurance as a unique

subsector to keep an eye on the industry’s evolution.

Recent IPO, One Connect Financial, also helped power gains in the

fintech subsector as shares in the company have nearly doubled

since its IPO this past December. The Ping An-backed company

provides technology solutions to major financial institutions in
China, including blockchain solutions. One Connect has also entered

into an agreement with the Hainan Local Financial Supervision

Administration to develop smart financial infrastructure on the

island in conjunction with the establishment of the Hainan Free

Trade Port. The agreement comes at the same time as China’s

government is beginning to test the first-ever Central Bank digital

currency.

kraneshares.eu                                                             11
europe@kraneshares.com   +31 (6) 492 496 89

Search, Social & Online Advertisement made a comeback this
quarter compared to last when the subsector was in the red for
the year. Despite the fact that Tencent recorded a -25% YoY decline
in advertising revenue, as life has returned to normal in much of
China sentiment surrounding the social media advertising space
has improved. As we discussed in the previous edition of this report,
although social media use was elevated during quarantine, online
advertising slumped as a significant portion of ad spending is geared
towards the brick-and-mortar economy. However, CICC analysts
point out that, in the case of Tencent, the outlook for ads remains
positive as the company consolidates its sales channel amid rising
demand for advertising space.
Autos & Transportation, Travel and Classifieds stocks continue to
underperform this year and lag the other subsectors in this analysis
as investors remained concerned over negative effects of the
pandemic on the real economy. That being said, job search platform
Tongdao Liepin is surprisingly up +22% year-to-date after reporting
earnings per share (EPS) of 0.09 in the second quarter compared to
-0.02 in the first quarter of 20204. In the last edition of this report,
we stated that tackling surging unemployment stemming from the
pandemic is at the top of policymakers’ minds in China. We also
hypothesized that internet job search firms may aid in the effort to

get Chinese back to work.
kraneshares.eu                                                               12
europe@kraneshares.com   +31 (6) 492 496 89

Auto sales are also seeing increasing policy support as planned

decreases in EV subsidies have been shelved for the time being.

Moreover, China’s auto sales rose by 16.4% in July6 compared to a

year earlier, a staggering number when adjusted for the declines in

discretionary spending overall during the pandemic.

kraneshares.eu                                                            13
europe@kraneshares.com   +31 (6) 492 496 89

The Ant Group IPO, Expansion of Southbound
Connect, & A Potential Contrarian Investment
Opportunity From US-China Headlines
Q2 2020 marked another eventful quarter for China’s internet sector.

Through all of the market volatility, political rhetoric, and virus fears,

investors in the KraneShares CSI China Internet ETF ended the

second quarter with healthy returns. Nonetheless, the recent rally

in internet shares may have some thinking either that they missed

the boat or that current valuations are unsustainable. However,

we believe there are reasons to remain positive about the sector’s

prospects for both near-term and long-term growth.

We have identified three key areas of focus for the internet sector:

Ant Group’s pursuit of what may prove to be the largest initial

public offering (IPO) in world history in Hong Kong and Shanghai,

the potential for Alibaba’s Hong Kong listing and other recent Hong
kraneshares.eu                                                              14
europe@kraneshares.com   +31 (6) 492 496 89

Kong IPOs to be included in Southbound Connect, thereby opening

their shares up to Mainland Chinese investors for the first time, and

a potential contrarian investment opportunity arising a US-China

headlines leading up to the US election.

These topics are coming to the fore as valuations in China’s internet

sector remain attractive compared to their US peers. Although

recent strong performance has pushed KWEB’s price-to-earnings

growth ratio (PEG) higher than its historical average, investors

are still paying double for a similar quality of growth in the U.S.

To further understand this valuation gap, consider the fact that

Amazon’s market cap is $1.7 trillion and Apple’s market cap is $2

trillion. In comparison, Alibaba’s market cap is only $770 billion and
Tencent’s is a mere $665 billion4.

Before diving into these three areas of focus, it is important to note

that the macro backdrop of consumption in China remains strong.

China’s supply-side has recovered from the pandemic and demand

is beginning to catch up. Furthermore, the government’s new

policy of “dual circulation,” i.e. stimulating domestic demand and,

simultaneously, augmenting China’s role, at a high level, in the global

economy, is likely to have a positive impact on companies in China’s

internet sector, which benefit from increased domestic demand.

kraneshares.eu                                                               15
europe@kraneshares.com   +31 (6) 492 496 89

1. Ant Group: KWEB offers fast track to the largest IPO in history

Ant Group recently revealed its plans to pursue an initial public
offering (IPO) in both Hong Kong and Shanghai. As the company

seeks to raise $30 billion through the offering, implying a total

valuation of over $200 billion, the IPO could be the largest in history.

Ant Group began as the payment processing service, Alipay, which

enables transactions on Alibaba’s E-Commerce marketplace. Since

then, it has grown to offer banking products, credit rating services,

insurance, and investment products including the world’s largest

money market mutual fund. Nonetheless, payments are still Ant’s

bread and butter, and the firm’s share of China’s approximately $8

trillion7 digital payments market was over 50% in 2019.8 After moving

into positive margin territory in the first half of the year, we believe

Ant’s profitability underscores the viability of its business model and

those of similar businesses. Therefore, the company’s public debut

may lead to a valuation boost for firms such as Alibaba and Tencent.

In its prospectus, the company stated that increasing the trust

between buyers and sellers in online transactions was their initial

goal. Achieving that goal, in turn, has facilitated the E-Commerce
evolution in China. The company’s prospectus had another key

theme: technological facilitation rather than end-to-end integration.

kraneshares.eu                                                               16
europe@kraneshares.com           +31 (6) 492 496 89

A menu within the Alipay app displaying the wide variety of services available on the platform.

Ant Group made a point of clarifying that their role is as a facilitator

of E-Commerce and innovative financial services. This means that

they want to create the infrastructure that allows parties to transact.

For example, in financial services, Ant works with existing banks to

digitize their operations and, in insurance, they work with traditional

insurers to provide an online marketplace for their policies. At

present, Ant works with over 200 banks and insurers, but plans to

expand its partner network into the 1000s.7

kraneshares.eu                                                                                    17
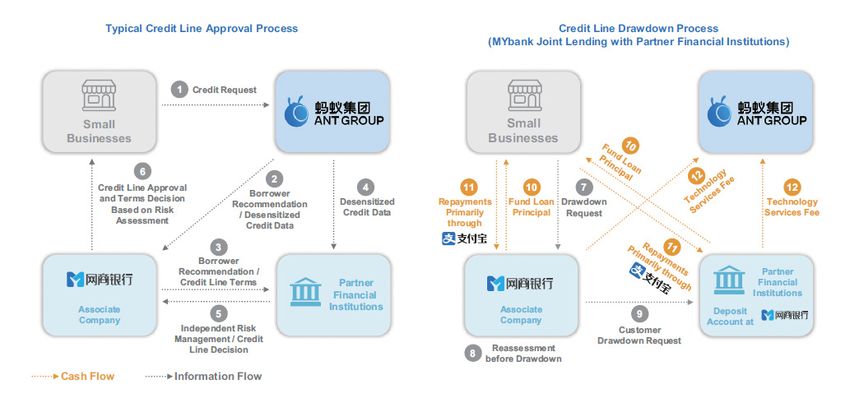
europe@kraneshares.com          +31 (6) 492 496 89

Diagram showing how Ant Group works with financial institutions to provide credit to businesses.

We believe that this business model is akin to that of Amazon,

whereby, at least at the start, they will have no intention of replacing

the businesses that already make up these spaces. Instead, they

focus on providing a centralized and efficient marketplace and

ecosystem in which these businesses may transact with customers.9

Ant Group has seen impressive growth over the past few years.

UBS reports that, in the first half of 2020, revenues grew 38% from

the same period in 2019. Furthermore, credit services have now

surpassed payments to become the company’s top contributor to

revenue. Insurance revenues nearly doubled from 2018 to 2019.

Despite growing so quickly, Ant Group has demonstrated a path to

profit by driving operating margins up from -16.8% in 2018 to 38.1%

in the first half of 2020. Notably, UBS analysts believe that Ant has

demonstrated a margin advantage over Tencent in payments.8
kraneshares.eu                                                                                 18
europe@kraneshares.com   +31 (6) 492 496 89

Due to its projected market capitalization and sector classification,

Ant will likely qualify for KWEB’s fast track index inclusion

methodology and enter KWEB’s CSI Overseas China Internet Index

ten business days after its IPO date. Thanks to this feature of our

index, KWEB was not only the first US-listed China ETF but also the

first US-listed technology ETF to hold shares in Alibaba when the

company listed publicly in the United States in 2014.12

2. Southbound Connect: Mainland investors know better

Everyone knows the old adage: invest in what you know. Well, that
is precisely what we believe Mainland Chinese investors may do
once companies that they are very familiar with, including Alibaba,
become available on the Southbound Connect trading program.
Today, Mainland investors cannot trade in Alibaba shares because
the company is currently listed in Hong Kong and New York only.
Upon inclusion in the mutual market access program, shares
in Alibaba will become available to Mainland investors, both
institutions and individuals. We believe that this may benefit the
company’s valuation because Mainland investors are likely to better
understand the company’s business and prospects for growth, given
that they make up the company’s customer base.

The same may be true for future Hong Kong IPOs of internet
companies. Mainland investors’ appetite for Hong Kong tech stocks
kraneshares.eu                                                             19
europe@kraneshares.com   +31 (6) 492 496 89

has been on full display of late. So far this year, Mainland investors
have poured over $35 billion into Hong Kong stocks through
Southbound Connect and, according to a Bloomberg report as of
May, were net buyers of Hong Kong stocks in all but six sessions.13
Investment through Southbound Connect this year has favored
internet and technology stocks such as Xiaomi, Meituan Dianping,
and Tencent,14 all of which have mostly Mainland customer bases but
lack Mainland (A-share) listings. Being included among these names
in the mutual market access program may provide a significant
valuation boost for Alibaba. Having been added to the Hang Seng
Large Cap Composite Index in September, Alibaba’s Hong Kong
shares are technically eligible for inclusion in Southbound Connect.
However, inclusion in the program has been delayed due to
regulatory complexities. Alibaba’s Hong Kong shares are convertible
to US shares, but investors cannot hold US-listed stocks in Mainland
accounts. We believe this issue will be resolved promptly as brokers
must execute the conversion upon client requests, meaning that
conversions are already subject to review. Furthermore, Southbound
Connect participants are already barred from purchasing Hong
Kong shares that are denominated in US dollars, meaning that
brokers and clearing houses already have experience differentiating
share classes.

kraneshares.eu                                                             20
europe@kraneshares.com   +31 (6) 492 496 89

3. More Bark Than Bite: US-China headlines may create a

potential contrarian investment opportunity.

Two major events have occurred in the political arena over the

past quarter: the announcement of a potential bans on Tencent’s

US WeChat app and Bytedance’s US TikTok app and the Senate’s

passing a bill to potentially delist Chinese stocks from US

exchanges. Despite the attention paid to these headlines, KWEB

has shown resilience and delivered strong performance for

the quarter. The fundamental attractiveness of the sector may

outweigh the headline risk. Furthermore, we believe many of these

announcements amount to pre-election posturing and any seriously

confrontational policy would risk an uproar in US equity markets as

a whole just before an election. We believe that the offshore Chinese

renminbi (CNH), may act as a bellwether for the potential market

impact of any political action. Generally, headlines tend to move

stocks in an exaggerated fashion as algorithms and high frequency

trading computers are programmed to trade on the news. Stocks

thus tend to be more volatile in the short term, however, they often

later rebound.

Rather than be emotionally led by breaking news, we believe in

taking a more calculated approach by following CNH, which trades

kraneshares.eu                                                             21
europe@kraneshares.com    +31 (6) 492 496 89

during US market hours. In fact, because the offshore currency

trades during US hours, some brokers check CNH before buying

or selling US listed Chinese companies following negative political

headlines. Year to date, CNH has appreciated versus the US dollar.

                           Offshore Renminbi vs. US Dollar (Spot Rate)
                     7.3
                     7.2
Depreciation
                     7.1
                      7
           CNH/USD

                     6.9
                     6.8
                     6.7
Appreciation
                     6.6
                     6.5
                      20

                                 20

                                 20

                                            20

                                            20

                                                        20

                                                        20

                                                                      20

                                                                                20
                    2/

                               2/

                               2/

                                          2/

                                          2/

                                                      2/

                                                      2/

                                                                    2/

                                                                              2/
                 1/

                            2/

                            3/

                                       4/

                                       5/

                                                   6/

                                                   7/

                                                                 8/

                                                                           9/

Data from Bloomberg
          Bloombergas
                    asof
                       of9/15/20
                          15/09/2020

Diving into these announcements themselves, we find that their

immediate consequences for the China internet sector have

consisted of mostly short-term dips in equity prices and were largely

smoothed out in the long-term. In the case of the the proposed bans

on TikTok and WeChat in the US, numerous details regarding the

policies have yet to be ironed out, not to mention the legal challenge

currently being pursued by Tiktok’s owner ByteDance. Furthermore,

the US accounted for less than 2% of WeChat’s revenue in the

kraneshares.eu                                                                        22
europe@kraneshares.com +31 (6) 492 496 89 second quarter,10 making even a total ban nearly inconsequential to Tencent’s bottom line. The Holding Foreign Companies Accountable Act prohibits the securities of any company from being listed on any of the US securities exchanges if the company fails to comply with the Public Company Accounting Oversight Board (PCAOB)’s audits for three years in a row and requires public companies to disclose whether they are owned by a foreign government. We do not believe these new stipulations pose much risk to the listings of the private (i.e. non-state-owned) and accountable internet firms that we hold in KWEB. On the contrary, we believe that more transparency is in our clients’ best interest. Nonetheless, we do have the ability to convert US shares to Hong Kong shares in the case of our holdings that have secondary listings on the city’s exchange, should the need to do so arise. While the market reacted negatively to these announcements, on a year-to-date basis, the fund has demonstrated resilience, as seen in the chart below. We believe these reactionary price movements provide attractive entry points to the fund. kraneshares.eu 23
europe@kraneshares.com               +31 (6) 492 496 89

                             CSI Overseas China Internet Index YTD Performance
                         16,000
                         15,000
                                                 Senate passes bill
                         14,000                    addressing the
Growth of 10,000 units

                                                potential delisting of
                         13,000                  US-listed Chinese
                         12,000                        stocks
                                                                                           President
                         11,000                                                          Trump issues
                         10,000                                                            executive
                                                                                         orders to ban
                          9,000                                                            WeChat &
                                                                                         TikTok in the
                          8,000                                                               US
                          7,000
                          6,000
                            / M 20
                            /F 2 0
                            /M 2 0

                              /J 0
                            /A 2 0
                            / J 20

                            /A 0

                            / J 20
                            / M 20
                           8/ r/ 20

                              Ju 0

                              /J 0
                            / J 20
                            / F 20

                              M 0

                            1/ /20

                                    0
                           3/ y/ 2

                          15 ul/2
                          6/ r/ 2

                          29 ul/2
                         22 pr/2

                                  /2
                         17 n/
                         20 ay/
                         26 e b/
                         11 e b/

                         12 ul/
                         15 an/

                         25 ar/
                         29 an/
                         12 an/

                               un

                               ug
                                a

                                a
                                p

                               J
                              A
                              J
                           1/

 Data from Bloomberg
Data        Bloombergas      asof
                                of8/31/2020
                                  31/08/2020
 Index returns are
Index            are for
                      for illustrative
                           illustrativepurposes
                                        purposesonly.
                                                   only.Indexes
                                                          Indexes are unmanaged
                                                                    are unmanaged  and
                                                                                     andone cannot
                                                                                           one      invest
                                                                                               cannot      in an
                                                                                                       invest
 index
in     directly.
   an index      Index returns
             directly.            do not do
                        Index returns    reflect fees or fees
                                            not reflect    otherorcosts
                                                                   otherassociated  with investing.
                                                                         costs associated           Past perfor-
                                                                                            with investing.
 mance
Past    does not guarantee
      performance      does notfuture   results.
                                   guarantee     See page
                                              future         38 for
                                                      results.   Seeindex
                                                                      pagedefinitions.
                                                                           38 for index definitions.

kraneshares.eu                                                                                                     24
europe@kraneshares.com +31 (6) 492 496 89
KWEB Top 10 Holdings Earnings Update
Source: CICC Research, Each Companies’ Q2 Earnings Report
Tencent
Tencent is a diversified consumer technology company with
businesses in social media, payments, gaming, cloud computing, and
online advertising. Tencent’s most well-known product is WeChat,
which is one of China’s premier social media platforms with over one
billion monthly active users.
Tencent by The Numbers (Q2 2020)
• Revenue +29% to RMB 114.88B ($16.20B) versus estimate RMB
112.44B ($15.88B)
• Net Margin 29% versus estimate 26%
• Net Income RMB 33.11B ($4.67B) versus estimate RMB 29.17B
($4.12B)
• Earnings Per Share RMB 3.44 ($0.42) versus estimate RMB 3.01
($0.42)
Tencent logged another stellar quarter in the second quarter of
2020. Domestic revenue increased +35% as many Chinese are
still spending an outsized amount of time at home and rely on the
company’s services for both communication and entertainment.
Tencent’s fintech business also recovered in the second quarter as
high-margin commercial activity picked up. The fintech segment’s
kraneshares.eu 25europe@kraneshares.com +31 (6) 492 496 89
gross profit margin reached nearly 30% compared to 24% in the first
quarter. However, Tencent’s advertising business continues to suffer
on Covid-19 woes as media advertising revenue declined 25% YoY.
Alibaba
Alibaba is a conglomerate primarily engaged in the E-Commerce
industry. The company operates an online marketplace offering a
wide variety of consumer goods. The company has also branched
out into new industries including cloud computing, logistics, and
entertainment.
Alibaba by The Numbers (Q2 2020)
• Revenue +34% to RMB 153.75B ($21.69B) versus estimate
148.06B ($16.38B)
• Net Margin 31% versus estimate 25%
• Net Income RMB 47.53B ($6.71B) versus estimate RMB 36.16B
($5.11B)
• Earnings Per Share RMB 17.36 ($2.45) versus estimate RMB
13.79 ($1.95)
Alibaba saw another quarter of growth as the company’s top-line
largely returned to pre-pandemic levels. T-mall physical goods
gross merchandise value (GMV) rose +27% YoY, within which sales of
fast-moving consumer goods (FMCGs) were a particularly bright area.
kraneshares.eu 26europe@kraneshares.com +31 (6) 492 496 89
Alibaba’s recently revealed food delivery service Ele.me achieved
positive unit economics for the first time, according to CICC
Research, as the startup application leverages Alibaba’s ecosystem
as well as recruits restaurants for the platform.
Meituan Dianping
Meituan Dianping is a Chinese E-Commerce company that
specializes in food delivery services. Meituan Dianping is the final
product of a merger in 2015 between Meituan, the Groupon of China,
and Dianping, the Yelp of China. The company now operates many
lucrative business lines including domestic travel and general
retail. However, most of the company’s revenue comes from its food
delivery business.
Meituan Dianping by The Numbers (Q2 2020)
• Revenue +9% to RMB 24.72B ($3.49B) versus estimate RMB
23.58B ($3.44B)
• Net Margin 9% versus estimate 0%
• Net Income RMB 2.21B ($0.31B) versus estimate RMB 0.04B
($0.01B)
• Earnings Per Share RMB 0.37 ($0.05) versus estimate RMB 0.03
($0.00)
kraneshares.eu 27europe@kraneshares.com +31 (6) 492 496 89
Meituan posted modest revenue growth in the second quarter as
the business continues to recover from the pandemic. Food delivery
order volume rose +7% YoY in the second quarter. Meituan surprised
most analysts by turning a profit this quarter. However, recovery in
the company’s other business lines is lagging as consumers remain
somewhat reluctant to go out to eat and travel. Nonetheless, the
company continues to invest in new business initiatives including
grocery delivery and bike sharing.
Pinduoduo
Pinduoduo saw incredible growth in the second quarter, with
revenues up 67%. Nonetheless, management clearly continues
to prioritize growth over profits. While the company continued to
grow its active users and sales in low-value products, net income
remained negative for Q2. That being said, CICC analysts believe
that Pinduoduo’s average revenue per user (ARPU) is likely to rise
and drive the company closer to profitablility. With 683 million users
on its platform, we believe that Pinduoduo continues to have great
growth potential.
Pinduoduo by The Numbers (Q2 2020)
• Revenue +67% to RMB 12.19B ($1.72B) versus estimate RMB
12.15B ($1.59B)
kraneshares.eu 28europe@kraneshares.com +31 (6) 492 496 89
• Net Margin -7% versus estimate -13%
• Net Income RMB -0.90B (-$0.13B) versus estimate RMB -1.52B
(-$0.21B)
• Earnings Per Share RMB -0.76 (-$0.11) versus estimate RMB
-1.46 (-$0.21)
Pinduoduo grew incredibly in the second quarter. Although that
growth continues to come at a significant cost to the company’s
bottom line, the company’s sales and marketing expenses did
decrease somewhat in the second quarter compared to the first.
Nonetheless, management clearly continues to prioritize growth
over profits. Active users grew during the quarter, which, along with
the company’s sales strength this quarter having been concentrated
in low-value products, diluted average revenue per user (ARPU).
That being said, CICC analysts believe that ARPU for Pinduoduo’s
683 million users is set to rise and drive the company closer to
profitability.
JD.com
JD.com is primarily involved in the E-Commerce business. JD owns
a large and growing marketplace for a wide variety of goods. Also,
they have vertically integrated by offering their own logistics service.
kraneshares.eu 29europe@kraneshares.com +31 (6) 492 496 89
JD.com by The Numbers (Q2 2020)
• Revenue +34% to RMB 201.05B ($28.37B) versus estimate RMB
190.74B
• Net Margin 8% versus estimate 2%
• Net Income RMB 16.45B ($2.32B) versus estimate RMB 3.97B
($0.56B)
• Earnings Per Share RMB 10.46 ($1.48) versus estimate RMB 2.71
($0.38)
Following in Alibaba’s footsteps, JD posted another quarter of
growth as fast-moving consumer goods (FMCG) were a particularly
bright area. However, JD also derives significant strength from its
grocery and fresh produce businesses. Unlike Alibaba, JD’s logistics
arm turned a profit for the first time. JD’s logistics business
made RMB 104 million, approximately $15.3mm, in the second
quarter thanks to increased capacity utilization, volumes that have
remained at their pandemic highs, and property sales. The company
continues to improve its brand image and the trust it engenders
in its customers and gain market share in the process. JD added
30 million new annual active customers in the second quarter
compared to the first, 80% of which hail from lower-tier cities in
China.
kraneshares.eu 30europe@kraneshares.com +31 (6) 492 496 89
Bilibili
Bilibili is an innovative and growing online entertainment platform in
China. Bilibili is akin to YouTube in the US, but offers a wider variety
of content including games and comics. Since its US IPO in 2018, the
company’s stock has returned nearly 200%.
Bilibili by The Numbers (Q2 2020)
• Revenue +70% to RMB 2.62B ($0.37B) versus estimate RMB
2.55B ($0.28B)
• Net Margin -22% versus estimate -19%
• Net Income RMB -0.57B (-$0.08B) versus estimate RMB -0.48B
(-$0.07B)
• Earnings Per Share RMB -1.63 (-$0.23) versus estimate RMB
-1.50 (-$0.21)
Bilibili’s revenues surged in the second quarter as the company
ramped up sales and marketing spending. Bilibili’s monthly
active users are up +55% YoY to nearly 172 million, but relatively
unchanged since last quarter. Bilibili established an official channel
to connect content creators with advertisers and take a cut, which
should improve monetization in coming quarters. That being said,
the company will likely continue to operate at a loss in the short
term in order to maintain its fabulous growth.
kraneshares.eu 31europe@kraneshares.com +31 (6) 492 496 89 Ali Health Ali Health is the healthcare subsidiary of Alibaba Inc. and has been publicly listed in Hong Kong as a separate entity since 1996. The company operates an online pharmacy, offers medical consultations and physicals, provides health monitoring services, and more. The company boasts nearly 48 million users as of this year. Ali Health by The Numbers (1H 2020) • Revenue +119% to RMB 4.18B ($0.60) • Net Margin -0.5% • Net Income RMB -0.02B ($0.00) • Earnings Per Share RMB 0.00 ($0.00) Ali Health has demonstrated an excellent ability to grow and capitalize on online health care market opportunities that arose during the pandemic. Ali Health has seen users of its online pharmacy increase to 48 million this year, up from 27 million in 2019. The pandemic bump aside, the company’s 2019 investment from Ant Group signifies a desire to consolidate health care resources over the long-term. Ant Financial has signed service contracts with over 9,000 healthcare institutions. The partnership between the two may go a long way in revolutionizing health care infrastructure in China. kraneshares.eu 32
europe@kraneshares.com   +31 (6) 492 496 89

Although still very much in its growth stage, we believe Ali Health

represents the future of healthcare in China due to its innovative

zeal and ability to collaborate with its powerful partners: Ant Group

and Alibaba.

TAL Education

TAL Education Group is an educational services provider that

mainly focuses on online education. The company aims to improve

education systems by leveraging science and technology to deliver

innovative approaches to learning. Education is held in high regard

by Chinese families, and a robust middle class makes it a growth

market. The pressure on children to succeed academically is driving

the impressive expansion of the industry.

TAL Education by The Numbers (Q2 2020)

•   Revenue +35% to RMB 6.43B ($0.91B) versus estimate RMB
    6.32B ($0.89B)

•   Net Margin 9% versus estimate 4%

•   Net Income RMB 0.58B ($0.08B) versus estimate RMB 0.28B
    ($0.04B)

•   Earnings Per Share RMB 0.92 ($0.13) versus estimate RMB 0.49

    ($0.07)

kraneshares.eu                                                             33
europe@kraneshares.com +31 (6) 492 496 89
TAL continues to grow as people in China still demand remote
learning. The company’s margin improved significantly since last
quarter when TAL operated at a net loss. Management stated that
tax subsidies due to Covid-19 will continue in coming quarters, which
should make profit sustainable in the near future. However, TAL still
only breaks even on their “XRS Online” class segment, though the
segment’s contribution to revenue increased in the second quarter.
Baidu
Baidu provides comprehensive web search services to Chinese
consumers. The company is analogous to Google in the United
States. Baidu has amassed an immense market share in China and
is the country’s most popular search engine. Baidu has a focus on
innovation with significant investments in both artificial intelligence
research and autonomous vehicles.
Baidu by The Numbers (Q2 2020)
• Revenue -1% to RMB 26.03B ($3.67B) versus estimate RMB
25.72B ($3.63B)
• Net Margin 14% versus estimate 13%
• Net Income RMB 3.58B ($0.50B) versus estimate RMB 3.27B
($0.46B)
• Earnings Per Share RMB 10.37 ($1.46B) versus estimate RMB
9.42 ($1.33)
kraneshares.eu 34europe@kraneshares.com +31 (6) 492 496 89 Baidu continues to face headwinds from the low levels of economic activity stemming from the pandemic. The search and online advertising businesses as a whole have yet to recover from the pandemic as a great deal of their advertising revenue is sourced from businesses situated in the brick-and-mortar economy. Alibaba, JD.com, and other E-Commerce companies effectively operate their own search engines for the sellers on their platforms, preventing standalone search engines from participating fully in the E-Commerce boom. However, despite falling on a year-over-year basis, the company’s revenue in the quarter actually beat estimates. The revenue beat comes mostly on the back of Baidu’s cloud business, which saw increased usage and improved margins. NetEase Originally a gaming company, NetEase has expanded into a diversified internet conglomerate. The company’s products include PC games, mobile games, online education, and music streaming. NetEase is China’s second-largest games producer behind Tencent, has seen significant growth in the past few years, and continues to expand. kraneshares.eu 35
europe@kraneshares.com   +31 (6) 492 496 89

NetEase by The Numbers (Q2 2020)

•   Revenue +20% to RMB 18.18B ($2.57B) versus estimate RMB
    17.01B ($2.40B)

•   Net Margin 25% versus estimate 25%

•   Net Income RMB 4.54B ($0.64B) versus estimate RMB 4.24B
    ($0.60B)

•   Earnings Per Share RMB 34.58B ($4.88) versus estimate RMB

    32.33 ($4.57)

NetEase saw another quarter of strong growth. Mobile and PC
games revenue both grew by 21% YoY. CICC noted that NetEase’s
gaming growth is likely more sustainable post Covid-19 than peers,
including Tencent. Revenues for new, non-gaming businesses grew
+39% YoY, led by new business lines such as Cloud Music. Quarter-
over-Quarter(QoQ) margin increased from 21% in Q1 to 25% in Q2 as
management emphasized disciplined spending in their Q2 earnings

call.

kraneshares.eu                                                           36
europe@kraneshares.com +31 (6) 492 496 89 Citations: 1. Leung, Eleanor. “China - China Internet: Sector Outlook – Overweight,” CLSA. 2 September, 2020. 2. Research and Markets. “China’s Mobile Payment Industry – Mobile Payment Transactions in China Forecast to Reach RMB 777.5 trillion in 2020, surging by 31.8% on an Annualized basis,” Globe Newswire. 28 May, 2020. 3. 12 Vianet Group, Inc. Investor Presentation. June, 2018. 4. Data from Bloomberg as of 20/08/2020 5. Data from CICC Research as of August, 2020. 6. “China auto sales rise in July, as market regains momentum,” Associated Press. 11 August, 2020. 7. Wang, Yue. “China’s $7.6 Trillion Online Payments Market Is No Longer Enough For Jack Ma’s Ant Financial,” Forbes. 17 January, 2020. 8. iResearch China. “The Era of Industrial Payment: 2020 China’s Third-Party Payment Industry Report,” iResearch. 2020. 9. Ant Group. “Application Proof of ANT GROUP CO., LTD.” August 2020. (submitted to Hong Kong Exchanges & Clearing) 10. Liu, Jerry. “China Internet Sector: Read through from Ant IPO filing to Alibaba and Tencent,” UBS Equity Research. 3 September, 2020. 11. CNBC, “Games help Tencent smash second-quarter earnings expectations as potential WeChat ban looms”, 12 August, 2020. 12. Murphy, Cinthia. “A China Internet ETF You Should Know,” CNBC. 22 June, 2017. 13. Yu, Jeanny. “China Traders Are Buying Hong Kong Stocks Like Never Before,” Bloomberg News. 26 May, 2020. 14. Based on data reported by CICC. 15. Reported by Ali Health as of 30 June, 2020. 16. Statista as of 2018. kraneshares.eu 37
europe@kraneshares.com     +31 (6) 492 496 89

Definitions:
Dow Jones Internet Composite Index: The Dow Jones Internet Composite Index
is designed to measure the performance of the 40 largest and most actively
traded stocks of U.S. companies in the internet industry. To be eligible for the
index, a company must derive at least 50% of cash flows from the internet. The
index was launched on 18 February, 1999.
The CSI Overseas China Internet KWEB’s Index: The CSI Overseas China
Internet KWEB’s Index selects overseas listed Chinese Internet companies
as the index constituents; the index is weighted by free float market cap. The
index can measure the overall performance of overseas listed Chinese Internet
companies. The Index is within the scope of the IOSCO Assurance Report as at 30
September 2018. The index was launched on 20 September, 2011.
Price to Earnings Growth (PEG): is a stock’s price-to-earnings (P/E) ratio divided
by the growth rate of its earnings for a specified time period. The PEG ratio is
used to determine a stock’s value while also factoring in the company’s expected
earnings growth, and it is thought to provide a more complete picture than the
more standard P/E ratio.
Compound Annual Growth Rate (CAGR): is the mean annual growth rate of an
investment over a specified period of time longer than one year. It represents
one of the most accurate ways to calculate and determine returns for individual
assets, investment portfolios, and anything that can rise or fall in value over
time.
Penetration Rate: is the percentage of the relevant population that has
purchased a given brand or category at least once in the time period under study.
Revenue: is the income generated from normal business operations and
includes discounts and deductions for returned merchandise. It is the top line or
gross income figure from which costs are subtracted to determine net income.
Net Income: also called net earnings, is calculated as sales minus cost of
goods sold, selling, general and administrative expenses, operating expenses,
depreciation, interest, taxes, and other expenses. It is a useful number for
investors to assess how much revenue exceeds the expenses of an organization.
Earnings Per Share (EPS): A company’s profit divided by its outstanding
shares of stock. The resulting number serves as an indicator of a company’s
profitability.
Operating Income: The income that a company generates from daily operations.
Gross Profit: A company’s profit after deducting the costs associated with selling
and marketing its goods and/or the cost of providing its services.
Gross Margin: A company’s total sales revenue after deducting direct costs, or
the cost of goods sold.
Net Margin: The amount of income or profit generated by a company as a
percentage of revenue.

                                                                       R-KS-DMS
kraneshares.eu                                                                    38
ABOUT KRANESHARES
Krane Funds Advisors, LLC is the investment manager
for KraneShares ETFs. Our suite of China focused ETFs
provides investors with solutions to capture China’s
importance as an essential element of a well-designed
investment portfolio. We strive to provide innovative, first to
market strategies that have been developed based on our
strong partnerships and our deep knowledge of investing.
We help investors stay up to date on global market trends
and aim to provide meaningful diversification. Krane Funds
Advisors, LLC is majority owned by China International
Capital Corporation (CICC).
ABOUT CICC
In 2017, China International Capital Corporation (CICC)
formed a strategic partnership with Krane Funds Advisors,
LLC, becoming the largest shareholder. CICC is a leading,
publicly traded, Chinese financial services company with
expertise in research, asset management, investment
banking, private equity and wealth management. Founded
as the first Sino-US joint venture investment bank in 1995
with Morgan Stanley and China Construction Bank as the
largest initial shareholders. Today CICC is majority owned
by China Investment Corporation (CIC), the second largest
sovereign wealth fund with over $900 billion AUM. In
2018, The CICC Research Team ranked #1 in Institutional
Investor’s All-China Research Category for the seventh
year in a row. CICC has over 200 branches across Mainland
China, with offices in Hong Kong, Singapore, New York, San
Francisco, and London.
europe@kraneshares.com +31 (6) 492 496 89You can also read