The impact of Electrically Chargeable Vehicles on the EU economy - A literature
←
→
Page content transcription
If your browser does not render page correctly, please read the page content below
March │ 2017

The impact of Electrically
Chargeable Vehicles on
the EU economy
A literature     review   and
assessment

Study prepared for ACEA
March 2017

Table of contents

Section

1.    Executive Summary                                                                        1

2.    Overview of Electrically Chargeable Vehicles                                             4

3.    ECV market development                                                                   8

4.    ECV take-up projections for the EU                                                     20

5.    Impact of different scenarios on the EU automotive sector value chain and
      macroeconomic indicators                                               22

                                        Copyright 2017 FTI Consulting LLP. All rights reserved.

                                         FTI Consulting LLP. Registered in England and Wales at
                                          200 Aldersgate, Aldersgate Street, London EC1A 4HD.
                                  Registered number OC372614, VAT number GB 815 0575 42.
                    A full list of Members is available for inspection at the registered address.
March 2017
1. Executive Summary
1.1 Electrically Chargeable Vehicles (“ECVs”) include Plug-in hybrids (“PHEVs”), Battery Electric
Vehicles (“BEVs”) and Hydrogen Fuel-Cell Vehicles (“FCEVs”). ECVs can greatly reduce
emissions associated with driving and are capable of being emission free (depending on the
sources of electricity and hydrogen they use). As a result, they are expected to play a major
part in the EU’s decarbonisation efforts.
ECVs depend on subsidies which appear to be less comprehensive in the EU than in other
key markets
1.2 Governments around the world have been trying to help overcome the still significant barriers
to the widespread uptake of ECVs. These barriers include concerns over recharging and
vehicle range, as well as the cost of vehicle which is still around double of comparable
vehicles.
1.3 Both China and the US offer a wider range of subsidies and financial incentives to consumers
and vehicle manufacturers. The US also provides financial support to infrastructure investors,
while in China the government drives the roll-out of charging infrastructure. Currently, the EU
only provides financial support to consumers but it has introduced the Clean Power for
Transport Directive to develop national policy frameworks to drive market uptake and
infrastructure development. Contrary to the US and China, the EU does not provide financial
support to vehicle manufacturers.
Uptake of ECVs is slow and the EU is falling behind China
1.4 In the last decade global registrations of ECVs, led by the US, the EU and China, have
increased from less than two thousand units in 2005 to over half a million by 2015. Despite
accelerating growth in the last 5 years, ECV registrations still accounted for less than 1% of
global car registrations in 2015.
1.5 While the US was an early leader in ECV sales, between 2012 and 2014 the EU registered
larger numbers of ECVs than both the US and China. China however has seen the fastest
growth in the last five years, and in 2015, for the first time, it registered more ECVs than any
other country.
There is a very high degree of uncertainty around the future uptake of ECVs in the EU
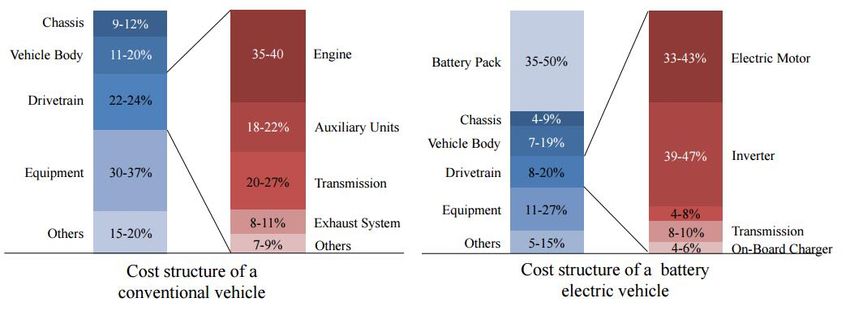
1.6 We reviewed 7 relatively recent studies which provide forecasts/scenarios for the future
uptake of ECVs in the EU. These studies show a very high level of uncertainty around the
future market shares of ECVs in new car registrations:
Impact of ECVs on the EU economy| 1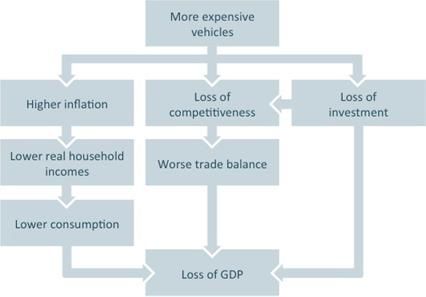
March 2017

       (1)   forecasts and scenarios range widely and the disparity increases significantly in later
             years. For example, the ECV market shares in 2020 range from 0% to 21%. By 2030
             this range increases to 6%-43%;

       (2)   the most optimistic scenarios, especially from earlier studies, are in stark contrast with
             current, very low market shares;

       (3)   the most recent studies are less optimistic, with market share scenarios in 2030
             ranging from 6% to 25% (compared with 6%-43% for the full sample); and

       (4)   the least optimistic scenarios can envisage very little ECV market development.

1.7    The large differences across the forecasts/scenarios are driven by assumptions around the
       evolution of battery costs, charging infrastructure roll-out and intensity of government support.
       All these factors have a major impact on the take-up of ECVs. For example, the influence of
       government support has been clearly demonstrated by the collapse of PHEV sales in the
       Netherlands when company car tax breaks were significantly reduced in 2016.

       Studies expecting a positive impact of ECVs on EU employment and GDP rely on some
       critical assumptions

1.8    The macroeconomic impact on the EU of electric vehicles is likely to be significant. ECVs
       represent a major change in technology and infrastructure which poses a challenge to EU
       manufacturers whose technological leadership relates to conventional technologies.

1.9    The majority of studies assessing the impact of ECVs on the EU economy project positive
       impacts on GDP, employment and trade balance and negative impact on government tax
       receipts. However, all of these studies rely on some critical assumptions including:

       (1)   the EU retains its technological leadership;

       (2)   ECVs are at least as labour intensive as conventional vehicles; and

       (3)   the value-add of ECVs will be higher than the value-add of conventional technologies.

1.10   At this point, these assumptions appear optimistic. For example, the majority of the value-
       differential between ECVs and conventional vehicles is accounted for by the battery and in
       2014, the EU produced only 6% of the world’s lithium ion batteries. Asian suppliers have also
       made a head-start in other components of the electric powertrains which are different from
       conventional technologies. Finally, many sources suggest that conventional technologies are
       more labour intensive than ECVs.

1.11   In contrast to those studies, a recent analysis prepared on the Future of the Automotive
       Industry for the German Bundestag has very different assumptions:

                                                                    Impact of ECVs on the EU economy| 2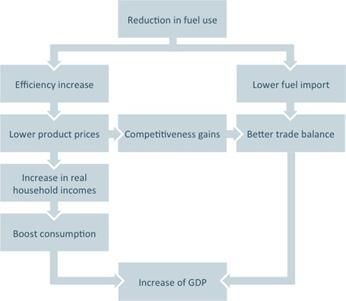
March 2017

       (1)   ECVs do not have a higher value add than conventional technology; and

       (2)   in the ambitious ECV scenario German producers lose global market share as they
             “surrender” in the growth markets, in particular, in China, due to increasing
             competition.

1.12   In the scenario where ECVs achieve a significant market share, Germany retains a much
       smaller value of the global car industry than in the scenario where conventional technology
       continues to dominate. The impact on employment in 2030 can range from a decline of
       131,000 to an increase of 267,000 depending on productivity growth, the share of import in
       the value of ECVs and the share of German OEMs in foreign value-add.

                                                                Impact of ECVs on the EU economy| 3
March 2017

2.        Overview of Electrically Chargeable Vehicles

          Historical development of drivetrain technologies

2.1       The internal combustion engine (“ICE”) is still by far the most dominant drivetrain technology
          used in vehicles today. However, several other technologies using different fuel sources are
          being developed.

2.2       The first commercially viable Alternative Fuel Vehicles (“AFVs”) emerged in the wake of the oil
          shocks of 1960s and 1970s,1 and are still based on combustion. They use Liquefied Natural
          Gas (“LNG”), Compressed Natural Gas (“CNG”), Liquefied Petroleum Gas (“LPG” or “Autogas”),
          Biodiesel or Ethanol, and are generally less carbon-intensive and less dependent on petrol
          and diesel than conventional ICEs.

2.3       Developments in battery technology and fuel cells brought about the second generation of
          AFVs which began to utilise electricity and are commonly referred to as Electrified Vehicles
          (“EVs”). Conventional hybrid vehicles (“HEVs”), which include both a conventional engine and
          a battery powered electric motor, were the first of these technologies to emerge commercially
          with the launch of the Prius in 1997. They were followed by Plug-in hybrids (“PHEVs”), Battery
          Electric Vehicles (“BEVs”) and Hydrogen Fuel-Cell Vehicles (“FCEVs”).

2.4       PHEVs, BEVs and FCEVs are together referred to as Electrically Chargeable Vehicles (“ECVs”).
          ECVs can greatly reduce the emissions associated with driving, with both electric and
          hydrogen cars capable of being emission free (depending on the sources of electricity and
          hydrogen they use).

          Technological overview of ECVs

2.5       Electrically chargeable vehicles have three major pieces of additional technology compared
          with conventional vehicles: an electric motor, a battery, and regenerative brakes.

2.6       The electric motor is responsible for putting the electrical energy to work, accelerating the car.
          It can also be used to produce electricity while the vehicle is decelerating. Electric motors
          have some advantages over conventional combustion engines. They are more efficient in
          converting energy into usable power (80% conversion rate for an electrified vehicle compared
          with around 20% for a conventional vehicle), lower maintenance costs and lower noise levels
          (at low speeds).

      1   http://www.scientificamerican.com/article/natural-gas-vehicles-could-ease-energy-crisis/

                                                                           Impact of ECVs on the EU economy| 4
March 2017
2.7 The battery stores the electrical energy, and is generally reliant on Lithium-Ion technology (“Li-
ion”). These batteries are heavy, lose maximum charge over time, and are expensive to
produce. They are also less energy dense than alternative combustible fuels or hydrogen, and
therefore the driving range of battery electric vehicles is usually lower than that of other types
of cars. For these reasons batteries have been a major obstacle hindering the development of
electric cars.
2.8 Electric vehicles generally all feature regenerative braking, which helps keep the battery in
electric vehicles charged. In conventional cars, energy is lost as heat to the brake pads when
slowing down. Regenerative brakes convert some of this energy to electricity which is then
used to charge the battery.
Table 2-1: Technology behind different drivetrains
Internal Electrical
Drivetrain Electrical Exhaust Recharging Regenerative
combustion Gear box energy
technology motor system technology brakes
engine source
Yes, dual
Internal clutch or 8-
combustion Yes No 10-speed Yes n/a n/a No
engine automatic
transmission
Regenerative
brakes, DC
Plug-in hybrid Yes Yes Yes Battery Yes
Yes current
charger
Regenerative
Battery Yes, but at
brakes, DC
electric No Yes maximum No Battery Yes
current
vehicle 2-speed
charger
Hydrogen fuel
No Yes No Hydrogen n/a No
cell Yes
Source: Summary by FTI
Different types of ECVs
2.9 PHEVs are powered by an electric motor and an internal combustion engine. The battery can
be charged from the grid, and the combustion engine supports the electric motor when higher
operating power is required or when the battery's state of charge is low.
2.10 The electric driving range is smaller than for BEVs, as the batteries tend to have smaller
capacities. The batteries can have less energy storage capacity than in a BEV because they
rely less on electrical power alone to power the vehicle. The battery capacity in PHEVs is
designed more for short trips in the city or commuting, for example, than for long-distance
journeys.
Impact of ECVs on the EU economy| 5March 2017
2.11 The environmental impact of PHEVs depends on their operation mode. Running in all-electric
mode results in zero exhaust emissions, but relying only on the conventional engine can lead
to fuel consumption and emission levels equal to or higher than those of conventional
vehicles of a similar size, because the additional batteries increase the vehicle mass. The
overall environmental performance of PHEVs depends greatly on the share of renewables in
the electricity generation mix.
2.12 BEVs are powered solely by an electric motor, using electricity stored in a battery. The battery
must be regularly charged, typically by plugging in the vehicle to a charging point connected to
the local electricity grid. BEVs have the highest energy efficiency and are typically able to
convert around 80% or more of the energy stored in the battery into motion.
2.13 There are no exhaust emissions while driving a battery electric vehicle. The greatest benefits
for the environment occur when BEVs are powered by electricity from renewable sources.
However, there are fewer emissions even when electricity comes from the average mix of
renewables and fossil fuels used presently in Europe (EEA, 2016a).
2.14 BEVs, however, still have somewhat limited driving ranges compared to conventional vehicles
and typically need a long time to recharge the batteries. BEVs tend to have large batteries to
maximise the energy storage capacity and increase driving ranges. These large batteries
generally cost more than those used in hybrids. However, battery costs per kilowatt-hour
(kWh) tend to be less expensive for BEVs.
2.15 FCEVs are also entirely propelled by electricity. In this case, the electrical energy is not stored
in a large battery system, but is instead provided by a fuel cell 'stack' that uses hydrogen from
an on-board tank combined with oxygen from the air. The main advantages of FCEVs over
BEVs are their longer driving ranges and faster refuelling, similar to those of a conventional
vehicle. Because of the current size and weight of fuel cell stacks, FCEVs are better suited for
medium-sized to large vehicles and longer distances. Fuel cell stack technology is in an earlier
stage of development than the technologies described above and few models of FCEVs are
currently commercially available. Further technological development is needed for FCEVs to
improve their durability, lower the costs and establish a hydrogen fuelling infrastructure,
including standalone stations or pumps for hydrogen. Indicative electric driving range: 160–
500 km.
Impact of ECVs on the EU economy| 6March 2017
2.16 The advantages and disadvantages of electrically chargeable vehicles are summarised in
Table 2-2 below.
Table 2-2: Advantages and disadvantages of electrically chargeable vehicle models
Drivetrain Bestselling model Indicative e- Advantages Disadvantages
technology (EU, 2016) driving range
Plug-in Hybrid Mitsubishi Outlander Higher efficiency
Vehicle Home/workplace
(PHEV) 20-85 km recharging Tech complexity
Many refuelling
stations
Battery Renault Zoe Higher efficiency
Fewer recharging
Electric Home/workplace
stations
Vehicle (BEV) 80-400 km recharging
Long time to recharge
Low engine noise
Short driving range
Zero emissions
Hydrogen Fuel Hyundai Tuscon Limited commercial
Cell (FCEV) Higher efficiency availability
160-500 km Low engine noise Lacking refuelling
Zero emissions stations
Tech complexity
Sources: EEA, FTI analysis, ACEA, Toyota, Mitsubishi, Nissan and Hyundai.
Impact of ECVs on the EU economy| 7March 2017
3. ECV market development
Introduction
3.1 Over the last ten years, global registrations of ECVs, driven by the US, EU and China, have
increased from less than two thousand units in 2005 to over half a million by 20152. Despite
accelerating growth in the last 5 years, ECV registrations still accounted for less than 1% of
global car registrations in 2015. While the US was an early leader in ECV sales, between 2012
and 2014 the EU registered larger numbers of ECVs than both the US and China. This trend
came to a halt in 2015 when China, for the first time, registered more ECVs than any other
country.
Figure 3-1: Global registrations of ECVs
Source: International Energy Agency. (IEA) and European Alternative Fuels Observatory
(EAFO). Rest of the World data is driven by Norway.
2 Global EV Outlook 2016, International Energy Agency,
https://www.iea.org/publications/freepublications/publication/Global_EV_Outlook_2016.pdf
Impact of ECVs on the EU economy| 8March 2017
3.2 Registration of ECVs is highly concentrated; with the EU, the US and China accounting for 92%
of the world’s ECV registrations in 20153.
ECVs in the EU
3.3 In the EU, ECV registrations increased from 11,362 units (0.09% share of total registration) in
2011 to 209,446 units (1.43% share of total registration) in 2016. As shown by Figure 3-2,
2015 was the first year that the registration of plug-in hybrids surpassed that of battery
electric vehicles. Plug-in hybrids continued to lead sales of ECVs in 2016.4
Figure 3-1: EU registrations of electric vehicles
Source: EAFO
3.4 The bestselling BEV in 2016 was the Renault Zoe, which sold over 21 thousand units and is
currently priced at around €21,7005. The Tesla Model S is one of the more expensive ECVs on
the market, selling for around €65,300. The most popular PHEV in 2016 was the Mitsubishi
Outlander which sold over 21 thousand units and starts at €40,000. In comparison, few
FCEVs were sold by Hundai and Toyota in 2016.
3 Global EV Outlook 2016, International Energy Agency,
https://www.iea.org/publications/freepublications/publication/Global_EV_Outlook_2016.pdf
4 http://www.eafo.eu/vehicle-statistics/m1
5 All EU car prices are quoted as the current price in Germany.
Impact of ECVs on the EU economy| 9March 2017
Table 3-1: EU ECV registrations by make and model, 2016
BEV PHEV FCEV
Rank
Make Model Registrat. Make Model Registrat. Make Model Registrat.
1 Renault Zoe 21,337 Mitsubishi Outlander 21,328 Hyundai ix35 83
2 Nissan Leaf 18,557 Volkswagen Passat 13,248 Toyota Mirai 64
3 Tesla Model S 12,353 Volkswagen Golf 11,351
4 BMW i3 9,726 Mercedes C350e 10,231
5 Volkswagen e-Golf 6,666 Volvo XC90 9,586
6 Kia Soul EV 4,433 BMW 330e 8,702
7 Tesla Model X 3,688 Audi A3 e-Tron 6,894
8 Mercedes B250e 3,504 BMW 225xe 5,915
9 Volkswagen e-Up! 2,565 BMW X5 40e 5,393
10 Peugeot iOn 1,893 BMW i3 Rex 5,322
Other 6,536 20,071
Total 91,258 118,041 147
Source: eafo.eu/vehicle-statistics. Accessed on 23 February 2017.
3.5 Figure 3-3 shows combined BEV and PHEV sales in key Member States. We provide data for
Norway as well which has an exceptionally high share of ECVs in new car registrations.
3.6 Following 2013, registrations grew strongly in each of the top Member States except for in the
Netherlands. While in the last 6 years the Netherlands has been in the forefront of ECV sales,
its sales have been volatile. It recorded steep declines in 2013, and in 2016 when BEV and
PHEV sales declined by nearly 50% compared with sales in 2015.
Impact of ECVs on the EU economy| 10March 2017
Figure 3-3: BEV and PHEV sales in key EU Member States plus Norway, 2011-2015
50,000
45,000
40,000 France
35,000 Germany
30,000 Italy
25,000 Netherlands
20,000 Norway
15,000 Spain
10,000 Sweden
UK
5,000
-
2011 2012 2013 2014 2015 2016
Source: EAFO
3.7 Table 3-2 shows the evolution of BEV sales in the key EU Member States and in Norway. While
initially BEVs have enjoyed a higher market share in the EU, the latest sales data appear
mixed. In particular, BEVs appear to be losing attraction to PHEVs in Norway, the largest ECV
market in Europe, despite unchanged subsidies for BEVs and PHEVs. BEVs continue to remain
the preferred technology in France, potentially because French carmakers have not
succeeded in launching a PHEV yet. 6
Table 3-2: BEV sales in key EU Member States plus Norway
2016
2011 2012 2013 2014 2015 2016 / 2015
France 2,256 5,240 8,556 10,544 17,269 21,776 26%
Germany 1,404 2,214 5,311 8,348 12,097 11,243 -7%
Italy 113 459 794 1,040 1,451 1,376 -5%
Netherlands 766 754 2,429 2,853 3,168 4,029 27%
Norway 1,837 4,181 8,201 18,086 25,792 24,224 -6%
Spain 505 326 793 1,015 1,422 2,021 42%
Sweden 72 137 391 1,188 2,978 2,945 -1%
UK 919 1,070 2,494 6,680 9,936 10,375 4%
Source: EAFO
6 AID Newsletter, Europeans are turning to PHEVs, 21 September 2016.
Impact of ECVs on the EU economy| 11March 2017
3.8 Table 3-3 shows the evolution of PHEV sales in the key EU Member States and in Norway.
PHEVs have shown relatively consistent increases across the key Member States, accelerating
in later years, except in the Netherlands where a steep decline was observed since company
car tax breaks were significantly reduced in 2016.
Table 3-3: PHEV sales in key EU Member States plus Norway
2016
2011 2012 2013 2014 2015 2016 / 2015
France - 601 834 2,068 5,518 7,429 35%
Germany 241 1,157 1,620 4,390 11,111 13,369 20%
Italy 3 101 209 446 891 1,445 62%
Netherlands 15 4,326 20,164 12,465 41,280 18,846 -54%
Norway 1 333 323 192 7,819 20,664 164%
Spain - 60 79 101 869 1,641 89%
Sweden - 603 1,103 438 5,712 10,470 83%
UK 7 922 895 1,712 18,737 28,618 53%
Source: EAFO
ECVs in the US
3.9 The US was the early leader in the take up of ECVs, both in terms of volume and market
share. In 2011 it registered 17,730 ECVs, which constituted 0.29% of US new car
registrations at the time. By the end of 2015 annual registration had reached 113,870 units
and achieved a market share of 1.50%. Figure 2-4 shows the general upward trend in the
market share of ECVs since 2011, with a sharp drop in PHEV registrations in 2015. This
decline in registration and market share in 2015 may be a result of average US gas prices
falling by about 60% in the second half of the year.7
7 http://www.gasbuddy.com/Charts [17/10/16]
Impact of ECVs on the EU economy| 12March 2017
Figure 3-4: US registrations of electric vehicles
Source: International Energy Agency. Accessed on 25 October 2016.
3.10 The US and EU’s ECV markets both have a similar range of cars available. The all-time top
selling BEV in the US is the Nissan Leaf, which has sold 95,384 units since it was brought to
market in 2011, and starts at $29,000 (€26,000). One of the more upmarket cars available,
the Tesla Model S, was the bestselling ECV in 2015. The top selling PHEV is the Chevrolet Volt,
with sales of 98,558 so far and a price of $33,000 currently (€29,000).
3.11 The electric car market in the US is dominated by established car manufacturers. The top ten
ranked ECV manufacturers by sales are made up almost exclusively of companies that are
primarily ICE vehicle manufacturers 8. The only notable exception to this is Tesla. Smaller start-
ups are beginning to enter the market, some of whom, such as Faraday Future, are funded by
Chinese investors, but are still a few years away from selling their first car.9
8 http://www.cheatsheet.com/automobiles/10-car-companies-that-sell-the-most-electric-
vehicles.html/?a=viewall
9 http://fortune.com/2016/06/14/electric-car-startups-fueled-by-chinese-money-aim-to-catch-tesla/
Impact of ECVs on the EU economy| 13March 2017
China
3.12 China has seen the largest increase in ECV market share in recent years. As of 2015 it
accounted for 38% of global ECV registrations, up from 11% in 2011. This is a result of
registrations increasing from 5,070 to 207,380 between 2011 and 2015 and the combined
market share of BEVs and PHEVs going from 0.04% to 0.98%. Figure 2-5 shows the
exponential increase in registrations that China has experienced over the last few years.
Figure 3-5: China registrations of electric vehicles
Source: International Energy Agency
3.13 Production data of passenger cars and commercial vehicles show that 2016 is going to be an
outstanding year for Chinese ECV production. In the first 9 months of 2016, BEV production in
China increased by 118% and PHEV production by 43%. The data also show that ECV
consumption is nearly completely satisfied with domestic production: there were 216,000
BEV vehicles and 73,000 PHEV vehicles sold in China in the first 9 months of 2016.
Impact of ECVs on the EU economy| 14March 2017
Table 3-4: ECV production in China (passenger cars and commercial vehicles)
2015 Jan-Sep 2015 Jan - Sep 2016 Growth
BEV 290,700 105,200 229,000 118%
PHEV 88,200 51,100 73,000 43%
FCEV - - -
ECV 379,000 156,200 302,000 93%
Total PC &
CV 24,503,300 17,091,600 19,422,000 14%
% ECV 1.55% 0.9% 1.6%
Source: ACEA (China)
3.14 The Chinese ECV production is more diverse than those of the EU and the US. Manufacturers
range from established makers of ICE vehicles, such as BYD Auto, to start-ups, such as WM
Motor, focussing specifically on ECVs. BYD Auto, which sells cars such as the Tang and the Qin
which sold 22,166 and 12,160 units respectively, posted revenues of rmb 80 billion (€11bn)
in 201510,11. WM Motor was founded in 2015 and has raised $1 billion in initial funding with a
view to introducing its first car in 2018.
3.15 This variety of manufacturers is likely to fall in the near future as the Ministry of Industry and
Information Technology (MIIT) is considering limiting the number of ECV start-ups to just ten.
There are currently around 200. This is expected to be achieved by imposing stricter
technology standards to try and prevent manufacturers who lack the requisite technical
knowledge from entering the market.12
3.16 As of August 2016, only two start-ups have been granted permits to manufacture cars, with
three more saying that they intend to apply. The Chinese government plans to phase out
subsidies by 2020, thereby removing one of the incentives to enter the ECV market. The
newspaper of the State Council says that 90% of companies currently developing ECVs will not
meet the required standards within the next two years. 13
10 http://evobsession.com/kandi-ev-1-electric-car-china-june/
11 https://www.statista.com/statistics/279209/revenue-of-byd-auto-in-china/
12 http://www.bloomberg.com/news/articles/2016-08-28/most-of-china-s-electric-car-startups-face-
wipeout-by-new-rules
13 https://www.bloomberg.com/news/articles/2016-08-28/most-of-china-s-electric-car-startups-face-
wipeout-by-new-rules
Impact of ECVs on the EU economy| 15March 2017
3.17 It is also a market dominated by domestic producers; the Tesla Model S was the bestselling
non-Chinese car in 2015 but it was only 19th when ranked alongside Chinese ECVs. The most
popular ECV so far in 2016 is the BYD Tang which has sold 22,166 units and has a price of
rmb 300,000 (€40,000). The cheapest ECV sold in China is the BAIC E-Series EV and costs
significantly less, starting at rmb 60,000 (€8,100) and selling 11,333 units in the first half of
2016.14,15
Incentives
3.18 Governments around the world are helping to overcome the still significant barriers to the
widespread uptake of ECVs. With the price of ECVs being around double the price of
comparable ICE vehicles16, consumers are continuing to choose the latter, despite their
operating costs being much higher (almost triple in some cases). These barriers are not just
financial however. According to a study by the United Kingdom’s Department for Transport
(DfT) in 2015, respondents were deterred from buying an ECV primarily because of concerns
over recharging (39%) and vehicle range (36%), with cost (27%) considered less important
than both of these17. This indicates that more than just the price of ECVs will have to change
before uptake reaches the levels many countries are aiming for.
3.19 Governments are acting to implement these changes with policies ranging from price
subsidies to investment in infrastructure. They are also introducing non-financial incentives
such as access to restricted traffic zones and, in China, preferential access to car license
plates which are notoriously difficult to get. Progress on developing charging infrastructure is
proceeding more slowly. This may be a result of the high installation costs not being seen to
be justified by the still relatively low uptake in ECVs. Fast charging stations can cost up to
$100,000 each and come with rigorous planning requirements. 18
3.20 National governments seem to be becoming more ambitious however. By 2020, Croatia plans
to build 164 charging stations which is equivalent to 1 every 50km, more than enough to
alleviate any concerns about range, while China aims to build 4.8 million stations, which
would be a 100-fold increase on its current capacity.
14 http://www.carnewschina.com/2013/05/03/beijing-auto-e-series-sedan-hits-the-chinese-car-market/
15 http://evobsession.com/kandi-ev-1-electric-car-china-june/
16 Currently, the price of a Honda Civic (petrol) is around €17,000 in Germany. The price of a comparable
battery electric vehicle, the Nissan Leaf Tekna (30 kWh) is nearly €37,000
17 https://www.gov.uk/government/uploads/system/uploads/attachment_data/file/435980/public-
attitudes-evehicles.pdf.pdf
18 http://cleantechnica.com/2014/05/03/ev-charging-station-infrastructure-costs/
Impact of ECVs on the EU economy| 16March 2017
ECV incentives in the US
3.21 The US provides incentives to consumers, manufacturers and infrastructure investors.
3.22 The federal structure of the US means that consumers have different incentives to buy ECVs
in different states. The federal government offers everyone a $7,500 (€6,700) income tax
credit when buying ECVs; but there are also various state level incentives in place. These
range from an additional $5,000 (€4,500) tax credit to carpool lane access and reduced
battery charging rates.19 These are aimed at offsetting the cost disadvantage faced by ECV
manufacturers.
3.23 The US also provides incentives to ECV manufacturers. The Advanced Technology Vehicles
Manufacturing programme provides grants and direct loans to qualifying vehicle and
component manufacturers. For example, Ford Motor Company is using a $5.9 billion loan to
upgrade factories across Illinois, Kentucky, Michigan, Missouri, and Ohio and to introduce new
technologies that will raise the fuel efficiency of more than a dozen popular vehicles. Nissan is
using a $1.4 billion ATVM loan to retool their Smyrna, Tennessee, manufacturing facility and
construct one of the largest advanced battery manufacturing plants in the United States. The
plant will be capable of producing 200,000 advanced-technology batteries a year.20
Borrowers pay the administrative costs related to the provision of the loan but all other costs
are paid by the Government.
3.24 The US is leaving it to private providers to establish charging stations, with the federal and
state governments providing tax credits, loan guarantees and cash grants. For example, Los
Angeles’ Department of Water and Power gives rebates of up to $4,000 per unit towards the
purchase of electric vehicle charging equipment.21
ECV incentives in the EU
3.25 Financial incentives for the purchase of ECVs in the EU primarily take the form of purchase
subsidies/rebates and tax exemptions for consumers (these range from full exemptions to
partial).22
19 https://www.tesla.com/support/incentives
20 https://energy.gov/lpo/services/atvm-loan-program
21 http://www.afdc.energy.gov/fuels/laws/ELEC/CA
22 Electric vehicles in Europe, European Environmental Agency (2016)
Impact of ECVs on the EU economy| 17March 2017
3.26 The Netherlands stands out with ECV sales representing by far the largest share of total new
car sales at nearly 10%. This reflects the wide range of tax exemptions available to Dutch
drivers and companies that use electric vehicles as their company cars.23 The UK sells the
second highest number of ECVs of which the majority is PHEVs. Sales have been supported
by subsidies of £5,000 up to March 2016, when the level of subsidies has been reduced to
£2,500-4,500.
3.27 France has the highest share of BEVs, again reflecting the relatively generous bonus under its
CO2-based bonus-malus car purchasing scheme which grants a tax return of up to €6,300 for
the purchase of BEVs and up to €4,000 for PHEVs. Germany has a very ambitious electro-
mobility scheme that aims for a million EVs (including hybrids) on its streets by 2020.24
However, it has only recently introduced incentives which are expected to increase demand in
2016. A summary of the different types of consumer subsidies provided in EU member states
can be found in Appendix 2.
3.28 The lack of financing models for the development of charging infrastructure is considered to
be one of the biggest obstacles to the widespread adoption of ECVs. 25 With the adoption of
the Clean Power for Transport Directive 26, the EU has taken steps to develop national policy
frameworks for the market development of alternative fuels and their infrastructure.
3.29 In the EU there are no subsidies to vehicle manufacturers (contrary to the policy approach
adopted by the US and China).
ECV incentives in China
3.30 The Chinese government offers a subsidy of up to 60,000 rmb (€8,000) towards the sale
price of an electric vehicle with some local governments providing further financial
incentives.27 In some Chinese cities, such as Beijing and Shanghai, ECV sales increased as a
result of their preferential access to registration plates. In Beijing, 40% of plates issued each
year are reserved for ECVs. This leaves for those who drive ICE vehicles, there is only a 1 in
725 chance of receiving a registration plate.
23 http://nederlandelektrisch.nl/financial-stimulation
24 https://www.bloomberg.com/news/articles/2016-04-27/germany-planning-1-4-billion-in-incentives-for-
electric-cars
25 Eurelectric, Charging Infrastructure for Electric Vehicles, July 2016.
26 Directive 2014/94/EU
27 http://www.bloomberg.com/news/articles/2013-09-17/china-renews-electric-vehicle-subsidies-without-
adding-hybrids
Impact of ECVs on the EU economy| 18March 2017
3.31 The structure of the subsidies available to Chinese ECV manufacturers is opaque. Company
accounts of BYD, which controls 80% of China’s PHEV market, show that it received rmb 2.9
billion (€387 million) from the Government between 2011 and 2015. This accounts for 45%
of the company’s net profit over this period28 confirming that China is taking an active interest
in the development of its domestic ECV manufacturers.
3.32 Similarly, incentives provided for infrastructure investment are unclear. It appears that a key
obstacle of ECV market development is the number of available charging stations and the
government continues to be the main driver behind the roll out of charging infrastructure. 29
3.33 In summary, both China and the US offer a wider range of subsidies and financial incentives
to consumers and vehicle manufacturers. The US also provides financial support to
infrastructure investors, while in China the government drives the roll-out of charging
infrastructure. Currently, the EU only provides financial support to consumers but it has
introduced the Clean Power for Transport Directive to develop national policy frameworks to
drive market uptake and infrastructure development. Contrary to the US and China, the EU
does not provide financial support to vehicle manufacturers.
28 http://www.forbes.com/sites/mclifford/2016/07/26/with-a-little-help-from-its-friends-lavish-chinese-
government-help-for-top-electric-car-maker-byd/#72effa771533
29 Electric vehicles in China: BYD strategies and government subsidies, Masiero et al., 2016 and
http://www.china-briefing.com/news/2016/05/11/china-shifts-gears-electric-vehicles.html
Impact of ECVs on the EU economy| 19March 2017
4. ECV take-up projections for the EU
ECV market share forecasts for 2015
4.1 Although many studies have been written on ECVs there are fewer which forecast the market
share of ECVs in new car sales or registrations. Figure 4-1 summarises the forecasts and
scenarios provided by 7 studies regarding the market share of ECVs in new car registrations
over time in Europe and compares them to the actual market shares achieved during 2011-
2016. Several observations can be made from this chart:
(1) forecasts and scenarios range widely and the disparity increases significantly in later
years. For example, the ECV market shares in 2020 range from 0% to 21%. By 2030
this range increases to 6%-43%;
(2) the most optimistic scenarios, especially from earlier studies, are in stark contrast with
current, very low market shares;
(3) the most recent studies are less optimistic, with market share scenarios in 2030
ranging from 6% to 25% (compared with 6%-43% for the full sample); and
(4) the least optimistic scenarios can envisage very limited ECV market development.
Figure 4-1: Market shares of ECVs in registrations, actual and forecast/scenario
Source: EAFO, ACEA, and the studies listed on the chart (see Appendix 1 for bibliography)
Impact of ECVs on the EU economy| 20March 2017
4.2 The main drivers of these differences are differing assumptions about battery costs,
infrastructure development and the level of government support. Table 4-2 summarises the
scenarios developed for 2030 and the assumptions that generated them.
Table 4-2: Market share scenarios for 2030, BEVs and PHEVs
Paper Forecasts Assumptions
Lowest forecast relates to ICE breakthrough scenario
in which ICEs reduce CO2 emissions at reasonable
costs. Highest forecast relates to the ECV
breakthrough scenario in which ECVs become cost
CE Delft (2011) 7% - 33%
competitive from 2020 onwards and fast charging is
offered throughout the EU from 2025. Government
subsidies are high until 2015 and are rapidly reduced
afterwards as costs go down.
Calculates the market share of ECVs that will be
Greenpeace (2012) 23% - 43% required to keep emissions at a sustainable level.
Germany focussed. Optimistic scenario assumes very
ambitious energy and climate conservation policies
Shell (2014) 14% - 25%
and examines the potential impacts of increased
electrification.
Key assumption is meeting existing policy
requirements with the lowest GHG abatement costs.
Roland Berger Two key scenarios mainly differ in assumptions on oil
6% - 10%
(2016) prices (€64-103 bbl) and technological improvement
(battery cost €99—109 / kWh and fuel cell cost
improvement).
Source: FTI analysis
Impact of ECVs on the EU economy| 21March 2017
5. Impact of different scenarios on the EU automotive sector value chain and
macroeconomic indicators
Introduction
5.1 The macroeconomic impact on the EU of ECVs is likely to be significant. ECVs represent a
major change in technology and infrastructure which poses a challenge to EU manufacturers
whose technological leadership relates to conventional technologies.
5.2 BEVs present the most radical departure from conventional ICE automobile design (see
section 1) and therefore a complete transition to BEVs would result in the largest change in
the automotive and energy industries. The economic impact of PHEVs can be expected to be
somewhat lower. In the following we describe the impacts of BEVs, the most commonly
discussed technology in the economic impact literature. 30
Mechanisms for ECVs to affect the macro-economy
5.3 A literature review by CE Delft prepared in 2012 notes that early studies on the economic
impact of electric vehicles relied on an unsophisticated argument that “EVs are more
expensive hence result in more value added and additional employment”:31
5.4 The mechanism through which ECVs impact the EU economy are significantly more complex.
The three main channels through which they affect the economy are:
(1) the switch to new technologies;
(2) the higher prices and lower mileage costs of hybrids and ECVs; and
(3) the lower fuel consumption of hybrids and ECVs.
5.5 The switch to new technologies has an impact on employment in manufacturing and in the
supply chain depending on how labour intensive these technologies are and whether
components are manufactured in the EU or outside. ECVs require new infrastructure to be
built and installed, which will have a positive impact on employment. Finally, the maintenance
requirements of ECVs are also different from those of conventional technologies which also
impacts employment in the EU.
30 We have not come across any study which separately discussed the impact of FCEVs on the EU
economy.
31 CE Delft, Literature review on employment impacts of GHG reduction policies for transport, 2012
Impact of ECVs on the EU economy| 22March 2017
5.6 The higher prices of new technologies are expected to lead to a fall in car purchase and a
decline in the competitiveness of EU manufacturers. The impact of these factors is negative
on direct employment. Higher prices also reduce real consumer disposable income available
for other products which reinforces the negative impact on EU wide-employment.
5.7 Low mileage costs are expected to increase car usage and lead to a positive impact on
indirect employment (service). They also have a positive impact on consumer disposable
income leading to increased EU wide employment. Finally, they have a positive impact on the
competitiveness of EU automotive manufacturers leading to increased direct employment.
5.8 Lower fuel import reduces employment in refining and gasoline stations but increases
employment in EU electricity production (in case of a switch to ECVs).
5.9 We summarise these impacts in Table 5-1 below.
Table 5-1: Employment impacts of moving towards BEVs
Driver Impact Mechanisms
Technological Potential Higher vehicle price for BEVs may result in lower employment as BEVs
change decrease may be less labour-intensive and batteries and other components may
be produced out of the EU
Maintenance/ Small Maintenance costs of BEVs are expected to be lower than that of ICEs
recycling decrease
Fuel import Small The switch to electricity from BEVs decreases employment in refining
increase and gasoline stations which is expected to be more than offset by
increased employment in the electricity generation sector
Infrastructure Increase There will be positive employment impact from the construction and
installation/maintenance of charging infrastructure
Higher purchase Decrease Higher purchase costs are expected to lead to a fall in car purchase and
costs to a negative impact on direct employment
Lower mileage Increase Lower mileage costs are expected to increase car usage and to a positive
costs impact on indirect employment
Consumer Unclear If the total cost of ownership of the car is reduced consumers will be able
spending to spend more on other goods
Innovation and Unclear It is not clear whether government induced innovation will increase the
competitiveness competitiveness of the EU car industry. Labour market issues in the EU
(aging population, lack of skilled engineers) may suggest the EU could be
more competitive in less labour intensive technologies such as BEVs
Source: FTI based on CE Delft (2012)
Impact of ECVs on the EU economy| 23March 2017
5.10 The above can be translated into 3 main channels affecting GDP and trade balance of the EU
economy. The first channel is through the switch to the new technology. Depending on
whether the new technology is more or less labour intensive than the old technology there will
be an impact on employment and therefore on consumer spending which will feed back into
GDP. Additionally, depending on where the components will be manufactured, in or out of the
EU, there will be further impacts on trade balance and GDP. This will also have an impact on
the EU’s attractiveness for further investment. Figure 5.1 below depicts this channel.
Figure 5-1: The impact of switching to a new technology on the EU economy
Source: FTI
5.11 The second channel is through the higher prices of ECVs which depress GDP. Higher prices
reduce consumers’ real income and therefore there will be lower real spending in the overall
EU economy. Additionally, higher prices are expected to have a negative impact on the
competitiveness of EU manufacturers, which would have a negative impact on trade balance
and on the inflow of investments. This channel is described in Figure 5-2 below.
Figure 5-2: The impact of more expensive ECVs on the EU economy
Impact of ECVs on the EU economy| 24March 2017
Source: CE and Ricardo –AEA, Figure 7.1
5.12 The third channel is through a reduction of fuel consumption in vehicles which has positive
impacts on the wider economy. The reduction in imports of fuels improves the trade balance
and boosts GDP. Additionally, the reduction in fuel costs lead to lower product prices
increasing the real income of consumers and the competitiveness of EU manufacturers. Both
lead to increased GDP (see figure 5-3).
Figure 5-3: Impact of reduction in fuel use on GDP and trade balance
Source: CE and Ricardo –AEA, Figure 7.2
Summary of literature on the impact of EVs on the EU macro-economy
5.13 There are many studies on the impacts of EVs on employment, GDP, trade balance and
government tax receipts in different regions. The vast majority of these studies project
positive impacts on GDP, employment and trade balance and negative impact on government
tax receipts (see Appendix 1 for a description of the studies). However, all of these studies rely
on some strong assumptions including, for instance, that in case of a switch to ECVs most of
the vehicles’ components will continue to be manufactured in the EU and that ECVs are as
labour intensive as conventional cars.
5.14 One exception is the analysis prepared for the Bundestag in 201332, which shows
employment impacts ranging from positive to negative depending on assumptions around
productivity growth and the share of import in the value of electric vehicles.
32 Bundestag, 24 May 2013, The future of the automotive industry, 17/13672
Impact of ECVs on the EU economy| 25March 2017
5.15 In the following we discuss the assumptions and the results of a key economic impact study
prepared by Cambridge Econometrics: Fuelling Europe’s Future. This study analyses various
scenarios including an ambitious ECV scenario where ECVs reach 100% market share by
2050. Table 5-2 shows that the impacts of the scenario on employment and GDP are positive.
Employment increases by 660 thousand to over 1 million by 2030 and by 2 million to 2.4
million by 2050. GDP increases by €41 billion to €72 billion by 2030 and by €223 billion to
€293 billion by 2050 (estimated in 2010 prices). The shortfall in tax receipts is estimated at
€260 billion in 2050 (the figure is not available for 2030).
Table 5-2: Economic impact of ECVs in the EU (Cambridge Econometrics)
Scenario description Employment GDP(1) Tax receipt
Ambitious ECV deployment: market 1,080,000 by 2030 €72 bn by 2030
share in sales of 9.5% in 2020, 80%
2,350,000 by 2050 €293 bn by 2050 - €260 bn in 2050
in 2030 and 100% by 2050
Note: (1) in 2010 prices.
Source: FTI summary of Cambridge Econometrics: Fuelling Europe’s future
5.16 The key drivers and assumptions in the study are the following:
(1) Europe keeps its technology leadership (and therefore car components will be
continued to be manufactured in Europe);
(2) Higher costs of technology has a negative impact on consumer and business spending
however the higher costs are value to European producers and to the motor vehicle
supply chain;
(3) Crude oil import was €350 billion in 2012 which would rise to €590 billion by 2030
and further still to €705 billion by 2050 based on price increases alone. 33 Most of the
oil value chain is located outside of Europe and what is in Europe has low labour
intensity;
(4) Reduced fuel consumption has a direct benefit to GDP from reduced imports of oil,
which improves the trade balance and boosts GDP. There are indirect benefits to
households and businesses, as lower business costs are passed on in the form of
lower prices;
(5) Infrastructure spending is large and directs consumer spending away from other EU
sectors. This negatively impacts consumers’ real income however infrastructure has
GDP positive impact given its much larger supply chain in Europe than those of other
industries.
33 Oil prices are based on IEA projections which, in the central case, show crude oil prices to increase from
€59 per barrel in 2010 to €105 per barrel by 2030.
Impact of ECVs on the EU economy| 26March 2017
5.17 In contrast, in the study prepared for the Bundestag the assumptions are very different:
(1) ECVs do not have a higher value add than conventional technology; and
(2) in the ambitious ECV scenario German producers lose global market share as they
“surrender” in the growth markets, in particular, in China, due to increasing
competition.
5.18 The main drivers of employment and GDP impact in the scenario in which ECVs reach
significant market share (more than 50% in new car sales in Germany by 2030), are
productivity growth, the import share of ECV components and the domestic value added share
of the cars manufactured abroad by German OEMs.34 According to this analysis, as long as
productivity growth is below the growth of value added of ECVs (assumed to be 2.7% per
annum) the employment impact is positive. On the contrary, when productivity growth
outpaces the growth of value creation, then the impact on employment is negative. Table 5-3
summarises these results.
Table 5-3: Employment impact of ECVs in Germany (Bundestag)
Scenario description 2020 2030
Productivity growth = 2% CAGR
Import share of ECV components = 10% 138,000 267,000
DE share in foreign production = 25%
Productivity growth = 2% CAGR
Import share of ECV components = 50% 91,000 192,000
DE share in foreign production = 10%
Productivity growth = 3% CAGR
Import share of ECV components = 10% - 31,000 - 80,000
DE share in foreign production = 25%
Productivity growth = 3% CAGR
Import share of ECV components = 50% - 68,000 - 131,000
DE share in foreign production = 10%
Source: FTI summary of Bundestag, 2013
5.19 In the following, we assess the key assumptions of the economic impact studies.
5.20 A key assumption in most studies related to the economic impacts of switching to ECVs is that
the increased costs of ECVs will manifest themselves as economic value to EU manufacturers.
This however requires that the EU transfer its technological leadership to the components of
electric vehicles.
34 The analysis focusses on the impact of alternative automotive industry pathways on the German
economy.
Impact of ECVs on the EU economy| 27March 2017
5.21 Some 26% of the EU’s total R&D spending is in automobiles and parts in 2014, worth €44.7
billion.35 The EU is also a world leader in automotive patents accounting for over 60% of
patents granted globally in 2015.
Table 4-3: Patents granted in automotive sector, 2015
Nation Patents granted Share of world
Germany 2,058 34.3%
France 609 10.2%
Italy 268 4.5%
Sweden 221 3.7%
UK 146 2.4%
Rest of EU 501 8.4%
EU 3,803 63.4%
Japan 1,291 21.5%
US 657 11.0%
China 90 1.5%
Rest of the world 155 2.6%
World 5996 100.0%
Source: ACEA
5.22 Despite Europe’s considerable leadership in automotive patents, it performs less well for
patents in electric vehicle related technologies: Japan accounts for 40% of EV related
patents36,37 and is world leader in Li-ion patents.38 There is also significant state support for
EV technology in the US, China and South Korea, where governments see electric vehicles
(and especially battery technology) as strategically important. 39 A transition towards ECVs may
therefore challenge Europe’s technological competitiveness in the automotive space.
5.23 The cost structure of ECVs is very different from that of conventional vehicles. For
conventional vehicles, equipment costs make up the largest share of costs at 30-37%, and
the drivetrain the second largest accounting for 22-24%. Currently the largest share of the
technological costs of electric vehicles is taken up by the battery, which accounts for 35-50%.
The second most expensive component is the drivetrain, including the electric motor, the
inverter, transmission, and on-board charger.
35 ACEA Pocket Guide, 2016-2017
36 http://www.oecd.org/officialdocuments/publicdisplaydocumentpdf/?cote=COM/TAD/ENV/
JWPTE(2013)27/FINAL&docLanguage=En
37 OECD (2010), Innovation in Electric and Hybrid Vehicle Technologies: The Role of Prices, Standards and
R&D
38 Canis (2013), Battery Manufacturing for Hybrid and Electric Vehicles: Policy Issues
39 http://www.oecd.org/officialdocuments/publicdisplaydocumentpdf/?cote=COM/TAD/ENV/
JWPTE(2013)27/FINAL&docLanguage=En
Impact of ECVs on the EU economy| 28March 2017
Figure 4-4: Vehicle cost breakdown, ICE versus BEV
Source: Fuchs et al (2014), An overview of costs for vehicle components, fuels and
greenhouse gas emissions
5.24 Cambridge Econometrics estimates that the total manufacturing cost (excluding manufacturer
and dealer margins) of a diesel ICE vehicle in 2015 is around 15,000 while that of a BEV is
around €27,000. Applying the cost breakdown in Figure 4-4 to these figures we calculate that
the battery pack accounts for nearly all of the €12,000 cost increase. This is shown in Figure
4-5 below.
Figure 4-5: Cost structure of ICEs vs BEVs
Source: FTI analysis based on Fuchs et al and Cambridge Econometrics data
Impact of ECVs on the EU economy| 29March 2017
5.25 In 2014, the EU produced only 6% of the world’s lithium ion batteries, with only four countries:
Japan, Korea, the US and China producing the remaining 94%.
Table 4-4: Li-ion battery production and capacity 2014, by country
Source: US Department of Energy
5.26 It is clear that on battery technology alone the EU faces significant challenges. Currently, a
significant share of the value of electric vehicles leaves the EU economy. On the other hand,
Transport & Environment reports40 new battery production facilities planned by Volkswagen in
Salzgitter (Germany); Samsung SDI in Hungary; and LG Chem in Wroclaw (Poland) and other
plans in development.
5.27 Moreover, the batteries and electric motors require specific raw materials, which are not
available in the EU (e.g. the vast majority of Lithium reserves are in Chile and Bolivia and
China dominates the reserves of rare earth).
5.28 Finally, the concentration of battery production in Asia brought about a cluster of part
manufacturers who specialised in developing the new electrified components and systems.
The ECV supply chain in the EU has some catching up to do which also provides challenges to
EU OEMs.
40 T&E, Electric vehicles in Europe, 2016
Impact of ECVs on the EU economy| 30March 2017
Assumption #2: Labour intensity of ECV production and maintenance
5.29 Studies estimating the impact of a switch to ECVs appear to assume that the production of an
electric car is at least as labour intensive as that of a conventional vehicle. For example,
Cambridge Econometrics suggests that the higher costs of ECVs create value to European
producers and to the motor vehicle supply chain (e.g. to producers of fuel efficient start-stop
mechanisms). Higher value-added is typically associated with employment gains.
5.30 In the EU, 3.1 million highly skilled jobs are in automotive manufacturing. Taking into account
the vast supply chain, 12.2 million jobs (or 5.6% of the EU workforce) are in the automotive
sector overall. These statistics highlight how an improvement or worsening in the EU’s
position in car manufacturing could significantly affect employment in the EU.
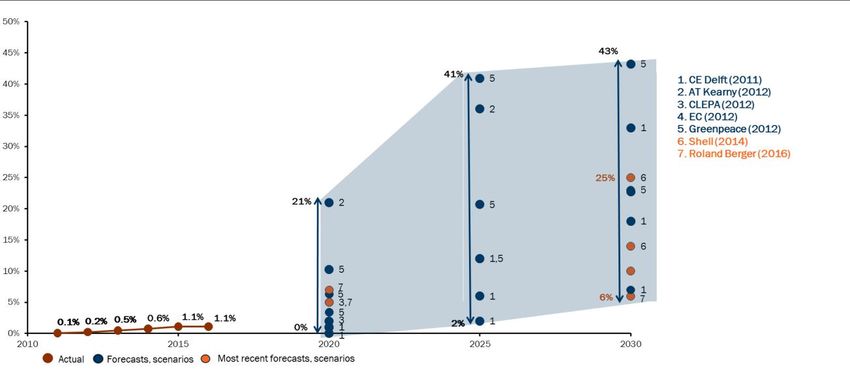
5.31 In a conventional vehicle material costs are estimated to be responsible for 47% of the total
costs of production, and direct labour is estimated to account for 21%.
Figure 4-5: Automotive cost components of a conventional vehicle
Source: AEP, via Market Realist
5.32 There are few estimates of the labour intensity of electric vehicles. A study by Friedrich-Ebert-
Stiftung in 2010 noted that then current German plants of ICE vehicles produced
approximately 200 motors per employee annually. A new German plant producing electric
motors (by Continental) produced 1500 motors/employee.41
41 Zukunft der deutschen Automobilindustrie Herausforderungen und Perspektiven für den Strukturwandel
im Automobilsektor, Friedrich-Ebert-Stiftung, 2010
Impact of ECVs on the EU economy| 31March 2017
5.33 The Tesla Factory is the principal production facility of Tesla Motors. The plant is located in the
East Industrial area of Fremont and employed around 6,000 people in June 2016. 42 On
August 3, 2016, Tesla Motors announced that it was consistently producing 2,000 vehicles
per week at the end of Q2 2016.43,44 At this rate, and noting that the factory is still ramping
up, the Tesla Factory is producing around 28 vehicles per employee annually. 45 (We note that
the manufacturing process uses more than 160 specialist robots, including 10 of the largest
robots in the world.)
5.34 The Volkswagen Wolfsburg plant produced around 815,000 vehicles and had over 73
thousand employees in 2015. Therefore, the Wolfsburg plant produced around 11 vehicles
per employee during 2015, which appears to be significantly lower than Tesla’s production
rate calculated above.
5.35 Volkswagen has recently announced 30,000 job cuts. One of the reasons appears to be that
“electronic vehicles are the future and they need less people to build them in the production
process”.46
5.36 Finally, we note that the maintenance of ECVs has also been found to be less labour
intensive. According to Sia (the French society of automotive engineers), every 1 million
electric vehicles in circulation destroys 1000 jobs in car maintenance.47
5.37 Similarly, Roland Berger expects that “electrification will have a dramatic effect on the whole
independent aftermarket value chain. Electric powertrains will consist of different technical
components compared to the conventional combustion engine. An electrical powertrain will
have less maintenance parts (e.g. oil filter) and less service fluids (e.g. motor oil). Also other
vehicle systems, for example, the braking system, will be less used by electrical vehicles due
to kinetic energy recuperation. This will have an impact on the spare parts volume, especially
for high runner maintenance parts (e.g. oil filter, fluids, brake discs and pads). Parts suppliers
of conventional combustion engine parts (e.g. filters, oil and engine components) will lose
volumes and have to reposition or will even not exist any longer”.48
42 Campbell, Angela (2016-06-09). "Tesla Motors Inc Workers Being Contacted by UAW For Union
Formation". The Country Caller. US.
43 "Tesla Second Quarter 2016 Update" (PDF). shareholder.com. 2016-08-03.
44 Wang, Robert Ferris, Christine (2016-08-03). "Tesla misses Wall Street targets, but logs gains in vehicle
production". CNBC.
45 (2,000 vehicles * 52 weeks)/6,000 employees
46 https://www.theguardian.com/business/2016/nov/18/volkswagen-axe-30000-jobs-worldwide-diesel-
emissions-scandal
47 La voiture électrique menace les garagistes Le Figaro (Cyrille Pluyette)
48 Roland Berger, 2016, The IAM in 2030
Impact of ECVs on the EU economy| 32You can also read