PRE-FEASIBILITY ASSESSMENT - ELECTRIC VEHICLES IN NIGERIA - Abridged version
←
→
Page content transcription
If your browser does not render page correctly, please read the page content below

PRE-FEASIBILITY
ASSESSMENT
ELECTRIC VEHICLES IN NIGERIA

                               Abridged version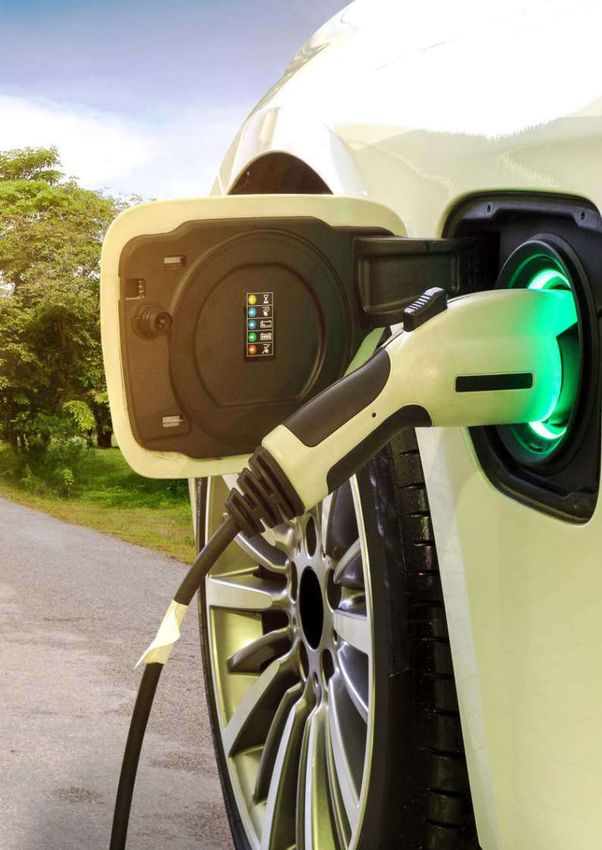
Introduction
As the world actively pursues deliberate paths toward the creation of a more sustainable future, there is an increased
emphasis on the role of state and non-state actors, corporate bodies and individuals in realizing the climate goals we
have set ourselves. There is overwhelming evidence that the environmental damage caused by one country, industry,
or a person affects all, to which effect we must all act together by taking responsibility for the creation of a greener
planet. And there are rallying calls through the likes of the Sustainable Development Goals and the Paris Agreement,
for all to step forward and act now.
Today, petroleum meets over 95% of global transportation demands; however, a sustainable world means the future
of Energy companies will increasingly be based on a diversified portfolio that must include renewable energy in
various forms, as oil and gas become less fashionable to investors and future workforce. We are already witnessing a
significant shift, across the world, in institutional investments, with some of the world’s largest investment
management firms and banks boldly reducing business dealings with or completely divesting from companies that
do not have active plans to improve their Environmental, Social and Governance (ESG) metrics.
It is against this backdrop that Oando has made it's first foray into renewable energy, as the journey begins for the
redefinition of the future of our business and our role in the achievement of a carbon neutral world.
This document presents a pre-feasibility study assessment of opportunities within the Electric Vehicle Value Chain in
Nigeria.
As a company that has always been invested in how Nigerians can through collaboration move the economy forward,
we have taken the step of sharing this preliminary research of Nigeria's renewable energy space with the general public.
Our belief; if as a nation we are to pivot substantially into renewables then we must start to create platforms that
will enable the growth and diversification of sector players. One of the ways we can do this is via knowledge
sharing. Our objective in sharing this pre-feasibility assessment is to act as the first stage of research for interested
individuals and businesses to determine and select the most technically and economically viable space they can play in.

  2
ELECTRIC
    VEHICLES
3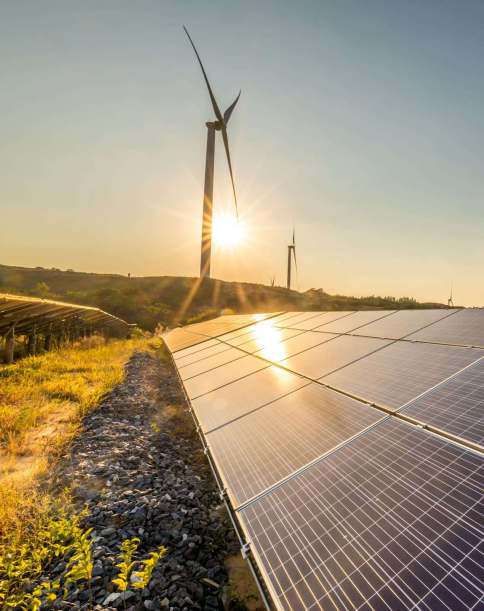
TABLE OF CONTENTS

        05                   06                   08
     Executive           Introduction          Opportunity
     Summary                                   Description

        14                   16                   21
Market Entry Strategy   Risk Assessment   Conclusive Information

        25                   57
     Appendix             References

4
Executive
Summary
Nigeria & Oando
Unstable global oil prices, an evolution of global and local
polices in favor of “cleaner” energy sources, and a consequent
shift in financiers' interest has accelerated the need for oil
and gas companies, inclusive of Oando PLC to explore a
portfolio diversification strategy towards renewable energy.
As the world transitions from fossil fuels into more renewable
sources of energy (Solar, Wind, Geothermal, Tidal etc.), energy
providers in the fossil fuel space must rapidly evolve to
adapt to a new market reality or face disruption. One such
disruption is the growth of electric vehicles to replace
internal combustion engine vehicles a major swing
consumer of fossil fuels.
Leveraging on the abundance of solar energy, growing
financier interest in funding renewable energy projects in
Africa as well as the FGN’s interest in developing and
executing solar power projects for rural and institutional
electrification there are abundant opportunities for
interested private actors to commit to an environmental
sustainable Nigeria.

  5
Introduction
The continued push for a world focused on Sustainable               credits.
Development and the Energy Transition Act are increasingly        Ÿ Operational efficiencies: demonstrated long term
tuning and shifting attention to transforming the global            economic benefits from the Plan implementation.
energy sector from fossil-based to zero-carbon by the second      Ÿ Sustainable Development co-benefits: demonstrated
half of this century. The United Nations with its pledge to end     increase in climate smart infrastructure and other
poverty has provided an excellent roadmap aimed at                  sustainable development benefits to local communities
protecting the planet and ensure prosperity for all by 2030.        from Plan implementation
The Oil and Gas industry is responding with operations
                                                                  This report provides an assessment of the solar power value
models that seek to reduce carbon emissions, and with the
                                                                  chain, its technologies, opportunities and potential
Environmental, Social, and Corporate Governance-ESG
                                                                  obstacles.
framework, investors are putting increasing amounts of their
funds in high sustainability and societal impact
opportunities.
Renewables are essential in the drive towards universal
access to affordable, sustainable, reliable and modern
energy. Of the three end uses of renewables—electricity,
heat, and transport—the use of renewables grew fastest
with respect to electricity, driven by the rapid expansion of
wind and solar technologies.
In Q1 2020, global use of renewable energy in all sectors
increased by about 1.5% relative to Q1 2019, showing that
renewable electricity has been largely unaffected while
demand has fallen for other forms of energy.
The United Nations has set the pace with a plan that proposes
an integrated approach to realize rapid results and progress,
accelerating proven innovative solutions and partnerships.
Over the next 10 years, the UN Climate Action targets:
Ÿ Carbon emissions: Absolute and per capita reductions of
    25% by 2025 and 45% by 2030.
Ÿ Electricity consumption: Per capita reductions of 20% by
    2025 and 35% by 2030.
Ÿ Renewable energy: 40% by 2025 and 80% by 2030 of
    consumed electricity.
Ÿ Commercial air travel: Per capita emissions reductions of
    10% by 2025 and 15% by 2030.
Ÿ Climate neutrality: 100% of unavoidable carbon
    emissions are offset yearly from 2019 via certified carbon

  6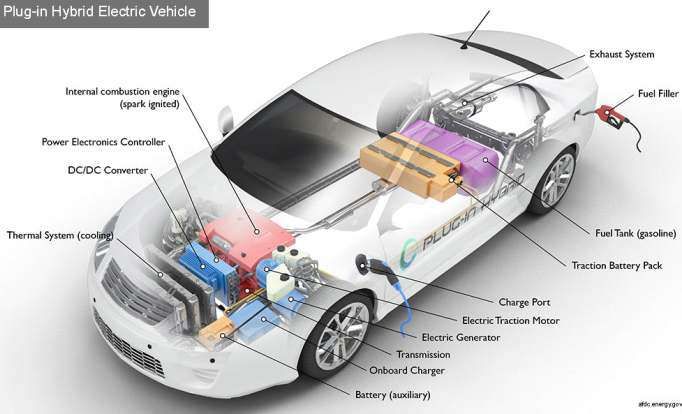
Developing the EV Business
The EV business / value chain development refers to the                              THE EV CHARGING BUSINESS
development and deployment of technologies to support the
manufacturing of EV car components and the charging of the             Development of the EV charging business has been slow due
EVs. The main elements of these value chain are;                       to uncertainty around policy direction and timing; No one
                                                                       wants to invest in stranded assets.
Ÿ Manufacturing of EV Power Train and other Sub-Systems
                                                                       Investors must partner up with other stakeholders to define
Ÿ Assembly of EV Cars, Distributorship and Sales                       the development of EV
Ÿ Electricity Generation, Transmission and Distribution                Most Importantly:
      Infrastructure                                                   Investorsmustbuildinfrastructurearoundexistingdemand
Ÿ Manufacturing of EVSE and Other EV charging system                   Developing an understanding of where the demand is
      components                                                       coming from and how consumers will use EVs will be critical
                                                                       in sizing, scaling and shaping the right infrastructure. Outside
Ÿ Charging Infrastructure (Private and Public)                         the “Home Charging Model”, two other models have been
Ÿ E-Mobility ServicesDevelopment of the EV charging                    defined
      business has been slow due to uncertainty around policy          Mode 1: The Destination User
      direction and timing; No one wants to invest in stranded         Airports, Car parks, business parks and major office spaces.
      assets.                                                          The target is areas where users will leave their cars for long
Ÿ Investors must partner up with other stakeholders to                 periods of time.
      define the development of EV                                      Model 2: The Hub User
                                                                       This targets fleets of cars, Taxis, buses, emergency vehicles,
                                                                       delivery trucks. This relies on the development of charging
                                                                       hubs around cities.

                       POWER TRAIN                    ENERGY                              DIGITAL                     CUSTOMER
                        COMPANIES                    NETWORKS                            SOLUTION                       NEEDS
                                                                                        PROVIDERS

                                        LOCAL                           CHARGING
  CAR COMPANIES                      AUTHORITIES                      TECHNOLOGY                       INVESTORS
                                                                       COMPANIES

                                                            BUSINESS
                                                           MODEL FOR EV

                                      Early Adoption Phase (Cities’ Sustainability and Social Goals)

                                          Growth Phase (Expansion to Meet Critical Adoption)

                                                 Takeover Phase (EV the new Normal)

  7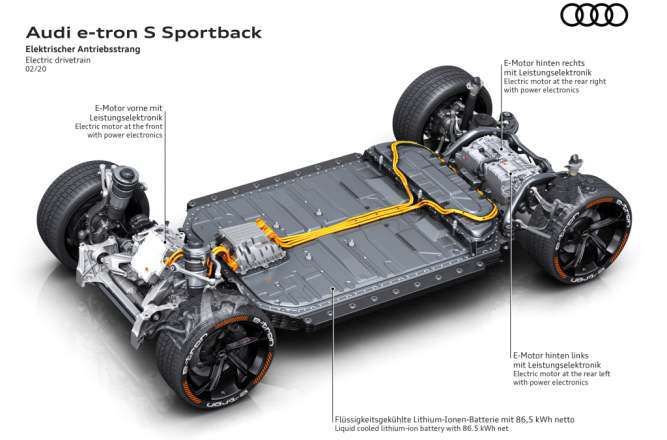
Opportunity
    Description

8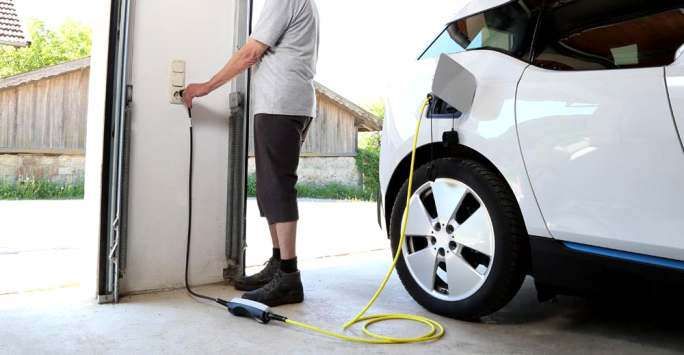
Global EV Market Size
 NUMBER OF EVs ON THE ROAD IN 2010                                                                          NUMBER OF EVs ON THE ROAD AS OF 2019
 0.002% of
 Global Car
 Stock                    17,000                                                                            7.2            million
                                                                                                                           1% of Global Car Stock
                                                                                                                                                          Number of EVs
                                                                                                                                                          on the road as
                                                                                                                                                                of 2019

   GROWTH AND SALES TREND

   The global electric vehicle fleet expanded significantly over the last decade, underpinned by supportive policies and technology advances.
   Ÿ In 2019, 2.1 Million EVs were sold (2.6% of global car sales)
   Ÿ Total EV as of 2019: 7.2 Million (1% of global car stock)
   Ÿ According to the SPC scenario, this will be 140 Million by 2030 (7% of global car stock)
   Ÿ 9 countries have more than 100,000 EVs on the road today
   Ÿ Although light passenger vehicles are the most popular EVs, 2-3 wheelers and light public and commercial vehicles are becoming popular

           Europe has the Strongest Market Penetration                                          Leading Countries (Share of Sales of New Cars Running on Electricity)

47% of all EVs are in China
(Largest Market Share)
                                                                27%                                                   56%                                 25.5%
                                                                                                                    Norwary                               Iceland
                                                                                    26%
EV Units by Area
  US (1.1million units)                                             47%                                                                15%
                                                                                                                                     Netherlands
  Europe (1.2million units)
                                                                                                      % of New Cars
  China (2.3million units)                                                                            are EVs

   2,500,000
                  Global Plug-in Deliveries                                                     8,000,000   Global Electric
                                                                                  +9%
                  BEV & PHEV - Light Vehicles                                                   7,000,000
                                                                                                            Car Fleet
   2,000,000
                       N* light electric vehicles globally                                      6,000,000
                       Year-over-year growth                               +65%
   1,500,000                                                                                    5,000,000

                                                                                                4,000,000
   1,000,000                                                        +59%
                                                                                                3,000,000
                                                             +46%
                                                                                                2,000,000
      500,000                                      +69%
                                         +35%                                                   1,000,000
                               +67%

                2010   2011     2012      2013     2014      2015   2016   2017   2018   2019               2013    2014      2015       2016      2017        2018   2019

  9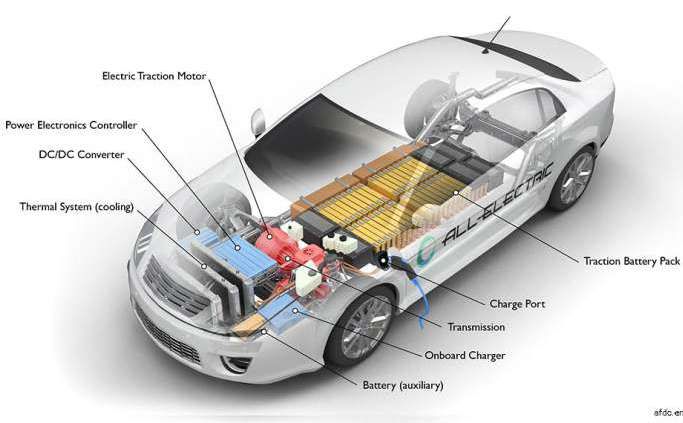
Growth and Trends of EV
 VEHICLE TYPE TRENDS
 Transport modes other than passenger cars are also electrifying
 Two/Three Wheelers
 Ÿ Electric mobility options have expanded to include E-scooters, E-bikes, Electric mopeds, and Electric Tricycles, which are now available in
    over 600 cities and across 50 countries globally
 Ÿ The growth of two/three wheelers is driven by their popularity in China, India and other densely populated countries.
 Ÿ The battery swap method of recharging is also efficiently suited for 2/3 wheelers making adoption easier

 Light Commercial Vehicles
 Ÿ Light commercial electric vehicles are also being deployed as part of a company or public authority fleet.
 Ÿ Electric buses are also becoming popular with countries aiming to electrify most of their public transportation networks (Chile aims for 2040)

      Global EV Stock in the Slated Policies Scenario, 2019 and 2030                                      Global EV Stock in the Sustainable Development Scenario, 2019 and 2030

           million                                                                                                million
              250                                                                                                    250

              200                                                                                                    200

              150                                                                                                    150

              100                                                                                                    100

               50                                                                                                     50

                0                                                                                                      0
                                2019                                   2030                                                              2019                                 2030

            PLDVs - BEV     PLDVs - PHEV        LCVs - BEV           LCVs - PHEV     Buses - BEV                  PLDVs - BEV        PLDVs - PHEV         LCVs - BEV        LCVs - PHEV         Buses - BEV
            Buses - PHEV    Trucks - BEV        Trucks - PHEV                                                     Buses - PHEV       Trucks - BEV         Trucks - PHEV

     New Electric Bus Registrations by Country/Region, 2015 - 2019                                        Electricity Demand from the Electric Vehicle Fleet by Mode, 2019 and 2030

thousand                                                                                                   Twh
     2.5                                                                                                   1000

     2.0                                                                                                   750

     1.5                                                                                                   500
                                                                                                   2015
     1.0                                                                                           2016    250
                                                                                                   2017
     0.5                                                                                           2018      0
                                                                                                   2019                     2019              2030 - Stated Policies         2030 - Sustainable
                                                                                                                                                    Scenario                Development Scenario
      0
                India      Europe      South America North America      Others                                                     Bus          LDV           2/3-Wheeler            Truck

           Two/Three Wheelers                                                 Light Commercial Vehicles                     Electric Buses                                                   Electric Trucks
           350 Million in circulation                                         380,000 in circulation                        500,000 in circulation                                           6000 in circulation

10
Global Market Outlook
The electrification of transportation is the new frontier of mobility and Political and Government support is also on the rise
the trends exist to prove it. Other key changes/trends to note are: Ÿ In the USA, Biden has expressed support for EV adoption, targeting
500,000 new public charging outlets and restoring EV tax credits
Car companies have embraced EV and there are expected to be
Ÿ The UK government has made moves to bring forward its ban on
at least 21+ New EV brands in 2021 alone
fossil fuel vehicles to 2030
Ÿ Nissan targets 1million EV & hybrid sales by FY 2023
Ÿ Renault expects 10% of its total sales to be EV in 2023 (Renault Zoe Private commercial companies are making changes to their fleet
is one of the best-selling EV cars in Europe) Ÿ DHL has pledged to reach 70% clean operation of last-mile pick-
Ÿ Daimler plans to introduce 10 Pure electric and 40 hybrid models ups and deliveries by 2025
into its car manufacturing portfolio Ÿ DB Schenker wants to make its transport activities in EUROPE
Ÿ Volkswagen plans to have electrified all models of their cars by emission free by 2030
2030 and have the entire company CO2-neutral by 2050
As the price parity between ICE and EVs gets even closer (~2-3years),
Utilities, Power and Other Energy companies have increased these trends act as signaling devices for the rest of the market that EVs
their investment in EV charging Infrastructure (~$1.7billion) are here to stay. It thus puts pressure on competitors, stakeholders and
and over $100 billion has been earmarked to be invested into investors to act faster or risk being left behind
battery and EV car manufacturing from 2018 till date.
The EV Market outlook presently has two widely recognized scenarios
1. The State Policies Scenario: This reflects the impact of existing policy frameworks and today’s announced policy intentions on the EV
market by the year 2030. It suggests that by 2030:
Ÿ Global EV stock (excluding two / three wheelers) will be 140 million
Ÿ Global EV stocks will account for 7% of global vehicle fleet
2. EV30@30 Scenario: This is a Clean Energy Ministerial Campaign which aspires to help governments achieve a reduction in GHG via the
transportation sector by supporting the sales share of EVs. The campaign aspires that:
Ÿ Global EV sales would be 30% of global car sales by 2030
Ÿ Global EV sales would reach 43 million per annum
Time, new data and new policies will tell how these predictions will unfold.
Global EV Stock Outlook
350,000,000.00 30% of
Global Car sales
300,000,000.00
250,000,000.00
200,000,000.00 7% of
Global Car Stock
150,000,000.00
100,000,000.00
50,000,000.00 1% of
Global Car Stock
-
2019 2030 2030
(SPC Scenario) (EV30@30 Scenario)
11EV in Africa and Nigeria
Africans want Electric cars, but they are still too expensive for most car owners says a survey carried out by auto-trader. The survey also collated drivers
and resistors for EV adoption in Africa as shown in the table:
In Africa, South Africa first started the adoption of EVs with the introduction of the Nissan Leaf in 2014. Currently there are estimated 1000 EVs in
South Africa. EVs can also be found in Nairobi, Kenya, Uganda, Rwanda, Nigeria.
EVs account for only 0.001 percent of car sales in Africa. Adoption techniques have been to use EVs for Ride – hailing services.
Charging Infrastructure: South Africa has the most developed charging infrastructure in Africa with investments of over 2MUSD going into the
electric power way project.
Mindshift is necessary and vital for the adoption of EVs in Africa
However,The middle east and Africa are expected to register a CAGR of about 6.80% from 2020 -2025 (Dubai aims to have 30% of road transport as Evs by 2030)
Drivers Resistors Two and Three Wheelers expect faster growth in Africa.
The UN is currently supporting projects in:
Anticipated fuel savings 40-70% Higher upfront costs (Including high
import tariffs and no form of subsidies) Ethiopia, Morocco, Kenya, Rwanda and Uganda.
Rapidly growing urbanization Current lack of charging infrastructure
Opportunities provided by micro- EV range limitations (Range Anxiety) Major Brands Introduced to Africa
mobility and gig economies Ÿ BMW Mini-Cooper SE
Lower lifetime running costs (EVs High electricity prices Ÿ Jaguar I-Pace
cheaper to maintain than ICE) Ÿ Nissan Leaf
Ÿ BMW i3
Overcome fossil fuel scarcity (a Grid electricity supply instability (Impact Ÿ Volkswagen E-Golf
problem in SSA) of load shedding) Ÿ Hyundai Kona & Ioniq
Environmental concerns; Desire Charge time
for greener mobility
EV Assembly Plants unveiled in Africa (2018 – 2020)
Less Noise pollution On-going lack of enabling policies - tax
incentives and subsidies Ÿ Kampala (Uganda)
Ÿ Kigali (Rwanda)
Impending global regulations which No political will to support EV Ÿ Lagos (Nigeria)
would impact local automotive production / Imports and infrastructure
markets development Ÿ Addis Ababa (Ethiopia)
Positive Image Existing ICE “useable life”
Main Partner Companies
Ÿ Volkswagen
Ÿ Hyundai
12EV in Africa and Nigeria
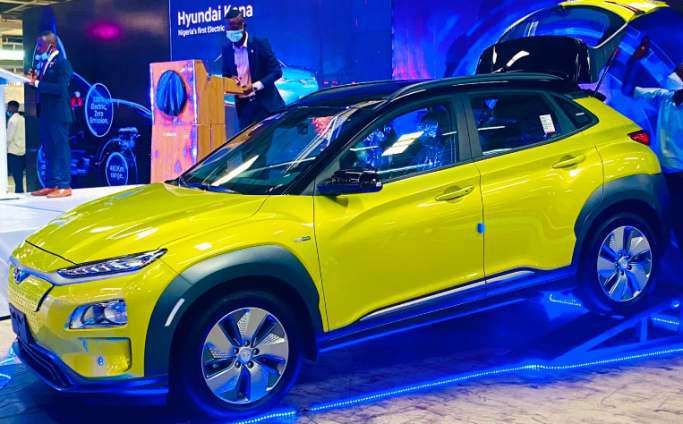
In Nigeria, Hyundai and Stallion group have taken the first big step towards electric vehicle deployment and adoption in Nigeria by unveiling the first
locally assembled EV electric car with a 64-kWh battery pack that allows a 300 miles (482 km) drive on single charge.
The Entrance of EV into the Nigerian space has come with many challenges, yet many opportunities. With the country’s current power
condition/realities comes many questions begging for answers:
Ÿ Where is the power source going to come from?
Ÿ How will the generated power be distributed?
Ÿ How are the vehicles going to be charged?
Ÿ Would EV owners charge in their homes or at public stations?
Ÿ Who will own and operate public charging stations?
It has however become imperative that these questions be met with solutions that would directly speak to the challenges presented with the
peculiarity of our business terrain.
HYUNDAI KONA ELECTRIC: LAUNCHED IN LAGOS IN 2020
?
Number of EVs in
Nigeria. Unknown
Not including HEVs
like the Older
generation PRIUS
Can Nigeria Sustain an EV Industry? Ÿ Pay a premium to charge at privately/Government owned
With an electricity access rate of 60% and a national electricity grid public charging stations - Level 2 or DC Fast Charge if the
that relies on load shedding (rolling blackouts) to manage existing power supply can indeed support it.
demand and supply of electrical power, Nigeria as a country may For EVs to become a means of transport on a large scale in Nigeria,
not be positioned for the emergence of electric vehicles. Ÿ Power generation, transmission and distribution capacity
Beyond the cost of EVs, this is and will be the major resistor to needs to be upgraded and expanded.
the adoption of EVs on a large scale to Nigeria. Without the Ÿ EV pricing needs to be nearly as affordable as fossil fuel
right energy infrastructure in place to meet the new demand powered vehicles .
for electricity that EVs will bring, Owning EVs in Nigeria will
Ÿ Cost of power per distance traveled needs to be more
start of as a luxury for the elite as they will either
affordable than liters of fuel per distance traveled.
Ÿ Provide their own “fuel” (electricity) for Level 1 or Level 2
Ÿ Gas powered and Solar EV charging stations will need to be
charging at homes (Sources: PHCN + Diesel/Petrol Generators
+ Maybe solar). part of the Energy source mix.
13Market Entry
Strategy
14Market Entry Approach
Supply Supply
and and
Distribution Distribution
Chains Chains
Parts and
Vehicle Design Component EV Vehicle
Raw Distribution Energy Mobility
Materials & Development Manufacturing Assembly & Sales Infrastructure Services
UPSTREAM MIDSTREAM DOWNSTREAM
High Technological advancement requirements Lower Entry Barrier Lowest Entry Barrier
Global & Established incumbents increasing capacity Requires strong partnerships Multiple Supply Chains
High Entry barriers (Including safety & manufacturing Lower capital reqauirement Low Tech Requirement
standards)
Multiple Supply Chains I.T requirement
Tough Quality expectations
Medium Technological know-how Requires EV adoption
High Electrical Power requirement
15Risk
Assessment
16Risks and Mitigation Measures
TECHNICAL
Key Risk Indicators Mitigation Measures
Limited experience in the sector Seek working partnerships and technical alliances with renowned
international players in this sector. This is to augment local skill sets,
Limited local technical expertise (Electric Vehicle Supply Equipment
gain new competitive skills and eventual technology and knowledge
Supplier (EVSE-S) and Charge Point Operator (CPO) and as an E-
transfer that will have a lasting effect on the brand's product market
mobility Service Provider) - lack of knowledge required to develop,
positioning
produce, replicate and control the technological principles in the
product/service
Slow development of the EV charging business due to uncertainty Seek to drive policy changes/support within this sector. It is
around policy direction, timing and inherent technology limitations envisaged that investor confidence would be gained by a robust and
of range (One-Time Travel Distance at Full Charge) which is stable policy framework and long-term national objectives and
envisaged to cause range anxiety for local long-distance travellers targets backed up by sound market forecasts
Policy approaches to promote the deployment of EVs in relation to a
variety of measures such incentives for zero- and low-emissions
vehicles, economic instruments that help bridge the cost gap
between electric and conventional vehicles and support for the
phased deployment of charging infrastructure
The number of charging stations in the long-run can reduce the
limited range problem and technological advancement has also
seen the battery swap method of recharging growing which
decreases charging time
FEEDSTOCK RESOURCE
Key Risk Indicators Mitigation Measures
Inadequate local electricity supply and infrastructure to sustain the Build infrastructure around existing demand. An in-depth
Electronic Vehicle business/Industry. With low electricity access rates understanding of current and potential demand would be critical in
and a national electricity grid that relies on load shedding to strategically sizing, scaling and shaping the right infrastructure. A
manage demand and supply of electrical power, Nigeria as a country phased approach to adopting home, office and other public
may not be positioned for the emergence of electric vehicles charging models would be defined
From the technical analysis, it is expected that initial adopters would
provide their own fuel (electricity) for Level 1 or Level 2 charging at
home (Sources: PHCN + Diesel/Petrol Generators + solar) or pay a
premium to charge at private / Government owned public charging
stations – Level 2 or DC Fast Charge if the existing power supply can
support it
17Risks and Mitigation Measures
FEEDSTOCK RESOURCE
Key Risk Indicators Mitigation Measures
Inadequate local electricity supply and infrastructure to sustain the For EVs to become a means of transport on a large scale in Nigeria,
Electronic Vehicle business/Industry. With low electricity access rates Power generation, transmission and distribution capacity needs to
and a national electricity grid that relies on load shedding to be upgraded and expanded
manage demand and supply of electrical power, Nigeria as a country
may not be positioned for the emergence of electric vehicles EV pricing needs to be nearly as affordable as fossil fuel powered
vehicles
Cost of power per distance travelled needs to be more affordable
than liters of fuel per distance travelled
Gas powered and Solar EV charging stations will need to be part of
the Energy source mix
Limitations caused by non-existent nature of public charging Build infrastructure around existing demand. An in-depth
stations - A sufficient number of charging stations is a prerequisite understanding of current and potential demand (drive office policies
for EV adoption. The lower number of charging networks is to adopt EVs as official cars in line with ESG sustainability adoption
recognized as a limiting factor for consumers to buy EVs. The public by public companies) and how consumers will use EVs is critical in
and private sectors are reluctant to invest in charging stations as the strategically sizing, scaling and shaping the right infrastructure. A
number of EV users is still insufficient and, conversely, potential EV phased approach to adopting home, office and other public
users hesitate from purchasing EVs due to the insufficient number of charging models would be defined
charging stations
Technological advancement has also seen the battery swap method
of recharging growing which decreases charging time and is also
efficiently suited for 2/3 wheelers making adoption easier
Seek to drive policy changes / support within this sector
Supply chain risks – with the near-term entry strategy of exploring Leverage technical partners relationship with component
the downstream and mobility service component of the Electric manufacturers
Vehicle value chain as an Electric Vehicle Equipment Supplier, Charge
Build strategic relationships and comprehensively assess EV
Point Operator and an E-mobility Service Provider, material
components supply chain partnerships whilst expanding supply
logistics coupled with an optimal sourcing strategy is key to gaining
optionality and having alternative back up suppliers
immediate competitive advantage
Perform in-line and pre-shipment inspections on components for
quality control assessments
Maintain module/component delivery timelines through a risk
based logistics strategy
18Risks and Mitigation Measures
OUTPUT AND END USE
Key Risk Indicators Mitigation Measures
Slow adoption due to consumer perceptions about EVs e.g. Social factors, particularly consumer understanding of the attributes
infrastructure to support adoption, long range travel concerns - of EVs, are being recognized as significant influencing variables for
limits regarding driving distance with a single charge, higher pricing users choosing EVs over Cvs
compared to CVs, charging times etc
As the popularity and adoption of EVs is significantly dependent on
user acceptance, sensitization efforts and EV user education should
be planned to significantly drive adoption from a quality,
environmental awareness/benefits and long-term financial savings
(maintenance costs) perspective
Evaluate optimal profitability of e- mobility product or service of Economic and financial models must evaluate the optimal
different streams within the value chain in order to make final profitability of the service within the different streams of the value
investment decision chain from which a final investment decision can be made
ECONOMICS AND FINANCING
Key Risk Indicators Mitigation Measures
The relatively higher price of EVs compared to that of conventional Transport modes other than passenger cars are also going electric
vehicles (CV) serves as a critical local and regional barrier guaranteeing cheaper options e.g Electric mobility options have
expanded to include E-scooters, E-bikes, Electric mopeds, and Electric
Tricycles, available in over 600 cities and across 50 countries globally
Help Government drive the Implementation of economic policies
/incentives that help bridge the cost gap between electric and conventional
vehicles & support for the early deployment of charging infrastructure
coupled with other policy measures that increase the value proposition
of EVs (such as parking waivers or lower toll or parking fees)
In-depth understanding of current and potential demand (help drive
office and Government policies to adopt EVs as official cars in line with
ESG sustainability adoption by public companies and government
parastatals) whilst sensitizing the public on the environmental and
medium to long term financial benefits of EV adoption (limited
maintenance costs, lower carbon emissions etc)
Limitations in market penetration rate, demand and profitability due Development of detailed economic and financial models to evaluate
to slow rate of adoption in Nigeria and Africa at large coupled with optimal strategies to drive market penetration rate, demand and
higher electricity price for charging battery as well as replacement cost profitability of product /service within the different streams of the
value chain from which a final investment decision can be made
Low rate of market penetration compared to CVs to justify immediate
commercial gains due to various cost and non-cost factors
19Risks and Mitigation Measures
ECONOMICS AND FINANCING
Key Risk Indicators Mitigation Measures
Significant initial capital investment and access to finance - financial Identify local and international intervention funds and grants and be
capabilities of project sponsor positioned accordingly to access these funds
Eligibility to access identified funds and grants Perform a thorough assessment of all identified funds/grants’
eligibility criteria and be strategically positioned to access same
If there are any time or experience-based barriers for fund/grant
prequalification, consider partnership/technical alliances with
companies that meet the set criteria
Alternative funding barriers Development of a project economic model that shows the viability of
the project
Perceived high cost of doing business in Nigeria and impact on the Development of a business model that seeks to optimize the
overall value creation potential of the project/ investment commercialization of the energy/power output with a focus on cost
optimization and profitability
Development of a detailed project evaluation and commercial
optimization/margin profit analysis which guarantees sustainability
and profitability
GOVERNMENT AND REGULATORY
Key Risk Indicators Mitigation Measures
Limited policy support/traction from a For Nigeria to expand in the electric mobility industry, Government would need to use a variety of
regulatory perspective creating a near measures such as, a revamp of the electricity supply infrastructure, institute procurement
uncertain environment for major investors programmes to kick-start demand and stimulate automakers to increase the availability of EVs on the
and entrepreneurs within this space market, provide incentives for an initial roll out of publicly accessible charging infrastructure,
fuel economy standards coupled with incentives for zero and low-emissions vehicles, economic
In addition there are currently no tax credits for incentives that help bridge the cost gap between electric and conventional vehicles & support for
renewable energy as the Nigeria government the early deployment of charging infrastructure coupled with other policy measures that
is still in the process of developing a robust increase the value proposition of EVs (such as parking waivers or lower toll or parking fees).
set of policies to encourage and incentivize Increasingly, policy support has to be extended to address the strategic importance of the
solar power or general renewable energy electric vehicle technology value chain
development locally
Investor confidence can be gained by a robust and stable policy framework & long-term national
objectivesandtargets, backed-up by soundmarketforecasts
Seek to drive policy changes/support within this sector. It is envisaged that investor confidence
would be gained by a robust & stable policy framework and long-term national objectives and
targets backed up by sound market forecasts
20Conclusive Information 21
Carbon Credits in Nigeria
     Introduction
     Ÿ Developed under the Kyoto Protocol;
     Ÿ Establishes the Clean Development Mechanism (“CDM”) applicable to developing countries
     Ÿ The CDM allows Annex B Countries to execute/finance emissions reduction projects, including renewables
        (such as a solar power project, waste to power) in developing countries. Such projects can earn them saleable
        certified emission reduction (“CER”) credits.

     Eligibility
     CDM project must:
     Ÿ Have long term climate change benefits
     Ÿ Achieve Reductions in emissions that are additional to any that would occur in the absence of the CDM project

     Administration
     Ÿ Presidential Implementation Committee for CDM, which was established under the auspices of the Federal
       Ministry of Environment;
     Ÿ Companies creating projects, in developing countries, which actively reduce GHG emissions become eligible for
       carbon credits and then can raise funds, by selling them to a company exceeding its allowance on an
       exchange.
     Ÿ Income from Carbon credit trading are tax exempt.
     Ÿ Carbon credit prices are affected by forces of demand and supply, risks – project, sovereign, credit, etc

22
CDM Process flow 23
CBN Intervention Fund
- Other Strategic Subsectors
Introduction
Ÿ Set up by the CBN in January 2016
Ÿ Funding for the agriculture, manufacturing, mining, solid minerals
  and other strategic subsectors
Ÿ For green and brown (expansion) projects - priority for local content,
                                                                           Real Sector
  fx earnings and for job creation
Ÿ Trading activities shall not be accomodated
                                                                           Support
Other Key Points - Upstream                                                Facility
Ÿ Types – (i) Term Loan for acquisition of plants and machinery and (ii)
    Working Capital                                                        (initially
Ÿ   Tenor - Maximum of 10 years (1 year for Working Capital on a 1 year

Ÿ
    roll-over basis)
    Interest rate – 9%
                                                                           for N300bn)
Ÿ   Moratorium – 1 year
Ÿ   Eligibility – Borrower must be registered under CAMA

24
Appendix 25
Technical

26
Electric Vehicles (EVs)
                                                     PRODUCTION CAPACITY BASIS
Electric Vehicles (EVs) are vehicles that are driven by an electric motor instead of an internal combustion engine.
EVs are basically divided into 4 major categories:
Ÿ BEV (Battery Electric Vehicle)
Ÿ EREV(Extended Range Electric Vehicle)
Ÿ PHEV(Plug-In Hybrid Electric Vehicle)
Ÿ HEV (Hybrid Electric Vehicle)

                         The classification above is dependent on the Power Train Configuration

                                                    GENERAL OPERATING PRINCIPLE

 Electric Vehicles (EVs) are driven primarily by a battery pack which stores the electrical energy that powers the electric motor. EV batteries
 are charged by plugging the vehicle to an electric power source. (Note: Although EV charging may contribute to air pollution, the U.S EPA
 categorizes BEVs as Zero-Emission vehicles because they produce no direct exhaust or tailpipe emissions).

                                                   KEY COMPONENTS AND SYSTEMS

      Auxillary                    Charging                     Onboard Battery              Transmission               Power
      Battery                      Port                         Charger or AC -              (Electric)                 Electronics
      Pack                                                      DC Converter                                            Controller

      Traction                     DC - DC                      Thermal System               Other                      Electric
      Battery                      Converter                    (Cooling)                    Operational                Traction Motor
      Pack                                                                                   Systems                    (Engine)

27
EV Powertrain
The Powertrain is that part of the EV that provides power to the vehicles. Powertrain refers to the set of
components that generate the power required to move the vehicle and deliver it to the wheels.
The Electric Traction Motor: This converts electrical
energy to mechanical energy, that is delivered to the
wheels via single ratio transmission.
The On-board Charger: Converts AC received from
charging port to DC and controls the amount of current
flowing to the battery pack.
Single Ratio Transmission: Transfers Mechanical
Power from the ETM to the wheels.
The Charging Port: connects The Battery Pack: made up of multiple lithium-ion
the onboard charger to an cells and stores the energy needed to run the vehicle.
external Power source. Battery pack provides direct current (dc) output.
28Powertrain Comparison
GASOLINE VEHICLE
Ÿ Spark-Ignited Internal Combustion Engine
Ÿ Battery provides electricity for vehicle electronics/accessories
Ÿ Fuel System (Fuel injection System, Fuel line, Fuel pump, Fuel tank)
Ÿ Transmission transfers mechanical power from the engine to drive the wheels
Ÿ ECM – Fuel mixture, Ignition timing, emissions, operations, safeguards, troubleshooting
29Powertrain Comparison
HYBRID ELECTRIC VEHICLE
Ÿ Spark-Ignited Internal Combustion Engine
Ÿ Electricity generator generates electricity from rotating wheels while braking to charge traction battery
Ÿ Electric Traction Motor uses power from the traction battery to drive / Power the car at low speed / Idle
Ÿ Fuel System (Fuel injection System, Fuel line, Fuel pump, Fuel tank)
Ÿ Transmission transfers mechanical power from the engine to drive the wheels
Ÿ Power electronics controller – manages flow electrical energy
30Powertrain Comparison
PLUG-IN HYBRID ELECTRIC VEHICLE
PHEVs have one major difference from the HEVs – Traction battery pack can be charged through regenerative braking, Wall outlets
or charging equipment, and by the internal combustion engine
Ÿ Traction battery packs are slightly bigger
Ÿ An onboard charger and charging port have also been introduced
31Powertrain Comparison
ALL-ELECTRIC VEHICLE
Also Known as BEVs – these vehicles operate entirely on electricity store in an on-board traction battery pack. They are charged from
external electrical power sources. The major difference between BEVs and PHEVs or HEVs is the complete absence of an internal
combustion Engine and fuel system
Ÿ The Electric Traction Motor is also scaled up
32Powertrain Comparison
HYDROGEN FUEL CELL VEHICLE
The hydrogen fuel cell electric vehicle uses electricity to power an electric motor, but this electricity is generated by a hydrogen fuel cell.
Ÿ The Fuel cell stack is an assembly of individual membrane electrodes that use hydrogen and oxygen to produce electricity (It is an
electrochemical reaction – with water as a by product)
33Powertrain Comparison
POWER TRAIN COMPARISON FOR EVs
BEV BEV + REx FCEV PHEV HEV
Mini Countryman
EXAMPLE Tessa Model S BMWi3 Toyota Mirai Plug-in Toyota Prius
ENERGY
73% 73% 22% 60% 54%
EFFICIENCY
GEAR SHIFT No No No Yes Yes
AC Induction/ AC Synchronous
ENGINE Synchronous AC Synchronous AC Synchronous AC Synchronous
34EV Part Manufacturing
ELECTRIC MOTORS AND CONTROLLERS BATTERY CELLS BATTERY PACK
IN A MODULE HOUSING
As with conventional Internal Combustion engines, Electric vehicles are made up of different parts and systems that are designed, Built
and tested for assembly into the functional cars brought by customers.
Outside the standard parts of an automobile, Two main systems require manufacturing for a successfully built EV.
The Electric Motor and Controller: The controllers are responsible for managing the voltages and currents running from external electric
supply, to the battery, to the electric motor and to other systems. The electric motors convert electrical energy into mechanical
motion for propulsion. These systems are typically designed by car companies for manufacture in-house or by third-party manufacturers.
The Battery Storage System: This is made up of several connected battery cells enclosed in a specially designed housing which
typically forms part of the chassis of the electric vehicle as shown in the images below. The Battery Cells are typically purchased from a
battery manufacturer by the EV manufacturer in the required dimensioning that allows for easy configuration and scalability.
BATTERY MODULES ASSEMBLED IN THE CONSTRUCTED HOUSING BATTERY AS PART OF
THE CHASSIS
35EV Energy Infrastructure
The EV Energy Infrastructure development refers to development and deployment Key Stakeholders typically include:
of technologies to support the charging of electric vehicles across its increasing Ÿ Energy supplier or GENCO
range of applications. The main elements of these infrastructural need include: Ÿ DISCO
Ÿ Charge point Operator (CPO)
Ÿ Electricity Generation, Transmission and Distribution Infrastructure
Ÿ Charge Location Owner
Ÿ Charging Infrastructure (Private and Public) Ÿ Mobility Service Providers (MSP)
Ÿ Roaming Platform Provider
Ÿ Smart Metering (Incl. Bundled Energy Solutions)
Ÿ EC Driver or Fleet Manager
CENTRAL POWER GENERATION TRANSMISSION
& DISTRIBUTION
DISTRIBUTED POWER GENERATION
ENERGY STORAGE
(OPTIONAL)
EV CHARGING
STATION
PLUG-IN ELECTRONIC VEHICLES
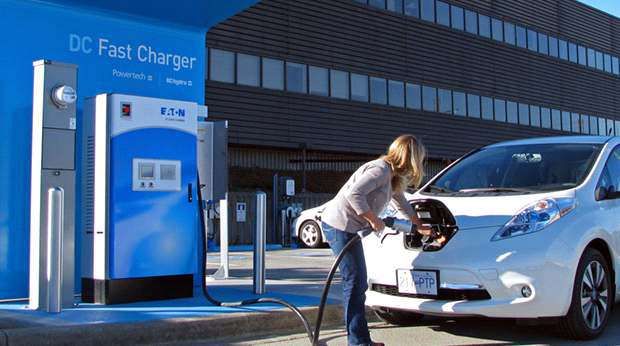
36EV Charging
EV Cars require their batteries to be charged upon depletion after use. EV charging is done with an EVSE – Electric Vehicle Supply equipment
required to condition and transfer energy from the constant frequency, constant voltage supply network to the direct current, variable voltage
EV traction battery bus for the purpose of charging the battery: There are generally three ways of charging:
Ÿ Conductive Charging
Ÿ Inductive Charging
Ÿ Battery Swapping
Conductive Charging
Is a charging method where the battery is connected by a cable and plugged
directly into an electricity source or charging unit. It is further classified into
Ÿ Level 1 Charging (Home / Public) – 120V
Ÿ Level 2 Charging (Home / Public) – 240V
Ÿ Level 3 Charging (Public) – 480 V
01
02
03
Battery Swapping Inductive Charging
Is a method where discharged batteries are swapped with fresh - This method of charging works through electromagnetic
fully charged batteries at a swapping station transmission without any contact between the EV and the charging
infrastructure.
There are two further classifications
Ÿ Static
Ÿ Charging Lanes
37EV Conductive Charging
CONDUCTIVE CHARGING
Conductive charging system use direct contact between the EV connector and charge inlet. The cable can be fed from a standard
electrical outlet or a charging station. The main drawback of this solution is that the driver needs to plug in the cable, but of course this is
only a connection issue
The Conductive Charging Method has different Charging levels. The Charging level describes the “ power level” of a charging outlet and
there are three levels in charging technology.
LEVEL 1 CHARGING LEVEL 2 CHARGING
This is the first level of EV charging and it is simply This is the second level of EV charging and it supplies >200V AC. It provides a foster
charging from a standard 120V AC household outlet. rate of charge, nearly 3-4 times the rate of a level 1 charger.
EV users who do not drive very far each day tend to Level 2 chargers can be single or three phase power.
find this sufficient.
Level charging requires specialized electric vehicle supply equipment and cables.
This could be home wall mount systems or public charges installed for commercial use.
DC FAST CHARGE (SOMETIMES REFERRED TO AS LEVEL 3 CHARGING)
DC fast charging uses direct current (DC) available in much higher voltages (as high as 800V). This allows for rapid charging. How ever, DC fast
chargers are expensive, and the current needed to use them is not always readily available.
DC fast chargers have a charge rate that allows them to charge most cars fully in about 30 minutes.
VOLTAGE VOLTAGE VOLTAGE
120v 1-Phase AC 280v or 240v 1-Phase AC 280v or 480v 3-Phase AC
AMPS AMPS AMPS
12-16 Amps 12-30 Amps (Typ 32 Amps)EV Conductive Charging
CONDUCTIVE CHARGING
LEVEL 1
120V
Adds 5 miles Residential
per hour Use
of charge*
LEVEL 2
240V
Adds 20-60 miles Residential &
per hour Commercial
of charge* Use
LEVEL 3
480V
DC Fast
Adds 60-100 miles Commercial
Charger per 20 minutes Use
of charge*
39EV Conductive Charging
HOME CHARGING - LEVEL 1
As the popularity of EVs grow, EV batteries become more efficient at battery power utilization and Charging efficiency and
speeds increase, it is predicted that EV car owners will prefer to charge their EVs at home with either a Level 1 or Level 2 Home
charger. This is further driven by the cost of charge. It is cheaper to charge at home than at public stations.
SAMPLE TESLA LEVEL 1 CHARGERS LEVEL 1 HOME CHARGERS
Level 1 home chargers plug directly to wall sockets and
have a low rate of charge. This is measured in range per
hour. Thy provide between 5-8 km per hour charge rate.
Ÿ They are typically supplied with the car ($0 Purchase &
Installation Cost)
Ÿ Takes about 20hrs to fully charge a 200 km range EV
LEVEL 1 HOME CHARGER IN USE
Cost of charging is
dependent on electricity
tariff in the Owners Location
40EV Conductive Charging
HOME CHARGING - LEVEL 2
Level 2 Home chargers increase the rate of charge (they are 4 – 10times
faster than Level 1 chargers. Level 2 chargers provide between 12-60
miles per hour charge rates
Ÿ They are sold separately from the car
Ÿ Requires specialize installation service (By OEM or certified
Electricians)
Rating: 240 Volt Level 2 charger; 16Amps Charging current
Ÿ $ 500 - $800 RRP depending on size
Ÿ Installation: $1,000 – 3,000 incl. Permits
THE BOSCH POWER MAX LEVEL 2 Ÿ Faster charge time (4-5 hours for full charge of 200km Range EV)
HOME CHARGER Also available in larger sizes with faster charging times
WALL MOUNTED LEVEL 2 HOME CHARGER IN USE
Cost of charging is
dependent on electricity
tariff in the Owners location.
41EV Conductive Charging
A DUAL PORT – PEDESTAL MOUNTED
LEVEL 2 PUBLIC CHARGER
PUBLIC CHARGING - LEVEL 2
Public charging stations allows EV drivers to charge their cars on the road when
they need to travel longer distances than allowed by the full range of the EVs.
These public chargers are typically found near restaurants, shopping centers,
general or office parking spots and other public locations. Their locations are
usually available on digital mapping platforms
LEVEL 2 PUBLIC CHARGERS
Level 2 public chargers increase the rate of charge, they are 4 – 10 times faster
than Level 1 chargers. Level 2 chargers provide between 12-60 miles per hour
charge rates
Rated: 3-20 kw; 240V, 16Amps Charging Current
(Find Purchase Cost below: Installation cost average: $1k - $4k)
TYPICAL COSTS FOR LEVEL 2 PUBLIC CHARGERS
FLEET WORKPLACE COMMERCIAL
BASIC WALL MOUNT BASIC PEDESTAL PEDESTAL WITH LOW LEVEL DATA PEDESTAL WITH ADVANCE
$500 - $1000 $1200 - $1700 COLLECTION $1800 - $2700 FEATURES $3000 - $8000
42EV Conductive Charging
PUBLIC CHARGING – DC FAST CHARGERS
Level 3 public chargers increase the rate of charge (they are 20-40 times faster than Level 1 chargers, and 8-10 times foster than
most Level 2 chargers.
They are sold separately from the car
Ÿ Requires specialize installation service (By OEM or certified Electricians)
Ÿ They are not available for residential use and are typically used for commercial applications
Typical Rating: NOTE:
50 KW – 480V Ÿ Not all cars can charge with Level 3 chargers.
Takes 30-45 mins for 200km range Ÿ They require unique charging connectors and
Price Range: power train architecture
$10,000 - $50,000 Ÿ View following slides for more on the subject
Installation costs Ranges (Dual Port):
$4,000 - $20,000
Depending on presence of existing infrastructure
43EV Charging Connectors
If you can relate
to this
It is important to note that we cannot possibly talk of EV charging without the Charging cables. Similar to phone charging
cables, EV charging cables tend to have two connectors, one that plugs into the vehicle socket and the other into the charge
point. However, some charge points could have Charging connectors “Tethered”.
Type
1-
Type - 2
Adapter
CHAdeMO
CCS
The type of connector required varies by vehicle and the power rating ("speed") of the charge point.
Ÿ Electric vehicles either have aType 1 or Type 2 socket for slow/fast charging and CHAdeMO or CCS for DC rapid charging.
Ÿ Most slow/fast charge points have a Type 2 socket. Occasionally they will have a cable attached instead.
Ÿ All DC rapid charging are tethered with mostly a CHAdeMO and a CCS connector.
44EV Charging: Inductive
INDUCTIVE (WIRELESS) CHARGING
Inductive charging uses an electromagnetic field to transfer energy between two objects. Electricity is transferred through an
air gap from a magnetic coil in the charger generating an alternating electromagnetic field (usually fixed on the ground or
charging platform) to a second magnetic coil fitted to the car. All the driver needs to do is park in the right place to align both
coils and charging will begin. These two induction coils in proximity combine to form an electrical transformer.
Ÿ Advanced Inductive Chargers like the Halo by Qualcomm and others by BMW and tesla can provide a Level charging
experience
Ÿ Only about 10% of power is lost using inductive charging
Ÿ The Inductive pads can be purchased and fitted to most new Evs
Ÿ They cost between $1,500 - $3,000 and require professional installation
45EV Charging
BATTERY SWAPPING
Battery swapping is simply the concept of swapping an
already discharged battery pack with a fully charged
battery eliminating the delay involved in waiting for the
vehicles battery to charge. This is usually carried out in
battery swapping stations (BSS).
Battery swapping has had a couple of false starts. Better
Places launched in 2005, pioneering BSS. They could only
get Renault on board – couldn’t get other car
manufacturers or gas stations to buy into deploying
them. Tesla also launched a battery swap service in 2013
and shut it down in 2016. BSS are expensive to build,
maintain and the cost of battery replacements tend tot fall to manufacturers.
More recently a company in China NIO has set up 125 battery swapping stations for its E-vehicles. Offering battery swapping
for free as a buy incentive to its potential customers. This tech is expected to be phased out as range and charge time continue
to be improved.
BATTERY SWAPPING HAVE FOUND
HUGE APPLICATIONS IN OTHER MOBILITY
SOLUTIONS SUCH AS THE YAMAHA
+ GOGORO SMART SCOOTER
46Smart Charging
SMART CHARGING SMART EV CHARGING
FEATURES
Ÿ Find available charging stations
for your EV
Ÿ Charge faster with BMS included
Ÿ Charge Safer
Ÿ Save money with network
incentives, discounts and benefits
BENEFITS TO
IDENTIFY. CHARGE. PAY. (ALL WHILE USING DATA TO IMPROVE SERVICE) MUNICIPALITIES AND
UTILITY OPERATORS
Ÿ Grid stability from the ability to
control charging remotely and to
match grid availability, energy
production and consumption
Ÿ Energy management and
consumption data
SMART CHARGING BENEFITS TO BUSINESSES AND CHARGING OPERATORS
Ÿ Monitor and control EV charging remotely
Ÿ View usage statistics and data
Ÿ Manage and monitor charging station issues
Ÿ Make changes to pricing packages and charging station information conveniently
Ÿ Seamless energy metering
Ÿ Seamless billing (on-site or offsite)
Ÿ Improved billing offerings (pay-as-you-use or subscriptions)
Ÿ Manage electricity consumption at stations (great for managing peak and off-peak pricing of power consumed)
Ÿ Better asset function and integrity management
Ÿ Asset life extension
47EV R&D and Standards
The advancements in Electric vehicles Hass primarily been as a result of funded research in research in Power
Electronics, Electric Motors and battery storage systems. These key research areas make it possible to develop electric
drive technologies (Power Trains) that meet mobility performance on par with conventional car propulsion systems.
Research efforts are mainly trying to achieve the following
Ÿ Reduction in cost, weight and volume of key components including the energy storage
Ÿ Improvements in performance, efficiency and reliability
Ÿ Development of innovative modular and scalable designs
Ÿ Improvement in manufacturability
Ÿ Acceleration of commercialization
EV INFRASTRUCTURE STANDARDS
“
EV companies are in a race
to develop the most cost
friendly and efficient
power train in the market
“
and thus they keep some of
their developed
technologies proprietary
As the electrification of the automotive industry continues to EV Charging
progress, car designers and manufacturers, charging service Ÿ Communication protocols
providers and the power industry have come together to Ÿ Market specific requirements and
standardize components and infrastructure surrounding the Ÿ Wireless and inductive charging development
safe operations and maintenance of the vehicles. EV Electronics and Components
The 3 major areas currently receiving these attentions are Ÿ ISO and IEC Standards considerations
Ÿ Inverters, converters, and on-board chargers
EV Batteries
Ÿ Connectors, plugs, charging cables, etc.
Ÿ Range, weight and size considerations
Ÿ Functional and electrical safety
Ÿ Environmental and performance testing
48Drivers and Resistors
GROWTH FACTOR
The main growth factors for the development and deployment of EVs are as follows:
Technological Advancements
Ÿ Improvements in battery technology will reduce cost of EV production
Ÿ Improved energy density will also increase range and efficiency
Ÿ Improved chargers will lead to less time for battery charging and increase
adoption in both first and third world countries
Price of Raw Materials (Battery and Charging Components)
Ÿ A reduction in price of raw materials such as Cobalt, lithium, silicon and other
battery and charging related materials will lead to a further drop in EV
manufacturing cost and sales price
Energy and Charging Infrastructure
Ÿ Improvements in power stability, availability, generation and transmission will
aid the deployment of EV charging infrastructure across a wider network.
Ÿ The availability of power in conditions suitable for Fast charging will also
influence the adoption of EVs especially in third world countries
Incentives and Policies
This includes but not limited to;
Ÿ Purchase Subsidies (including ICE trad-in incentives and Purchase financing)
Ÿ Infrastructural development financing
Ÿ Tax breaks and Credits
Ÿ Hardware and mobility service standards and mandates
Ÿ Import and export regulations
Ÿ Emission policy and sustainable development goals / Targets
Market Readiness (Investors, Manufacturers, End Users, EMSPs, Governments)
Ÿ As policies and incentives continue to be deployed, market readiness will be
signaled, and investors interest will grow as the uncertainty in the market is
mitigated
Ÿ The environmental and sustainability objectives of governments backed by
policy and political will would make it halt growth in each market locality
Ÿ The Perception of people will also be a huge factor. Manufacturers and other
key stakeholders must engage in end user education. The availability of
varieties in car type, function and design will also encourage adoption.
49EV Related Policies
Governmental International and local policies play a huge role in the adoption of Evs. Some of the most effective policies that have been
implemented to date across some of the major EV markets are as seen in the table below. As the adoption of EVs increase, it is only a matter of
time until the rest of the world catches up.
A SHIFT FROM DIRECT INCENTIVES TO POLICY
At the start of the EV technology growth path, due to the high cost of manufacturing it was essential that fiscal incentives and subsides be
extended to both EV manufacturers and Users. Some these incentives included:
Ÿ Purchase subsidies
Ÿ Purchase financing
Ÿ Scrappage bonuses
Ÿ Infrastructural development financing
Ÿ Federal tax credits
With technology improvements in Battery Efficiency, Battery charging, and the Energy infrastructure which have led to an overall
decrease in the cost of manufacturing, purchasing and maintaining an EV there are indications of a continuing shift from direct subsidies
to policy approaches that rely more on regulatory and other structural measures – including zero-emission vehicles mandates and fuel
economy standards –which will set clear, long-term signals to the auto industry and consumers that support the transition to EV in an
economically sustainable manner.
Policies need to be tailored to support a market transition respective to the locality in question.
EV-Related Policies in Selected Regions
Canada China EU India Japan US
Regulations (Vehicles) ZEV Mandate * *
Fuel Economy
Standards
Incentives (Vehicles) Fiscal Incentives
Targets (Vehicles) ZEV Mandate *
Industrial Policies Subsidy
Regulations (Chargers) Hardware Standards**
Building
Regulations * * *
Incentives (Chargers) Fiscal Incentives *
Targets (Vehicles) *
*Indicate that the policy is only implemented as a state/province/local level
50 ** Standards for chargers are a fundamental prerequisite for the development of EV supply equipment. All regions listed
here have developed standards for chargers. Some (China, EU, India are monitoring specific standards as a minimum.Top EV Cars & Makers
TOP 10 EV MODELS - GLOBAL DELIVERIES 2020 H1 vs 2019 H1
EV Volumes Thousands
0 20 40 60 80 100 120 140 160
Tesla Model 3 BEV
Renault Zoe BEV
Nissan Leaf BEV
VW e-Golf BEV
BYD Qin Pro EV500/600 BEV
Hyundai Kona EV
Mistibushi Outlander PHEV
2020 H1
GAC Trumpchi Aion S BEV
2019 H1
Audi e-tron Quattro BEV
VW Passat GTE PHEV
51You can also read