Independent Research, Indispensable Results - A Transformative Shift Towards Electric Vehicles and Autonomy - Fidelity Investments
←
→
Page content transcription
If your browser does not render page correctly, please read the page content below

Independent Research,
Indispensable Results
A Transformative Shift Towards Electric Vehicles and Autonomy

PRESENTERS: GARRETT NELSON & ANGELO ZINO
DECEMBER 17, 2019

       Independent Research, Indispensable Results              PAGE 1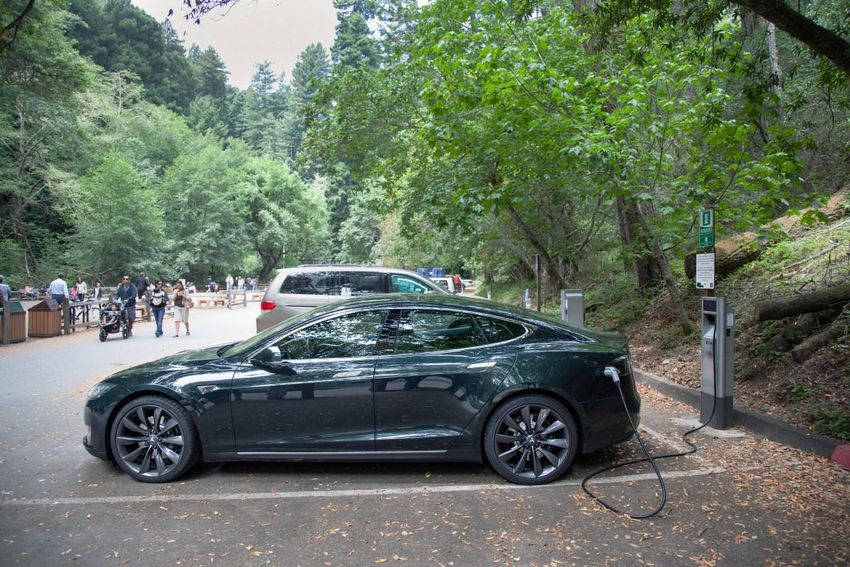
Agenda

• About CFRA
• Electric Vehicle Outlook
• Autonomous Vehicle Outlook
• Semiconductor Automotive Outlook
• Questions

           Independent Research, Indispensable Results   PAGE 2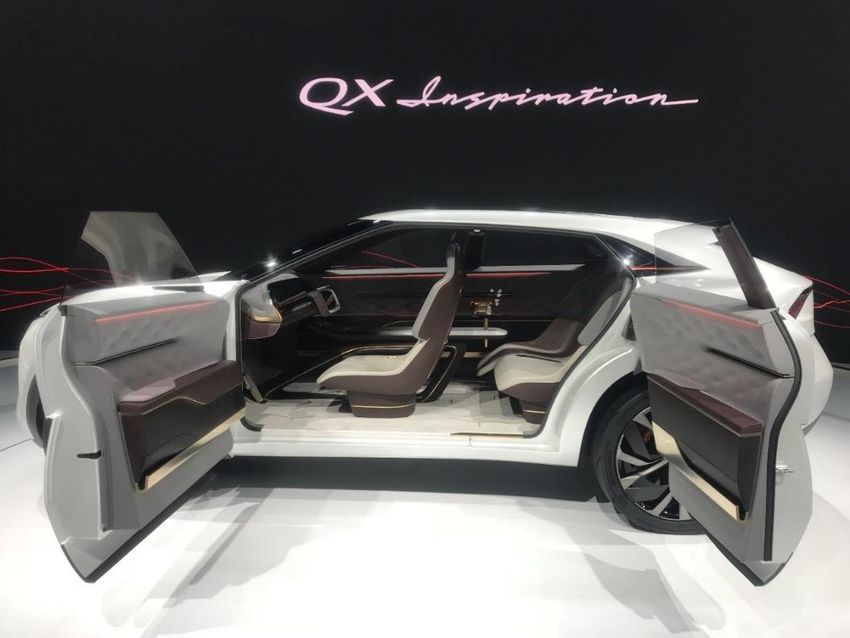
Our History
More than 90 years of innovation and growth as an independent research firm.

                CFRA         Legal      CFRA             MSCI       CFRA                CFRA           CFRA
                Founded      Edge       Sold             Acquired   Acquired            Acquired       Is one of the world’s
                             Launched   To Risk          Risk       from MSCI           First Bridge   largest Independent
                                        Metrics          Metrics                        Data           research firms
                                                         09’              11’
                                                           201                   2016
     1927     1994          2006        2007      2009     2010       2013         2016      2019          Today

        S&P                                                                     S&P Equity and Fund Research
        Global equity coverage begins                                           Acquired by CFRA

               Independent Research, Indispensable Results                                                                     PAGE 3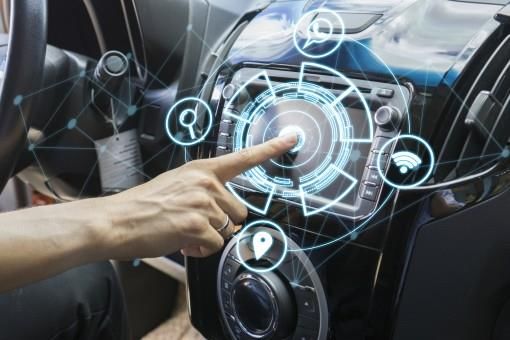
Proprietary Methodology Engine
CFRA blends fundamental equity with forensic accounting

                                           • Weekly market commentary, sector insights and portfolio
                                             guidance
                                           • Robust analysis covering 11 sectors and 68 industries
                                           • Unique holdings-based analysis covering 1,800+ ETFs and
                                             mutual funds
                                           • Qualitative research of 1,500 global companies; quantitative
                                             coverage of 25,000+ global companies
                                           • Diagnostic industry and company monitoring for risk
                                             assessment
                                           • Investigative insights utilizing forensic accounting, legal and
                                             exception-based insights

            Independent Research, Indispensable Results                                              PAGE 4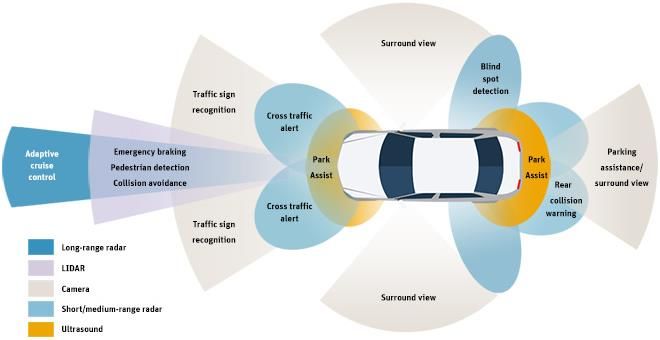
Independence
Research is all we do.

               CFRA does NOT manage money or make trades

              Many independent investment research providers
                 claim to be free of conflicts but are NOT

             Independent Research, Indispensable Results       PAGE 5
Electric Vehicle Outlook
Garrett Nelson, Senior Equity Analyst
     Independent Research, Indispensable Results   PAGE 6
Electric Vehicles

                             Independent Research, Indispensable Results   PAGE 7

Sources: CFRA, Pxhere.com.
A History of Electric Vehicles (EVs)
• Late 1820’s / Early 1830’s – Anyos Jedlik (Hungary) Invents First Small Scale EV, Robert
Anderson (Scotland) Develops First Crude EV
• 1889 – William Morrison Creates First Successful EV in U.S.
• 1900 – EVs Account For Roughly 33% of All Vehicles on the Road in U.S.
• 1901 – Ferdinand Porsche Invents First Electric Hybrid Car
• 1908 – Ford Introduces the Gas-Powered, Mass Market Model T
• 1913 – Ford Introduces First Conveyor Belt-Based Assembly Line, Significantly Reducing Costs
• 1910’s / 1920’s – Discovery of Cheap Texas Crude Oil Makes EVs Nearly Obsolete By 1935
• 1970’s – Clean Air Act is Passed, Oil Prices Soar, Reviving Interest In Alternative Fuel Vehicles
Independent Research, Indispensable Results PAGE 8
Sources: CFRA, U.S. Department of Energy.A History of Electric Vehicles (EVs)
• 1990’s – New Government Regulations Renew Interest in EVs
• 1996 – GM Releases EV1 Which Quickly Gains A Cult Following But is Unprofitable
• 1997 – Toyota Introduces The First Mass-Produced Hybrid (The Prius)
• 2000’s – Oil Prices Soar, Again Reviving Interest In Alternative Fuel Vehicles
• 2003 – Silicon Valley Startup Tesla Motors Founded With Goal of Producing EVs
• 2008 – Tesla Introduces Roadster EV
• 2010 – Nissan Releases First EV (Nissan Leaf), GM Releases First Plug-In Hybrid (Chevy Bolt)
• 2010’s – Battery Costs Drop By 50% Due to Innovation and Investments By DOE
Independent Research, Indispensable Results PAGE 9
Sources: CFRA, U.S. Department of Energy.Global EV Sales Being Driven by Battery EVs
Global EV Sales Volume Global EV Stock
(units in thousands) (units in thousands)
2,500 6,000
1,975 5,000
2,000
4,000
1,500
1,174 3,000
1,000
752 2,000
546
500
1,000
119
8
0 0
2005 2006 2007 2008 2009 2010 2011 2012 2013 2014 2015 2016 2017 2018 2005 2006 2007 2008 2009 2010 2011 2012 2013 2014 2015 2016 2017 2018
Battery Electric Vehicles Plug-In Hybrids Battery Electric Vehicles Plug-In Hybrids
• In 2018, global EV sales totaled 1.98M units (1.35M BEV and 630K PHEV), a 68%
yr/yr jump, which increased total global EV stock to 5.12M units
– 78% growth for BEVs (Tesla Model 3 introduced in late 2017) and 50% for PHEVs
Independent Research, Indispensable Results PAGE 10
Sources: CFRA, EVAdoption.com.Consumer Reports Survey Results
• 36% of Prospective Car Buyers said they Would Consider Buying (31%) or Would
Definitely Buy (5%) a Plug-in EV within the next two years
• Interest in owning an EV is highest among consumers with an annual income of
$100,000+
• $100,000 or more - 39% (Would Consider Buying 34%, 5% Would Definitely Buy)
• $50,000-$100,000 - 38% (Would Consider Buying 33%, 5% Would Definitely Buy)
• Less than $50,000 - 32% (Would Consider Buying 28%, 4% Would Definitely Buy)
• Top factors that would make an EV purchase more likely:
• Lower purchase price - 59%
• Longer driving range - 51%
• Lower operating costs - 39%
• Shorter charging time - 36%
• 75% said that incentives and tax rebates for EVs should be available to all buyers;
63% said their state should make it easier for consumers to purchase EVs
Independent Research, Indispensable Results PAGE 11
Sources: Consumer Reports and Union of Concerned Scientists survey of 1,659 U.S. adults conducted between 4/8/18-4/19/19. Margin of error = 2.4%EVs: What The Experts Are Saying
• Former Fiat Chrysler Chairman & CEO Sergio Marchionne
– “I hope you don’t buy it (the Fiat 500e) because every time I sell one it costs me
$14,000.” -May 21, 2014
– “I don’t know of a company that is making money selling electric vehicles unless you
are selling them at the very, very high end of the spectrum.” -January 15, 2018
• Tesla CEO Elon Musk
– “You have to match the convenience of the gasoline car in order for people to buy an
electric car.” -June 28, 2017
• Ford Chairman Bill Ford Jr.
– “Electrification is here to stay. History will show whether it was smart or not (to talk
about plans) but it’s important to signal where we’re going.” -January 15, 2018
Independent Research, Indispensable Results PAGE 12Expiring Tax Credits: Winners & Losers
• Internal Revenue Code Section 30D provides a federal tax credit for Qualified Plug-in
Electric Vehicles
– EV purchases are eligible for a $7,500 federal tax credit until the manufacturer has sold a total
of 200,000 eligible EVs on a cumulative basis for sales beginning January 1, 2010
• The credit begins to phase out over a 12-month period at the beginning of the second
calendar quarter after the manufacturer has sold 200,000 vehicles, as announced by the IRS
– The credit declines to 50% of the original amount ($3,750) over the first six months and to
25% of the original amount ($1,875) over the following six months
• Companies which have sold 200,000 EVs and phase out period dates:
– Tesla: January 1, 2019 – December 31, 2019
– General Motors: April 1, 2019 – March 31, 2020
• Other automakers’ cumulative EV sales in U.S. (through 6/30/19):
– Nissan: 135,550 Ford: 116,926 Toyota: 104,375 BMW: 93,696
Independent Research, Indispensable Results PAGE 13
Sources: CFRA, IRS.gov, EVAdoption.com.The Long List of Failed EV Start-Ups
• Fisker • AMP
• Coda • Aptera
• Spyker Cars • Better Place
• Detroit Electric • Li-ion Motors
• Corbin • HumanCar
• Bright Automotive • LeEco
• Key Takeaway: The global auto industry is a highly competitive, cyclical, high fixed-cost,
and low-margin industry. The failure rate for new entrants is high.
Independent Research, Indispensable Results PAGE 14
Source: CFRA.…And Discontinued Models
Discontinue BEV/
Manufacturer Brand Model Date PHEV Type
General Motors Chevy Volt 2019 PHEV Hatchback
Volkswagen Audi A3 Sportback e-tron 2019 PHEV Sedan
General Motors Cadillac CT6 2019 PHEV Sedan
Ford Ford Focus Electric 2019 BEV Hatchback
Ford Ford C-Max 2018 PHEV Hatchback
General Motors Cadillac ELR 2017 PHEV Coupe
Daimler Mercedes-Benz B250e 2017 BEV Hatchback
Renault-Nissan-Mitsubishi Mitsubishi iMiEV 2017 BEV Subcompact
General Motors Chevy Spark 2016 BEV Subcompact
Toyota Toyota Prius PHV 2016 PHEV Hatchback
Honda Honda Accord 2015 PHEV Sedan
Honda Honda Fit 2014 BEV Subcompact
Toyota Toyota RAV4 EV 2014 BEV SUV
Coda Coda Coda 2013 BEV Sedan
Fisker Fisker Karma 2012 PHEV Sports car
Tesla Tesla Roadster 2012 BEV Sports car
Toyota Toyota RAV4 EV 2003 BEV SUV
Ford Ford Ranger 2002 BEV Pickup
General Motors General Motors EV1 1999 BEV Coupe
General Motors Chevy S-10 Electric 1998 BEV Pickup
Note: BEV = Battery Electric Vehicle, PHEV = Plug-In Hybrid Electric Vehicle
Independent Research, Indispensable Results PAGE 15
Sources: CFRA, EVAdoption.com.25 New EV Models To Debut in U.S. in 2020
Availability Model BEV/ Range Estimated
Manufacturer Brand Model Date Year PHEV Type (miles) MSRP
Aston Martin Aston Martin RapidE 2020 2020 BEV Sedan 200+ $250,000
BMW BMW iX3 2020 2021 BEV SUV 210 $50,000
BMW BMW X5 2020 2021 PHEV SUV 40 $62,000
BMW Mini Cooper S E 2020 2020 BEV Hatchback 114 $37,500
Bollinger Bollinger B1 2020 2020 BEV Pickup/Worktruck 200 $60,000
Daimler Mercedes-Benz EQC 2020 2020 BEV SUV 225 $75,000
Fiat Chrysler Jeep Renegade PHEV 2020 2020 PHEV SUV 25 $28,000
Fiat Chrysler Jeep Wrangler PHEV 2020 2021 PHEV SUV 25 $35,000
Fiat Chrysler Maserati Levante 2020 2021 PHEV SUV 25 $90,000
Ford Ford TBD 2020 2021 BEV SUV 300 $45,000-$48,000
Ford Ford Escape 2020 2020 PHEV SUV 30 $35,000
Geely Volvo XC40 2020 2021 BEV SUV 222 $58,000
Geely Polestar Polestar 1 2020 2020 PHEV Sport coupe 65 $155,000
Geely Polestar Polestar 2 2020 2021 BEV Sedan 275 $63,000
Hyundai Kia Soul 2020 2020 BEV CUV 243 $36,000
Hyundai Kia Stonic 2020 2020 BEV SUV 190 $26,000
Renault-Nissan-Mitsubishi Mitsubishi Outlander 2020 2020 PHEV SUV 38 $36,000
Rivian Rivian R1T 2020 2021 BEV Pickup 230-400 $70,000-$100,000
Tesla Tesla Model Y 2020 2020 BEV CUV 300 $48,000
Toyota Toyota RAV4 2020 2020 PHEV SUV 30 $32,000
Volkswagen Audi Sportback e-tron 2020 2020 BEV Sport coupe 275 $90,000
Volkswagen Audi e-tron GT 2020 2020 BEV Sedan 248 $90,000
Volkswagen Bentley Bentayga Hybrid 2020 2020 PHEV SUV 31 $190,000
Volkswagen Porsche Taycan 2020 2020 BEV Sports car 250 $80,000
Volkswagen Volkswagen I.D. 4 2020 2020 BEV CUV 260 $45,000
Note: BEV = Battery Electric Vehicle, PHEV = Plug-In Hybrid Electric Vehicle
Independent Research, Indispensable Results PAGE 16
Sources: CFRA, EVAdoption.com.The Next Decade: Estimated 2030 EV Sales
2030E U.S. 2030E U.S. EVs as % of
Manufacturer Vehicle Sales EV Sales U.S. Vehicle Sales
BMW 360,000 72,000 20%
Fiat Chrysler 2,100,000 105,000 5%
Ford 2,600,000 130,000 5%
General Motors 3,000,000 72,000 2%
Honda 1,650,000 247,500 15%
Hyundai-Kia 1,300,000 65,000 5%
Mercedes-Benz 380,000 95,000 25%
Nissan 1,600,000 320,000 20%
Tesla 850,000 850,000 100%
Toyota 2,450,000 220,500 9%
Volkswagen 630,000 157,500 25%
Volvo 80,000 40,000 50%
Total 17,000,000 2,374,500 14%
• In the U.S., EV market share is expected to increase from 2.5% of overall vehicle
sales to roughly 14% by 2030
– Tesla and Volvo (Geely) likely to have the greatest EV exposure
– Germany’s “Big Three” automakers expected to make major EV push
Independent Research, Indispensable Results PAGE 17
Sources: CFRA, Edison Electric Institute (EEI).EVs: Concluding Thoughts
• EV sales will surge in the coming years as prices drop closer to parity with gas-
powered vehicles and charging times improve
– $225 billion will be spent to develop more than 200 new plug-in vehicles through 2023, a
figure that doesn’t include hybrids
• We predict that most vehicles will flop, while others will fare better from a sales
perspective
– Price and range will be the two most important factors in determining success; tax credits also
important
• We think a diversified approach to EVs makes the most sense and don’t expect
EVs to be a profit driver for most automakers
• We think future oil prices and global GDP growth are the two biggest factors
that will affect future EV development
Independent Research, Indispensable Results PAGE 18
Sources: CFRA, Alix Partners.Autonomous Vehicle Outlook
Garrett Nelson, Senior Equity Analyst
Independent Research, Indispensable Results PAGE 19Autonomous Vehicles
Independent Research, Indispensable Results PAGE 20
Sources: CFRA, Pxhere.com.The Five Levels of Automation
Where we are today:
Somewhere between Levels 2 & 3
Independent Research, Indispensable Results PAGE 21
Sources: CFRA, Society of Automotive Engineers (SAE).The Case For Autonomous Vehicles (AVs)
• Safety
– 36,560 people died and many more were seriously injured in U.S. motor vehicle crashes in
2018
– 94% of serious motor vehicle crashes are caused by human error
• Economic & Societal Benefits
– Motor vehicle crashes cost $242 billion in economic activity (including $57.6 billion in lost
workplace productivity) and $594 billion due to loss and decreased quality of life due to injury,
according to a 2010 study
– Drivers could be working or doing something more productive
• Efficiency & Convenience
– Americans spend about 54 hours per year stuck in traffic, on average
– Lower fuel costs and vehicle emissions
• Mobility
– Currently 49 million Americans age 65+ and 53 million with some form of disability
Independent Research, Indispensable Results PAGE 22Vehicle Safety Still Improving Absent AVs
Annual U.S. Motor Vehicle Fatality Rate Annual U.S. Motor Vehicle Fatalities
(fatalities per 100 million vehicle miles traveled; 1921-2018) (1921-2018)
25 60,000
24.09
(1921)
50,000
20
40,000
15
30,000
10
20,000
1.13
5 (2018) 10,000
1.08
(2014)
0 0
1921
1925
1933
1937
1941
1949
1953
1957
1961
1965
1969
1977
1981
1985
1993
1997
2005
2009
2013
1929
1945
1973
1989
2001
2017
1921
1925
1933
1937
1941
1949
1953
1957
1961
1965
1969
1977
1981
1985
1993
1997
2005
2009
2013
1929
1945
1973
1989
2001
2017
• The number of U.S. fatalities per 100 million vehicle miles traveled has also fallen steadily from the
peak of 24.09 in 1921 (the first year of statistics) to 1.13 in 2018
• Motor vehicle fatalities have also fallen steadily since peaking at 54,589 in 1972 to 36,560 in 2018
due to new safety technology (ABS, airbags,etc.)
Independent Research, Indispensable Results PAGE 23
Sources: CFRA, National Highway Traffic Safety Administration.The Case Against Autonomous Vehicles
• Safety
– Humans are extremely good drivers and vehicles are safer than ever
• Right now, humans are involved in fatal collision once every 100 million miles
traveled (a 99.999999% safety rate)
• AVs won’t be accepted until they’re as safe as human drivers
• Vehicle safety has improved dramatically
• Economic & Societal Costs
– Technological development costs are incredibly expensive
• November 2018 - Volkswagen announces plans to spend $50 billion by 2023 on
new plants, electric cars, autonomous driving and mobility services
• October 2019 - Hyundai announces plans to invest $35 billion into “future mobility
technology” by 2025
• Cybersecurity
– The more “connected” a cars is, the more easily it can be hacked
Independent Research, Indispensable Results PAGE 24A Level 5 Automated Vehicle
Infiniti QX Inspiration Concept Vehicle
Independent Research, Indispensable Results PAGE 25
Sources: Garrett Nelson, CFRA, North American International Auto Show (NAIAS) 2019.The Global Auto Market: A Snapshot
TOTAL VEHICLE SALES BY REGION
(for the year ended, in millions of vehicles)
2010 2011 2012 2013 2014 2015 2016 2017 2018 2019 2020
U.S. 11.772 13.041 14.786 15.883 16.843 17.846 17.866 17.551 17.701 17.277 16.966
North America 12.859 14.204 15.598 17.527 18.765 19.910 21.175 21.497 21.120 20.613 20.242
South America 5.516 5.980 6.144 6.265 5.565 4.514 4.052 4.334 4.604 4.655 4.525
Europe 18.809 19.740 18.663 18.343 18.588 19.036 20.135 20.755 20.698 19.870 19.175
China 18.062 18.505 19.306 21.984 23.499 24.662 28.028 28.879 28.081 25.273 24.464
Japan 4.956 4.210 5.370 5.376 5.563 5.047 4.970 5.234 5.272 5.193 5.141
Asia, Oceania & Middle East 35.192 35.405 38.226 40.579 42.557 43.411 46.858 48.315 47.410 43.523 42.522
Africa 1.251 1.447 1.569 1.654 1.718 1.550 1.314 1.137 1.236 1.211 1.189
Total 74.972 78.170 82.129 85.606 88.338 89.685 93.856 95.661 95.056 89.871 87.652
% Change
U.S. 10.8% 13.4% 7.4% 6.0% 5.9% 0.1% -1.8% 0.9% -2.4% -1.8%
North America 10.5% 9.8% 12.4% 7.1% 6.1% 6.4% 1.5% -0.4% -2.4% -1.8%
South America 8.4% 2.7% 2.0% -11.2% -18.9% -10.2% 6.9% 7.7% 1.1% -2.8%
Europe 5.0% -5.5% -1.7% 1.3% 2.4% 5.8% 3.1% -0.4% -4.0% -3.5%
China 2.5% 4.3% 13.9% 6.9% 4.9% 13.7% 3.0% -2.8% -10.0% -3.2%
Japan -15.1% 27.5% 0.1% 3.5% -9.3% -1.5% 5.3% 0.7% -1.5% -1.0%
Asia, Oceania & Middle East 0.6% 8.0% 6.2% 4.9% 2.0% 7.9% 3.1% -0.9% -8.2% -2.3%
Africa 15.6% 8.5% 5.4% 3.9% -9.8% -15.2% -13.5% -2.4% -2.0% -1.8%
Total 4.3% 5.1% 4.2% 3.2% 1.5% 4.7% 1.9% -0.6% -5.5% -2.5%
Global Market Share %
U.S. 15.7% 16.7% 18.0% 18.6% 19.1% 19.9% 19.0% 18.3% 18.6% 19.2% 19.4%
North America 17.2% 18.2% 19.0% 20.5% 21.2% 22.2% 22.6% 22.5% 22.2% 22.9% 23.1%
South America 7.4% 7.7% 7.5% 7.3% 6.3% 5.0% 4.3% 4.5% 4.8% 5.2% 5.2%
Europe 25.1% 25.3% 22.7% 21.4% 21.0% 21.2% 21.5% 21.7% 21.8% 22.1% 21.9%
China 24.1% 23.7% 23.5% 25.7% 26.6% 27.5% 29.9% 30.2% 29.5% 28.1% 27.9%
Japan 6.6% 5.4% 6.5% 6.3% 6.3% 5.6% 5.3% 5.5% 5.5% 5.8% 5.9%
Asia, Oceania & Middle East 46.9% 45.3% 46.5% 47.4% 48.2% 48.4% 49.9% 50.5% 49.9% 48.4% 48.5%
Africa 1.7% 1.9% 1.9% 1.9% 1.9% 1.7% 1.4% 1.2% 1.3% 1.3% 1.4%
Total 100.0% 100.0% 100.0% 100.0% 100.0% 100.0% 100.0% 100.0% 100.0% 100.0% 100.0%
Source: International Organization of Motor Vehicle Manufacturers; CFRA estimates for 2019-2020
Independent Research, Indispensable Results PAGE 26
Sources: CFRA estimates for 2019-2020, OICA.How Long Will it Take to Get to Level 5?
Forecasted Annual Global Sales
of Level 5 Autonomous Vehicles
(millions of units)
70 68
60
50
50
40
32
30
20
13
10
4
1
0
2025 2030 2035 2040 2045 2050
• LMC Automotive forecasts that global sales of Level 5 AVs will total 1M in
2025 and increase to 68M in 2050
Independent Research, Indispensable Results PAGE 27
Sources: CFRA, LMC Automotive.AVs: What The Experts Are Saying – Prior to 2019
• Tesla CEO Elon Musk
– “Self-driving technology is almost at a point when owners will be able to fall asleep in
their cars and wake up at their destination. I think that’s about two years (away).” -
October 10, 2014
• Argo AI CEO Bryan Salesky
– “We’re still very much in the early days of making self-driving cars a reality.” -October
16, 2017
• Waymo CEO John Krafcik
– “Fully self-driving cars are here…It’s not happening in 2020, it’s happening today.” -
November 7, 2017
– “Autonomy always will have some constraints.” -November 13, 2018
• General Motors Chairman & CEO Mary Barra
– “We’ve taken the steering wheel and pedals from the AV because we believe we’ll be
able to deploy this in 2019 safely.” -January 16, 2018
Independent Research, Indispensable Results PAGE 28AVs: What The Experts Are Saying – 2019
• May Mobility CEO Edwin Olson
– “Because self-driving cars are only about 0.01% as good as human drivers
today, robotaxis are likely to be a fantasy until 2035.” -February 27, 2019
• Ford CEO Jim Hackett
– “We overestimated the arrival of autonomous vehicles.” -April 9, 2019
• Tesla CEO Elon Musk
– “Next year, for sure, we’ll have over 1 million robotaxis on the road.” -April
22, 2019
• Nissan technology expert Tetsuro Ueda
– “To develop the more advanced Level 3 hands-free automated driving
technology, Nissan will need at least until the late 2020s.” -June 16, 2019
Independent Research, Indispensable Results PAGE 29AVs: What The Experts Are Saying – 2019
• Waymo Chief External Officer Tekedra Mawakana
– “I think the change that I’ve observed over the past year is we’ve gone from a lot of hype that
was sort of unmanageable honestly…A lot of hype was so mismatched to what’s happening in
the real world…Now I think the focus is still very enthusiastic, but also more grounded.” -
October 22, 2019
– “This is probably the greatest technological challenge of our generation.” -October 22, 2019
• Zoox Co-founder & CTO Jesse Levinson
– “Tesla vehicles are not going to be able to drive themselves in 2020 (as promised by Elon
Musk). The vehicles don’t have enough sensors or computers to do that given any remotely
known technology that exists that humans have ever created.” -October 22, 2019
– “Elon would need to come up with 4 or 5 orders of magnitude more performance out of
systems…Somehow he would need to make 50 years more progress. It’s not happening.” -
October 22, 2019
• Apple Co-founder Steve Wozniak
– “I stepped way back on this idea of Level 5. I’ve really given up. I don’t even know if that will
happen in my lifetime.” -October 23, 2019
Independent Research, Indispensable Results PAGE 30Autonomy: Significant Obstacles Remain
• Technological
– Bad weather
– Uneven terrain
– Difficulty identifying and anticipating movement of moving objects
• Legal / Regulatory
– No federal standards to replace state laws/voluntary guidelines
– Insurance liability
• Public Perception
– Consumer distrust
– Cybersecurity fears
Independent Research, Indispensable Results PAGE 31Autonomy: Differing Views on Technology
• Tesla CEO Elon Musk
– “LiDAR (Light Detection and Ranging) is a fool’s errand. And anyone relying on LiDAR is
doomed. Doomed. Expensive sensors that are unnecessary.” -April 22, 2019
• The Verge
– “Practically every other company trying to bring self-driving cars to the road — including Ford,
Uber, Waymo, and GM Cruise — relies on a suite of sensors comprised of LiDAR, cameras,
and radar.” -April 24, 2019
• Cornell Associate Professor of Computer Science Kilian
Weinberger
– “The common belief is that you couldn’t make self-driving cars without LiDAR. We’ve shown,
at least in principle, that it’s possible.” -April 25, 2019
• Investors Business Daily
– LiDAR works in every lighting condition but suffers in scenarios like snow.” -May 24, 2019
Independent Research, Indispensable Results PAGE 32LiDAR: Boom or Bust?
• The majority of automakers are going “all in” on high-cost LiDAR
technology, which stands for Light Detection and Ranging
– This technology uses laser sensors to create 3D maps of their surroundings, measuring
objects’ distance via the speed of light
• Tesla is taking “the road less traveled” from a technology standpoint
– Tesla technology uses two stereo cameras mounted to either side of rearview mirror to record
roads
Independent Research, Indispensable Results PAGE 33AVs: Concluding Thoughts
• Level 5 autonomous vehicles are much farther in the future than
most experts thought a few years ago
– Progress toward Level 5 will be gradual
• We think global GDP growth is the single biggest factor that will
affect future AV development
– R&D costs associated with AV technology are massive and will likely be
the first to be cut from budgets in the event of a downturn
• AV development costs will continue to weigh on consolidated
earnings for major automakers
– If excluding AV losses, Ford’s EBIT would have been 14.3% higher and
GM’s EBIT would have been 8.4% higher in the first nine months of 2019
Independent Research, Indispensable Results PAGE 34
Sources: CFRA, Company reports.EVs & AVs: Winners & Losers
• Winners
– TSLA
• First-mover advantage with attractive combination of price and range
• In-house AV technology development and frequent over-the-air Autopilot software updates
– European Automakers
• Popularity of EVs in many European countries and companies such as Volkswagen, Volvo (Geely), BMW
and Daimler expected to pick up significant market share in U.S.
– Those still eligible for full $7,500 U.S. federal tax credit
– EVs: Light duty trucks (SUVs/crossovers/pickups) with a compelling mix of price and range
• Popularity of category - 69.2% of U.S. new vehicle sales in 2018 (up from 47.5% in 2009)!
• Losers
– The “Big Three” U.S. Automakers
• EVs: lack of sales traction from recent models, playing “catch up” with product pipeline
• AVs: Going “all in” on LiDAR technology
• AV segments have become a significant drag on overall earnings
– An EBIT drag of 8.4% for GM and 14.3% for F in the first three quarters of 2019
Independent Research, Indispensable Results PAGE 35
Sources CFRA, Company reports.Semiconductor Automotive Outlook
Angelo Zino, Vice President
Independent Research, Indispensable Results PAGE 36Automotive – The Next Big Tech Device
• Three Megatrends driving demand for semiconductors:
– Shift to autonomous vehicles
– Electrification of the car
– The ongoing evolution towards a more connected vehicle
• Automotive semiconductor demand to outgrow the broader industry by 2x
through 2022.
• Areas of Focus: Infotainment Systems, Safety, Powertrain, Battery Management,
Body/Lighting Control, and Autonomous features.
• Fully autonomous features years away but semi-autonomous features already
driving content growth (e.g. Tesla Autopilot).
• More advanced approaches (graphics processing units/GPUs) offer upside, with
a fully autonomous car adding over $10K in technology software/hardware.
Independent Research, Indispensable Results PAGE 37Semiconductor Industry Breakdown By Category
Wired, 4%
Automotive,
12%
Computing, 30%
Industrial, 11%
Consumer, 12%
Wireless, 31%
Source: CFRA, IDC
Independent Research, Indispensable Results PAGE 38Semiconductor Content Growth Per Vehicle
Source: CFRA
Independent Research, Indispensable Results PAGE 39A Bifurcated Market For Semiconductors (Content Per Vehicle)
$1,600
$1,400
$1,200
$1,000
$800
$600
$400
$200
$-
2016 2017 2018 2019 2020 2021 2022 2023
Luxury Average Standard
Source: CFRA
Independent Research, Indispensable Results PAGE 40Semiconductor Categories Inside The Vehicle
CATEGORY SENSORS THINK - CONTROLLER ACTIONS
Cellular
Connectivity Wifi, BT, GNSS, NFC Connectivity Controller
Smart Car Access
V2X
Radar Sensor Fusion & Planning
Autonomy (ADAS)
Camera Controller
Lidar
Motion & Pressure
Powertrain & Engine, Transmission, Brake, Battery
Speed Powertrain Controller
Vehicle Dynamics Management, Steering, Airbag, Suspension
Ultrasonic
Temp, Light, Humidity HVAC, Interior Lighting, Doors, Seats,
Body & Comfort Body Controller
Switch Panels Steering Wheel, Mirrors, Wipers, Sunroof
Radio & Audio
Connected
Touch Displays eCockpit Controller eCockpit, Amplifiers
Infotainment
Voice Recognition
Source: CFRA, NXPI
Independent Research, Indispensable Results PAGE 41Electrification of Powertrains Boost Semiconductor Volume
• A Battery Electric Vehicle (BEV) adds about $450 of semiconductor content
relative to combustion engines.
• Improving mix towards electric vehicles over time results in greater revenue
for chipmakers.
• Battery management solutions among fastest growth areas.
Combustion Plug-in Range Battery Electric
Engine (ICE) Mild Hybrid Full Hybrid Hybrid Extended EV Vehicle (BEV)
Combustion Engine ●●●● ●●●● ●●● ●●● ●● -
Main Electric Charging? No No No Yes Yes Yes
Electric Traction - 10-20kW 15-60kW 40-80kW 40-80kW >80kW
Added Semiconductor Value - $200 $350 $400 $425 $450
Circles dictate importance of combustion engine in vehicle.
Source: CFRA, NXP Semiconductors
Independent Research, Indispensable Results PAGE 42ADAS LEVEL DEFINITIONS AND POTENTIAL CONTENT GROWTH
Level Description Human Role Vehicle Role $ Content Increase
0 None All driver control No autonomous functions No Automation
1 Limited + Safety Almost all driver control ABS, traction control +$100
Limited , Active
Lane keeping, emergency braking, adaptive cruise
2 Safety, Mostly driver control +$150
control, parking assist
Convenience
Significant Driver can disengage Advanced controls in simple conditions (highway,
3 +$600
Autonomy completely at times slow-moving congention, good weather)
Driver not needed in some Full conditional autonomous capabilities, more
4 High Autonomy +$900
locations or conditions difficult conditions/locations not autonomous
Autonomous driving in all locations/conditions
Complete
5 No driver needed possible, driver controls (brakes, steering wheel) +$1,200
Autonomy
not necessary
Source: CFRA, LMC Automotive, NXPI
Independent Research, Indispensable Results PAGE 43Sensor Units In Autonomous Cars
• Cameras and sensors give a self-driving car “eyes” --- beneficiaries include
Ambarella, NXP Semiconductors, QUALCOMM, and Analog Devices, among
others.
• Processing chips serve as the artificial brains --- NVIDIA and Intel look to make
progress but in different ways.
Level 1/2 Level 3 Level 4/5
• Radar winning the race over Lidar.
Silicon Value $100 - $150 $600 $900 - $1,200
• Radar and camera sensors seen Sensor Units Units Units
as generating the most volume. Radar 1 to 3 4 to 6 6 to 10
Camera 1 At least 4 6 to 8
• Vehicle-to-everything (V2X)
Lidar NA 0 to 1 1 to 3
communication to benefit from
V2X NA 0 to 1 1 to 2
5G adoption.
Source: Strategy Analytics, NXPI
Independent Research, Indispensable Results PAGE 44Understanding The Function of Different Sensors
Source: CFRA, Ansys
Independent Research, Indispensable Results PAGE 45Comparing “The Eyes” of Self-Driving Vehicles
RADAR LIDAR Cameras
Low Resolution Higher Resolution Highest Resolution
Provides wide angle views of close-up
Works by sending out radio waves that bounce off Uses laser light pulses to scan the surroundings of
surroundings and longer, narrower views of
distant surfaces. the vehicles.
what is ahead.
Most common uses include adaptive cruise control, Millions of laser signals per second fired - reflects Cameras are placed all around self-driving
automatic emergency, braking blind-spot detection, off object surfaces and used to create a 3D model vehicles and able to read road
parking aid, collision avoidance and obstacle detection. of the vehicle surroundings. signs/markings.
Strengths: Able to depict if an object is a bicycle or
Strength: Can see hundreds of yards out and detect Strengths: Best option to get accurate view of
motorcycle or if a pedestrian is facing forward or
size/speed. surroundings
backward – can better predict an object behavior.
Drawback: can't see detail; not able to detect the Drawback: most expensive option and doesn’t Drawback: Doesn’t work well in all weather
identity of objects. work well in bad weather. conditions.
Source: CFRA
Independent Research, Indispensable Results PAGE 46Vehicle-to-Everything (V2X)
• V2X – The passing of information to any entity/object that may affect the
vehicle and vice versa.
• Two main components:
– Vehicle-to-vehicle (V2V) - vehicles to communicate with one another.
– Vehicle-to-infrastructure (V2I) - vehicles communicate with external systems such as
streetlights, buildings and even cyclists or pedestrians.
• A complement to radar/lidar/cameras.
• Resistant to interference and inclement weather.
• Will help bring the concept of smart cities to reality but a very long timeframe.
• 5G will help adoption of C-V2X; Qualcomm a key player.
Independent Research, Indispensable Results PAGE 47All About The Computing Platform
• Computing at the Edge – Data Centers with wheels.
• GPUs and ASICs appear best positioned.
Graphics Processing Unit Application Specific Field Programmable Central Processing Unit
(GPU) Integrated Chip (ASIC) Gate Array (FPGA) (CPU)
Best computational power Flexible programming
A cheaper option once in full Processing power not as
and ideal for deep makes it ideal for
production. great as GPUs.
learning. prototyping.
Unlikely to work on a
GPUs likely to be the
Extremely difficult to create Less powerful and more standalone basis for
industry standard for AI in
and high upfront costs. costly than ASICs. Level 4 and Level 5
the vehicle.
vehicles.
FPGA leaders include
NVIDIA the dominant
Tesla Xilinx, Intel and Lattice Intel
player
Semiconductor.
Source: CFRA
Independent Research, Indispensable Results PAGE 48How Autonomous Cars Function
• Map Building
– Lidar and camera technology are best for scanning surroundings
– Processors aggregate the sensor, GPS and IMU inputs to build the map
• Path Planning
– Find the safest and quickest route to a location
– Navigate through obstacles and be able to change lanes/pass vehicles.
– Essentially, like a GPS system and extremely short-range plans (seconds) are updated
continuously.
• Perception/Obstacle Avoidance
– Processors use AI/machine learning to identify objects and predict their behavior.
– Constant communication with other vehicles and adjustments will be made when issues arise.
Independent Research, Indispensable Results PAGE 49Leading Providers of Autonomous Capabilities
• Tesla and Waymo have a first mover advantage but the field is likely to quickly catch up.
• Other Technology companies (e.g. Apple) poised to enter the space over time.
• Ridesharing players will likely be among the earliest adopters.
Tesla Waymo NVIDIA
Utilizes real-world data to create a self-
Most of the data generated via
driving car (access to all vehicle GPU hardware/software supplier.
simulators.
movements/decisions).
Commercially sells its own ready-
Utilizes only cameras and radar; no Lidar. Leverages Lidar technology.
made simulator (Constellation).
Utilizes a GPU and paving the way
The brain is an internally developed Will lower barriers to entry for the
for more Tech companies to
processor (ASIC). auto industry.
participate.
Source: CFRA and NXP Semiconductors
Independent Research, Indispensable Results PAGE 50Connected Infotainment Systems Maturing
• Infotainment market maturing but greater demand for e-cockpits and relatively low
penetration rates in China provide additional room for growth.
• More advanced e-cockpit systems could include gesture sensors so that passengers in the
back seat can use motions to control music or the radio.
$, Billions)
• Increasing displays are being sold in a
$4.0
$3.5
vehicle (front and rear screens).
$3.0
• On the radio side, new audio $2.5
applications coming (e.g. active noise $2.0
cancellation, engine sound $1.5
enhancement, more channels and $1.0
high-end applications). $0.5
$0.0
2018 2019e 2020e 2021e
eCockpit, Headunit Radio, Audio
Source: CFRA and NXP Semiconductors
Independent Research, Indispensable Results PAGE 51Top 20 Global Chipmakers – Auto Exposed Likely to Outperform
100%
80%
60%
40%
20%
0%
Wireless Wired Industrial Consumer Computing Automotive
Source: CFRA, IDC
Independent Research, Indispensable Results PAGE 52Mapping The Automotive Chip Suppliers (U.S. Coverage)
Exposure to Category
Powertrain &
Auto % of Autonomy Vehicle Body & Connected
Ticker Company Name Sales Connectivity (ADAS) Dynamics Comfort Infotainment
ADI Analog Devices, Inc. 16% X X X X X
AMBA Ambarella, Inc. 20% X
AVGO Broadcom Inc. 1% - 2% X
CREE Cree, Inc. 5% - 10% X
CY Cypress Semiconductor Corporation 38% X X
DIOD Diodes Incorporated 10% X X X
INTC Intel Corporation 1% - 2% X
LSCC Lattice Semiconductor Corporation 15% - 20% X X
MPWR Monolithic Power Systems, Inc. 14% X X X
MRVL Marvell Technology Group Ltd. ≥5% X
MXIM Maxim Integrated Products, Inc. 25% X X X
NVDA NVIDIA Corporation 8% X X
NXPI NXP Semiconductors N.V. 48% X X X X X
ON ON Semiconductor Corporation 32% X X X
QCOM QUALCOMM Incorporated 2% X
TXN Texas Instruments Incorporated 20% X X X X
CFRA, S&P Global Market Intelligence
Independent Research, Indispensable Results PAGE 53Questions Independent Research, Indispensable Results PAGE 54
Disclosures

The content of this Presentation and the opinions expressed herein are those of CFRA based upon publicly-available information that CFRA believes to be reliable but are subject to change without notice.
This Presentation has not been submitted to, nor received approval from, the United States Securities and Exchange Commission or any other regulatory body. While CFRA exercised due care in compiling
this Presentation, CFRA AND ALL RELATED ENTITIES SPECIFICALLY DISCLAIM ALL WARRANTIES, EXPRESS OR IMPLIED, to the fullest extent permitted by law, regarding the accuracy,
completeness, or usefulness of the information contained herein and assumes no liability with respect to the consequences of relying on this information for investment or other purposes. No content herein
(including ratings, credit-related analyses and data, valuations, model, software or other application or output therefrom) or any part thereof may be modified, reverse engineered, reproduced or distributed
in any form by any means, or stored in a database or retrieval system, without the prior written permission of CFRA. This Presentation shall not be used for any unlawful or unauthorized purposes. CFRA
and its third-party providers, as well as its and their directors, officers, shareholders, employees or agents, do not guarantee the accuracy, completeness, timeliness or availability of this Presentation.

CFRA's primary financial data provider is S&P Global Market Intelligence. FOR RECIPIENT'S INTERNAL USE ONLY.

Certain information in this presentation is provided by S&P Global, Inc. and/or its affiliates and subsidiaries (collectively “S&P Global”). Such information is subject to the following disclaimers and notices:
“Copyright © 2019, S&P Global Market Intelligence (and its affiliates as applicable). All rights reserved. Nothing contained herein is investment advice and a reference to a particular investment or security,
a credit rating or any observation concerning a security or investment provided by S&P Global is not a recommendation to buy, sell or hold such investment or security or make any other investment
decisions. This may contain information obtained from third parties, including ratings from credit ratings agencies. Reproduction and distribution of S&P Global’s information and third party content in any
form is prohibited except with the prior written permission of S&P Global or the related third party, as applicable. Neither S&P Global nor its third party providers guarantee the accuracy, completeness,
timeliness or availability of any information, including ratings, and are not responsible for any errors or omissions (negligent or otherwise), regardless of the cause, or for the results obtained from the use of
such information or content. S&P GLOBAL AND ITS THIRD PARTY CONTENT PROVIDERS GIVE NO EXPRESS OR IMPLIED WARRANTIES, INCLUDING, BUT NOT LIMITED TO, ANY WARRANTIES
OF MERCHANTABILITY OR FITNESS FOR A PARTICULAR PURPOSE OR USE AND ALL S&P INFORMATION IS PROVIDED ON AN AS-IS BASIS. S&P GLOBAL AND ITS THIRD PARTY CONTENT
PROVIDERS SHALL NOT BE LIABLE FOR ANY DIRECT, INDIRECT, INCIDENTAL, EXEMPLARY, COMPENSATORY, PUNITIVE, SPECIAL OR CONSEQUENTIAL DAMAGES, COSTS, EXPENSES,
LEGAL FEES, OR LOSSES (INCLUDING LOST INCOME OR PROFITS AND OPPORTUNITY COSTS OR LOSSES CAUSED BY NEGLIGENCE) IN CONNECTION W ITH ANY USE OF THEIR
INFORMATION OR CONTENT, INCLUDING RATINGS. Credit ratings are statements of opinions and are not statements of fact or recommendations to purchase, hold or sell securities. They do not
address the suitability of securities or the suitability of securities for investment purposes and should not be relied on as investment advice.”

CFRA, CFRA Accounting Lens, CFRA Legal Edge, CFRA Score, and all other CFRA product names are the trademarks, registered trademarks, or service marks of CFRA or its affiliates in the United
States and other jurisdictions. CFRA Score may be protected by U.S. Patent No. 7,974,894 and/or other patents. Copyright © 2019 CFRA. All rights reserved.

                             Independent Research, Indispensable Results                                                                                                                              PAGE 55
Disclosures, continued.
This Presentation is published and originally distributed by Accounting Research & Analytics, LLC d/b/a CFRA (“CFRA US”), with the following exceptions: In the UK/EU/EEA, it is published and originally
distributed by CFRA UK Limited (company number 08456139 registered in England & Wales with its registered office address at New Derwent House, 69-73 Theobalds Road, London, WC1X 8TA, United
Kingdom), which is regulated by the Financial Conduct Authority (No. 775151), and in Malaysia by CFRA MY Sdn Bhd having Company No. 683377-A and regulated by Securities Commission Malaysia,
No. CMSL/A0181/2007 (“CFRA Malaysia”). CFRA Malaysia is a wholly-owned subsidiary of CFRA US. These parties and their subsidiaries maintain no responsibility for CFRA reports or materials
redistributed by third parties such as brokers or financial advisors.
Past performance is not necessarily indicative of future results. This Presentation may contain forward-looking statements or forecasts; such forecasts are not a reliable indicator of future performance.
This Presentation is not intended to, and does not, constitute an offer or solicitation to buy and sell securities or engage in any investment activity. This Presentation is for informational purposes only.
Recommendations in this Presentation are not made with respect to any particular investor or type of investor. Securities, financial instruments or strategies mentioned herein may not be suitable for all
investors and this material is not intended for any specific investor and does not take into account any investor's particular investment objectives, financial situations or needs. Before acting on any
recommendation in this material, you should consider whether it is suitable for your particular circumstances and, if necessary, seek professional advice.
Additional information on a subject company may be available upon request.
The Global Industry Classification Standard (GICS®) was developed by and/or is the exclusive property of MSCI, Inc. and S&P Global Market Intelligence. GICS is a service mark of MSCI and S&P
Global Market Intelligence and has been licensed for use by CFRA.
Any portions of the fund information contained in this Presentation supplied by Lipper, A Thomson Reuters Company, are subject to the following: “Copyright 2019 © Thomson Reuters. All rights
reserved. Lipper shall not be liable for any errors or delays in the content, or for any actions taken in reliance thereon.”
The information provided in this communication is solely for educational purposes and should not be construed as advise or an investment recommendation. Fidelity Investments is a separate company,
unaffiliated with CFRA. There is no form of partnership, agency affiliation, or similar relationship between CFRA, nor is such a relationship created or implied by the information herein. Fidelity Investments
has not been involved with the preparation of the content supplied by CFRA and does not guarantee or assume any responsibility for its accuracy or completeness.
Copyright © 2019 CFRA. All rights reserved. CFRA and STARS are registered trademarks of CFRA.
Independent Research, Indispensable Results PAGE 56You can also read