COVID-19: QUARANTINED ECONOMICS - Global Economic Outlook as of March 2020 - Allianz

Page created by Adrian Leon
 
CONTINUE READING
COVID-19: QUARANTINED ECONOMICS - Global Economic Outlook as of March 2020 - Allianz
COVID-19:
QUARANTINED
ECONOMICS

Economic, Capital Markets
and Industry Research

Global Economic Outlook
as of March 2020

© Copyright Allianz
COVID-19: QUARANTINED ECONOMICS - Global Economic Outlook as of March 2020 - Allianz
PRE COVID-19: WALL OF FRAGILITIES

    FRAGMENTATION                                  ECONOMIC FLATLINE                                           EUROPEAN HOTSPOTS                                    USA 2020 ELECTION
•   February 14: US section 301                •    No full-fledged global recession                       •    The UK formally left the EU on 31               •   Additional volatility, in the U.S., on the
    tariffs of 15% imposed on                                                                                   January 2020, but there is still a lot to           back of the campaign: trade policies,
                                               •    Soft landing of the economy: after
    01/09/2019 (subset of                                                                                       talk about and months of negotiations               financial vulnerabilities, the fragile
                                                    +3.1% in 2018, +2.5% in 2019,
    USD300bn) cut in half.                                                                                      to come. Expect a longer transition                 emerging markets and high valuations
                                                    +2.4% in 2020E (expected before
•   Average US tariffs on imports                                                                          •    Weak governing coalitions                           will create more volatility.
                                                    COVID-19)
    from China remain elevated at
    19.3%.

                                    PROTESTS                                      OVERVALUATION                                                  ZERONOMICS
                          •   From Hong Kong to Santiago de               •   Overvalued equity markets
                                                                                                                                      •   End of period forecasts: Bund -0.6%
                              Chile                                       •   Increasing risks for corporates in U.S.,
                                                                                                                                          2019, -0.1% 2020. 10-year U.S: 1.6%
                                                                              Eurozone & China (SOEs)
                                                                                                                                          2019, 1.9% 2020 – before COVID-19
                                                                          •   Neo-asset managers

                                                           CASH PILES                                                      Central Banks                                              POCKETS OF
                                              •    Companies have hoarded cash                                   •   Central banks allowed a stabilization of                         RESILIENCE
                                              •    High savings rate among households                                the protectionist shock                                                                     2
    © Copyright Allianz                       •    Low unemployment rate and steady                              •   Low inflation was favorable to
                                                   increase of salaries                                              consumption
COVID-19: QUARANTINED ECONOMICS - Global Economic Outlook as of March 2020 - Allianz
COVID-19 PANDEMIC COULD LAST TILL MIDYEAR
      Distribution of confirmed cases of COVID-19 (%, data up                       Daily change in number of confirmed cases per 1mln
                           to 19 March 2020)                                                 people (data up to 19 March 2020)
      100
                                                                                 1000.0
        90
        80                                                                        100.0
        70
        60                                                                          10.0
        50
        40                                                                           1.0
        30
        20                                                                           0.1

        10
         0                                                                           0.0
       1/11/2020     1/25/2020        2/8/2020     2/22/2020      3/7/2020                 0   2   4   6   8 10 12 14 16 18 20 22 24 26 28 30 32 34 36 38 40
                   Rest of the world
                   Europe                                                                  Hubei province, from 17/01               South Korea, from 17/02
                   APAC excluding mainland China (and excl. Diamond Princess)              Italy, from 20/02                        France, from 28/02
                   Rest of mainland China                                                  Germany, from 01/03                      U.S., from 07/03
    Source: OfficialHubei
                     reports,  Allianz Research
                          province                                              Source: Official
                                                                                           Spain,reports,   Allianz Research
                                                                                                    from 28/02

    Until 26 February, more than 95% of confirmed                               The spread of the epidemic in China took 26 days to
    cases of COVID-19 were in mainland China. The                               recede (on 18 February), after confinement
    distribution has since spread to the rest of the world,                     measures were put in place. They have started to be
    with c.43% of cases located in Europe, as of 19                             gradually lifted from mid-March. Italy, France,
    March.                                                                      Germany and the U.S. are trailing the Hubei province
© Copyright Allianz
                                                                                by nearly two months.                                                          3
COVID-19: QUARANTINED ECONOMICS - Global Economic Outlook as of March 2020 - Allianz
NOTHING TO FEAR … BUT FEAR ITSELF
                                            Ex-China Covid - 19                                               Confirmed cases outside China – perceived daily rate of
                10000                                                                                     20%                        spread
                                    Gap
                                    Daily change in confirmed cases outside China
                                    Daily change threshold
Number of new cases

                      8000                                                                                16%
                      6000    Daily change threshold: Threshold, in

                                                                                             Daily rate
                              number of cases, at which the                                               12%
                              acceleration of the corona virus
                      4000    contagion would be 0 (Peak of the
                              contagion).                                                                  8%
                      2000
                                                                                                           4%
                          0

                      -2000                                                                                0%
                           21-Jan      4-Feb       18-Feb        3-Mar   17-Mar     31-Mar                  21-Jan     4-Feb      18-Feb        3-Mar       17-Mar       31-Mar

                       The challenge facing capital markets today is not one of                    In this context, capital markets cannot afford to wait for hard
                       pricing risk (known unknowns). It is instead one of pricing                 economic data to confirm their fears. Yet, the likelihood that
                       uncertainty (unknown unknowns): no one knows what                           developed countries can effectively contain and then stop
                       cannot happen, but the likelihood of a bad outcome is                       the epidemic, both physically and economically, is certainly
                       perceived to rise, as the number of confirmed cases                         not zero. Most likely, it is even higher than the likelihood of
                       outside China is not showing any sign of slowing down.                      the adverse outcome. When the perceived rate of
                                                                                                   spreading reverses, this may be the trigger for a market
            © Copyright Allianz
                                                                                                   recovery.                   Source: W.H.O. daily situation reports, AZ Research

                                                                                                                                                                                4
COVID-19: QUARANTINED ECONOMICS - Global Economic Outlook as of March 2020 - Allianz
PASS-THROUGH 1: GLOBAL TRADE INTO RECESSION
            Global Trade growth in volume and value (%, y/y)               Cost for global trade for one month of confinement
                                                                                                 (USDbn)

                                                                                                                                     Transport services
                                                                                                                     Travel          A 50% shock due to
                                                                                                Goods
                                                                                                                No travel during    the closure of borders        Total
                                                                                              20% shock
                                                                                                                  one month            & containement
                                                                                                                                           measures
                                                               EU 28                             104.1                 34.8                  16.1                  155
                                                               China                             72.0                  24.0                  8.0                   104
                                                               US                                42.8                  11.1                  4.2                    58
                                                               Total per month                    219                   70                    28                   317
                                                               Total per quarter                  436                  282                    54                   772
                                                               * For goods and transport services 1 month of lockdown, 1 month of 70% back to normal activity and 1 month of
                                                               80% back to normal activity
                                                                For travel we take full impact for three months

                                                               Sources: ITC, Euler Hermes
    Sources: IHS Markit, Euler Hermes, Allianz Research

    We expect two quarters of recession in trade in            We estimate that one month of confinement in the EU, China
    goods and services (Q1 and Q2) which will bring the        and the US would lead to USD317bn of export losses at the
    annual figure to -3.7% in 2020. In value terms,            global scale. Over a quarter, taking into account a
    plummeting commodity prices will weigh on prices.          progressive come back to normal levels of activity, the losses
                                                               would reach more than USD700bn
© Copyright Allianz                                                                                                                                                       5
COVID-19: QUARANTINED ECONOMICS - Global Economic Outlook as of March 2020 - Allianz
CLOSURE OF BORDERS IS A KEY RISK FOR SUPPLY
 CHAINS IN GERMANY, ITALY AND FRANCE
                                 Western Europe sector vulnerabilities to imports from Eastern Europe
                                                    Belgium        France     Germany     Italy    Netherlands   Spain
                           Agrifood                     0.22%           0.41%     1.11%      1.00%       0.45%      0.51%
                           Automotive                   0.60%           1.37%     2.82%      0.99%       0.73%      1.14%
                           Chemicals                    0.13%           0.46%     1.02%      0.52%       0.37%      0.43%
                           Commodities                  0.40%           0.04%     0.17%      0.34%       0.22%      0.07%
                           Construction                 0.48%           0.84%     2.25%      1.84%       0.69%      0.61%
                           Electronics                  0.19%           0.42%     0.88%      0.60%       0.25%      0.41%
                           Energy                       0.01%           0.02%     0.22%      0.15%       0.14%      0.08%
                           Household Equipment          0.73%           0.84%     1.98%      1.18%       0.72%      0.85%
                           Machinery & Equipment        0.49%           0.67%     2.43%      0.73%       0.55%      0.74%
                           Metals                       0.23%           0.36%     1.23%      0.71%       0.40%      0.35%
                           Paper                        0.16%           0.41%     1.65%      0.68%       0.53%      0.43%
                           Pharmaceuticals              0.08%           0.24%     0.50%      0.20%       0.29%      0.31%
                           Textile                      0.18%           0.31%     0.78%      1.07%       0.24%      0.18%
                           Transport Equipment          0.23%           0.18%     0.73%      0.54%       0.45%      0.18%
                           Total (incl. Others)         0.26%           0.56%     1.39%      0.74%       0.43%      0.52%
                          Sources : ITC, Euler Hermes, Allianz Research
Germany appears as the most dependent to imports from Eastern Europe (most notably in the agri-food, construction and machinery
and equipment sectors). Germany is followed by Italy (with the highest dependency in construction, household equipment, textile) and
France (with automotive, construction and household equipment). Sectors the most at risk of supply chain disruption are the
automotive, construction and household equipment sectors. It appears that the chemicals, electronics, pharmaceuticals and transport
equipment are the most resilient due to low levels of importations from Eastern Europe. When looking at the risk of insolvencies due to
sourcing issues, in the top 5 sectors/countries most at risk, four sectors are in Germany: construction, paper, automotive and household
equipment.
 © Copyright AllianzThe construction sector in France is the fifth sector.                                                           6
COVID-19: QUARANTINED ECONOMICS - Global Economic Outlook as of March 2020 - Allianz
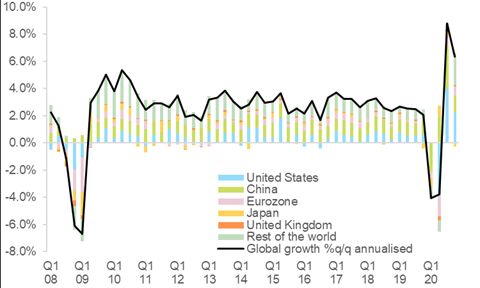
PASS-THROUGH 2: FINANCIAL SHOCK (AS OF 19.03.20)
                                      19.03.2020   Year-to-date   ∆Weekly   19.03.2020 - 20.02.2020   19.03.2020 - 20.01.2020                 Brent Crude price forecast
Sovereign Yields (10y)                     %                                      bps
US                                       1.13         -78           28                -40                      -71
Eurozone                                -0.17          2            57                 28                       5
Germany                                 -0.17          2            57                 28                       5
France                                     42         12           -16                 20                       17
Italy                                     199         37           -49                 63                       41
Spain                                     109         43           -12                 41                       42
United Kingdom                           0.72         -10           46                 15                       7
Japan                                    0.10         13            16                 15                       10
Emerging Markets ($)                     673          372          173                363                      380
Corporate Credit - Investment Grade       bps                                     bps
US                                       351          250          129                247                      252
Europe                                   227          133           55                138                      135
Corporate Credit - High Yield             bps                                     bps
US                                       982          622          240                620                      644
Europe                                   839          531          210                539                      539
Foreign Exchange                         level                                     %
USD EUR                                  1.07         -4.7         -3.4               -0.9                     -3.4
JPY USD                                110.09         1.4           4.2               -1.8                     -0.1
GBP EUR                                  0.92         8.3           4.2               9.8                       8.0
Equities                                 level                                     %
US                                       2409         -25.4         -2.9             -28.6                    -27.6
Eurozone                                 2454         -34.5         -3.6             -35.8                    -35.4
Germany                                  8610         -35.0         -6.0             -37.0                    -36.4
France                                   3856         -35.5         -4.7             -36.4                    -36.6
Italy                                   15467         -34.2          3.8             -38.3                    -35.6
Spain                                    6396         -33.0          0.1             -35.6                    -33.8
                                                                                                                                Source: Bloomberg, Euler Hermes, Allianz Research
United Kingdom                           5152         -31.7         -1.6             -30.7                    -32.7
Japan                                   16553         -30.0        -10.8             -29.5                    -31.3
Emerging Markets ($)                     766          -31.2        -13.2             -30.0                    -33.1             We have revised down our 2020 oil price forecast
World ($)                                1694         -28.2         -4.6             -30.0                    -29.8
Equity Volatility                        level                              absolute change                                     to USD 41/bbl avg (Q2 average to USD 28/bbl)
US                                       72.0         58.2         -3.5               56.4                     59.9
Eurozone                                 78.4         64.4          6.8               64.3                     67.1             on the grounds of further demand forecast
Commodities
Oil Brent ($ per barrel)
                                         level
                                         26.9         -59.4        -17.8
                                                                                   %
                                                                                     -54.7                    -58.7
                                                                                                                                reduction globally on prolonged lockdowns lasting
Gold ($ per ounce)                     1475.0          -3.0         -6.1              -9.0                     -5.5             well into if not the entire Q2.
 © Copyright Allianz
                                                                                                                                                                                    7
Source: Refinitiv, AZ Research
COVID-19: QUARANTINED ECONOMICS - Global Economic Outlook as of March 2020 - Allianz
GLOBAL MONETARY AND FINANCIAL CONDITIONS: A
HUGE TIGHTENING
                               Global Equity Indices                                             Major cross currency bases vs USD
   100 = 31.12.2018                                                           bps
                                                                                    0
   140

                                                                                -20
   120

                                                                                -40
   100
                                                                                -60
    80
                                                                                -80
                  MSCI World            Airlines
    60
                  Hotel & Rest          Energy                                 -100
                                                                                  31-Mar       30-Jun       30-Sep       31-Dec       31-Mar   30-Jun
    40
                                                                                                          Japanese Yen         EURO
     Dec-18           Mar-19   Jun-19     Sep-19   Dec-19   Mar-20   Jun-20
   Sources: Refinitiv, Allianz Research                                       Sources: Bruegel, IHS Markit, Allianz Research

The sharp correction of global equity prices also mirrors                     The strong appreciation of the Dollar, beside a significant
much stronger difficulties in issuing capital and financing                   widening of credit spreads, represents another contributor to
any investment plan. The most exposed sectors to the                          a tightening of monetary and financial conditions, especially
current shock indeed under-perform and are likely to                          for emerging economies. It will be difficult to issue debt or
face     obstacles
 © Copyright Allianz in funding their activity                                refinance in the coming weeks                            8
COVID-19: QUARANTINED ECONOMICS - Global Economic Outlook as of March 2020 - Allianz
MONEY MARKETS: PRICING A GLOBAL RECESSION
                  12m ahead market-based monetary policy change                                                   Global 10y Sovereign Markets (%)
                               expectations (bps)                                         6
                          China Outbreak (20-Jan)    Global Outbreak (21-Feb)
10                                                                                 0
                                                                                          5

                                                                                   -30    4
 0
                                                                                   -60    3
-10
                                                                                          2
                                                                                   -90
-20                                                                                       1
                                                                                   -120
                                                                                          0
-30                                                                                -150
  31-Dec         14-Jan     28-Jan      11-Feb      25-Feb    10-Mar      24-Mar          -1
                                                                                               2006        2008      2010   2012      2014      2016       2018        2020
                Eurozone         UK        Japan       United States (RHS)
                                                                                                      US          Germany     Japan       UK        World Aggregate

   As the Covid19 pandemic advances, money markets have                                   The current money market situation is far from optimistic
   increasingly priced in a sharp economic slowdown paired                                as the ultra-low yields in short-term maturities are
   with an extremely dovish monetary policy stance. This                                  exerting an exogenous downside pressure on the long-
   situation became obvious after the US Fed cut 150bps from                              end of the curve. At this point in time, it is fair to assume
   pre-Covid19 values. Similarly, EUR money markets are                                   that recent market movements have significantly
   currently positioned for a 20bps cut even after the ECB                                detached long-term yields from their fundamental
   recently decided to leave rates unchanged.                                             determinants (Potential growth, long-term inflation, etc.).
                                                                                                                                      Source: Refinitiv, AZ Research
 © Copyright Allianz
                                                                                                                                                                              9
COVID-19: QUARANTINED ECONOMICS - Global Economic Outlook as of March 2020 - Allianz
PASS-THROUGH 3: SECLUSION RECESSION
 FOLLOWED BY U-SHAPE RECOVERY
          Global real global GDP growth, q/q annualized                                          Real global GDP growth, annual, %
                                                                                                           2017              2018              2019            2020        2021
                                                      Forecasts
                                                                  World GDP growth                          3.3               3.1                  2.5          0.8         3.0
                                                                  United States                             2.4               2.9                  2.3          0.5         2.7

                                                                  Latin America                             0.9               1.0                  0.0         -1.2         1.6
                                                                  Brazil                                    1.1               1.3                  1.1         -0.7         1.6

                                                                  United Kingdom                            1.8               1.3                  1.4         -0.7         1.2
                                                                  Eurozone members                          2.7               1.9                  1.2         -1.8         2.1
                                                                  Germany                                   2.8               1.5                  0.6         -1.8         2.2
                                                                  France                                    2.4               1.7                  1.3         -1.3         2.2
                                                                  Italy                                     1.7               0.7                  0.3         -3.5         1.7
                                                                  Spain                                     2.9               2.4                  2.0         -0.8         2.0

                                                                  Russia                                    1.6               2.3                  1.3          1.2         1.8
                                                                  Turkey                                    7.5               2.8                  0.9          2.5         4.0
                                                                  Asia                                      5.4               4.9                  4.4         3.0          4.4
                                                                  China                                     6.9               6.7                  6.1         4.0          5.8
                                                                  Japan                                     2.2               0.3                  0.7         -0.5         1.0
                                                                  India                                     7.3               6.2                  5.0         5.5          5.8
   Sources: Euler Hermes, Allianz Research
                                                                  Middle East                               1.2               1.1                  0.6          0.2         2.3
We expect the supply and demand shocks, especially                Saudi Arabia                              -0.7              2.4                  0.2          1.2         2.0
                                                                  Africa                                    3.1               2.7                  1.9         0.8          2.4
through confinement to push the global economy into               South Africa                              1.4               0.8                  0.3         -0.5         0.7
recession in H1 2020 with the U.S. and the Eurozone               * Weights in glob al GDP at market price, 2019
                                                                                                                                                         NB: the forecasts for the
being in recession. We expect a U shape recovery                  NB: The revisions refer to the changes in our forecasts since the last quarter
                                                                                                                                                         Eurozone take into account
                                                                  Fiscal year for India
thereafter.
  © Copyright Allianz
                                                                  Sources: Euler Hermes, Allianz Research
                                                                                                                                                         1 month lockdown             10
POLICY TRADE-OFF: HEALTH VS. ECONOMIC COSTS
                                   Contagion in different confinement scenarios                                                              Economic hit in different confinement scenarios

                                                                      = Without confinement measures                                                                                 = Without confinement measures

                                                                                                         Economic hit (e.g. on GDP)
Number of people infected

                                                                      = With confinement measures                                                                                    = With confinement measures

                                                                              How many very sick
                                                                            people hospitals can treat

                                                Around 2 months period of time                                                                            Around 1 year period of time

                            Sources: Euler Hermes, Allianz Research                                                                   Sources: Euler Hermes, Allianz Research

                            Drastic confinement measures should help flatten the                                                      Confinement measures are very costly for economic
                            infection curve, which alleviates the pressure on                                                         activity, but probably necessary to contain the health
                            medical systems. Very strict rules in East Asian                                                          and human costs of the epidemic.
                            countries seem to have proved efficient to control the
                            COVID-19 outbreaks.
 © Copyright Allianz                                                                                                                                                                                                  11
POLICY BAZOOKAS: WAR ECONOMICS
                 Central Banks: Whatever it takes to “Bring it on”                                                 Total fiscal stimulus and policies aimed at corporates
                                                                                                              EU             Germany           France          Italy            Spain         USA
             ECB                           FED                           PBOC
- Bold & generous TLTRO         - 150bp rate cut               - 10bp cut to the policy                                                                        €25bn (1.4%
                                                                                                                                                                                €17bn         $1trn
                                                                                               Total                         €150bn            €45bn           of GDP) +
  terms with average rate       - Restart of QE to the tune      rate (Loan Prime Rate)                       €37bn                                                             (1.4% of      (4.5% of
                                                                                               stimulus                      (5% of GDP)       (2% of GDP)     further
  below MRO plus an               of USD700bn                  - Liquidity injection through                                                                                    GDP)          GDP)
                                                                                                                                                               €20bn likely
  interim TLTRO round for       - USD1.5tn of                    open market operations:
  immediate liquidity             supplementary liquidity        RMB1.7tn in early                            €28bn in       €550bn in loans   €300bn in       €5bn             €100bn,       $250bn in
- EUR120bn QE envelope            injections in the repo         February.                                    loans to       via KfW &         guarantees,     (further         €400m         SME loans
  till end-2020 on top of         market to backstop           - Liquidity injection through                  SMEs via       unlimited if      unlimited if    increase         credit line
  monthly EUR20bn QE              liquidity in the Treasury      medium-term lending:          State loans    the EIB,       needed, €50bn     needed, €2      under            for
  pace                            market                         RMB300bn in total over        &              further        for self-         solidarity      discussion)      tourism
- temporary capital &           - three-month credit in          February and March.           guarantees     ESM-           employed,         fund for the                     sector
  operational relief to banks     U.S. dollars on a regular    - Liquidity injection through                  backed loan    export            self-
- PEPP EUR750bn plus              basis and at a rate            reserve requirement ratio                    facility       guarantees        employed
  informal drop in the 33%        cheaper than usual             cut: RMB550bn, with cut                      discussed      (€153bn)
  issuer limit                    arranged among G6              between 50-200bp                                            Easing rules to   €35 for one     Tax              €14bn in      income tax
                                  central banks                  depending on banks.                                         defer taxes,      month tax       suspension       tax relief    holidays for
                                - Instalment of commercial     - Credit support:                                             reduce            deferral plus                    for SMEs      2020
                                                                                               Tax
                                  paper funding facility         RMB350bn provided by                                        prepayments,      help with                        and self-
                                                                                               deferrals
                                - Further increase in QE         policy banks, RMB300bn                                      suspension of     loan                             employed
                                                                                                                             penalties and     rescheduling
                                  purchase                       earmarked loans from
                                                                                                                             late-payments     , tax rebates
                                - Liquidity swaps with           PBOC to banks.
                                                                                                              Looser EU      Looser                                                           Looser
                                  major central banks                                                         state aid,     insolvency laws                                                  banking
                                - Money Market Mutual                                          Looser
                                                                                                              fiscal rules                                                                    regulation
                                  Fund Liquidity Facility                                      regulation
                                                                                                              & banking
                                                                                                              regulation
       *Forecasts do not take into account State guarantees and potential nationalization.                                   TUI has reached   Support         Nationalizati                  $50bn for
                                                                                               Equity
       Sources: Allianz Research                                                                                             out for state     announced       on of Alitalia                 airlines
                                                                                               stakes /
                                                                                               nationalizat                  support           for Renault &
                                                                                               ions                                            PSA
   © Copyright Allianz                                                                                                                                                                           12
                                                                                                                                                                                                      12
LABOR MARKET: 65 MILLION PEOPLE POTENTIALLY
IN NEED OF JOB SUPPORT AT EU LEVEL
         Monthly new bank loans and stock of corporate debt,            Employment at risk and cost for public finances
                              EUR bn
                                                                                          Compensation (incl.
                                                               Cost of Kurzarbeit at        employer social         Full time-jobs at
                                                                  70% subsidy           contributions, EUR bn) at    risk in Million
                                                                                                   risk

                                                               EU 27                                140                    65
                                                               Eurozone                             122                    49
                                                               Germany                               40                    12
                                                               France                                25                    7
                                                               Italy                                 16                    8
                                                               Spain                                 12                    9

    Sources: ECB, BIS, Euler Hermes, Allianz Research           Sources: Eurostat, Euler Hermes, Allianz Research

    Public guarantees in the Eurozone of EUR1000bn             A lockdown is estimated to shutdown 30% of the economy
    (EUR500bn in Germany, EUR300bn in France,                  and hence put jobs at risk given the temporary pause of
    EUR100bn in Spain) will help avoid company                 activity. We estimate that 65 million people could be in
    bankruptcy for 3 to 4 months.                              need for partial unemployment benefits which would cost
© Copyright Allianz                                            EUR140bn, or 0.9% of GDP                                                 13
FIRMS AT RISK IN CORE EUROZONE: 13,000 WITH AN
AVERAGE TURNOVER OF EUR40MN AT RISK
                  Share of SME & MidCaps at risk, % of total           The share of SME & MidCaps at risk, % of total – top 5 sectors
                                                                            Germany                    France                    Italy
                                                                        Construction      15%      Services       20%   Construction        16%
                                                                        Metals            11%      Construction   19%   Agrifood            11%
                                                                        Agrifood          11%      Retail         12%   Services            11%
                                                                        Machinery         10%      Automotive     8%    Retail               9%
                                                                        Services          10%      Agrifood       8%    Machinery            9%

                                                                              Spain                   Belgium             The Netherlands
                                                                        Agrifood          18%      Construction   20%   Services            26%
                                                                        Construction      16%      Services       15%   Construction        12%
                                                                        Services          15%      Agrifood       10%   Agrifood            11%
                                                                        Transport          9%      Retail         9%    Automotive           9%
                                                                        Automotive         6%      Transport      9%    Machinery            9%

                                                                           Sources: Euler Hermes
           Sources: Euler Hermes

         We find that more than 13,000 SMEs & MidCaps (7% of           Firms at risk were mostly concentrated in three sectors:
         total) in the six biggest Eurozone countries are at risk of   Construction,     Agri-food   and     Services.     The
         going bust after persistent low profitability and turnover    concentration in the top 5 sectors is highest in France
         growth. We find that more than EUR500bn of turnover           (67%) and the Netherlands (67%) followed by Belgium
         (or 4% of Eurozone GDP) could be at risk.                     (64%), Spain (63%), Germany (57%) and Italy (56%).
© Copyright Allianz                                                                                                                               14
GLOBAL INSOLVENCIES HEADING TO NEW RECORDS
SINCE 2008-2009
             EH Global and Regional Insolvency Indices                 2020 re-forecasts – selected key countries and region
                       (yearly changes in %)

  Source: national statistics, Euler Hermes, Allianz Research      Source: national statistics, Euler Hermes, Allianz Research

Global insolvencies have the potential to increase by +14%, looking at historical sensibility to economic cycle and government
interventions to support corporates (tax deferrals, state loans and guarantees, etc..) and to avoid top insolvencies and their
domino effect (nationalization) – lowering insolvencies growth by 3 to 5 pp. This 4th consecutive year of rise would result from a
+7% increase in the US, a +15% rise in China and a +16% surge in Europe. Final figures still depend on (i) the timing and
magnitude of other policy measures yet to announced and (ii) the potential closures of business courts (which would create
 © Copyright Allianz                                                                                                           15
lags and delays in official registrations of liquidations and restructuring procedures).
CORPORATES: WHAT COULD WRONG?
                                  USD Corporate spreads evolution                                                             EUR Corporate spreads evolution
                          Technology                                  W-o-W                                        Technology                                    W-o-W
                               Utilites                               Last - 21.01.2020                                 Utilites                                 Last - 21.01.2020
                                                                      Ytd                                 Telecommunications                                     Ytd
                 Telecommunications
                      Travel & Leisure                                                                         Travel & Leisure
                                Media                                                                                    Media
                                Retail                                                                                   Retail
                          Health Care                                                                              Health Care
          Personal & Household Goods                                                          Personal & Household Goods
                     Food & Beverage                                                                          Food & Beverage

                                                                                          Sectors
                   Automobile & Parts                                                                       Automobile & Parts
Sectors

           Industrial Goods & Services                                                              Industrial Goods & Services
              Construction & Materials                                                                 Construction & Materials
                     Basic Resources                                                                          Basic Resources
                           Chemicals                                                                                Chemicals
                            Oil & Gas                                                                                Oil & Gas
                           Real Estate                                                                              Real Estate
                    Financial Services                                                                       Financial Services
                            Insurance                                                                                Insurance
                               Banks                                                                                    Banks

                                          0   50   100   150    200      250        300                                            0   50      100         150          200          250
                                                         bps                                                                                         bps
     USD corporate markets have shown little issuer                                                        Similarly, EUR corporate markets have shown little
     discrimination at the beginning of the coronavirus pandemic                                           sector selectivity during the outbreak of the virus but
     episode. However, recent developments, specially within                                               are diverging as the Covid19 advances. Sectors like
     the oil market, have shown some discrimination. The                                                   Automobile, basic resources and insurance are
     sector most hit by this sector performance divergence have                                            particularly under pressure within the investment grade
     been oil/gas, automobile and travel/leisure.                                                          universe.                      Sources: Refinitiv, AZ Research
 © Copyright Allianz

                                                                                                                                                                                      16
TWO SCENARIOS: U-SHAPED V. PROTRACTED
CRISIS                                                  U Shape Scenario                                        Protracted Crisis

                                   Peak in May. Exit by September. Containment lasts
                                                                                        12-18 months sanitary crisis with possible reinfection.
                                   three months in Europe and US with full confinement
               Covid19 assumptions in Europe for an entire month. Border closure lifted Borders stay closed and intermittent domestic
                                                                                        confinement prevail.
                                   by June.
                                      Technical recession in H1 in most of Europe and       L-Shaped recovery with debt monetization, systemic
                                      Asia. Recovery is U-shaped and inflationary.          equity/credit/ liquidity issues and direct actions by policy
               Scenario in a nutshell Unprecedented policy mix to mitigate shock and help   makers disrupt market roles for years to come. Hard to
                                      protect the web.                                      restart engines

                                                                                                            2020
                                                                       U Shape          Protracted           MIN (maximum             MAX (Inflationary
               Macroeconomics              Latest Value     Unit
                                                                       Scenario           crisis               drawdown)                overshoot)
   Real GDP *
   Global                                       2.5          %             0.8                -1.5                  -15.0
   EMU                                          1.2          %             -1.8               -6.0                  -11.0
   US                                           2.3          %             0.5                -3.0                  -14.0
   China                                        6.1          %             4.0                 1.5                  -12.6
   Other Indicators
   Global trade                                 1.4          %             -3.7              -10.0
   Global business insolvencies                 9.0          %             14.0              25.0
     * Based on a 1 month lockdown. Should the lockdown be prolonged by 1 month, the Eurozone would register a recession of more than -4% for the
     whole year with Germany at -5.0%, France at -3.1%, Italy at -6.0% and Spain at -3.8%
© Copyright Allianz                                                                                                                                        17
TWO SCENARIOS: U-SHAPED V. PROTRACTED
CRISIS
                                                                                                2020
                                                                                                                     MAX
                                                                        U Shape    Protracted    MIN (maximum
                      EMU                         Latest Value   Unit                                           (Inflationary
                                                                        Scenario     crisis       drawdown)
                                                                                                                 overshoot)
Eurozone Rates
10y yield “risk-free” sovereign (Bunds)               -0.2        %       -0.5        -0.9             -1.1         0.1
10y Swap Rate                                          0.2        %        0.0        -0.4             -0.6         0.6
20y Swap Rate                                          0.3        %        0.3        -0.2             -0.3         0.9
10y yield BTP (Italy)                                  1.8        %        1.7         2.7             3.9          1.3
Italy - Germany spread (10y)                          199        bps      220         360              500          120
10y yield OAT (France)                                 0.3        %        0.4         1.0             0.1          0.4
France - Germany spread (10y)                          42        bps       90         190              120          30
10y yield Bono (Spain)                                 0.9        %        0.6         1.2             1.9          0.8
Spain - Germany spread (10y)                          109        bps      110         210              300          70
Eurozone Corporate Credit Spreads
Investment grade credit spreads                       227        bps      180         230              300          100
High yield credit spreads                             839        bps      750         850              1650         550
Eurozone Equities
MSCI EMU: total return p.a.
                                                     -33.5        %       -22         -39              -55           0
(Reference point 31.12.2019 for 2020 forecasts)
Expected Recovery from latest traded value
                                                                  %       17           -8              -32           50
(2021 computed since 31.12.2019)
© Copyright Allianz                                                                                                        18
TWO SCENARIOS: U-SHAPED V. PROTRACTED
 CRISIS                            2020
                                                                                                              MAX
                                                  Latest          U Shape    Protracted   MIN (maximum
                       US & EM                             Unit                                          (Inflationary
                                                  Value           Scenario     crisis      drawdown)
                                                                                                          overshoot)
US Rates
10y yield “risk-free” sovereign (Treasuries)       1.1      %       1.0         0.5           0.0            2.0
10y US - 10y Bund Rate Difference                  130     bps      150         140           110            190
US Corporate Credit Spreads
Investment grade credit spreads                    351     bps      230         280            450           110
High yield credit spreads                          982     bps      800         900           1650           390
US Equities
MSCI USA: total return p.a. in EUR
                                                  -21.6     %       -20         -35           -50             0
(Reference point 31.12.2019 for 2020 forecasts)
Expected Recovery from latest traded value
                                                            %        2          -17           -36             28
(2021 computed since 31.12.2019)

Emerging Markets Rates
Hard Currency Yield (USD)                          7.7      %       5.5         7.0           8.0            4.0
Hard Currency Spread (USD)                         673     bps      450         650           800            200
Emerging Markets Equities
MSCI EM: total return p.a. in EUR
                                                  -27.7     %       -24         -42           -60             0
(Reference point 31.12.2019 for 2020 forecasts)
Expected Recovery from latest traded value
                                                            %        5          -20           -45             38
(2021 computed since 31.12.2019)
 © Copyright Allianz                                                                                                19
GLOBAL EQ: UNLIKELY TO RECOVER IN 2020 - 2021
100 = 31.12.2019                                                     100 = 31.12.2019
                               Eurozone Equities                                                         US Equities
110                                                                  120
                                                                                        MSCI USA
                                                                                        Base Case
100                                                                                     MAX (inflationary overshoot)
                                                                                        Upper Range
                                                                     100                Lower Range
 90                                                                                     MIN (maximum drawdown)

 80
                                                                      80
 70

 60                     MSCI EMU
                        Base Case                                     60
                        MAX (inflationary overshoot)
 50                     Upper Range
                        Lower Range
                        MIN (maximum drawdown)
 40                                                                   40
      2013              2015             2017          2019   2021         2013              2015              2017         2019                2021

  Due to the high equity fundamental overvaluations,                        Geographically, markets are expected to express little
  specially in the US, at the beginning of the Covid19                      differentiation translating into an across the globe -20%
  episode, we currently do not rule out global equity markets               average yearly performance for 2020. If history is of any
  crossing the -40 to -50% loss mark (from 2020 peak) for a                 guidance, equity markets are expected to start a
  shot period of time to then partially recover some losses                 gradual recovery by Q1 2021 but to fall short from
  towards year-end.                                                         recovering to previous peaks within the year.
  © Copyright Allianz                                                                                                  Sources: Refinitiv, AZ Research   20
GLOBAL BONDS LOWER FOR LONGER
  %                   10y US Government Bond Yield                 %               10y German Government Bond Yield
                                                                   2
  4

                                                                   1
  3

  2                                                                0

                      10y UST                                                  10y German Bond Yield
  1                   Base Case                                    -1          Base Case
                      MAX (inflationary overshoot)                             MAX (inflationary overshoot)
                      Upper Range                                              Upper Range
                      Lower Range                                              Lower Range
                      MIN (maximum drawdown)                                   MIN (maximum drawdown)
  0                                                                -2
      2013             2015             2017         2019   2021        2013          2015             2017             2019               2021
  Recently, US long-term sovereign yields have crossed                  Similarly, but not as extreme as in the US case, long-term
  the lower-bound of our fundamental valuation model for a              German government bond yields have been roaming
  short period of time implying a quick reversal to                     around the lower end of our fundamental valuation
  fundamental level (1%). With that in mind, we expect                  model. At this level we do not expect bunds to follow a
  long-term US yields to slowly converge towards fair value             downward trajectory but it is reasonable to believe yields
  (1%) by year-end acknowledging a non-negligible risk of               could visit the -1/-1.1% limit for a short period of time to
  far lower (0-0.25%) intra-year yields.                                slowly reverse to fair value (-0.5%) by year end.
© Copyright Allianz                                                                                           Source: Refinitiv, AZ Research
                                                                                                                                                  21
US IG CORPORATE BONDS: NOT YET AT THE TOP!
                                                                                bps              US High Yield Spreads
bps                      US Investment Grade Spreads
500                                                                             2,000
                       US IG Spread                                                              US HY Spread
                       Base Case                                                1,750            Base Case
                       MIN (maximum drawdown)                                                    MIN (maximum drawdown)
400                    Upper Range
                                                                                1,500            Upper Range
                       Lower Range                                                               Lower Range
                       MAX (inflationary overshoot)                                              MAX (inflationary overshoot)
300                                                                             1,250
                                                                                1,000
200                                                                              750
                                                                                 500
100
                                                                                 250
 0                                                                                    0
      2013                  2015             2017            2019        2021             2013    2015            2017            2019             2021
  US corporate spreads have rapidly widened as a                                 Similar to investment grade, high yield spreads have also
  consequence of the Covid-19 advancement. At this point                         widened at a pace consistent with the pricing-in of a full
  in time, and consistently with the current high levels of                      fledged financial crisis. In addition, certain sectors like oil,
  volatility, it is not unreasonable to believe that US                          gas and air transportation have been in the lead of this
  investment grade corporate spreads could reach previous                        structural widening and may lead to structural effect in
  crisis-like levels of 450bps.                                                  high yield corporate spreads.
  *Model inputs: equity volatility and GDP-implied business confidence                                                    Sources: Refinitiv, AZ Research
 © Copyright Allianz

                                                                                                                                                            22
CORPORATE CREDIT: VOLATILITY MATTERS
                     EUR - 12m corporate IG spread breakdown                   300           US - 12m corporate IG spread breakdown
200

                                                                               200
100
                                                                               100

  0                                                                              0

                                                                               -100
-100                     Contribution Confidence                                              Contribution Confidence
                         Contribution Vstoxx                                   -200           Contribution VIX
                         Forecast                                                             Forecast
                         Real                                                                 Real
-200                                                                           -300
       2014        2015        2016     2017       2018   2019   2020   2021          2014   2015    2016     2017      2018     2019       2020       2021

       When it comes to the current determinants of corporate                         Needless to say that at the time equity volatility starts its
       spreads movements, the component directly linked with                          retracting trend, it is to be expected for the confidence
       equity volatility remains the sole determinant of the past                     component (linked to GDP) to start exerting a structural
       spread behavior both within the investment grade and                           widening pressure on spreads preventing those from
       high yield spectrum. Because of that, it is a necessary                        reversing to previous lows. This will hold true specially in
       condition for equity volatility to start declining in order to                 the high yield spread as some issuers may become
       see lower spreads.                                                             unwanted casualties of this uncertain period.
   © Copyright Allianz                                                                                                     Sources: Refinitiv, AZ Research
                                                                                                                                                             23
NO DISTINCTION IN BAD TIMES
                         Equity Covariance                                                                                  Covariance mapping
                                                                                                                   1.6%                               MSCI EM
8%                                                                                                                                                    MSCI EMU
                                                1.0       0.9     0.8        0.7                                                                      EM bonds HC
7%                                              0.6       0.5     0.4        0.3                                   1.2%                               EM bonds LC

                                                                                          Conditional covariance
                                                0.2       0.1                                                                                         BofA High yield
6%                                                                                                                                                    Oil
5%                                                                                                                 0.8%                               Barclays aggregate
                                                                                                                                                      UST 10Y
4%                                                                                                                                                    Gold
                                                                                                                   0.4%
3%
2%                                                                                                                 0.0%
                                                                          0.1
1%                                                                      0.4                                  -0.4%
0%                                                                    0.7
          0.1 0.2 0.3                                                       MSCI EMU                         -0.8%
                      0.4 0.5 0.6                               1.0
                                  0.7   0.8                                                                       -0.4    -0.2           0                0.2              0.4
                          MSCI USA            0.9   1.0                                                                   S&P 500 average annual log return

One month out of 10, the S&P500 posts a monthly return                                 When the S&P 500 posts so low monthly returns, the probability
lower than -4.7%. The cumulative correction we forecast                                is high that other markets follow it down:
for the S&P500 in the pause scenario (-30%) implies                                    72% of the time, EMU equities returns less than -6.2%,
monthly returns in the 10% worst cases (the first decile).                             55% of the time, US B corporate bonds return less than -1.8%.
In these 10% worst cases, the S&P500 average monthly                                   98% of the time, 10y USTs post a positive total return, ~0.86%.
return is indeed -8.2%.

 © Copyright Allianz                                                                                                                     Source: Refinitiv, AZ Research      24
US GDP GROWTH: A U-SHAPE RECOVERY
 US: A U-SHAPE RECOVERY
                            Contribution to US GDP growth (pp)                                                                   US labor market
          5,00
                                                                Consumption
                                                                Non residential investment
                                                                Residential Investment                           Unemployment rate (%)                   Employment (y/y, %)
                                                                Inventories
          4,00                                                  Government spending
                                                                Net exports                  10                                                                              Forecast   10
                                                                GDP

          3,00
                                                                                             8                                                                                          8

          2,00                                                                               5                                                                                          5

          1,00                                                                               3                                                                                          3

          0,00                                                                               0                                                                                          0
                       16         17      18       19           20               21

         -1,00
                                                                                             -3                                                                                         -3

                                                                                             -5                                                                                         -5
         -2,00
                                                                                                  05   06   07   08   09   10   11   12   13   14   15   16   17   18   19    20   21

          Sources: IHS Markit, Euler Hermes, Allianz Research                                     Sources: IHS Markit, Euler Hermes, Allianz Research

       We expect the US economy to significantly contract                                    The cumulated amount of job losses between
       in Q2 2020 close to -3.8% q/q. US GDP growth                                          February and August could reach 4 millions people. All
       should reach 0.5% y/y in 2020 and 2.7% y/y in 2021                                    in all, we expect the US unemployment rate to reach a
                                                                                             peak of 6.5% in January 2021
 © Copyright Allianz
                                                                                                                                                                                             25
US POLICY: A POWERFUL ARSENAL OF STABILIZATION
                        New tools of the US monetary policy                       New (proposed) tools of the US fiscal policy
                                                                                             (size of multiplier)

                                                                                      Sending checks to households (High)
                                Government
                                                                                      Guaranteeing paid sick leaves (High)
                                                                                      Giving credit guarantees to companies
                                                                                       (Low)
                                                                                      Allowing income tax holidays for 2020
                                       USD 700 bn
                                                                                       (Average)
                                       of Treasuries
                                                                                      Developing infrastructure spending (High)
                                       Purchases
                                                                                      Increasing healthcare spending (High)
                                                                                      Authorizing loan forbearance (Average)
                                                                                      Providing food aid (High)
 USD 1.5 trillion of                              Commercial Paper Funding
 liquidity injections,                            Facility (CPFF), potential to      The White House is likely to vote a
                                   Fed            activate GBCF: Government-
 easing of prudential                                                                 package worth USD 1 trillion (4.5% of
 conditions                                       Backed Credit Facility              GDP). We expect its overall multiplier size
                                                                                      to reach 0.9, leading to a positive impact
                                                                                      on GDP growth of 1.2 pp between Q2 2020
    Banks                                                                             and Q2 2021
                                                           Private
     and
                                                          economic
  financial
                                                           actors
  markets
                                                                                                                                    26
  © Copyright Allianz
CHINA GDP GROWTH IN 2020 REVISED DOWN TO 4%

                                        GDP growth                                       GDP growth (%) & breakdown of contributions (pp)
      12                                                                                                                            Private Consumption
                                                                     Forecasts     11
                                                                                                                                    Government Consumption
                                                                                                                                    Gross Capital Formation
                                                                                    9                                               Net exports
        9                                                                                                                           GDP %y/y

                                                                                    7
                                                                                                                                                                5.8

        6                                                                           5
                                                                                                                                                          4.0

                                                                                    3

        3
                  China GDP growth %y/y - March 2020 forecasts
                                                                                    1

                  China GDP growth %y/y - December 2019 forecasts
        0                                                                           -1
            14        15       16        17        18        19     20       21           2011   2012   2013   2014   2015   2016    2017   2018 2019E 2020E 2021E

    Source: National statistics, Allianz Research                                 Source: National statistics, Allianz Research

    Activity data at the beginning of the year declined to                        After the slump of Q1, we expect a gradual recovery
    record lows. This does not bode well for overall                              thereafter, particularly visible in H2. This should be
    economic growth in Q1, and we have pencilled in a                             possible thanks to some catch-up from pent-up
    forecast of 1.3% y/y (down from 6.0% in Q4 2019).                             production and policy support. We expect 2020 GDP
                                                                                  growth at 4.0%.
© Copyright Allianz                                                                                                                                                   27
CHINA POLICY MIX: FURTHER EASING TO COME
Size of fiscal stimulus package (% of GDP)                       Interest rates (%)                           Housing affordability (cost as % of income)
                                                                                Policy rate
                                             10                                                               300%
   5                                                                            Average lending rate                                                2018   2017
                                   4.4        9                                 Average mortgage rate
 4.5                                                                            Average interbank rate
                                              8
                                                                                                              250%                                         Less
   4                                                                                                                                                       affordable
                                              7
 3.5                       3.3                                                                                200%
                                              6
   3
                 2.4
                                              5                                                               150%
 2.5
                                              4
   2                                                                                                          100%
                                              3
 1.5
                                              2                                                                50%
   1
                                              1
 0.5
                                              0                                                                  0%
   0                                              09   10   11   12   13   14   15   16   17   18   19   20             Shanghai     Beijing   Shenzhen Guangzhou
                2018       2019   2020E
Source: Allianz Research                     Source: Datastream, Allianz Research                             Source: Bloomberg, Allianz Research

Fiscal easing is likely to increase in       On the monetary side, the PBOC                                   Authorities still seem reluctant to use
2020. We now expect fiscal support           should continue easing. Over 2020, we                            the housing sector as a cyclical
amounting to 4.4% of GDP, up from            expect cuts in the policy rate worth                             stabiliser, as they may be more
2.7% forecast before the COVID-19            30bp in total, and the Reserve                                   concerned with housing affordability.
outbreak.                                    Requirement Ratios to be lowered by                              Credit conditions may be loosened only
© Copyright Allianz
                                             150bp overall.                                                   marginally.                           28
EU POLICY RESPONSES WILL HELP TO ALLEVIATE
  THE SHOCK BUT HURT PUBLIC FINANCES
    Fiscal stimulus by country and impact on                                   Fiscal balance, % of GDP                               Public debt, % of GDP
       real GDP growth and fiscal balance

                     Fiscal             Impact on     Impact on
                              Share of
                  stimulus             GDP growth fiscal balance
                                 GDP
                  (EURbn)                  (in pp)        (in pp)
Germany                150      5.0%           1.5           -3.9
France                  45      2.0%           0.8           -1.3
Italy                   25      1.4%           0.7           -0.9
Spain                   18      1.4%           0.5           -1.1
UK                      30      1.4%           0.6           -0.9

                                                                    Note: forecasts do not include State guarantees and   Note: forecasts do not include State guarantees and
                                                                    potential nationalisations of firms.                  potential nationalisations of firms.
  Sources: Euler Hermes                                             Sources: Euler Hermes                                 Sources: Euler Hermes

  Bazooka economic policy responses                                 Fiscal responses in every impacted                    The increase in fiscal deficits in 2020
  will not avoid a global recession in H1                           country amount to as high as 10% of                   would push public debts above 100%
  2020, but should help companies and                               GDP by supporting companies’ working                  of GDP in France and Spain and to
  consumers withstand the severe albeit                             capital requirements (credit lines for                147% of GDP in Italy
  temporary shock.                                                  SMEs, tax reliefs) and scaling up social
                                                                    safety nets (temporary unemployment
  © Copyright Allianz                                                                                                                                                    29
                                                                    and other transfers).
GERMANY: NO PLACE TO HIDE FOR THE ECONOMY
AS FIRST AND SECONDARY ROUND EFFECTS BITE
            Germany: IFO survey & real GDP (y/y, %)                 Germany: Impact of Covid-19 on quarterly GDP

                                                                3

                                                                2

                                                                1

                                                                0

                                                               -1

                                                               -2

                                                               -3

                                                               -4
                                                                           Q1                 Q2    Q3                  Q4

                                                                        Local confinement impact    Exports to Asia
                                                                        Exports to ROW              Supply chain disruption
                                                                        GDP (q/q, in %)

  Sources: Allianz Research                                  Sources: Refinitiv, Allianz Research

Available high frequency data suggests that the German       The German economy will be under pressure on all
economy moved from a timid recovery in Jan/Feb to a full-    fronts in H1 2020 as confinement measures hurt global
blown recession a la 2008/9 within a month’s time. The ifo   trade, disrupt supply chains and put a pause on
survey currently suggests that German GDP contracted by      domestic investment and consumption activity. The
4%    y/yAllianz
© Copyright in March and that further pain is ahead.         rebound in H2 will only partially compensate.                    30
FRANCE: RECORD HIGH SHOCK ON PRIVATE
CONSUMPTION AND INVESTMENT IN Q2
                   Real GDP growth by component                             Manufacturing PMI components

   Sources: Allianz Research                               Sources: AGI, Allianz Research

The shock on domestic demand will be much worse            Transposing the Chinese shock on France bring the
than during the 2008-09 crisis, but fiscal spending will   total level of activity in the manufacturing sector at
alleviate the overall impact. Should the confinement be    levels similar to 2009. The inventory to new orders ratio
prolonged by 1 more month, GDP would fell by -3.1%         is expected to go significantly above 1, which is a sign
in© Copyright
    2020Allianz
              (vs. -1.3% in the baseline)                  of future downside pressures on firms’ turnovers            31
ITALY: DEEP RECESSION EXPECTED
                                   GDP by component, %                                                         Manufacturing PMI vs GDP growth
                                                                                                70                                                                    1.5
       6.0
                                                                               Forecast                                                                               1.0
                                                                                                60
                                                                                                                                                                      0.5
       4.0
                                                                                                50                                                                    0.0
       2.0
                                                                                                                                                                      -0.5
                                                                                                40
       0.0
                                                                                                                                                                      -1.0
                                                                                                30
                                                                                                                                                                      -1.5
       -2.0
                                                                                                20                                                                    -2.0

       -4.0
                                                                                                                                                                      -2.5
                                                                                                10
                                                                                                                                                                      -3.0
       -6.0
                 12        13     14   15    16     17        18     19        20f     21f       0                                                                    -3.5
                                                                                                  2007       2009      2011      2013       2015    2017     2019
              Households        GFCF   Government    Stocks        Net Trade         real GDP
                                                                                                                GDP (q/q) (RHS)             Manufacturing PMI (LHS)
    Sources: Refinitiv, Allianz Research                                                             Sources: Refinitiv, Allianz Research

    In 2020: major consumption shock in Q1 and Q2, while                                        With a similar fall in manufacturing sentiment in
    investment will suffer from uncertainty and funding                                         March than in China, quarterly growth is expected
    constraints due banking vulnerability. Trade balance will                                   to contract sharply in H2 2020.
    deteriorate strongly due to slump in tourism receipts.
    In 2021: rebound thanks to fiscal stimulus.
© Copyright Allianz                                                                                                                                                          32
UK: A FULL YEAR RECESSION IN 2020, FOR THE
FIRST TIME SINCE 2009
                      Real GDP growth by component           Fiscal stimulus package and impact on real GDP growth
                                                                                and fiscal balance

       Sources: ONS, Allianz Research                                 Sources: Allianz Research

    The full shock will be visible in Q2. We expect a fall   The BoE cut the key rate by 65bp to 0.10%, introduced a
    in private consumption of -1.5% qoq, -5% in business     new Term Funding scheme for SMEs of an estimated
    investment and -6% in exports. Overall GDP would         GBP100bn to support lending and increased QE
    fall by -2.2% qoq. The recovery in 2021 will be          purchases by GBP200bn. This latter would be equivalent
    capped by Brexit related uncertainty, notably in H1      to a decrease in rates of 150bp. More QE could come as
    2021.                                                    well as negative interest rates should the country be put
© Copyright Allianz
                                                             on full lockdown. Fiscal stimulus of EUR30bn has been       33
                                                             announced which will support growth by +0.2pp this year
EMERGING MARKETS: SUDDEN STOPS,
  CURRENCIES, AND CORPORATES
      Emerging Markets: Gross external financing requirement                                                                                                                                         Foreign exchange-denominated sovereign and NFC debt
                       (% of FX reserves)                                                                                                                                                                      (% of GDP), Q3 2019, selected EM
300%
                                                                                                                                                             Major oil producers                     90                                                                                             FX-denominated NFC debt
         250%
                248%

                                                                                                                                                             Other EM
                                                                                                                                                                                                     80
                                                                                                                                                                                                                                                                                                    FX-denominated public debt
                       216%
                              210%

                                                                                                                                                                                                     70
200%                                                                                                                                                                                                 60
                                     167%

                                                                                                                                                                                                     50
                                            150%
                                                   140%
                                                          138%

                                                                                                                                                                                                     40
                                                                 118%
                                                                        106%

                                                                                                                                                                                                     30
                                                                               99%
                                                                                     93%
                                                                                           89%
                                                                                                 79%

                                                                                                                                                                                                     20
                                                                                                       77%

100%
                                                                                                             75%
                                                                                                                   73%
                                                                                                                         62%

                                                                                                                                                                                                     10
                                                                                                                               40%
                                                                                                                                     37%
                                                                                                                                           36%
                                                                                                                                                 32%
                                                                                                                                                       32%
                                                                                                                                                              25%
                                                                                                                                                                    24%
                                                                                                                                                                                                      0

                                                                                                                                                                          19%
                                                                                                                                                                                13%

                                                                                                                                                                                                                                                                                                                   Saudi Arabia

                                                                                                                                                                                                                                                                                                                                                            Russia
                                                                                                                                                                                                                                                                                                                                                Indonesia

                                                                                                                                                                                                                                                                                                                                                                                         India
                                                                                                                                                                                                                        Turkey

                                                                                                                                                                                                                                           Ukraine

                                                                                                                                                                                                                                                             Poland

                                                                                                                                                                                                                                                                                Mexico

                                                                                                                                                                                                                                                                                                                                                                     Brazil
                                                                                                                                                                                                                                 Hungary

                                                                                                                                                                                                                                                                      Czechia

                                                                                                                                                                                                                                                                                                    South Africa
                                                                                                                                                                                                                                                     Chile

                                                                                                                                                                                                                                                                                                                                                                                                 Thailand
                                                                                                                                                                                                                                                                                                                                                                                                            China
                                                                                                                                                                                                                                                                                         Colombia
                                                                                                                                                                                                            Argentina

                                                                                                                                                                                                                                                                                                                                                                              Malaysia
                                                                                                                                                                                                                                                                                                                                  South Korea
                                                                                                                                                                                      7%
                                                                                                                                                                                           7%
                                                                                                                                                                                                5%
   0%

    Sources: IHS Markit, Allianz Research                                                                                                                                                            Sources: National statistics, IIF, Allianz Research

    Risk appetite likely to deteriorate in markets with high                                                                                                                                         Argentina has the highest share of FX-denominated
    gross external financing requirements.                                                                                                                                                           debt to GDP (80%). And most of that is sovereign
                                                                                                                                                                                                     debt.

© Copyright Allianz                                                                                                                                                                                                                                                                                                                                                                                                 34
EMERGING EUROPE: GROWTH FORECAST
REVISIONS AND POLICY LEEWAY
              2020 GDP growth forecasts                                     Monetary policy leeway                                         Fiscal policy leeway (2019 ratios)

                                 2020                                   Inflation Inflation Inflation         Policy Monetary                          Fiscal  Public                   Fiscal
Real GDP growth       2019                    2020   2021
                             Dec. forecasts
Emerging Europe       2.2         2.1          1.2    2.8
                                                                          target Q4 2019 latest                rate    policy                         balance   debt                    policy
Poland                4.1         3.1          1.0    3.6
                                                                                             month                    leeway                         % of GDP % of GDP                 leeway
Czechia               2.4         2.2         -0.5    2.7    Poland       2.5%     2.8%      4.7%             1.00%
Romania               4.1         2.8          0.8    3.2    Czechia      2.0%     3.0%      3.7%             1.75%
                                                                                                                                     Poland            -1.9%   47.5%
Hungary               4.9         3.0          1.0    3.1
                                                             Romania      2.5%     3.7%      3.0%             2.50%                  Czechia            0.3%   32.0%
Slovakia              2.3         2.3         -0.6    2.6
Croatia               2.9         2.4         -0.8    3.0    Hungary      3.0%     3.4%      4.4%             0.90%                  Romania           -3.8%   36.0%
Bulgaria              3.7         2.7          0.5    3.1    Slovakia*    2.0%     2.9%      2.9%             0.00%                  Hungary
Slovenia              2.4         2.5         -0.5    2.5
                                                                                                                                                       -1.9%   69.0%
                                                             Croatia         -     0.9%      1.5%             2.50%
Lithuania             3.9         2.5          0.5    3.0
                                                             Bulgaria** 2.0%
                                                                                                                                     Slovakia          -1.2%   48.0%
Latvia                2.2         2.4          0.2    2.7
                                                                                   3.1%      3.7%             0.00%
Estonia               4.3         2.7          0.6    3.0    Russia       4.0%     3.5%      2.3%             6.00%                  Croatia            0.1%   71.5%
Turkey                0.9         2.3          2.5    4.0    Turkey       5.0%     10.3%     12.4%            9.75%                  Bulgaria           1.0%   21.0%
Serbia                4.1         2.6          1.3    3.2
                                                             * Slovakia is a Eurozone member, thus monetary policy is set by         Russia
Russia                1.3         1.3          1.2    1.8                                                                                               1.8%   15.0%
Ukraine               3.2         3.0          1.0    2.8
                                                                the ECB.
Azerbaijan            2.2         2.3         -0.2    2.7    ** Bulgaria has currency board with a peg to the EUR, thus it follows
                                                                                                                                     Turkey            -5.0%   32.3%
Kazakhstan            4.5         3.5          1.3    3.8       the monetary policy of the ECB.                                      Orange            if 50%
Sources: National statistics, IHS Markit, Allianz Research   Sources: National statistics, IHS Markit, Allianz Research              Sources: Eurostat, IHS Markit, Allianz Research

Sharp downward revision of growth,                           Monetary policy leeway is limited, in                                   Fortunately all countries have policy
especially in EU member states which                         theory. Yet, and despite elevated                                       leeway and will use it.
are very export-dependent on the                             inflation, the central banks of Czechia,                                But fiscal deficits and public debt ratios
Eurozone.                                                    Poland and Turkey cut rates at                                          will rise.
© Copyright Allianz                                          Emergency meetings in mid-March.                                                                                                    35
EMERGING EUROPE: SOUNDING THE LIQUIDITY
ALARM
                          Bid-Ask spreads widening strongly                                                                                 Risk of liquidity bifurcation
                                                 (10y tenor)                                                                                                (daily spread volatility)

       3.0                              until 9 March     since 10 March
                                                                                               30
                                                                                                                                                      Slovakia                              Slovenia                                Latvia

                                                                                                                                                      Lithuania                             Cyprus                                  Greece
                                                                                               25

       2.0                                                                                     20

                                                                                               15

       1.0                                                                                     10

                                                                                                5

                                                                                                0

                                                                                                    10/2…
                                                                                                            10/2…
                                                                                                                    11/2…
                                                                                                                            11/2…
                                                                                                                                    11/2…
                                                                                                                                            11/2…
                                                                                                                                                    12/2…
                                                                                                                                                            12/2…
                                                                                                                                                                    12/2…
                                                                                                                                                                            12/2…
                                                                                                                                                                                    12/2…
                                                                                                                                                                                            01/2…
                                                                                                                                                                                                    01/2…
                                                                                                                                                                                                            01/2…
                                                                                                                                                                                                                    01/2…
                                                                                                                                                                                                                            02/2…
                                                                                                                                                                                                                                    02/2…
                                                                                                                                                                                                                                            02/2…
                                                                                                                                                                                                                                                    02/2…
                                                                                                                                                                                                                                                            03/2…
                                                                                                                                                                                                                                                                    03/2…
                                                                                                                                                                                                                                                                            03/2…
       0.0
                 Latvia     Lithuania         Slovakia    Slovenia         Cyprus   Greece

    Sources: Bloomberg Allianz Research                                                      Sources: Refinitiv, Allianz Research

    Sharp increases in liquidity costs in peripheral                                         Risk of liquidity bifurcation: liquid bonds becoming
    markets indicate reduced supply by market makers.                                        more liquid and illiquid ones more illiquid. Risk of an
    Also visible in volumes and immediacy of                                                 accident (impaired market access) cannot be
    transactions.                                                                            excluded in such a volatile environment.
© Copyright Allianz                                                                                                                                                                                                                                                                 36
ASIA-PACIFIC: POLICIES AIMING TO CUSHION THE
ECONOMIC BLOW OF COVID-19
                      Real GDP growth (%)                                   Monetary policy leeway                                                     Fiscal policy leeway
                                 2020                                                                    Inflation        Monetary                           Fiscal      Public
                      2019                   2020   2021                      Inflation    Inflation               Policy                                                             Fiscal
                             Dec forecasts                                                                latest            policy         2019             balance       debt
                                                                               Target      2019 Q4                  rate                                                             leeway
  Asia-Pacific         4.3        4.2        2.9    4.3                                                   month            leeway                          % of GDP     % of GDP
   Australia           1.7        1.4        1.0    1.9    Australia      2%-3%              1.8%          1.8%    0.25%                   Australia         -0.7%       42%
     China             6.1        5.9        4.0    5.8    China           3.0%              4.2%          5.2%    4.05%                   China             -6.1%       55%
  Hong Kong           -1.2        3.0        -2.4   0.6    India           4.0%              5.8%          6.6%    5.15%                   Hong Kong         0.6%         0%
                                                                                                                                           India             -7.5%       69%
     India             5.5        5.8        5.5    5.8    Indonesia    3.5% +/-1%           2.7%          3.0%    4.50%
                                                                                                                                           Indonesia         -1.9%       30%
   Indonesia           5.0        4.8        4.3    4.7    Japan           2.0%              0.5%          0.5% -0.10%
                                                                                                                                           Japan             -3.0%       246%
     Japan             0.9        0.7        -0.5   1.0    Malaysia*         -               1.0%          1.6%    2.25%
                                                                                                                                           Malaysia          -3.0%       56%
   Malaysia            4.4        3.5        1.9    4.1    New Zealand    1%-3%              1.9%          1.9%    0.25%                   New Zealand       0.1%        29%
 New Zealand           2.2        2.1        1.4    2.7    Philippines   3% +/-1%            1.5%          2.6%    3.25%                   Philippines       -1.1%       39%
  Philippines          5.7        6.0        5.1    5.4    South Korea     2.0%              0.0%          1.1%    0.75%                   Singapore         4.3%        114%
   Singapore           0.7        1.1        0.4    1.9    Taiwan*           -               0.4%         -0.2% 1.13%                      South Korea       0.7%        41%
  South Korea          1.7        1.9        1.5    2.0    Thailand    2.5% +/-1.5%          0.6%          0.7%    1.00%                   Taiwan            -1.3%       33%
    Taiwan             2.2        1.4        1.0    1.5    Vietnam*          -               2.2%          5.4%    5.00%                   Thailand          -0.2%       42%
   Thailand            2.6        2.2        0.2    3.4    * no explicit inflation targeting framework                                     Vietnam           -4.4%       54%
    Vietnam            7.0        6.5        6.1    6.2    Light red when policy rate < latest inflation, green otherwise                  Light red         if < -3%    if > 50%

Source: National Statistics, Allianz Research              Source: National Statistics, Allianz Research                             Source: National Statistics, Allianz Research

We expect Asia-Pacific GDP growth at                       Most central banks in Asia-Pacific have                                   Given the leeway, almost all economies
2.9% in 2020, after 4.3% in 2019. After                    been aggressively cutting policy rates,                                   have announced fiscal stimulus, in
negative sequential growth in H1, a                        with some now pursuing unconventional                                     particular in Hong Kong, New Zealand,
partial recovery should follow.                            easing measures. Inflationary and FX                                      Thailand, South Korea, Malaysia,
© Copyright Allianz                                        pressures need to be watched.                                             Singapore and China.                 37
LATIN AMERICA: RECESSION, LOWER POLICY RATES
AND HIGHER PUBLIC DEBT BURDENS
   GDP growth forecasts (%, y/y, excluding                           Central bank policy rates (%)                     Public debt to GDP ratios (% GDP)
                Venezuela)                                                   Brazil
                                                                                                                   100%
                                                                             Chile
                                                                                                                    90%                                    2013                2019e
                      2017   2018   2019   2020   2021      14%              Colombia
                                                                             Mexico                                 80%
                                                                                                                                                           2020f
     Argentina        2.7    -2.5   -3.0   -4.0       2.4   12%              Peru                                   70%
        Brazil        1.1    1.3    1.1    -0.7       1.6                                                           60%
                                                            10%
                                                                                                                    50%
        Chile         1.3    4.0    1.0    -0.9       2.3
                                                              8%                                                    40%
     Colombia         1.4    2.6    3.3     0.5       2.3                                                           30%
                                                              6%
       Mexico         2.1    2.1    -0.1   -2,0       1.0                                                           20%
                                                              4%                                                    10%
         Peru         2.5    4.0    2.2     0.5       2.8                                                            0%
                                                              2%

                                                                                                                                                   Chile

                                                                                                                                                                        Peru

                                                                                                                                                                                          Ecuador
                                                                                                                              Argentina

                                                                                                                                                             Colombia
                                                                                                                                          Brazil

                                                                                                                                                                                 Mexico
   Latin America      1.7    1.5    0.7    -0.9       1.6
                                                              0%
                                                                   11 12 13 14 15 16 17 18 19 20
Sources: IHS Markit, Euler Hermes, Allianz Research         Sources: IHS Markit, Euler Hermes, Allianz Research   Sources: IHS Markit, Euler Hermes, Allianz Research

We see Latam entering recession this                        Central banks in Brazil (-50bps), Chile               Lower fiscal revenues due to lower oil
year (-0.9%) due to the external shock                      (-0.75bps) already cut rates to support               prices and lower growth, depressed
(Chinese contraction in Q1, U.S. in Q2)                     activity. Expect the rest to join, despite            activity, and large fiscal stimulus will
and internal shock (confinement in Q2).                     downside pressures on currencies.                     contribute to increase the public debt
© Copyright Allianz                                                                                               burden.                              38
MIDDLE EAST: GROWTH FORECAST REVISIONS
                         2020 GDP growth forecasts                                            Real Effective Exchange Rate
                                                                          160        Bahrain                   Kuwait                Oman
                                            2020
     Real GDP growth         2019                          2020    2021              Qatar                     Saudi Arabia          United Arab Emirates
                                        Dec. forecasts
                                                                          150        United States             Lebanon
     Middle East              0.1            1.4            -0.2   2.0
     Saudi A.                  0.2           1.2             1.2   2.0    140
     UAE                       2.2           2.0            -0.1   1.5
     Qatar                     0.7           2.0             0.6   2.5    130
     Kuwait                    0.9           1.0             0.3   1.5
     Oman                      1.3           1.7             0.5   2.2    120

     Bahrain                   1.2           1.8             0.6   2.0
                                                                          110
     Iran                     -7.0           -1.0           -5.0   1.0
     Israel                    3.3           3.3             2.0   3.3
                                                                          100
     Iraq                      3.3           3.0             0.5   3.0
     Lebanon                  -0.2           0.5            -3.0   1.0     90
     Jordan                    2.1           2.0             1.0   2.4       2012     2013       2014   2015        2016      2017   2018     2019

    Sources: National statistics, IHS Markit, Allianz Research            Sources: Bruegel, IHS Markit, Allianz Research

    The Middle East region as a whole will experience a                   GCC states will follow the monetary policy stance of
    contraction in 2020.                                                  the US and have sufficient assets to maintain their
                                                                          currency pegs. Oman and Bahrain are weaker but
                                                                          will get support from their larger neighbors, if
                                                                          needed.
© Copyright Allianz                                                                                                                                         39
AFRICA: STRONG DECELERATION AND LIMITED
LEEWAY TO COPE WITH CURRENCY DEPRECIATIONS
                      Sharp GDP growth slowdown in 2020                                                                Foreign exchange reserves and public debt
                                                                                                16
                                                                                                                                                                                              High external absorption
                                                                                                           High budget and
                                                                                                                                                                                             capacity but weak budget
                                                                                                14         external absorption                       Algeria

                                                          Total reserves in months of imports
                                                                                                                                                                                                   absorption capacity
                                                                                                           capacity
                                                                                                12

                                                                                                10
                                                                                                                                                            Colombia
                                                                                                8                                                     Azerbaidjan
                                                                                                                                                            Irak
                                                                                                6                                                                                            Egypt

                                                                                                                                    Nigeria
                                                                                                                                                                        Bolivia                                  Angola
                                                                                                4                                              Cameroon                              Congo
                                                                                                          Weak external                              Chad      Gabon
                                                                                                          absorption capacity but             Mynmar
                                                                                                                                                                                             Weak budget and external
                                                                                                2         high budget absorption                                             Ghana
                                                                                                                                                                                                  absorption capacity
                                                                                                          capacity                                      Ecuador

                                                                                                0
                                                                                                     0                20                  40                       60                   80           100              120
                                                                                                                                              Public debt (% of GDP)
Sources: IHS Markit, IMF, Allianz Research
                                                                                                         Sources: IMF, Allianz Research
Growth will disappoint in many countries in Africa: all                                                  Some countries are more exposed than others to
will experience a deceleration and major oil producers                                                   possible liquidity shocks. Angola, Gabon, Congo and
will see a contraction. Countries in recession: South                                                    Ghana are expected to be at the center of the storm.
Africa, Congo, Algeria, Angola and Nigeria
© Copyright Allianz                                                                                                                                                                                                       40
WHAT COULD GO WRONG? CANARIES IN THE COAL
   MINE
                TOP3:       Rerating risk                                       Liquidity Crisis                                                     Policy mistakes
  Energy: USD 278 bn
Basic Ind.: USD 124 bn                                      600                                                                   300
 Banking: USD 108 bn
                                                                                                                                                                   ECB: PEPP „Bring it on!“
                                                                                                                                  280
                    USD 1.3 tn                       A1     500

                                                     A2                                                                           260
                                                            400                                                                            ECB: „…not here to close spreads)
                                                     A3
                                                     AA1                                                                          240                                                         -84bp

                                                     AA2    300
                                                                                                                                  220                              +53bp
                                                     AA3
                                                     AAA    200
                                                                                                                                  200
                                                     BBB1
                                                     BBB2   100                                                                   180
                                                                                                                                                              - Italy 10y vs DE (in bp)
                                                     BBB3
                                                                       Spread Emerging Sovereigns in USD (vs swap curve, in bp)
                                                              0                                                                   160
                                                                                                                                     3/5/2020          3/10/2020             3/15/2020

    Source: ICE BofA Global Corp. Index, Allianz Research   Source: ICE BofA, Allianz Research                                    Source: Refinitiv, Allianz Research

    Major credit event triggering a vast                    Signs that the liquidity supply in                                    Restarting engines from a large share
    movement of re-rating in particular for                 financial markets is impaired; the risk of                            of GDP administered will require
    BBB- (BBB3) companies (11% of                           liquidity bifurcation with more liquid                                precise, collaborative, and transparent
    Global Corp. Bond Index, corresponds                    segments becoming more liquid and                                     moves to allow for price discovery on
    toCopyright
    ©   a volumeAllianz of USD1.3tn.                        more illiquid segment more illiquid.                                  markets, and supply chains.
MID-TERM: CRISIS LEGACY

            Strong state, redux                       A blow to globalization                 Goodbye risk-taking
            The role of the state vis-à-vis markets   The close interlinkages between         Trust in financial market stability &
            has been strengthened:                    states has been put into question       functioning has been challenged
            • Expect more assertive and               • Expect states to reduce their         • Expect investors to shift to more
              interventionist governments                foreign reliance on “strategic”         defensive strategies
            • Expect more basic needs and                goods (from drugs to batteries)      • Expect households to increase
              goods – from (green) infrastructure     • Expect companies to shorten their        savings in low-yield safer financial
              to health – provided by the state          supply chains                           products.

            Chinese soft power                        Rising risk awareness                   Increase in productivity
            Authoritarian vs democratic state:        The fragility of modern life has been   The way we work has been changed
            Who can better fight a pandemic?          demonstrated                            • Expect more flexible team
            • Expect the Chinese government to        • Expect more demand for risk cover       structures and remote working,
              use its draconic but successful         • Expect rising pressure on insurers      pushing up productivity by around
              measures to stop Covid-19 as a            to offer comprehensive and simple       5% (according to several studies)
              blueprint to increase its global          solutions (no exclusions…)            • Expect less business trips
              influence

File name | department | author
© Copyright Allianz 20-Mar-20                                                                                                           42
THANK YOU

Economic, Capital Markets
and Industry Research

Global Economic Outlook
as of March 2020

© Copyright Allianz
You can also read