Draft Financial Strategy 2018-2028 Long Term Plan
←
→
Page content transcription
If your browser does not render page correctly, please read the page content below
Draft Financial Strategy 2018-2028 Long Term Plan
CONTENTS

1 Introduction ............................................................................................................................................ 2

2 Overview ................................................................................................................................................. 3

3 Context .................................................................................................................................................. 6

4 Population and land use ......................................................................................................................... 8

5 Capital Programme .............................................................................................................................. 10

6 Other factors impacting the financial position ...................................................................................... 15

7 Financial Strategy, focus and principles ................................................................................................ 21

8 Rates projections and limits .................................................................................................................. 23

9 Debt projections and limits .................................................................................................................. 27

10 Council Investments ............................................................................................................................ 36

Appendix 1 - Major Community Facilities /Anchor Projects ..................................................................... 38

Appendix 2 Council Investments (CCOs & CCTOs) .................................................................................... 39

                                                                                                                                                                 1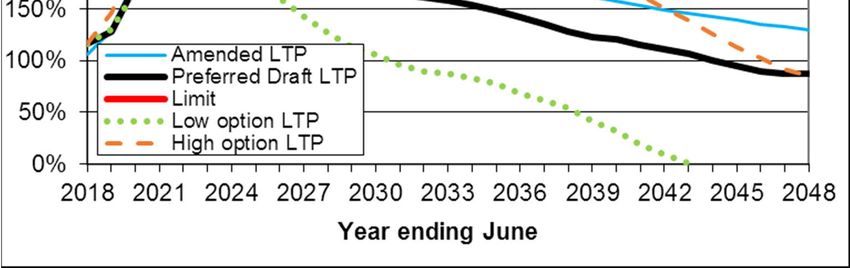
1 Introduction
Under the Local Government Act 2002 a local authority must, as part of its long term plan, prepare and adopt a financial strategy for the financial years
covered by the long-term plan.

The strategy explains the Council’s current and forecast financial position and identifies the effects on expenditure, non-rates revenue and debt of the three
financial options considered by Council officers in developing the draft Long Term Plan. The strategy explains the expected effect of each option on the
Council’s levels of service delivery, rates and debt levels and ratios, and clearly explains why the preferred option is proposed.

The Council’s Service Plans and 30 Year Infrastructure Strategy underpin this Strategy and should be read in conjunction with it. The future work programmes
detailed in those documents are based on achieving the Council’s agreed Levels of Service and on achieving standards imposed on local government by central
government (such as drinking water standards). Other supporting documents include the Council’s Revenue and Financing Policy, which details how the
operating and capital costs of each Council activity will be funded; and the Council’s Significant Forecasting Assumptions.

                                                                                                                                                            2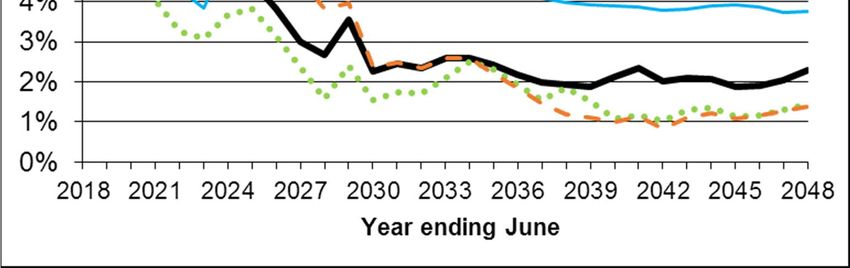
2 Overview
This Financial Strategy replaces the one adopted in June 2016 as part of the Amended Long Term Plan 2015-25. The previous Financial Strategy was based on
the assumption that the Christchurch City Holdings Limited (CCHL) subsidiary, City Care Limited would be sold as part of a $750 million capital release
programme, originally committed to in 2015, and amended to $600 million in 2016. This did not eventuate. An amended programme was developed with
CCHL committing to provide $440 million over the years 2015/16 - 2018/19; a further reduction of $160 million. That capital release programme has been
retained as part of this LTP along with debt, rates and government subsidies as the key sources of funding.

The Council is investigating other funding options including a fuel tax, such as is planned for Auckland along with further collaborations or joint ventures
similar to the Community Wellbeing and Resilience Partnership fund.

The Council has no plans to sell assets owned by CCHL.

Council is in discussion with the Crown over a global settlement relating to Anchor Projects and potentially other matters. This follows from earlier Crown
and Council agreements following the Canterbury earthquakes, in particular the Cost Share of 2013 and the public pronouncements from Government. Any
outcome over and above the original Cost Share Agreement is not included in the Long Term Plan and may not impact on the Financial Strategy.

This Strategy seeks to reconcile the relationship between the expenditure required to deliver the levels of service the community expects, and the call on
funding from rates and debt. These factors are inter-related and movement in one causes movement in at least one of the other variables. For example, if
rates are reduced then some combination of reduced or delayed expenditure is required, which in turn will likely result in a reduced level of service being
delivered, or increased debt.

Balancing levels of service and cost is more complex for Christchurch City Council than for other local authorities as we continue to address the impacts of
the earthquakes of 2010/11 on Council infrastructure and service provision.

This draft Financial Strategy presents the Council’s proposed solution to these challenges and details the key financial parameters and limits that the Council
will operate within over the period of the Long Term Plan (LTP).

With limited funding options available, this LTP proposes rescheduling (through deferring aspects of) the capital programme, with some reductions in the
levels of service, as a means of keeping rate increases to an acceptable level. Councillors have requested that rate increases be held to a maximum of 5.5 per
cent in each of the next two years, then reducing over time to be closer to the local government rate of inflation.
                                                                                                                                                             3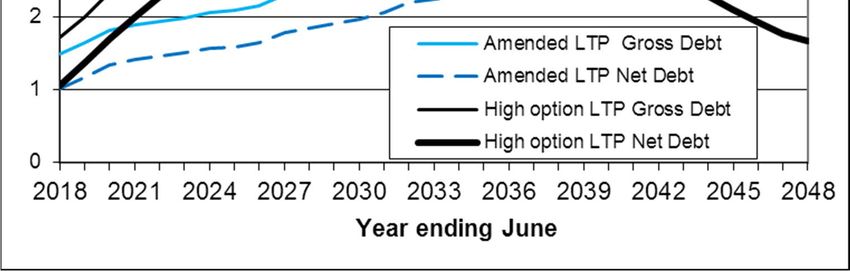
Three capital programme scenarios have been considered with differing levels of investment over the life of the LTP - low, medium (preferred) and high.
Under the high option as much as $17.1 billion of work is required over the next 30 years to restore and maintain assets to an optimal level, $6.2 billion of
which falls within the ten years of this LTP. For the low option the estimates are $11.1 billion and $3.3 billion, but with a resulting reduction in levels of
service. These options are explained in detail within the Infrastructure Strategy.

The budget for the medium, (preferred option) is to deliver $15.2 million over 30 years; $4.2 million within the 10 year LTP period.

Of the three options, only the preferred one, based on a medium capital programme, provides a financially viable and prudent long term solution. The
capital programme is discussed in Section 5 and the rates and debt effect of each are set out in sections 8 and 9 below, but in summary;

    ·   The preferred option has a rates increase of 5.5 per cent in 2018/19, plus the ten year cathedral grant rate (0.22 per cent). The average rate increase
        to existing ratepayers for the 10 years of the LTP is 4.37 per cent per year. The net debt ratio peaks at 206 per cent in 2024, within the New Zealand
        Local Government Funding Agency Limited (LGFA) limit. Gross debt plateaus at $2.7 billion in 2026. Water supply and stormwater assets would be
        maintained in their current condition but wastewater assets would deteriorate, possibly resulting in increased wastewater overflows and slower
        response times.

    ·   The low option has a rates increase of 5.5 per cent in 2018/19, plus the ten year cathedral grant rate. The average rate increase to existing ratepayers
        for the 10 years of the LTP is 3.6 per cent per year. The net debt ratio peaks at 173 per cent in 2021. Gross debt peaks in 2024 at $2.2 billion and
        declines thereafter. The risk with this option is a gradual deterioration in assets, increased risk and reduced levels of service in later years,

    ·   The high option has a rate increase of 6.0 per cent in 2018/19, plus the ten year cathedral grant rate. The average rate increase to existing ratepayers
        for the 10 years of the LTP is 6.2 per cent per year. The net debt ratio peaks at 299 per cent in 2025, well above the LGFA limit of 250 per cent. Gross
        debt continues to increase through to 2034 before declining to around the same level as the preferred option by 2048. While this option provides for
        optimum asset management, it is at the cost of high rates increases and is not financially resilient as it breaches the LGFA limits. This is covered in
        more detail in section 9.

                                                                                                                                                              4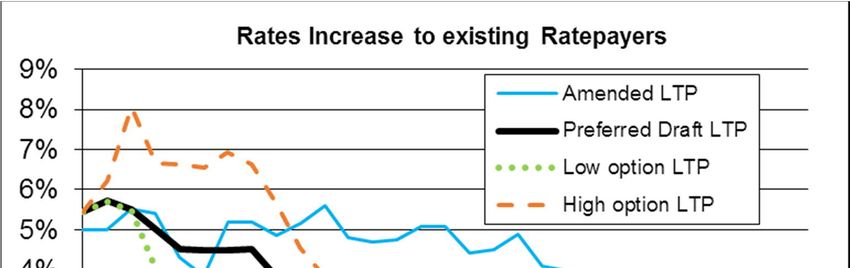
For the preferred option, the net debt/ revenue ratio peaks at 206 per cent in 2024 and declines to under 150 percent by 2035, well within the Local
Government Funding Authority absolute ceiling for net debt to revenue of 250 per cent. Council complies with all of its Financial Prudence benchmarks other
than two:
    ·   Balanced budget benchmark; in the period 2020 – 2023, planned revenue is marginally less than planned expenditure. The difference ranges from 2
        per cent in 2020 to 1 per cent in 2023, and is due to an insufficient allowance for asset renewals, which is rated for in lieu of depreciation. The rating
        for renewals increases steadily across the LTP period and the 4 year shortfall is not considered to be a material breach. The graphs are contained
        within the Financial Prudence Benchmarks, (part of the supporting documentation).
    ·   Debt servicing benchmark; planned borrowing exceeds the 10 per cent benchmark from 2019 onwards, peaking at 13.7 per cent in 2025 before
        reducing slightly. If Christchurch was considered to be a high growth council the benchmark would be 15 per cent. The benchmark was designed to
        allow comparison between councils and the legislators did not contemplate the cost involved in recovering from an earthquake. Council has sufficient
        operating funds to service the debt.

Financial headroom (the ability to borrow more if required without breaching financial covenants) has a low point of $420 million in 2024, significantly less
than the 2016 amended LTP’s figure of $529 million in 2020. This is largely due to Council borrowing $160 million in lieu of receiving it as a capital release
from CCHL. The value of headroom is that it allows for a degree of flexibility in the future if unforeseen circumstances arise. This is considered a prudent level
of headroom.

There are a number of possible new work streams within the Council’s overall work programme that are being discussed and/ or evaluated but which have
been assumed will not progress in any significant way in the lifetime of the Long Term Plan 2018-28. These are:
    ·   Projects to protect infrastructure from the natural hazards arising from climate change (e.g. sea level rise and coastal erosion), noting that climate
        change is taken into account where possible when designing new projects
    ·   Permanently treating Christchurch’s water supply
    ·   Additional contributions to regeneration projects, particularly Ōtākaro-Avon River corridor and Cathedral Square, other than $9 million for
        Cathedral Square, $118 million for Avon flood plain management and stormwater treatment and $26 million for New Brighton regeneration
        projects
    ·   Alpine Fault earthquake (AF8) readiness, in addition to the civil defence preparedness already undertaken by the Council
    ·   Variations to the Cost-Share Agreement with the Crown (e.g. Multi-purpose Arena)
    ·   Moving to dispose treated wastewater to land, other than for Duvauchelle.
                                                                                                                                                                 5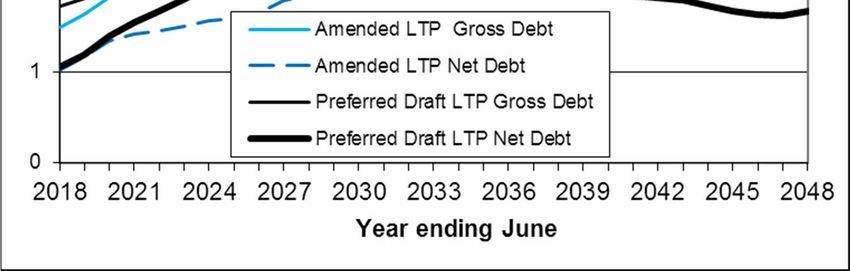
3 Context
Earthquake recovery
Significant earthquake-related investment is still required in Council’s key infrastructure assets of roads, water supply, sewerage, and flood protection.
Although the investment undertaken by the Stronger Christchurch Infrastructure Rebuild Team (SCIRT) has now been completed, this was only intended to
provide for restoration of service provision of broken infrastructure – large parts of the networks remain functional but significantly damaged, and the
investment needed to repair these and restore desired levels of service will continue to place pressure on Council’s capital spending and borrowing
requirements for many more years to come.
Council is progressing well with its facility and heritage asset restoration/replacement projects with many now open to the public. Council committed to a
programme early on in the recovery process to ensure local communities could return to a level of normality.
The Council also has commitments to Anchor Projects, and will face on-going operating cost pressures as new community facilities (such as the Central Library
and Metro Sports facility) are completed.
In the private sector, earthquake recovery is progressing well – the District’s population recovered to its pre-earthquake level in June 2017, and house prices
have stabilised (in contrast to the increases seen in many other urban centres). Although numerous vacant spaces remain in the smaller CBD, a substantial
number of major commercial tenants have re-established their central presence.
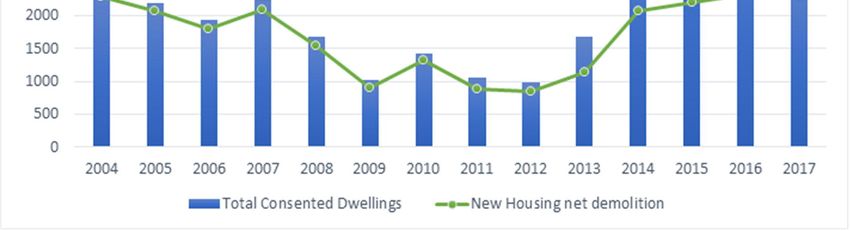
New Building Consent volumes have declined significantly towards pre-earthquake levels, indicating that a substantial portion of private sector rebuild activity
has been completed.
6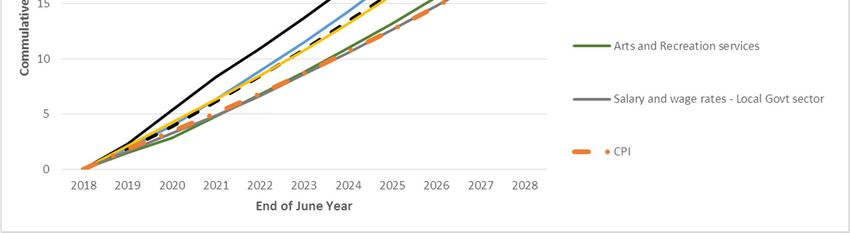
New Building Consents (historical annual volumes)

However, this gradual normalisation of residential and commercial development activity will place additional pressure on Council’s budget, as its on-going
cost pressures will need to be met without the benefit of a fast-growing rates base – the natural growth in Council’s rates revenue is projected to decline
back towards a pre-earthquake population-driven pace over the ten years covered by this LTP.

                                                                                                                                                         7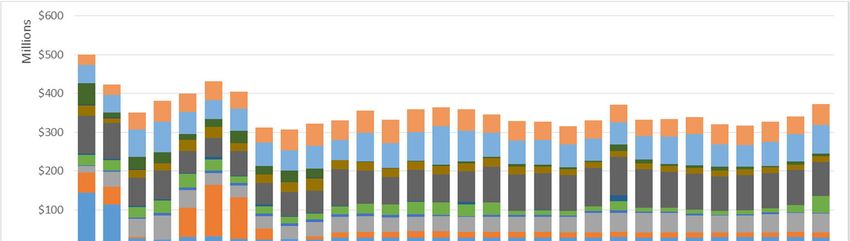
4 Population and land use
All population figures and projections in this section are sourced from the Department of Statistics unless otherwise stated.

The estimated population of Christchurch at June 2017 was 381,500 (National Population Estimates release, August 2017). This population is projected to
rise to 387,200 by June 2018, to 423,800 by June 2028, and to 467,900 by June 2048 (Subnational Population Projections release, December 2016). This
equates to average growth of around 0.9 per cent each year for the 2018-2028 LTP period, compared with national population growth of around 1.03 per
cent each year over the same period.

Christchurch Population Growth (Statistics New Zealand Subnational Population Projections, December 2016)

The neighbouring districts of Waimakariri and Selwyn are expected to continue their rapid population growth over these periods (by 27,900 new residents
combined by 2028, or 2.1 per cent per year on average), increasing commuter pressures on Christchurch’s transport infrastructure due to work, shopping,
and leisure travel demand.

                                                                                                                                                     8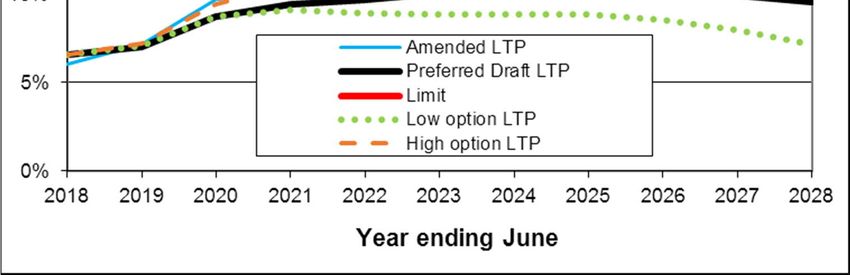
The Christchurch population projection is significantly higher than in the 2015-25 Amended LTP, which had projected the June 2017 population to be around
365,000. However, this increase is effectively a post-earthquake re-population of the city rather than “new growth” – the actual June 2017 population is only
slightly higher than before the earthquakes.

Population increases over the LTP period are expected to be slightly front-loaded, with annual growth levels of around 1.1 per cent per year expected to
persist until June 2023 before dropping back to a more normal growth rate of around 0.7 per cent per year thereafter.

Such population growth, along with a significant portion of the replacement housing stock being developed in former greenfield areas, will tend to increase
demand pressure on infrastructure and services. There is currently around 2,385 hectares of vacant land available for residential development, and around
1,098 hectares for commercial and industrial development.

A key demographic challenge for the city in future will be the impacts of an aging population, which may impact both the size and value of new dwellings and
residents’ ability to pay.

                                                                                                                                                           9
5 Capital Programme
The proposed capital works programme based on the preferred option presented in the draft LTP reflects the analysis of the city’s infrastructure requirements
undertaken in preparing the Infrastructure Strategy, Service Plans and Asset Management Plans. These plans link the forecast asset renewal requirements,
growth demand, levels of service requirements and the imperatives of Council strategies such as the Greater Christchurch Urban Development Strategy and
the Government’s Land Use Recovery Plan.
The Infrastructure Strategy proposes a 30 year plan for the Council’s infrastructure that provides the services of water supply, wastewater, stormwater
(including flood protection), transport, parks, facilities, solid waste and communication technology.
The 2018 Infrastructure Strategy is based on consideration of the four most significant issues impacting on Council infrastructure planning and delivery:
· Asset renewals – the proportion of Council infrastructure in poor condition and/ or approaching the end of economic life is increasing. Under
investment at this stage will create a “bow wave” of required infrastructure investment in future years. This issue is most acute in the water,
wastewater and stormwater networks and to a lesser extent roads and footpaths
· Climate change – the effects of climate are likely to require changes to infrastructure requirements, particularly for stormwater and flood protection.
· Post-earthquake recovery and regeneration – the SCIRT repair programme mostly used a patch-repair approach rather than replacement of damaged
infrastructure. There remains significant proportions of infrastructure networks that will require more permanent repair treatment.
· Affordability - the Council is conscious of the effect increasing rates can have on residents and on the ability to attract and retain new residents. A
balance of quality infrastructure, facilities and services with an affordable cost is required.
These issues closely reflect and build on the significant issues identified in the 2015 Infrastructure Strategy. The key difference between the 2015 and 2018
strategies is that the understanding of the impact of them on infrastructure has improved. This is due to greater information about both the current condition
of Council infrastructure and the issues themselves.
The capital works programme is the largest area of Council expenditure where there are clear options available around the level of investment, albeit with
consequences on the Council’s ability to provide reliable infrastructure, meet the demands of growth and meet the community’s expectations in terms of
the levels of service provided.
10The 2018 Infrastructure Strategy contains three capital investment options to address the significant issues:
Medium (the preferred option) – under this option the focus is proposed to be on improving roads, community and sports facilities and parks. Water
supply and stormwater assets would be maintained in their current condition but wastewater assets would deteriorate, possibly resulting in increased
wastewater overflows. In addition there may be some decline in response and resolution times. The capital expenditure budget for this option is
$4,185 million over 10 years which is approximately the total budget in the current amended LTP. Over 30 years $15,205 million in capital expenditure
is proposed to be spent on infrastructure, again very close to the expenditure budgeted in the current LTP.
Low – a reduced budget compared to the Medium option, with reduced infrastructure renewals and lower IT spend. In addition to wastewater assets,
the condition of water supply, stormwater and road assets would also deteriorate under this option, with a significant reduction in many levels of
service over the 30 year period. There would be an increased public health risk from contaminated water due to increased pipe breaks, infrastructure
would not be provided for growth areas after the first three years, roads would get rougher, the Council would be highly unlikely to obtain a global
stormwater discharge consent, more houses would remain at risk of flooding and waterways would deteriorate. Further detail is provided in the
Infrastructure Strategy. This capital expenditure budget for this option is $3,253 million over 10 years and $11,148 million over 30 years.
High – an increased capital works budget compared to the Medium option, with additional investment to restore core infrastructure to a condition
which minimises whole-of-life costs. The condition of roads would be more quickly returned to a level similar to other New Zealand cities, the risk of
flooding would be reduced faster, wastewater overflows to waterways would reduce and the use of public and active transport would
increase. Further detail is provided in the Infrastructure Strategy. This capital expenditure required for this option is $6,248 million over 10 years
and $17,097 million over 30 years.
11Graph of three capital expenditure options – cumulative uninflated spend
$b Projected Capex un-inflated - cumulative
14
12
10
8
6
4 Preferred Draft LTP
Amended LTP
2 Low option LTP
High option LTP
0
2018 2021 2024 2027 2030 2033 2036 2039 2042 2045 2048
Year ending June
The preferred option for the capital expenditure programme for the next 30 years is shown in the graph below, and reflects the asset programme
included in the Infrastructure Strategy, work programmes and budgets of the draft LTP. This includes the replacement of post-World War II
infrastructure which is near the end of its useful life. This asset renewal programme has always been known and planned for, but has been accelerated
by the reduction in useful life of many assets as a result of the earthquakes. This renewal programme begins to impact the Council’s capital programme
from the mid-2020s as shown. For further information please refer to the Infrastructure Strategy, Financial Estimates and Assumptions.
12Graph of medium (preferred option) total infrastructure spend for the next 30 years, by Group of Activity
Preferred Option Capital Spend (2018/19 dollars)
The total capital programme for the ten years of the Long Term Plan includes infrastructure, as well as non-infrastructure programmes for community
facilities and internal services such as Information Technology, vehicle fleet and corporate accommodation. It includes a provision for the renewal of
existing assets, plus additional capacity to meet demand growth and increasing levels of service. This planned capital expenditure is summarised by
these categories in the graph below.
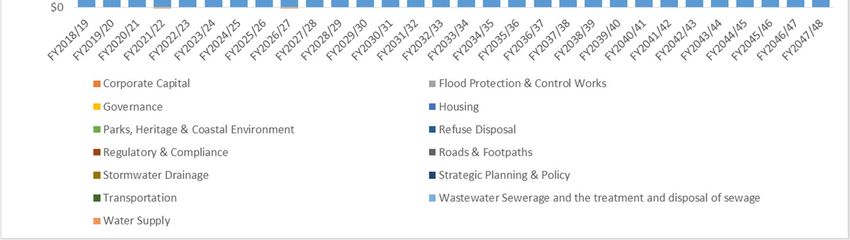
13Graph on renewals, level of service and growth for the 10 years of the LTP, (preferred option)
Capital Programme by Primary Driver (2018/19 dollars), Preferred Option
146 Other factors impacting the financial position
Levels of Service
The Long Term Plan details the levels of service proposed to be provided for each activity. The levels of service are consulted on with the community through
the draft Long Term Plan.
There is normally a close correlation between cost and level of service. More investment will normally enable a higher level of service to be delivered, with
the opposite being the case for a reduced investment. Achieving a balance between community expectations and willingness to pay lies at the heart of the
trade-offs necessary when the Council prepares its work programme and budget.
There are two aspects to investing to deliver levels of service. Firstly there is investment in maintaining and replacing existing assets, normally to maintain
the level of service currently provided. The other is investment in new capital assets to cater for growth demand and/ or increase the level of service provided.
This section looks at the considerations the Council has made in terms of balancing the cost of service with the level of service provided.
Roads and Footpaths
Renewal works will be prioritised across the whole network to ensure delivery of the levels of service at the lowest lifecycle cost. The level of investment
proposed will see levels of service gradually increasing over time. The annual number of deaths and serious injuries on the road network is expected to
decrease from 120 to 100 over the next ten years, and road roughness is expected to improve to a level similar to other New Zealand cities over 20 years.
Resident satisfaction with road condition is expected to improve as a result.
To enable the community to monitor progress, the Council continues to measure the average roughness of the roading network. This measure also allows
residents to benchmark Christchurch roads with those of other Councils.
The Council’s roading work programme is heavily influenced by its Government funding partner the New Zealand Transport Agency (NZTA). The Council and
NZTA share the costs of most roading work and therefore need to agree on an optimal programme of works. This partnership approach means there are
incentives for the Council to match its work programme to the NZTA investment funding available.
15Three Waters
‘Three waters’ are comprised of water supply, waste water and storm water.
With the exception of water supply, the proposed capital renewal programme does not provide sufficient investment in asset renewals to maintain the
current levels of service.
For water supply renewals, there is a relatively steady planned spend for the medium option which would maintain the overall condition of the water supply
network in its current condition.
The number of wastewater system blockage complaints is expected to increase over the next ten years and response/ resolution times will decline for faults
and blowbacks. Resident satisfaction with wastewater system reliability is expected to decline as a result.
It is expected that there will be a steady reduction in the number of houses at risk of flooding, a reduction in stormwater contaminants, and a reduction in
complaints about stormwater system performance. As a result resident satisfaction with management of flood risk should improve.
More information around the actual level of service for each activity can be found in Service Plans. Links to specific levels of service for each activity (and their
trends over time) are available at https://www.ccc.govt.nz/the-council/plans-strategies-policies-and-bylaws/plans/long-term-plan-and-annual-plans/draft-
long-term-plan-2018-28/#DraftServicePlans
Sport and Recreation and Arts and Culture
The Council is proposing increased levels of service for these activities as a result of new swimming pool facilities in the Central City, Woolston/Linwood and
the South West of the city along with new libraries in the City centre and South-West. The Council contribution to the cost of these facilities is funded through
borrowing. The additional operational costs of these facilities are rated for and come on stream between 2018 and 2022.
Inflation rates
The table below shows the projected rates of inflation for the Council’s main activities over the next 10 years. The overall Local Government Cost Index,
based on the specific cost drivers affecting the Council is higher than CPI (consumer price index) inflation. This is due to the types of expenditure the Council
16incurs, (which does not include significant expenditure on manufactured goods and food which tend to moderate CPI increases), and helps explain the
difficulty faced by all Councils in holding rates to the publicised inflation rate.
Council-related cumulative inflation projections, June 2019 – June 2028 (BERL)
Capital Release
$300 million of capital has been released from CCHL by way of dividends and balance sheet restructuring (increasing CCHL debt) over the past three years,
and a further $140 million is planned in 2018/19. This level of capital release is deemed financially prudent, and achieves an acceptable balance between
controlling the Council’s need to borrow and ensuring that future dividend income from CCHL remains adequate.
The Council has is no plans to sell any assets owned by CCHL.
17Rating Base Growth
The term “Rating Base Growth” refers to the expectation that Council’s rates revenue will grow each year due to the development of new subdivisions and
buildings (which will tend to be worth more than un-developed land and so will attract higher rates). Such development will also increase demand for
council services and infrastructure. However, existing ratepayers will not pay any more in rates until the increase in the council’s rates requirement
exceeds the revenue generated by the growing Rating Base.
Growth in the Rating Base will be influenced by four key factors: Population growth (which will tend to increase the need for more subdivision and
building); the increasing number of households (which is likely to be slightly higher than population growth, due to an expected decline in the average
number of people per household as the population ages); the increasing number of individual properties or rating units (which at least initially will be
lower than household growth because of the extent of land already subdivided – a new building on an existing section does not increase the number of
rating units because the section already existed prior to being built on); and the marginal value of future development (eg. a new house on an existing
section will only have a marginal impact on the Council’s Rating Base, because rates are already being charged on the vacant section).
For planning purposes, it is assumed that:
· Growth in the district’s population and number of households will be in line with the Department of Statistics’ most recent projections (subnational
population projections, December 2016).
· The number of rating units (including residential and commercial) will tend to grow at around the same pace as household growth in the long term.
· The Rating Base (council’s revenue) will tend to grow at around the same pace as population growth in the long term – i.e. slower than the growth
in rating units, in part because at least some rates are already charged on undeveloped land, but also due to an expected trend towards smaller
dwellings as the population ages.
· However, in the short term, growth in both the number of rating units and the Rating Base will be slower than projected household and population
growth (respectively) due to the extent to which future development land has already been subdivided and rated.
These assumptions result in the following projections for the number of people, households, and rating units in the 2018-28 LTP period.
18Growth Assumptions, 2018-28 (number of people and properties)
June Years 2018 2019 2020 2021 2022 2023 2024 2025 2026 2027 2028
Population 387,200 391,520 395,840 400,160 404,480 408,800 411,800 414,800 417,800 420,800 423,800
Households 150,900 152,880 154,860 156,840 158,820 160,800 162,300 163,800 165,300 166,800 168,300
Rating Units 169,027 170,886 172,766 174,494 176,239 177,913 179,514 181,130 182,760 184,405 186,065
These growth assumptions are the basis for the council’s projected Rating Base growth over the period. Expressed as percentages per year, projected
growth rates are as follows:
Projected Growth, 2018-28 (percentage per year)
June Years 2019 2020 2021 2022 2023 2024 2025 2026 2027 2028
Population 1.12% 1.10% 1.09% 1.08% 1.07% 0.73% 0.73% 0.72% 0.72% 0.71%
Households 1.31% 1.30% 1.28% 1.26% 1.25% 0.93% 0.92% 0.92% 0.91% 0.90%
Rating Units 1.10% 1.10% 1.00% 1.00% 0.95% 0.90% 0.90% 0.90% 0.90% 0.90%
Rating Base (revenue) 0.90% 0.85% 0.80% 0.80% 0.80% 0.70% 0.70% 0.70% 0.70% 0.70%
From 1 July 2018 earthquake-related legislation allowing the Council to increase rates on newly-developed property during the rating year will expire. In
future, rates must be calculated based on the value of each property as it exists on each 1 July, in line with normal sector practice. This will reduce the Council’s
intra-year revenue by the amount that would have been collected from new developments through the year.
Insurance
The Council has progressively increased its level of insurance cover over the City’s assets as insurance providers have re-entered the Christchurch market
after the earthquakes. This extends to full cover including earthquake cover for 894 buildings, valued at $1,985 million, and cover for fire and other perils,
excluding earthquake, over a further 316 buildings valued at $228 million. The remaining 654 buildings totalling $168 million, with individual values of less
than $2 million, remain self-insured.
The Council has $500 million of cover on below-ground water supply, waste water and stormwater pipes and this will be further increased as additional cover
becomes available. In the event of another significant earthquake Council is relying on a combination of insurance and its borrowing capacity to fund it’s 40
19per cent share of any damage incurred, thereby entitling it to the remaining 60 per cent under the Government’s Civil Defence and Emergency Management
Plan. The combination of insurance and Crown funding currently provides Council with approximately $4.3 billion of cover for assets with a replacement value
of $6.3 billion. To put this into context, the Council’s has spent around $3 billion on underground assets following the 2010/11 earthquakes.
207 Financial Strategy, focus and principles
The Financial Strategy needs to strike an optimal balance between: (i) the expenditure required to deliver desired levels of service; (ii) the need to limit rates
increases to levels which are acceptable and affordable to ratepayers; and (iii) the need to maintain debt levels within the limits required by lenders.
These factors are inter-related and movement in one must be balanced by movement in at least one of the other variables. For example, if rates are reduced
then some combination of reduced expenditure, which would likely result in a reduced level of service, or more debt will result. Similarly, if debt levels are
reduced then some combination of reduced expenditure, or higher rates will result.
The focus of the 2018-28 Long-Term Plan is therefore on scheduling and delivering a level of infrastructure investment that will enable the safe and reliable
delivery of acceptable services while controlling debt within financially sustainable levels and limiting rates increases to an acceptable level.
In developing this strategy, the Council believes it is important to:
· Keep debt to a level that gives the Council the capacity to borrow beyond 2028 in the event of an emergency.
· Spread the cost of new capital assets across current and future ratepayers who will benefit from the services the assets provide (intergenerational
equity). The Council’s policy is to achieve this by funding renewals through rates and borrowing for the balance of the capital programme. This
additional debt is repaid over 30 years.
· Build in financial resilience over time. Specifically, in the event of another disaster the Council needs to be in a position to fund its share of the repair
and rebuild costs. The Government’s Civil Defence and Emergency Plan covers 60 per cent of the cost but only if the Council can meet the first 40 per
cent. The challenge facing the city is to do this over an appropriate timeframe while not over-burdening current ratepayers.
The Council holds significant investments through CCHL but these are not readily convertible to cash during the first critical 12 month period following
a disaster when response costs are highest. It is considered unrealistic to build a strategy which positions the Council to be in the financial position
to withstand another significant disaster in the short term. The period of time to achieve this financial resilience is a key parameter of the financial
strategy and realistically occurs around 2030 when the net debt/ revenue ratio falls below 170 per cent.
· Maintain a balanced budget; i.e. ensure that revenue continues to meet expenses. This financial prudence benchmark is not met in the period 2020
– 2023 as planned revenue is marginally less than planned expenditure. The difference ranges from 2 per cent in 2020 to 1 per cent in 2023, and is
21due to the level of rating for asset renewals being less than depreciation expense. The rating for renewals increases steadily across the LTP period
and the 4 year shortfall is not considered to be a material breach.
· Maintain rating for renewals at a level which recovers around 56 per cent of estimated depreciation, increasing to around 75 per cent of estimated
depreciation by 2028. This means that the Council is increasing its rating for renewals to a more appropriate level over the period of the LTP, although
it will be some years before this is achieved. Other external revenue, mainly from NZTA, funds 6% of Council’s renewal programme.
· Maintain a policy of financial prudence through managing revenues, expenses, assets, liabilities, investments, and general financial dealings prudently
and in a manner that promotes the current and future interests of the community through all of the above.
The three capital expenditure options have differing impacts on rates increases and debt levels as discussed in the two sections below.
228 Rates projections and limits
Annual Rates Increases
Annual rates increases under the three capital expenditure options are shown in the graph below. All options include the 0.22 per cent, ($7.19 each year for
10 years) proposed rate for the $10 million cathedral grant.
The preferred option proposed in this draft LTP reflects a required rates increase for the first year which is slightly higher than the Amended LTP. Rates
increases then decline slowly over the 10 year LTP period to a projected local government cost index inflation level.
The low capital investment option results in lower rates increases through reduced debt servicing costs flowing from the lower capital programme. The trade-
off is that much of the Council’s infrastructure will deteriorate over the period and will at some point significantly increase operational expenditure due to
the unreliability of infrastructure networks leading to a decline in levels of service.
The high capital investment option results in significantly higher rate increases in the LTP period through the cost of servicing the increasing debt. The rate
increases would place a significant burden on ratepayers over coming years.
23Graph of rates increases to existing ratepayers for the next 30 years
The draft financial strategy proposes, under the preferred option, a slightly higher overall rates increase over the next five years than the Amended LTP. The
proposed rates increases to existing ratepayers over the LTP period are as follows, (inclusive of 0.22 per cent for the ten year Cathedral rate:
Year 2018/19 2019/20 2020/21 2021/22 2022/23 2023/24 2024/25 2025/26 2026/27 2027/28
Increase 5.72% 5.5% 5.0% 4.5% 4.5% 4.5% 4.5% 3.8% 3.0% 2.7%
Although rates increases over recent years have been significant, the cost of rates in Christchurch remains comparable with that of other metro councils. The
following chart shows average rates per rating unit as disclosed in Annual Reports (the ten largest local authorities are shown except Dunedin, Hutt City,
Upper Hutt City, and Wellington City, for which data is not currently available).
24Average Rates Revenue per Rating Unit (Metro Councils) (Annual Reports)
(excluding GST, any Regional Council rates, and Auckland’s Watercare charges)
Quantified Limitations to Rates Increases
Section 101A of the Local Government Act 2002 requires local authorities to fix a limit on annual rates increases for each year in the LTP period. The Council
has set these higher than the rate increases proposed (and shown in the chart above), to allow for budget flexibility in the event of unexpected adverse
developments in the Council’s position or operating environment. Importantly, they also relate to total rates income (i.e. including natural growth from the
development of new properties) – the increase to existing ratepayers will always be lower as long as the number of ratepayers continues to grow. For this
reason, existing ratepayers should focus on the previous table as an indicator of likely future rates increases rather than the table below.
The limit for rates revenues and rates percentage increases is set at one per cent above the rates income and increases contained in the draft LTP financial
statements.
25Quantified limits for rates increases
Year 2018/19 2019/20 2020/21 2021/22 2022/23 2023/24 2024/25 2025/26 2026/27 2027/28
Rates ($m) 492 523 554 583 614 647 681 711 738 763
Increase 8.38% 7.41% 6.87% 6.30% 6.32% 6.30% 6.20% 5.54% 4.71% 4.39%
269 Debt projections and limits
Debt Projections
Ability to borrow is limited by a lenders’ willingness to provide credit as well as ratepayers’ ability to service future interest costs and principal repayments.
Council maintains several covenants with lenders which set specific limits on borrowing – most importantly, that total net debt may not exceed 250 percent
of total operating revenues.
A prudent strategy should restrict planned borrowing to materially less than this covenant limit, to allow for budget flexibility in the event of unexpected
adverse changes to the financial position or operating environment over the period. The maximum debt/revenue ratio under the preferred option in this
draft LTP is 206 per cent, which provides “headroom” (the ability to borrow more if required without breaching financial covenants) of $420 million,
significantly less than the 2016 amended LTP’s figure of $529 million in 2020. This is largely due to Council borrowing $160 million in lieu of receiving it as a
capital release from CCHL.
Key debt and interest cost projections are shown in the following charts for the three options.
27Projected debt – medium capital investment option
Debt increases through to 2025, around the time the Multi-purpose Arena is completed. Increased rating for asset renewals through to 2029 contributes to
debt levelling out after that time.
28Projected debt – low capital investment option
Under this option debt remains at levels similar to the current amended LTP through to 2025, then reduces due to the lower new capital programme.
However there is nothing to prevent this option from being adopted in the short term. The proposed levels of service set out in the draft LTP are calibrated
to deliver on the preferred option. If the Low option were to proceed it may be viable in the short term. In the medium or longer term it is clear that this
option would result in significant reductions across many levels of service, as well as increased risk of infrastructure failure. Further details are set out in the
Infrastructure Strategy.
$b Projected Debt
4
Amended LTP Gross Debt
Amended LTP Net Debt
Low option LTP Gross Debt
3 Low option LTP Net Debt
2
1
0
2018 2021 2024 2027 2030 2033 2036 2039 2042 2045 2048
Year ending June
29Projected debt – high capital investment option
Under this option debt grows significantly during the 10 year LTP period due to 50 per cent higher capital expenditure through that period than for the
medium capital investment option. The associated higher rates increases in that period to service and repay the debt see debt eventually fall to a level similar
to the preferred option. However the high debt in the intervening years causes the debt to operating revenue ratio to exceed the levels agreed with the
Council’s lenders, (which would make borrowing more difficult and more expensive). This, coupled with the lack of financial resilience means that the option
is not financially prudent and not recommended. Clearly this is not a long term option, but it could be considered as a short term solution, before moving to
a capital investment level more in line with the preferred option.
30Net debt to revenue for the next 30 years
The graph below shows the projected net debt ratio for the three options. The preferred option is higher than the (current) amended LTP in the LTP period,
partly due to the reduced capital release. In the longer term the net debt ratio is lower due to higher rating for asset renewals.
The lower option is similar to the current LTP for the LTP period before reducing due to a combination of lower capex and higher rating for asset renewals.
The high option reflects the high capital programme and breaches the LGFA limit for a sustained period.
The two ratios shown below indicate the interest costs associated with servicing the debt under all options remains within the Council’s self imposed limits.
31Net cost of interest to rates income for the next 10 years
32Net interest to revenue for the next 10 years
These charts show that under all options the Council’s total debt continues to climb through most of the LTP period as a result of capital improvement in
infrastructure improvement, anchor projects, and replacement assets. Over the longer term the net debt level varies depending on the option. While interest
costs remain within prudent levels and within Council’s ability to repay principal amounts in an orderly manner, the level of debt under the high option is an
issue as LGFA limits would be breached for a sustained period of time. This would reduce the Council’s access to loan funding and increase the cost of
borrowing as a result of the increased risk to lenders. As a result, the high capital investment option is not recommended as a long term solution.
Conclusion
The preferred medium capital investment option is seen as optimal as it balances restoring and maintaining the condition of the City’s assets with relatively
affordable rate increases and a prudent level of debt.
33While the low capital investment option results in lower rates increases and less debt, the condition of assets will deteriorate bringing a higher risk of asset
failure, reducing levels of service and lower levels of overall community wellbeing and amenity. This in turn will make it more difficult for Christchurch to
attract and retain the skilled residents needed to be an attractive 21st century city.
The high capital investment option, would restore Council’s assets to an optimum level, but would result in high rates increases and cause debt limits to be
breached for a prolonged period. This option is not considered to be financially prudent.
Credit Rating
A credit rating affects how willing lenders are, to lend to the Council and the interest rate that will be charged. This Financial Strategy seeks to support
Council’s current “A+ (Stable)” credit rating from Standard & Poor’s. This credit rating would likely be reviewed downwards if the overall net debt exceeded
180 per cent of revenue or net interest exceeded 9 per cent of revenue.
Standard and Poor’s use different ratios and inputs for their purposes compared with those set by Council’s lenders and consider a wider range of factors. A
Standard & Poor’s assessment also includes consideration of the economic environment, Council’s financial management, liquidity, and budgetary
performance and flexibility. It also considers the stability of governance and executive management and its willingness to make hard decisions.
Any downgrade in rating would have only a marginal impact on interest rates, but could increase interest costs by as much as $4 million per annum in the
later years of this Plan. This has not been incorporated into these financial analysis underpinning this strategy. Should a downgrade occur, it is expected the
Council’s credit rating would be restored over time as the funding uncertainty decreases and the net debt/revenue ratio returns to more conservative levels.
Security on borrowing
Borrowing is secured by way of a charge over future rates revenue, consistent with normal sector practice.
From time to time, with the prior approval of Council and the Debenture Trustee, security may be offered by providing a charge over one or more of the
Council’s assets. This will only be done where there is a direct relationship between the debt and the purchase or construction of the asset being funded,
such as an operating lease or project finance, and the Council considers a charge over the asset to be appropriate.
34Quantified Limitations to Debt Increases
The Council is proposing to raise the current debt level (as shown in the charts above), to enable the funding of the proposed capital investment programme
and allow for budget flexibility in the event of unexpected adverse developments in the Council’s position or operating environment.
Section 101A of the Local Government Act 2002 requires local authorities to state a maximum limit to debt increases over the LTP period.
Proposed limits for the debt increases are shown in the table below. These have been set at 250 per cent of annual revenue, liquid assets, and on-lending to
Council Controlled Organisations. The limits are a “worst case” maximum borrowing scenario, and ratepayers should focus on the graphs above for a better
indication of likely actual debt increases.
Quantified limits for debt increases
Year 2018/19 2019/20 2020/21 2021/22 2022/23 2023/24 2024/25 2025/26 2026/27 2027/28
Borrowing 2,926 2,632 2,703 2,811 2,875 2,995 3,126 3,213 3,327 3,400
Debt
headroom 1,119 607 534 518 444 420 448 523 663 752
($m)
3510 Council Investments
Working Capital & Special Funds
Council routinely holds significant working capital cash balances, due to the timing differences between spending, which occurs relatively evenly over the
year, and rates income which varies from month to month. In addition balances are maintained in various Special Funds, although these are lent internally
for Council purposes wherever possible.
Investment of these balances is undertaken in accordance with the Council’s the Investment Management Policy but is conservative – generally limited to
cash and short-term bank deposits, to reflect the likelihood of funds being needed relatively frequently to meet on-going payments.
Borrower Notes
Under the terms of its shareholding in the Local Government Funding Agency (LGFA), each time Council borrows from LGFA it must invest a portion of that
borrowing back into LGFA in the form of Borrower Notes. This ensures the stability of LGFA’s financial position, and provides a high level of confidence that
the LGFA will continue to be a cost-effective source for the bulk of the Council’s long-term borrowing requirements.
The Council earns interest on Borrower Notes at an interest rate equal to the base interest rate charged on the associated borrowing (i.e. excluding any
margins).
Community Loans
From time to time the Council makes loans to community groups to enable them to pursue their stated objectives. The return on these loans ranges from
interest free through to 4.4 per cent, depending on when they were granted and the conditions imposed. The total face value of these loans at 1 July 2017
was $8.1 million.
Capital Endowment Fund
The Capital Endowment Fund was formed in 2001 using the proceeds received from the sale of Orion’s gas subsidiary. The Fund provides an ongoing income
stream which is applied by the Council to economic development, and community events and projects activities. The Fund is invested according to the
Council’s Investment Policy, including internal lending to the Council to minimise Council’s external borrowing. The Council pays the Fund interest on internal
36loans at a market rate, although no more than it would pay for a similar loan from an external lender. Fund investments are consolidated with those of the
Council for reporting purposes.
The Fund is projected to make returns during the Long Term Plan of:
2018/19 2019/20 2020/21 2021/22 2022/23 2023/24 2024/25 2025/26 2026/27 2027/28
Return 3.60% 3.61% 3.64% 3.67% 3.74% 3.76% 3.82% 3.96% 3.96% 3.96%
Council Controlled Organisations, (CCOs and CCTOs)
The Council’s main investment is in CCHL which holds investments on behalf of the City and provides a dividend return each year which is used to reduce the
Council’s rate requirements. The average cash dividend yield on Council’s CCHL investment, calculated using a valuation of CCHL by an independent valuer,
has averaged 2.3 per cent in the last three years and 3.3 per cent in the last ten years. When the appreciation in the capital value of its investments is taken
into account, CCHL has achieved an internal rate of return over the past five years of 17.5 per cent a year, or 25.6 per cent a year since 1996. This significant
return is due to asset growth.
Capital release mechanisms used by CCHL allows it to realise this increase in asset value and return it to Council as a cash dividend. Further information on
CCHL’s subsidiary companies is provided in the Long Term Plan and in the companies' Statements of Intent.
The Council has shareholdings in a further eight companies. These are held principally to achieve efficiency and community outcomes and not to receive a
financial return on investment.
The risk to Council of investing in these companies is low. A list and description of all of the Council’s CCOs and CCTOs is provided in Appendix 2.
37Appendix 1 - Major Community Facilities /Anchor Projects
The Council remains committed to the post-earthquake rebuild, construction or repair of the major community facilities listed below, either as part of the
Cost Share Agreement with the Crown or on its own. Facilities which are part of the Cost Share are marked with an asterisk. The Cost Share Agreement is the
underlying document between Council and the Crown that determines the cost contribution, ownership and operating cost responsibilities for each of the
Anchor Projects.
For most facilities the future ownership is clear but where the Cost Share Agreement is ambiguous assumptions have been made for the purposes of this LTP:
Council Contributions to Major Community Facilities / Anchor Projects
Council
Complete? Assumption
contribution ($m)
Christchurch Art Gallery 57.6 Yes Council ownership and operation
Central library* 92.7 Council ownership and operation
Nga Puna Wai 46.4 Council ownership and operation
Eastern aquatic facility 31.1 Council ownership and operation
Christchurch Town Hall* 140.6 Vbase ownership and operation
Performing arts* 31.3
South West Library, Customer Services and
35.2 Council ownership and operation
Leisure Centre
Convention Centre* - Crown ownership and operation
Car parking * 70.0 Council / private ownership and operation
New multi purpose arena* 254.0 Funded in the years 2023 – 2025
Central city multi-sport facility* 151.3 Council ownership and operation
Avon river park* 6.4 Council ownership and maintenance
Transport Interchange* 29.9 Council ownership from 2019/20 and operation for all years.
Transport Plan –phase 1* 27.0 Yes Council ownership and maintenance
The Square* 4.6 Council ownership and maintenance
The Frame, (Public realm)* 6.8 Council ownership and maintenance
Earthquake memorial* - Yes Crown ownership and maintenance
Woolston/Linwood Pool 21.8 Council ownership and maintenance
38Appendix 2 Council Investments (CCOs & CCTOs)
Company Shareholding Principal reason for investment Budgeted Return
Council Controlled Trading Organisations
Christchurch City 100% Return on capital $45.1 - $68.6 million per annum as detailed in the
Holding Investments Holding company for the Council’s trading forecast dividend table below.
investments. Plus special dividends of $140 million in 2018-19.
Vbase Limited 100% Economic Development None in Long Term Plan period.
Achieved through the provision of venue
management and event hosting services at its own
venues (Horncastle Arena) and those it manages (Air
Force Museum of New Zealand, Hagley Oval Pavilion
and AMI Stadium). The Town Hall, owned by Vbase
Limited, is currently undergoing earthquake repairs
and is expected to reopen in the first quarter of 2019.
Civic Building Limited 100% Property Investment Returns expected from 2020 onwards.
The company holds the Council’s 50% investment in
the joint venture that owns the Civic Building offices.
This is a long term investment.
ChristchurchNZ 100% Economic Development None
Holdings Limited Achieved through optimising economic and social
opportunities that tourism, major events, city
promotion and economic development can bring to
Christchurch and Canterbury.
Tuam Limited 100% Dormant All capital to be returned in 2018 and company
wound up.
39Company Shareholding Principal reason for investment Budgeted Return
Share Investments
Transwaste Limited 38.9% Regional landfill $3.5 - $8.1 million per annum
New Zealand Local 8.3% Borrowing $110,000 per annum
Government Funding
Agency
Civic Financial 12.9% Supplies local government with financial services such None
Services Limited as superannuation, Kiwisaver, and underground
(previously New infrastructure insurance cover
Zealand Local
Government
Insurance
Corporation Limited)
Endeavour Icap 12.8% Economic Development within Canterbury region None
The Council provides loan funding to its 100 per cent subsidiaries as and when required. Interest is charged on this lending at a rate slightly above that at
which Council can borrow.
40You can also read