Investing in the Future of Asia - Matthews Asia Dividend Fund

Page created by Daniel Avila
 
CONTINUE READING
Investing in the Future of Asia - Matthews Asia Dividend Fund
Investing in the
                                                  Future of Asia
                                                  Matthews Asia Dividend Fund

                                                  Matthews Asia I Q2 2020

The views and information discussed herein are as of the date of publication, are      Investing in international and emerging markets may involve additional risks,
subject to change and may not reflect current views. The views expressed               such as social and political instability, market illiquidity, exchange-rate
represent an assessment of market conditions at a specific point in time, are          fluctuations, a high level of volatility and limited regulation. Fixed income
opinions only and should not be relied upon as investment advice regarding a           investments are subject to additional risks, including, but not limited to, interest
particular investment or markets in general. Such information does not                 rate, credit and inflation risks. In addition, single-country and sector strategies
constitute a recommendation to buy or sell specific securities or investment           may be subject to a higher degree of market risk than diversified strategies
vehicles.                                                                              because of concentration in a specific industry, sector or geographic location.
                                                                                       Investing in small companies is more risky and more volatile than investing in
Investment involves risk. Past performance is no guarantee of future results. The      large companies.
value of an investment in the Fund can go down as well as up. The information
contained herein has been derived from sources believed to be reliable and             Matthews Asia is the brand for Matthews International Capital Management, LLC
accurate at the time of compilation, but no representation or warranty (express        and its direct and indirect subsidiaries.
or implied) is made as to the accuracy or completeness of any of this
information. Matthews Asia and its affiliates do not accept any liability for losses
either direct or consequential caused by the use of this information.
                                                                                       For institutional use only. Do not give, show or quote to any other person. Not to
                                                                                       be used with retail investors. Do not duplicate or reproduce.
                                                                                                                  © 2020 Matthews International Capital Management, LLC PT001b_2Q20
Investing in the Future of Asia - Matthews Asia Dividend Fund
Asia’s Global Relevance

 For institutional use only. Do not give, show or quote to any other person. Not to be used with retail investors. Do not duplicate or reproduce.
                                                                               © 2020 Matthews International Capital Management, LLC PT001b_2Q20    2
Investing in the Future of Asia - Matthews Asia Dividend Fund
Asia’s Global Relevance
More people, more wealth, more growth

                                                                         More than 4.5 billion of the 7.7 billion people
                                                                         worldwide live within the circle, but it’s not just
                                                                         India and China that make up this population:

                                                                                                                                 Indonesia: 271 million
                                                                                                                                 Pakistan: 217 million
                                                                                                                                 Bangladesh: 163 million
                                                                                                                                 Philippines: 108 million
                                                                                                                                 Vietnam: 96 million

                                                                                                                                        Average age: 27.7

                                               Sources: United Nations, Department of Economic and Social Affairs, Population Division (2019), World Population Prospects 2019

                           For institutional use only. Do not give, show or quote to any other person. Not to be used with retail investors. Do not duplicate or reproduce.
                                                                                                         © 2020 Matthews International Capital Management, LLC PT001b_2Q20    3
Investing in the Future of Asia - Matthews Asia Dividend Fund
Asia Continues to Lead Global Growth

         COMPOSITION OF GROWTH*                                                         EXPECTED COMPOSITION OF GROWTH*
               2009 – 2019                                                                         2018 – 2024
                    ASIA: 56%                                                                                        ASIA: 59%

               Mid East/                                                                                   Mid East/
               Africa 11%                                                                                 Africa 10%
          Latin                                                                                      Latin
         America                                                                                    America                              China/Hong Kong
                            China/Hong Kong
           5%                                                                                         6%                                       28%
                                  28%
     Europe                                                                               Europe
      15%                                                                                  14%

                                      India 12%                                                      U.S. /
           U.S. /                                                                                                                                  India 15%
          Canada                                                                                    Canada
           13%                                                                                       11%
                                    Japan                                                                                 Rest of             Japan
                        Rest of
                                     3%                                                                                  Asia 14%              2%
                       Asia 13%

                                                           *Based on GDP on Purchasing Power Parity (PPP) basis. There is no guarantee any estimates or projections will be realized
                                                                                             Source: International Monetary Fund; World Economic Outlook Database, April 2019
                              For institutional use only. Do not give, show or quote to any other person. Not to be used with retail investors. Do not duplicate or reproduce.
                                                                                                            © 2020 Matthews International Capital Management, LLC PT001b_2Q20    4
Investing in the Future of Asia - Matthews Asia Dividend Fund
Emerging Markets Are Not Created Equal
Many Asian countries have achieved “Economic Take Off”
Nominal GDP per capita, PPP, relative to the U.S. (2017)
1.2

                                                                                                                                                   U.S.
1.0

                                  TAIWAN

0.8
                                                                                             JAPAN
                    SOUTH KOREA

0.6
                                 MALAYSIA
                                      TURKEY                                                                                                                Asia
0.4                                   CHILE                                                                                                                 Europe
       CHINA                                               ARGENTINA
                       THAILAND                      MEXICO                                                                                                 Latin America
                                               BRAZIL                                                                                                       Middle East/Africa
0.2                                 SOUTH AFRICA
            INDIA                                                                                                                                           North America

0.0
      0.0                  0.2                     0.4                             0.6                              0.8                             1.0                              1.2

                                           Nominal GDP per capita, PPP, relative to the U.S. (1980)

                                                                                                              Note: Data depicted shows 50 most populous countries in IMF database in 1980
                                                                                                                                                                            Sources: IMF; Matthews Asia

                                                For institutional use only. Do not give, show or quote to any other person. Not to be used with retail investors. Do not duplicate or reproduce.
                                                                                                                              © 2020 Matthews International Capital Management, LLC PT001b_2Q20    5
Investing in the Future of Asia - Matthews Asia Dividend Fund
Asia’s Growth Still Has a Long Way To Go…
Asia per capita GDP in historical context to the U.S.
GDP per capita (US$)
70,000
                                                                                                                                                                                       Singapore

60,000

50,000
                                                                                                        Technology and Services                                                    Hong Kong
                                                                                                        Information Technology
                                                                                                        Financials/Insurance
40,000                                                                                                  Travel/Leisure                                                        Japan
                                                       Specialty Brands
                                                       Consumer Discretionary
                   Basic Necessities                   Materials                                                                                                         South Korea
30,000             Energy                              Infrastructure
                   Consumer Staples
                   Utilities                                                                                                                                         Taiwan
20,000

                                                                              Mongolia,                         China
10,000                                                                        Indonesia,                                                 Malaysia
                               Pakistan,                                      Sri Lanka
                               Bangladesh India                    Philippines                                          Thailand
                 Myanmar
     0                                                   Vietnam
         1   1650 1808 1821 1834 1847 1860 1873 1886 1899 1912 1925 1938 1951 1964 1977 1990 2003 2016
                                                                                                  2018
                                                                     U.S.             Asia Countries

                                                                       Sources: Maddison Historic GDP through 1987, International Monetary Fund (MF), World Economic Database October 2019
                                           For institutional use only. Do not give, show or quote to any other person. Not to be used with retail investors. Do not duplicate or reproduce.
                                                                                                                         © 2020 Matthews International Capital Management, LLC PT001b_2Q20    6
Investing in the Future of Asia - Matthews Asia Dividend Fund
Peeling the EM Onion—Asia Stands Out
Long-Term Performance of MSCI Emerging Market Regions as of June 30, 2020

               3 Years                                                  5 Years                                                               10 Years

                                                                                                                          6.2%
                                                   5.2%
     4.4%

                                                                                                  2.0%
                               1.4%
                                                                                                                                                          0.0%

                                                                                                                                                                         0.0%

                                                                                  -2.1%
                     -2.7%                                        -2.9%
                                                                                                                                         -3.5%

            -6.9%

             MSCI Emerging Markets Asia Index                                                          MSCI Emerging Markets Latin America Index
             MSCI Emerging Markets EMEA Index                                                          MSCI Emerging Markets Europe Index

                                                                                                                                                   Note: Returns are annualized and in US$
                                   Past performance is no guarantee of future results. Indexes are unmanaged and it is not possible
                                   to invest directly in an index.
                                                                                                                    Sources: MSCI, FactSet Research Systems, Inc.; data as of June 30, 2020

                                   For institutional use only. Do not give, show or quote to any other person. Not to be used with retail investors. Do not duplicate or reproduce.
                                                                                                                 © 2020 Matthews International Capital Management, LLC PT001b_2Q20    7
Investing in the Future of Asia - Matthews Asia Dividend Fund
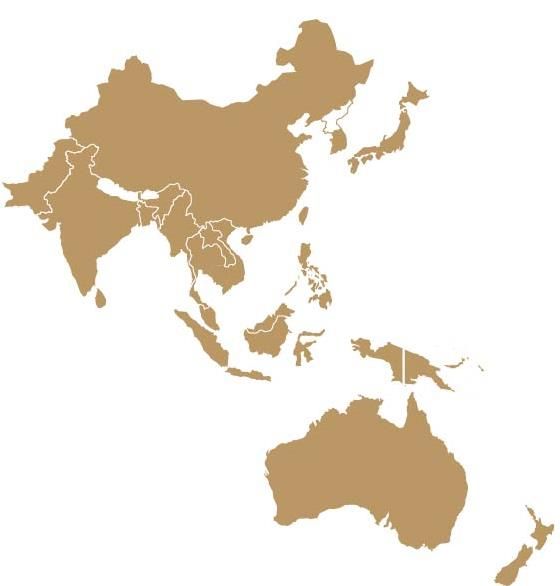
Asia Leads Innovation in EM

% WEIGHT IN INNOVATIVE SECTORS

                    29.3%

                                                                                10.0%

                                                                                                                                                       2.6%

          MSCI AC Asia ex Japan Index                         MSCI EM Latin America Index                                      MSCI Emerging Markets EMEA Index

                                        Matthews Asia considers Innovative sectors to include Technology, Industrials and Health Care. Weights represent the cumulative
                                        % of health care, technology and industrials sectors. Indexes are unmanaged and it is not possible to invest directly in an index.
                                                                                                                         Sources: MSCI, FactSet Research Systems, Inc.; data as of June 30, 2020

                                        For institutional use only. Do not give, show or quote to any other person. Not to be used with retail investors. Do not duplicate or reproduce.
                                                                                                                      © 2020 Matthews International Capital Management, LLC PT001b_2Q20    8
Investing in the Future of Asia - Matthews Asia Dividend Fund
Regional Middle Class Growth
From 2015 – 2030, an estimated 2.3 billion people will enter the middle class—88% from Asia!

NUMBER OF PEOPLE ENTERING THE MIDDLE CLASS (MILLIONS) FROM FY2015

2,500

2,000

1,500

1,000

 500

   0
   2020*                                                                2025*                                                                                           2030*

           Europe    North America              South and Central America                             Middle East and Africa                          Asia Pacific

                                     *Data represented are estimates only. Matthews Asia has not independently verified any of the figures and cannot confirm their accuracy. There is no
                                     guarantee that any estimates or projections will be realized. Middle class is defined as income range of $11 to $110 per person per day in 2011 PPP
                                     terms.
                                          Source: Brookings, Global Economy and Development Working Paper, February 2017, “The Unprecedented Expansion of the Global Middle Class.”

                                     For institutional use only. Do not give, show or quote to any other person. Not to be used with retail investors. Do not duplicate or reproduce.
                                                                                                                   © 2020 Matthews International Capital Management, LLC PT001b_2Q20    9
Current Economic Cycle

 For institutional use only. Do not give, show or quote to any other person. Not to be used with retail investors. Do not duplicate or reproduce.
                                                                               © 2020 Matthews International Capital Management, LLC PT001b_2Q20    10
Asia Earnings Per Share and Economic Growth

US$; Indexed 12/31/2002=1
6.0

5.0

4.0

3.0

2.0

1.0

0.0
  Dec-00      Dec-02        Dec-04      Dec-06               Dec-08               Dec-10               Dec-12               Dec-14                Dec-16               Dec-18 Dec-19

                                 Asia ex Japan EPS                                                         Asia ex Japan Nominal GDP

                                                                                                                                          Note: Universe as defined by FactSet Aggregates
                                                                                                               Source: FactSet Aggregates, MSCI, Matthews Asia; data as of December 31, 2019

                                        For institutional use only. Do not give, show or quote to any other person. Not to be used with retail investors. Do not duplicate or reproduce.
                                                                                                                      © 2020 Matthews International Capital Management, LLC PT001b_2Q20    11
Asian Valuations
Asia ex Japan (June 2001 – June 2020)
Forward P/E Ratio                                                                                                                                                                  P/B Ratio
20                                                                                                                                                                                            4.0
18                                                                                                                                                                                            3.5
16
                                                                                                                                                                                              3.0
14
12                                                                                                                                                                                            2.5
10                                                                                                                                                                                            2.0
 8                                                                                                                                                                                            1.5
 6
                                                                                                                                                                                              1.0
 4        SARS Outbreak                          Global Financial Crisis
 2                                                                                                                                                                                            0.5
 0                                                                                                                                                                                            0.0

       Asia ex Japan Forward Price to Earnings              Asia ex Japan Price to Book                            Linear (Asia ex Japan Forward Price to Earnings)

                                                                                                  Hong                                                                               Asia ex
                                                                               China                                India           Japan             U.S.          Europe
                                                                                                  Kong                                                                               Japan
                                            Forward P/E                        21.0x             13.5x              22.8x           18.1x            24.2x           20.1x            17.1x
                                            Dividend Yield (%)                   1.7               2.8                1.5             2.6              2.0             3.4             2.4
                                                                                                                                  Note: Valuations chart data as of June 30, 2020.
                                            Trailing Dividend yield estimates for 2019 as of June 30, 2020 based on FactSet aggregates as defined by FactSet. The forward price
                                            per earnings ratio (“Forward P/E”) is calculated by dividing the market price per share by the expected earnings per share for 2020.
                                            Forward P/E was calculated as of June 30, 2020 and is forward looking. There is no guarantee that Forward P/E or any estimates or
                                            projections will be realized.
                                                                                                                                                             Source: FactSet Research Systems, Inc.

                                           For institutional use only. Do not give, show or quote to any other person. Not to be used with retail investors. Do not duplicate or reproduce.
                                                                                                                         © 2020 Matthews International Capital Management, LLC PT001b_2Q20    12
Implementing Asia in Portfolios

     For institutional use only. Do not give, show or quote to any other person. Not to be used with retail investors. Do not duplicate or reproduce.
                                                                                   © 2020 Matthews International Capital Management, LLC PT001b_2Q20    13
Most Client Portfolios are Under-Allocated to Asia
Compared to Current Measures

 MSCI ALL COUNTRY WORLD INDEX                              WORLD STOCK MARKET VALUE                                                                              GDP
             ASIA: 19%                                                        ASIA: 32%                                                                     ASIA: 36%

                 Canada
                                                                                           Canada                                                               Canada
                   3% China/HK
                                                                                             3%                                                                   2%
                         5%      India
                                  1%
                                 Japan                                                                                                               U.S.               China/HK             India
                                                                                            China/HK                                                 24%
                                  7%                                   U.S.                                                                                               17%                 3%
                                                                                              14%
                                                                       41%                                      India
     U.S.              Other Asia                                                                                3%                                                                         Japan
     55%                  6%                                                                                                 Mid East/                                                       6%
                                                                                                                Japan
                                                                                                                 7%           Africa                                        Other Asia
                       Europe                                                           Other Asia                              6%                                             10%
                        20%                                                                8%
                                                                                   Europe                                                                       Europe
                                                     Mid                                                                   Latin America
                                                                                    19%                                                                          26%
                                                  East/Africa                                                                    6%
                       Latin                          3%
            Mid East/
                      America                            Latin America
             Africa
                        2%                                     2%
               1%

                                         The MSCI All Country World Index is a free float‐adjusted market capitalization weighted index that is designed to measure the equity market
                                         performance of developed and emerging markets. The MSCI ACWI consists of 46 country indexes comprising 23 developed and 23 emerging market
                                         country indexes. The developed market country indexes included are: Australia, Austria, Belgium, Canada, Denmark, Finland, France, Germany, Hong
                                         Kong, Ireland, Israel, Italy, Japan, Netherlands, New Zealand, Norway, Portugal, Singapore, Spain, Sweden, Switzerland, the United Kingdom and the
                                         United States. The emerging market country indexes included are: Brazil, Chile, China, Colombia, Czech Republic, Egypt, Greece, Hungary, India,
                                         Indonesia, Korea, Malaysia, Mexico, Peru, Philippines, Poland, Qatar, Russia, South Africa, Taiwan, Thailand, Turkey and United Arab Emirates.
                                         Sources: MSCI, International Monetary Fund and World Federation of Exchange Members, IMF GDP data as of 4/30/19; Stock Market Value data as of
                                         04/30/19; MSCI All Country World Index as of 06/30/2019. Figures in US$

                                         For institutional use only. Do not give, show or quote to any other person. Not to be used with retail investors. Do not duplicate or reproduce.
                                                                                                                        © 2020 Matthews International Capital Management, LLC PT001b_2Q20   14
Implementation—Get the Asia Part Right

EM EQUITY REGIONAL WEIGHTS
90%
             79.2%
80%

70%

60%

50%

40%

30%

20%

10%                                       8.0%                                              7.9%
                                                                                                                                 4.9%
                                                                                                           Banker’s Acceptance Bills
0%                                                                                                                      Trust Loans
              Asia                 Latin America                                        ME/Africa                                            Europe

                                                             Note: EM equity refers to the MSCI Emerging Markets Equity Index. All regional weights are shown as of June 30, 2020.
                                                                                                                                     It is not possible to invest directly in an index.
                                                                                                                                     Sources: FactSet Research Systems, Inc., MSCI

                             For institutional use only. Do not give, show or quote to any other person. Not to be used with retail investors. Do not duplicate or reproduce.
                                                                                                           © 2020 Matthews International Capital Management, LLC PT001b_2Q20     15
Two Dominant Spheres of Influence

                                                                            *Source:   United Nations, Department of Economic and Social Affairs, Population Division (2017)

                    For institutional use only. Do not give, show or quote to any other person. Not to be used with retail investors. Do not duplicate or reproduce.
                                                                                                   © 2020 Matthews International Capital Management, LLC PT001b_2Q20   16
Implementation—Consumer Staples has Outperformed more Cyclical Sectors

EM SECTOR PERFORMANCE + VOLATILITY (January 2001– June 2020)

600%
                                                                                                                                     533.3%
500%
                                                                426.3%
400%         355.0%

300%

200%

100%
                           25.9%                                                         27.6%                                                                 17.1%
 0%
                 EM Materials                                            EM Energy                                                     EM Consumer Staples

                                                Return                               Average Volatility

                                   Past performance is no guarantee of future results. Volatility is the standard deviation of returns.
                                   Indexes are unmanaged and it is not possible to invest directly in an index.
                                   Note: Universe represented by the MSCI EM Equity Index. Volatility calculation are using average daily returns from the January 31, 2001 to June 30,
                                   2020 time period. The sector returns shown are cumulative for the dates listed above.
                                                                                                                                           Sources: MSCI, FactSet Research Systems, Inc.

                                   For institutional use only. Do not give, show or quote to any other person. Not to be used with retail investors. Do not duplicate or reproduce.
                                                                                                                 © 2020 Matthews International Capital Management, LLC PT001b_2Q20    17
A Boutique Asset Management Firm
Clients include global institutional investors, family offices, private bank professionals and high net-worth investors

                            150+                                                                                          29+
                           Employees                                                                             Years invested in
                                                                                                                        Asia

                                                                5                                                                                            US$22.0 BN
     46                                                      Locations
  Investment                                                                                                                                                         Assets under
 professionals                                           San Francisco, London,                                                                                      management
                                                         Hong Kong, Shanghai,
                                                               Singapore

                                                                     Note: Regional Strategy AUM $17.2 BN, Single-country AUM $4.8 BN, total firm China exposure $10.1 BN.
                                                                                        Assets under management may rise or fall due to market conditions and other factors.
                                                                                                                            Please visit matthewsasia.com for current AUM.
                                                                                                                                                                     Data as of June 30, 2020

                                    For institutional use only. Do not give, show or quote to any other person. Not to be used with retail investors. Do not duplicate or reproduce.
                                                                                                                  © 2020 Matthews International Capital Management, LLC PT001b_2Q20    18
A History of Resilience and Innovation
                                                                                                                              Firm Milestones                          Product Milestones
1991
G. Paul Matthews                                                                                               2010                                                                               2020
                                                                                                                                                              2016                 Matthews Launches
founds Matthews Asia                                                                              G. Paul Matthews                                       Matthews
                                                                                                     introduces off-                                                              first Global Emerging
                    1995                                                                                                                             Asia becomes                      Markets Strategy
                                                                                                     shore funds for                                       a UNPRI
                    Launch of our first
                                                                                                  non U.S. investors                                      signatory
                    single country strategy,
                    Korea
                                                                       2003                                                            2011                                           2018
                                                                       Launch of our first all                                         Launch of our first                   China reaches
                       1995                                            country Asia Pacific                                            fixed income                                20-year
                       Matthews Asia begins                            strategy, Asia growth                                           strategy, Asia Total                    anniversary
                       following China’s A-                                                                                            Return Bond*
                       Share market

1991 1992 1993 1994 1995 1996 1997 1998 1999 2000 2001 2002 2003 2004 2005 2006 2007 2008 2009 2010 2011 2012 2013 2014 2015 2016 2017 2018 2019 2020

                         Asian Financial Crisis           SARS Outbreak                        Global Financial Crisis                                                 2015
                                                                                                                                                                       Launch of our first
                                                                                                                                                                       ESG strategy, Asia
                                                                                                                                                                       ESG

               1994                    1998                                                                      2008                                         2014
               Launch of our           Launch of our                                                             Launch of our first                          Matthews Asia is
               first regional          first China                                                               completion strategy,                         awarded Qualified
               core strategy,          strategy, China                                                           Asia Small                                   Foreign Institutional
               Pacific Tiger                                                                                     Companies                                    Investor (QFII) license
                                                                                                                                                              to invest in China’s A-
                                                                                                                                                              Share Market

                                                                                                                                                            *Formerly known as Asia Strategic Income
                                                                                                                                                                                             Matthews Asia
                                                   For institutional use only. Do not give, show or quote to any other person. Not to be used with retail investors. Do not duplicate or reproduce.
                                                                                                                                 © 2020 Matthews International Capital Management, LLC PT001b_2Q20    19
Investment Philosophy and Approach
The foundation of Matthews Asia’s investment philosophy is our belief in the long-term economic
growth and development of the countries in Asia

                        ACTIVE                                                 BOTTOM-UP
                      MANAGEMENT                                                RESEARCH

                                                                         RANGE OF ASIA
                      LONG-TERM
                                                                          INVESTMENT
                     FOCUS ON ASIA
                                                                           STRATEGIES

                             For institutional use only. Do not give, show or quote to any other person. Not to be used with retail investors. Do not duplicate or reproduce.
                                                                                                           © 2020 Matthews International Capital Management, LLC PT001b_2Q20    20
Three Pillars of ESG Integration
Committed to incorporating ESG considerations within the very fabric of our investment process

                                                           Long-Term Alpha Generation
       FIRM-WIDE ARCHITECTURE                                       INVESTMENT TEAM                                                    INVESTMENT STRATEGIES
   Alignment of Mission, Culture and Talent              Foundations for ESG Integration:                                        Tailored ESG Integration by Strategy:
   to Support Performance Goals:                                                                                                    Active Security Selection:
                                                           Company Engagement
                                                                                                                                      Fundamental and bottom-up
    Mission: Champion Asia investment                     Emphasis on Governance: Deep                                              investment process
     solutions that build wealth for our global             understanding of corporate governance                                    Materiality: ESG issues are
     clients over the long term                             across markets, strong focus across all                                   considered where material for
    Culture: Diverse teams create better                   strategies                                                                industry or sector
     outcomes for clients. Culture Committee,              Risk Monitoring: ESG and reputational                                    Context Matters: Each strategy
     Diversity & Inclusion Committee and                    risk monitoring via multiple ESG
     Sustainability Committee                                                                                                         draws on ESG inputs in a way that
                                                            research providers, complemented by                                       reflects:
    Commitment: UNPRI Signatory                            our proprietary research
                                                                                                                                      — Objectives and philosophy
                                                           Oversight Structures: Corporate
   COMMUNITY AND ENVIRONMENT                                                                                                          — Availability of ESG data within
                                                            Governance & Stewardship Sub-                                                the strategy’s universe
   ― Matthews Asia Charitable Giving                        Committee
   ― Annual employee volunteer day                                                                                                    — Market cap of securities the
                                                           Industry Collaboration and                                                   strategy invests in
   ― LEED certified HQ since 2014                              Memberships: Asian Corporate                                           — Region or country and stage of
   ― Carbon offsets for firm-wide travel                       Governance Association, International
      emissions                                                                                                                          development
                                                               Corporate Governance Network, CDP

                                             ESG considerations are not a specific requirement for all portfolios at Matthews Asia. ESG factors can vary over different periods and can evolve over
                                             time. They may also be difficult to apply consistently across regions, countries or sectors. There can be no guarantee that a company deemed to meet
                                             ESG standards will actually conduct its affairs in a manner that is less destructive to the environment, or promote positive social and economic
                                             developments. Parameters set by Matthews Asia are subject to change.
                                             For institutional use only. Do not give, show or quote to any other person. Not to be used with retail investors. Do not duplicate or reproduce.
                                                                                                                           © 2020 Matthews International Capital Management, LLC PT001b_2Q20    21
Matthews Asia Investment Team—Highly Collaborative Environment
President and Global Chief Investment Officer
Yu-Ming Wang
Chief Investment Officer                        Research Principal, China                         Open Communication and Exchange of Ideas
Robert J. Horrocks, PhD                         Richard Gao
Portfolio Managers                              Analysts                                           Formal
Winnie Chwang                                   Siddharth Bhargava                                       — Weekly all-hands meeting to discuss macro,
Raymond Z. Deng                                 Kathlyn Collins                                                stock ideas, trip debriefs and ad-hoc topics
Robert Harvey, CFA                              Donghoon Han
Robert J. Horrocks, PhD                                                                                  — Bi-weekly portfolio review meeting to review
                                                Grace Ma
Tiffany Hsiao, CFA                                                                                             trades, macro, risk
                                                Bo Ning
Taizo Ishida                                    Sojung Park                                              — Monthly portfolio compliance meeting to
YuanYuan Ji                                     Yinyan Ibanez, CFA                                             discuss potential compliance matters
Teresa Kong, CFA                                Jeremy Sutch, CFA                                        — Weekly strategy-specific team meeting to
John Paul Lech                                  Haopeng Yang, PhD
Elli Lee
                                                                                                               discuss specific portfolio construction issues
                                                Alex Zarechnak                                                 or individual stocks
S. Joyce Li, CFA                                Hardy Zhu
Kenneth Lowe, CFA                               Julia Zhu                                                — Committee meetings: Trade Management
Andrew Mattock, CFA                                                                                            Oversight, Investment Risk, other
Peeyush Mittal, CFA                             Macro Investment
Michael J. Oh, CFA                              Strategist, China                                  Informal
Satya Patel                                     Andy Rothman
Sharat Shroff, CFA                                                                                       — Sit together—open floor plan
Inbok Song                                                                                               — Daily ad-hoc meetings around trip debriefs,
Shuntaro Takeuchi                               Portfolio Strategists
                                                                                                               fixed income insights, macro strategy, team
Vivek Tanneeru                                  David Dali
                                                                                                               structure and process, new product ideas, etc.
Sherwood Zhang, CFA                             Jeremy Murden, CAIA
Yu Zhang, CFA                                   Tiffany Shi, CFA, CAIA
Wei Zhang
Beini Zhou, CFA

                                                                                                          Note: Traders not referenced above but are included in overall investment team count.

                                         For institutional use only. Do not give, show or quote to any other person. Not to be used with retail investors. Do not duplicate or reproduce.
                                                                                                                       © 2020 Matthews International Capital Management, LLC PT001b_2Q20    22
Senior Investment Team Members—Redefining “Local”
                                                                    Years of Experience
                                                                                                                                        Asia Countries                             Asian Languages &
        Name                  Investment Focus                Asia       Industry        Firm        Home Country
                                                                                                                                           Lived In                                 Dialects Spoken
Yu-Ming Wang           Asia Regional                           12            34
Matthews Asia—“Boots on-the-Ground”
Fundamental, bottom-up investment process

 3,400+ On-Site Meetings in Asia Since 2017*

                                                                                                   Identifying investment opportunities that stand to prosper
                                    Korea
                                                                                                   from Asia’s transformation calls for in-depth, on-the-
                                    180+                Japan
                 China                                                                             ground, bottom-up research and active management:
                                                         610
                 820+
                                       Hong                                                                    Over 2,600 company meetings in 2019
                          Macau
                            8
                                       Kong              Taiwan                                                Half of the meetings are on-site visits in Asia in
            Bangladesh
    India      20+
                  Myanmar Vietnam
                                       630+               140+                                                  locations ranging from Asian financial centers to
     265               2    60+                                                                                 remote island outposts
                                   Philippines
             Thailand                  75+
   Sri Lanka   180+
                        Malaysia
     15+                  45
                                     Indonesia
                                       120+
              Singapore
                 160+

                                            Australia
                                              50+

                                                             New Zealand
                                                                  9

                                                                                                                                                                          *From 1/1/2017 to 12/31/2019

                                                 For institutional use only. Do not give, show or quote to any other person. Not to be used with retail investors. Do not duplicate or reproduce.
                                                                                                                               © 2020 Matthews International Capital Management, LLC PT001b_2Q20    24
Strategies for Investing in Asia
Matthews Asia offers a range of strategies across the risk-reward spectrum

                      GLOBAL EMERGING MARKETS

                      Emerging Markets Equity

                      ASIA FIXED INCOME

                      Asia Total Return Bond*
                      Asia Credit Opportunities

                      ASIA GROWTH AND INCOME                      ASIA GROWTH

                      Asian Growth and Income                       Asia Growth                    China
                      Asia Dividend                                 Pacific Tiger                  India
                      China Dividend                                Asia ESG                       Japan
                                                                     Emerging Asia                  Korea
                                                                     Asia Innovators

                      ASIA VALUE                                  ASIA SMALL COMPANY

                      Asia Value                                Asia Small Companies
                                                                 China Small Companies

                                                                                                                                              *Formerly known as Asia Strategic Income

                                For institutional use only. Do not give, show or quote to any other person. Not to be used with retail investors. Do not duplicate or reproduce.
                                                                                                              © 2020 Matthews International Capital Management, LLC PT001b_2Q20    25
Fund Profile | Matthews Asia Dividend Fund

 FUND FACTS                        Investment Objective
 Inception Date                    Total return with an emphasis on providing current income.
 Investor Class:        10/31/06
 Institutional Class:   10/29/10   Approach
 Ticker                            Invest in companies that offer attractive dividend payments relative to their
 Investor Class:          MAPIX    current share price and/or have the propensity to grow their dividends over
 Institutional Class:     MIPIX    a three-year period.
 Cap Range
 All Cap

 Number of Holdings
 50 to 80                          Lead Manager                                                                     Co-Managers
 Turnover Range
 20% to 40%

 Benchmark
 MSCI All Country Asia Pacific
 Index

                                   YU ZHANG, CFA                    ROBERT HORROCKS, PhD                        SHERWOOD ZHANG, CFA                              S. JOYCE LI, CFA

                                   There is no guarantee that the Matthews Asia Dividend Fund or the companies in its portfolio will pay or continue to pay dividends.
                                   This presentation must be preceded or accompanied by a Matthews Asia Funds prospectus.
                                    For institutional use only. Do not give, show or quote to any other person. Not to be used with retail investors. Do not duplicate or reproduce.
                                                                                                                  © 2020 Matthews International Capital Management, LLC PT001b_2Q20    26
Dividends Contribute to Total Return
Breakdown of total returns (MSCI Indices, 2000 – 2020)

400%

350%

300%

250%

200%

150%

100%

 50%

  0%

 -50%

-100%
          China    Asia ex Japan            Australia                      Europe                         USA                        Japan                         U.K.

                                             Dividend Return                               Price Return

                                                                                                                                                                      US$ returns.
                                                                                                                                    Time period: December 31, 1999 – June 30, 2020
                                   Past performance is no guarantee of future results. Indexes are unmanaged and it is not possible to
                                   invest directly in an index.
                                                                                                                                                          Source: FactSet Research Systems

                                   For institutional use only. Do not give, show or quote to any other person. Not to be used with retail investors. Do not duplicate or reproduce.
                                                                                                                 © 2020 Matthews International Capital Management, LLC PT001b_2Q20    27
Dividends—How Asia Compares to Europe and the U.S.
                                                                                                                                                                        Asia

                                                                                                                                                                        Europe

                                                                                                                                                                        U.S.
                                                                                                                                        8.4%
     $629
                                                                            3.4%

                                                                                                                                                                       6.4%
                          $452                               2.6%
                                                                                                                                                        5.6%
                $366
                                                                                            1.9%

   Size of Dividend Pool (Bil US$)*                                Dividend Yield**                                               Dividend Growth (2002-2019)***

                                      *2020 dividends by index members as of June 30, 2020; Europe (Bloomberg European 500 Index), Asia Pacific (MSCI AC Asia Pacific Index), U.S. (S&P
                                      500 Index).
                                      **Trailing Dividend yield estimates for 2020 as of 6/30/20 based on FactSet aggregates.
                                       *** Compound annual growth rate (CAGR) based on index constituents of Europe (Bloomberg European 500 Index), Asia Pacific (MSCI AC Asia Pacific
                                      Index), U.S. (S&P 500 Index) as of 12/31/02, excluding those that are no longer in existence as of fiscal year 2019. Sources: FactSet Research Systems,
                                      MSCI, S&P, Bloomberg

                                      Past performance is no guarantee of future results. Indexes are unmanaged and it is not possible
                                      to invest directly in an index.
                                                                                                                                   Sources: FactSet Research Systems, MSCI, S&P, Bloomberg

                                      For institutional use only. Do not give, show or quote to any other person. Not to be used with retail investors. Do not duplicate or reproduce.
                                                                                                                    © 2020 Matthews International Capital Management, LLC PT001b_2Q20    28
Investment Returns | Matthews Asia Dividend Fund
As of June 30, 2020
                                                                                     AVERAGE ANNUAL TOTAL RETURNS

                                                                                                                                                                Since Inception
    3 Months             1 Year                        3 Years                              5 Years                              10 Years                        (10/31/2006)

  20.37%

           15.99%

                                                                                                                                                                 7.98%
                                                                                                                            6.95%         6.30%
                                                                                       4.09%         4.33%                                                                     4.03%
                                                                3.50%
                      2.31%                       2.26%
                              1.35%

                    Matthews Asia Dividend Fund (Investor Class)                                        MSCI All Country Asia Pacific Index

                       Assumes reinvestment of all dividends and/or distributions before taxes. All performance quoted
                       represents past performance and is no guarantee of future results. Investment return and principal value will
                       fluctuate with market conditions so that when redeemed, shares may be worth more or less than their original
                       cost. Current performance may be lower or higher than the return figures quoted. Returns would have been
                       lower if certain of the Fund’s fees and expenses had not been waived. For the Fund’s most recent month-end
                       performance visit matthewsasia.com. Indexes are unmanaged and it is not possible to invest directly in an index.
                       Please refer to disclosures for index definitions. Due to current market volatility associated with the COVID-19
                       pandemic, funds may experience significant negative short-term performance.
                                                                                                                                     Index since inception value calculated from 10/31/2006
                                                                                                                        Sources: BNY Mellon Investment Servicing, Bloomberg, Matthews Asia

                                      For institutional use only. Do not give, show or quote to any other person. Not to be used with retail investors. Do not duplicate or reproduce.
                                                                                                                    © 2020 Matthews International Capital Management, LLC PT001b_2Q20    29
Matthews Asia Dividend Fund vs. MSCI AC Asia Pacific Index Return Breakout
October 31, 2006 through June 30, 2020

Cumulative Return
250

                                                                                                                                                 198.4
200

150                 138.7
                                                                           110.3
100
                                                                                                                                                                      72.5
                                 52.5
 50
                                                                                                 19.9

  0
                     Income Return                                             Capital Return                                   Total Return Including Fees and Expense
                                                                                                                                                Accruals

                                  Matthews Asia Dividend Fund (Investor Class)                            MSCI All Country Asia Pacific Index

                            Past performance is no guarantee of future results. Returns are calculated with a holdings-based methodology
                            using software supplied by FactSet Research Systems, Inc. Income Return and Capital Return are for positions only
                            and exclude fees and expense accruals. Returns will not equate to the standard, published performance for the
                            Fund. The characteristics shown may not be representative of the Fund's current or future investments. Indexes are
                            unmanaged and it is not possible to invest directly in an index. Please refer to the disclosures for index definition.
                                                                                                                                                             Source: FactSet Research Systems, Inc.

                                            For institutional use only. Do not give, show or quote to any other person. Not to be used with retail investors. Do not duplicate or reproduce.
                                                                                                                          © 2020 Matthews International Capital Management, LLC PT001b_2Q20    30
Matthews Asia Dividend Fund Market Cap Breakout
October 31, 2006 through June 30, 2020
 Percentage of Return
100.00%                                                                                                                                               Mega Cap (over $25B)
                        14.01%                              14.45%                                              14.20%
 90.00%                                                                                                                                               Large Cap ($10B-$25B)
                                                             3.34%                                               7.55%
 80.00%                 10.89%                                                                                                                        Mid Cap ($3B-$10B)
                                                            21.26%                                                                                    Small Cap (under $3B)
 70.00%                                                                                                         20.53%
                        19.94%                                                                                                                        Cash & Other
 60.00%

 50.00%

 40.00%

 30.00%                 46.07%                              59.87%                                              52.19%

 20.00%

 10.00%
                        9.09%                                                                                                      5.54%
  0.00%                                                                          1.08%

-10.00%
                   Income Return                       Capital Return                              Income + Capital Return

                                                                                                                            *excluding fees and expense accruals
                                   Cash & Other may include cash, positions without beginning of period market values, offsets, warrants, and rights.
                                   Past performance is no guarantee of future results. Returns are calculated with a holdings-based methodology using software
                                   supplied by FactSet Research Systems, Inc. Returns will not equate to the standard, published performance for the Fund. The
                                   characteristics shown may not be representative of the Fund's current or future investments.
                                                                                                                                                           Source: FactSet Research Systems, Inc

                                        For institutional use only. Do not give, show or quote to any other person. Not to be used with retail investors. Do not duplicate or reproduce.
                                                                                                                      © 2020 Matthews International Capital Management, LLC PT001b_2Q20    31
Historical Results | Matthews Asia Dividend Fund
Attempts to offer more stable means to Asia’s growth while providing some downside protection

UPSIDE/DOWNSIDE CAPTURE OCTOBER 31, 2006 TO JUNE 30, 2020

            Up Markets                                       Down Markets                                                            All Markets

         3.20%     3.48%

 90.7%                                                                                                                         0.73%               0.45%

                                     76.9%

                                                          -2.84%
                                                                              -3.93%

                         Matthews Asia Dividend Fund (Investor Class)                                   MSCI AC Asia Pacific Index

                   The up and down capture is a measure of how well a manager was able to replicate or improve on phases of positive
                   average monthly benchmark returns, and how adversely the manager was affected by phases of negative average
                   monthly benchmark returns. Inception to date, the Fund had a 90.7% upside capture and a 76.9% downside capture.
                   Returns reflect performance in the Investor Share Class. Assumes reinvestment of all dividends and/or distributions
                   before taxes. All performance quoted represents past performance and is no guarantee of future results.
                   Investment return and principal value will fluctuate with market conditions so that when redeemed, shares may be
                   worth more or less than their original cost. Current performance may be lower or higher than the return figures
                   quoted. Returns would have been lower if certain of the Fund’s fees and expenses had not been waived. For the
                   Fund’s most recent month-end performance visit matthewsasia.com. Indexes are unmanaged and it is not possible
                   to invest directly in an index. Please refer to the disclosure for index definitions.
                                                                                                                                                Sources: Morningstar, Zephyr StyleADVISOR

                                    For institutional use only. Do not give, show or quote to any other person. Not to be used with retail investors. Do not duplicate or reproduce.
                                                                                                                  © 2020 Matthews International Capital Management, LLC PT001b_2Q20    32
Case Study | Ascendas India Trust
Steady dividend payer

CASH FLOW GENERATION
                                                                                                                    ABILITY
US$ (MN)                                                                     SGD Cents
100                        5-yr dividend CAGR*: 4%                                 6.5                              — Organic growth from occupancy pick-up and
                                                                                                                      positive rent revision
80                                                                                      6.3
                                                                                                                    — Accretive acquisition pipeline
60                                                                                      6.0
                                                                                                                    — Cash cow business model
40                                                                                      5.8
20                                                                                      5.5
                                                                                                                    WILLINGNESS

 0                                                                                      5.3
                                                                                                                    — REITs are required to pay out at least 90%
                                                                                                                      rental income in exchange for favorable tax
-20                                                                                     5.0                           shield
-40                                                                                     4.8                         DIVIDEND GROWTH
-60                                                                                     4.5                         — Dividends per share grew 4% CAGR from
      FY 2013    FY 2014     FY 2015    FY2016        FY2017          FY2018                                          2013 – 2018
           Capital Expenditures                    Cash From Operations                                             — Trailing 12-month dividend yield is 5%**
           Free Cash Flow                          DPS (SGD Cents)

                                                                                                                                         *CAGR = Compound Annual Growth Rate
                                                                                                                 **Trailing Dividend Yield figure from Bloomberg as of 1/15/2020
                                            There is no guarantee that a company will maintain or grow its dividend pay-out ratio, or pay dividends. The information in this case
                                            study is presented solely to illustrate Matthews Asia’s investment process. It should not be considered a recommendation of the
                                            security discussed (the “Security”), nor a representation as to whether the Security is currently held by the Fund. The results of any
                                            possible investment in the Security are not representative of the results of other investments by the Fund. Performance of the Fund
                                            and a list of current holdings as of a recent date are available at matthewsasia.com. Past performance is no guarantee of future
                                            results. The statements above are based on the beliefs and assumptions of our portfolio management team and on the information
                                            currently available to our team at the time of such statements. Although we believe that the expectations reflected in these
                                            statements are reasonable, we can give no assurance that these expectations will prove to be correct.
                                                                                                                                                                Sources: Bloomberg, Matthews Asia

                                            For institutional use only. Do not give, show or quote to any other person. Not to be used with retail investors. Do not duplicate or reproduce.
                                                                                                                          © 2020 Matthews International Capital Management, LLC PT001b_2Q20    33
Case Study | Anritsu Corp
Dividend Grower Riding the 5G Tide

CASH FLOW GENERATION                                                                                              ABILITY
Japanese Yen (BN)                                                              DPS Yen                            — Leading player in telecom testing equipment
20                                                                                  35                              globally

15                                                                                     30                         — Strong earnings upcycle takes hold ahead of
                                                                                                                    major network technology generation shifts
                                                                                       25
10                                                                                                                — Cash cow business model with high pricing
                                                                                       20                           power
 5
                                                                                       15                         WILLINGNESS
 0
                                                                                       10                         -       Throughout business cycles the company pays
 -5                                                                                                                       solid dividend.
                                                                                       5
                                                                                                                  -       The company raises payout in earnings down
-10                                                                                    0                                  cycle to mitigate impact on dividends
       FY 2016      FY 2017     FY 2018        FY 2019             FY 2020
                                                                                                                  DIVIDEND GROWTH
         Capital Expenditures                   Cash From Operations                                              — Dividends per share grew 5% CAGR over the
                                                                                                                    past 5 years and 27% CAGR over the past 3
         Free Cash Flow                         DPS (Yen)
                                                                                                                    years.
                                                                                                                  — Dividend yield is 1.3%**
                                                                                                                                       *CAGR = Compound Annual Growth Rate
                                                                                                                           **Dividend Yield figure from Bloomberg as 6/1/2020
                                          There is no guarantee that a company will maintain or grow its dividend pay-out ratio, or pay dividends. The information in this case
                                          study is presented solely to illustrate Matthews Asia’s investment process. It should not be considered a recommendation of the
                                          security discussed (the “Security”), nor a representation as to whether the Security is currently held by the Fund. The results of any
                                          possible investment in the Security are not representative of the results of other investments by the Fund. Performance of the Fund
                                          and a list of current holdings as of a recent date are available at matthewsasia.com. Past performance is no guarantee of future
                                          results. The statements above are based on the beliefs and assumptions of our portfolio management team and on the information
                                          currently available to our team at the time of such statements. Although we believe that the expectations reflected in these
                                          statements are reasonable, we can give no assurance that these expectations will prove to be correct.
                                                                                                                                                              Sources: Bloomberg, Matthews Asia

                                          For institutional use only. Do not give, show or quote to any other person. Not to be used with retail investors. Do not duplicate or reproduce.
                                                                                                                        © 2020 Matthews International Capital Management, LLC PT001b_2Q20    34
Matthews Asia Dividend Fund Balances Dividend Yield and Growth

DIVIDEND YIELD VS. DIVIDEND GROWTH
3-Yr Dividend Growth                                                                                                                                     PAYOUT RATIO
45%
                                                                                                                                                         Red              80+%
40%                                                                                                                                                      Blue             50-80%
35%                                                                                                                                                      Green            30-50%
30%                                                                                                                                                      Yellow           0-30%
25%
20%
15%
10%
 5%
 0%
       0%          1%            2%                   3%                    4%                     5%                     6%                     7%                    8%                       9%
-5%
-10%
                                                                             Dividend Yield (%)

                        Bubble sizes are in proportion to the portfolio weight of individual positions as of June 30, 2020. Dividend yield and dividend growth data depicted are for
                        securities held in the Matthews Asia Dividend Fund for which all data metrics are available. This should not be relied upon as a complete listing of all
                        securities held in the portfolio. Each point represents a plotting of the portfolio company’s trailing dividend yield as of June 30, 2020 and its estimated 3-
                        year annual dividend growth rate. Color depiction represents a portfolio company’s dividend payout ratio based on company dividend policy, if available.
                        Otherwise 5-year average payout ratio is utilized (or longest available for companies with less than 5-year history) adjusted to exclude extraordinary or
                        temporary distributions. Estimated 3-year dividend growth was calculated as of June 30, 2020 using data from FactSet Research Systems, Inc. and
                        Bloomberg and is forward looking. There is no guarantee that future dividend growth will be achieved. There is no guarantee that the composition of the
                        portfolio will remain unchanged or that the companies in the portfolio will achieve their forecasted dividend growth rate, maintain or grow their dividend
                        pay-out ratio, or pay dividends. Past yields are no guarantee of future yields.
                                                                                                                                 Sources: FactSet Research Systems, Inc., Bloomberg, Matthews Asia

                                             For institutional use only. Do not give, show or quote to any other person. Not to be used with retail investors. Do not duplicate or reproduce.
                                                                                                                           © 2020 Matthews International Capital Management, LLC PT001b_2Q20    35
Competitive Returns | Matthews Asia Dividend Fund
As of June 30, 2020

                                                                                          AVERAGE ANNUAL TOTAL RETURNS
                                     Year to Date            1 Year               3 Years               5 Years              10 Years          Since Inception Inception Date

 Investor Class (MAPIX)                 -2.62%              2.31%                 2.26%                 4.09%                 6.95%                  7.98%                10/31/06

 Institutional Class (MIPIX)            -2.57%              2.48%                 2.39%                 4.21%                    n.a                 5.89%                10/29/10

 MSCI All Country Asia Pacific                                                                                                                                1
                                        -6.29%              1.35%                 3.50%                 4.33%                 6.30%                 4.03%
 Index

 Lipper International Equity                                                                                                                                  1
                                       -14.50%              -8.22%                -1.42%                0.43%                 4.15%                 1.87%
 Income Funds Category Average

                                                                                                                                                                                1   As of 10/31/2006
                   Assumes reinvestment of all dividends and/or distributions before taxes. All performance quoted represents past
                   performance and is no guarantee of future results. Investment return and principal value will fluctuate with market
                   conditions so that when redeemed, shares may be worth more or less than their original cost. Current performance may be
                   lower or higher than the return figures quoted. Returns would have been lower if certain of the Fund’s fees and expenses
                   had not been waived. For the Fund’s most recent month-end performance visit matthewsasia.com. Indexes are unmanaged
                   and it is not possible to invest directly in an index. Please refer to disclosures for index definition. Due to current market
                   volatility associated with the COVID-19 pandemic, funds may experience significant negative short-term performance.
                                                                                                 The Lipper Category Average does not reflect sales charges and is based on total return,
                                                                                                            including reinvestment of dividends and capital gains, for the stated periods.
                                                                                                                              Sources: BNY Mellon Investment Servicing, Bloomberg, Matthews Asia
                                            For institutional use only. Do not give, show or quote to any other person. Not to be used with retail investors. Do not duplicate or reproduce.
                                                                                                                          © 2020 Matthews International Capital Management, LLC PT001b_2Q20    36
Portfolio Characteristics | Matthews Asia Dividend Fund
As of June 30, 2020

MARKET CAP EXPOSURE (%)
                               Fund    Benchmark               Difference
 Mega Cap (over $25B)          31.6              55.2                  -23.6
 Large Cap ($10B-$25B)         15.8              21.7                    -5.9
 Mid Cap ($3B-$10B)            29.8              20.8                     9.0
 Small Cap (under $3B)         22.7                2.3                  20.4
 Cash and Other Assets, Less                                                                                                             Benchmark: MSCI All Country Asia Pacific Index
                                0.1                0.0                    0.1
 Liabilities                                                                                  *The P/E Ratio is the share price of a stock as of the report date, divided by the
                                                                                              forecasted earnings per share for a 12-month period (FY1) and 24 month period
PORTFOLIO CHARACTERISTICS                                                                     (FY2). For the Fund, this is the weighted harmonic average estimated P/E ratio of all
                                                                                              the underlying stocks in the Fund, excluding negative earners. There is no guarantee
                                                                        Fund                  that the composition of the Fund will remain unchanged, or that forecasted earnings
                                                                                              of a stock will be realized. Information provided is for illustrative purposes only.
 Assets                                                        $3.8 billion                   **The 30-Day Yield represents net investment income earned by the Fund over the
                                                                                              30-day period ended June 30, 2020, expressed as an annual percentage rate based on
 Weighted Average Market Cap                                 $45.5 billion                    the Fund’s share price at the end of the 30-day period. The 30-Day Yield should be
                                                                                              regarded as an estimate of the Fund’s rate of investment income, and it may not
 P/E using FY1 Estimates*                                               21.8x                 equal the Fund’s actual income distribution rate. Information provided is unaudited.
                                                                                              Past yields are no guarantee of future yields. Source: BNY Mellon Investment
 P/E using FY2 Estimates*                                               17.0x                 Servicing

                                             1.18% Investor Class,                            ***The Dividend Yield (trailing) for the portfolio is the weighted average sum of
                                                                                              the dividends paid by each equity security held by the Fund over the last 12 months
                                 (1.17% excluding expense waiver)
 30-Day Yield**                                                                               divided by the current price as of report date. The annualized dividend yield for the
                                                1.27% Inst’l Class,                           Fund is for the equity-only portion of the portfolio. Please note that this is based on
                                 (1.26% excluding expense waiver)                             gross equity portfolio holdings and does not reflect the actual yield an investor in the
                                                                                              Fund would receive. Past yields are no guarantee of future yields.
 Dividend Yield***                                                     2.35%
                                                                                The information contained in this presentation does not, in any way, constitute investment advice.
                                                                                            Portfolio characteristics for the Fund may vary from time to time from what is shown.
                                                                                                                            Sources: FactSet Research Systems, Inc., Bloomberg, Matthews Asia
                                       For institutional use only. Do not give, show or quote to any other person. Not to be used with retail investors. Do not duplicate or reproduce.
                                                                                                                     © 2020 Matthews International Capital Management, LLC PT001b_2Q20    37
Portfolio Characteristics | Matthews Asia Dividend Fund
As of June 30, 2020
COUNTRY ALLOCATION (%)                                                           SECTOR ALLOCATION (%)
                          Fund    Benchmark      Difference                                                                         Fund            Benchmark                 Difference
 China/Hong Kong           35.5         30.0                  5.5
                                                                                   Consumer Discretionary                            29.2                      16.5                    12.7
 Japan                     31.9         35.3                 -3.4
                                                                                   Consumer Staples                                  13.4                        6.7                       6.7
 South Korea                8.6          7.1                  1.5
                                                                                   Information Technology                            13.0                      15.0                        -2.0
 Singapore                  7.5          1.5                  6.0
 Australia                  6.2          9.3                 -3.1                  Industrials                                       11.8                      10.9                        0.9

 Taiwan                     3.7          7.5                 -3.8                  Communication Services                            11.5                      11.2                        0.3
 Philippines                2.0          0.5                  1.5                  Real Estate                                         8.8                       4.6                       4.2
 India                      1.6          4.9                 -3.3                  Health Care                                         6.6                       8.1                       -1.5
 Thailand                   1.6          1.4                  0.2
                                                                                   Materials                                           3.5                       5.6                       -2.1
 Bangladesh                 1.2          0.0                  1.2
                                                                                   Financials                                          2.0                     16.8                   -14.8
 Malaysia                   0.0          1.1                 -1.1
                                                                                   Energy                                              0.0                       2.5                       -2.5
 Indonesia                  0.0          0.9                 -0.9
 New Zealand                0.0          0.5                 -0.5                  Utilities                                           0.0                       2.2                       -2.2
 Cash and Other Assets,                                                            Cash and Other Assets,
                            0.1          0.0                  0.1                                                                      0.1                       0.0                       0.1
 Less Liabilities                                                                  Less Liabilities

                                                                                                                                                Benchmark: MSCI All Country Asia Pacific Index

                                                                                             The information contained in this presentation does not, in any way, constitute investment advice.
                                                                                                         Portfolio characteristics for the Fund may vary from time to time from what is shown.
                                                                                                                                         Sources: FactSet Research Systems, Inc., Matthews Asia
                                        For institutional use only. Do not give, show or quote to any other person. Not to be used with retail investors. Do not duplicate or reproduce.
                                                                                                                      © 2020 Matthews International Capital Management, LLC PT001b_2Q20      38
Top Ten Holdings | Matthews Asia Dividend Fund
As of June 30, 2020

 Company                                                                   Sector                                                Country                                        %
Minth Group, Ltd.                                                          Consumer Discretionary                                China/Hong Kong                               4.9
China Tourism Group Duty Free Corp., Ltd.                                  Consumer Discretionary                                China/Hong Kong                               3.8
Anritsu Corp.                                                              Information Technology                                Japan                                         3.8
Chongqing Brewery Co., Ltd.                                                Consumer Staples                                      China/Hong Kong                               3.3
Taiwan Semiconductor Manufacturing Co., Ltd.                               Information Technology                                Taiwan                                        3.2
Breville Group, Ltd.                                                       Consumer Discretionary                                Australia                                     3.1
Hoya Corp.                                                                 Health Care                                           Japan                                         3.0
LG Chem, Ltd., Pfd.                                                        Materials                                             South Korea                                   3.0
MISUMI Group, Inc.                                                         Industrials                                           Japan                                         3.0
Shenzhou International Group Holdings, Ltd.                                Consumer Discretionary                                China/Hong Kong                               2.7
Total for Top 10                                                                                                                                                            33.8%

                                       This information does not, in any way, constitute investment advice. Portfolio holdings may vary from time to time from what is
                                       shown. It should not be assumed that any investment in the securities listed was or will be profitable. The information does not
                                       constitute a recommendation to buy or sell any securities mentioned.
                                                                                                                                     Sources: BNY Mellon Investment Servicing, Matthews Asia
                                       For institutional use only. Do not give, show or quote to any other person. Not to be used with retail investors. Do not duplicate or reproduce.
                                                                                                                     © 2020 Matthews International Capital Management, LLC PT001b_2Q20    39
Attribution by Country | Matthews Asia Dividend Fund
Second Quarter 2020
Published Portfolio Return1                                        20.37%                                                                                                               Selection +
                                                                                                                      Average                  Average               Allocation                                 Total
                                                                                                                                                                                        Interaction
Published Benchmark Return                                         15.99%                                         Portfolio Wt            Benchmark Wt                   Effect                                Effect
                                                                                                                                                                                             Effect
Published Relative Return2                                          4.38%           Total                                  100.00                     100.00                 -1.87                6.41               4.53

Attributable Portfolio Return                                      20.53%           China/Hong Kong                          35.31                      29.35                -0.12                5.46               5.33
                                                                                    South Korea                               8.32                       7.08                 0.05                0.86               0.91
Attributable Relative Return                                        4.53%
                                                                                    Japan                                    32.73                      36.37                 0.23                0.07               0.29
1   Published portfolio return represents that of the Investor
    Share Class.                                                                    Vietnam                                   0.16                       0.00                 0.05                0.00               0.05

2   The published relative return is calculated as the difference                   Malaysia                                  0.00                       1.10                 0.03                0.00               0.03
    of the published benchmark return from the published                            Pakistan                                  0.00                       0.01                 0.00                0.00               0.00
    portfolio return.
                                                                                    New Zealand                               0.00                       0.44                -0.05                0.00           -0.05
                                                                                    Thailand                                  1.71                       1.40                 0.05               -0.14           -0.09
                                                                                    Philippines                               2.28                       0.50                 0.08               -0.21           -0.13
                                                                                    India                                     1.64                       4.75                -0.15                0.02           -0.13
Benchmark: MSCI All Country Asia Pacific Index
The attribution report shows the extent to which the portfolio manager’s            Indonesia                                 0.53                       0.90                -0.11               -0.07           -0.18
strategies affect a fund’s performance relative to the performance of the
fund’s benchmark index. Allocation Effect shows the effect on fund
                                                                                    Bangladesh                                1.20                       0.00                -0.19                0.00           -0.19
performance of either over- or under-weighting a market (a sector, country          Singapore                                 7.17                       1.65                -0.37                0.17           -0.20
or region, depending on the type of fund) relative to its benchmark.
Selection + Interaction Effect shows how the decision to hold individual            Taiwan                                    4.29                       7.45                -0.14               -0.14           -0.28
securities within the particular sector, country or region performed relative
to the benchmark.                                                                   Australia                                 3.82                       9.00                -0.72                0.40           -0.33
Attributed performance is calculated using FactSet Research Systems, Inc.           Cash                                      0.88                       0.00                -0.18                0.00           -0.18
The methodology of calculation is different from the published NAV and will
not match performance based on the published NAV. Performance shown is              Unassigned                               -0.06                       0.00                -0.31                0.00           -0.31
historical and no guarantee of future results. Current performance may be
lower or higher. Returns current to the most recent month-end are
available at matthewsasia.com. Investment returns and principal value will
fluctuate so that when redeemed, shares may be worth more or less than
their original cost. Benchmark performance is unaudited.
Please refer to the disclosures for index definition. Unassigned may include
fees, expense accruals, offsets, warrants and rights.

                                                                  For institutional use only. Do not give, show or quote to any other person. Not to be used with retail investors. Do not duplicate or reproduce.
                                                                                                                                                © 2020 Matthews International Capital Management, LLC PT001b_2Q20      40
Attribution by Sector | Matthews Asia Dividend Fund
Second Quarter 2020
Published Portfolio Return1                              20.37%                                                                                                                Selection +
                                                                                                             Average                  Average               Allocation                                 Total
                                                                                                                                                                               Interaction
Published Benchmark Return                               15.99%                                          Portfolio Wt            Benchmark Wt                   Effect                                Effect
                                                                                                                                                                                    Effect
Published Relative Return2                                4.38%
                                                                           Total                                 100.00                     100.00                 -0.52                5.05            4.53
Attributable Portfolio Return                            20.53%
                                                                           Consumer
                                                                                                                   27.66                      15.91                 0.35                3.58            3.93
Attributable Relative Return                              4.53%            Discretionary
1   Published portfolio return represents that of the Investor             Financials                                3.26                     17.36                 0.81                0.21            1.02
    Share Class.
                                                                           Materials                                 2.95                       5.53               -0.21                1.00            0.80
2   The published relative return is calculated as the difference
    of the published benchmark return from the published                   Real Estate                               8.63                       4.84               -0.36                0.84            0.48
    portfolio return.
                                                                           Consumer Staples                        14.76                        6.75               -0.56                1.00            0.44
Benchmark: MSCI All Country Asia Pacific Index
                                                                           Information
The attribution report shows the extent to which the portfolio
                                                                                                                   12.52                      14.62                -0.05                0.37            0.31
                                                                           Technology
manager’s strategies affect a fund’s performance relative to the
performance of the fund’s benchmark index. Allocation Effect               Utilities                                 0.04                       2.48                0.32               -0.01            0.31
shows the effect on fund performance of either over- or under-
weighting a market (a sector, country or region, depending on the          Industrials                             10.44                      11.25                -0.03               -0.04           -0.07
type of fund) relative to its benchmark. Selection + Interaction
Effect shows how the decision to hold individual securities within         Energy                                    0.50                       2.51               -0.12               -0.19           -0.31
the particular sector, country or region performed relative to the
benchmark.                                                                 Health Care                               6.41                       7.82               -0.10               -0.35           -0.45
Attributed performance is calculated using FactSet Research                Communication
Systems, Inc. The methodology of calculation is different from the                                                 12.01                      10.93                -0.07               -1.35           -1.43
                                                                           Services
published NAV and will not match performance based on the
published NAV. Performance shown is historical and no guarantee            Cash                                      0.88                       0.00               -0.18                0.00           -0.18
of future results. Current performance may be lower or higher.
Returns current to the most recent month-end are available at              Unassigned                               -0.06                       0.00               -0.31                0.00           -0.31
matthewsasia.com. Investment returns and principal value will
fluctuate so that when redeemed, shares may be worth more or
less than their original cost. Benchmark performance is unaudited.
Please refer to the disclosures for index definition. Unassigned
may include fees, expense accruals, offsets, warrants and rights.

                                                         For institutional use only. Do not give, show or quote to any other person. Not to be used with retail investors. Do not duplicate or reproduce.
                                                                                                                                       © 2020 Matthews International Capital Management, LLC PT001b_2Q20    41
Attribution by Country | Matthews Asia Dividend Fund
One Year June 30, 2019 to June 30, 2020
 Published Portfolio Return1                                    2.31%                                               Average                                                        Selection +
                                                                                                                    Portfolio             Average              Allocation          Interaction              Total
 Published Benchmark Return                                     1.35%                                                     Wt         Benchmark Wt                  Effect                Effect            Effect
 Published Relative Return2                                     0.96%            Total Portfolio                       100.00                    100.00                -2.13                 3.40            1.27
Attributable Portfolio Return                                   2.62%            Australia                                2.28                     10.06                1.21                 0.92                2.13

Attributable Relative Return                                    1.27%            China/Hong Kong                        38.02                      26.84                0.27                 0.84                1.11
                                                                                 Japan                                  27.19                      36.89               -0.36                 0.87                0.51
 1   Published portfolio return represents that of the Investor Share            Singapore                                7.36                      1.87               -1.18                 1.51                0.33
     Class.
                                                                                 India                                    1.99                      5.16                0.51                -0.24                0.27
 2   The published relative return is calculated as the difference of
     the published benchmark return from the published portfolio                 Malaysia                                 0.00                      1.16                0.16                 0.00                0.16
     return.
                                                                                 Philippines                              1.79                      0.59               -0.21                 0.33                0.12
                                                                                 Thailand                                 1.91                      1.57               -0.05                 0.12                0.07
Benchmark: MSCI All Country Asia Pacific Index
                                                                                 Taiwan                                   5.26                      7.15               -0.28                 0.34                0.06
The attribution report shows the extent to which the portfolio
manager’s strategies affect a fund’s performance relative to the                 Pakistan                                 0.00                      0.02                0.00                 0.00                0.00
performance of the fund’s benchmark index. Allocation Effect
shows the effect on fund performance of either over- or under-                   Vietnam                                  0.71                      0.00               -0.08                 0.00           -0.08
weighting a market (a sector, country or region, depending on the
type of fund) relative to its benchmark. Selection + Interaction                 New Zealand                              0.00                      0.41               -0.08                 0.00           -0.08
Effect shows how the decision to hold individual securities within               Indonesia                                1.15                      1.13               -0.12                -0.31           -0.42
the particular sector, country or region performed relative to the
benchmark.                                                                       Bangladesh                               1.12                      0.00               -0.49                 0.00           -0.49
Attributed performance is calculated using FactSet Research
Systems, Inc. The methodology of calculation is different from the               South Korea                              9.88                      7.16               -0.09                -0.98           -1.07
published NAV and will not match performance based on the
published NAV. Performance shown is historical and no guarantee
                                                                                 Cash                                     1.38                      0.00               -0.27                 0.00           -0.27
of future results. Current performance may be lower or higher.                   Unassigned                              -0.05                      0.00               -1.07                 0.00           -1.07
Returns current to the most recent month-end are available at
matthewsasia.com. Investment returns and principal value will
fluctuate so that when redeemed, shares may be worth more or
less than their original cost. Benchmark performance is unaudited.
Please refer to the disclosures for index definition. Unassigned may
include fees, expense accruals, offsets, warrants and rights.

                                                              For institutional use only. Do not give, show or quote to any other person. Not to be used with retail investors. Do not duplicate or reproduce.
                                                                                                                                            © 2020 Matthews International Capital Management, LLC PT001b_2Q20      42
Attribution by Sector | Matthews Asia Dividend Fund
One Year June 30, 2019 to June 30, 2020
 Published Portfolio Return1                                    2.31%                                               Average                                                        Selection +
                                                                                                                    Portfolio             Average               Allocation         Interaction               Total
 Published Benchmark Return                                     1.35%                                                     Wt         Benchmark Wt                   Effect               Effect             Effect
 Published Relative Return2                                     0.96%            Total Portfolio                       100.00                    100.00                 1.24                 0.03                1.27
Attributable Portfolio Return                                   2.62%            Financials                               7.83                     19.19                2.32                 0.24                2.56
Attributable Relative Return                                    1.27%            Real Estate                              6.81                      5.29               -0.39                 1.88                1.49

 1   Published portfolio return represents that of the Investor Share            Materials                                3.17                      5.85                0.21                 0.57                0.77
     Class.                                                                      Information                             10.82                     13.90               -0.65                 1.02                0.37
 2   The published relative return is calculated as the difference of            Technology
     the published benchmark return from the published portfolio
     return.                                                                     Consumer Staples                        15.34                      6.49                0.08                 0.24                0.32
                                                                                 Utilities                                1.98                      2.54                0.15                 0.05                0.20
Benchmark: MSCI All Country Asia Pacific Index
                                                                                 Consumer                                25.94                     15.20                0.84                -1.16            -0.32
The attribution report shows the extent to which the portfolio                   Discretionary
manager’s strategies affect a fund’s performance relative to the
performance of the fund’s benchmark index. Allocation Effect                     Energy                                   1.70                      2.88                0.25                -0.64            -0.39
shows the effect on fund performance of either over- or under-
weighting a market (a sector, country or region, depending on the                Industrials                              9.72                     11.81                0.12                -0.56            -0.44
type of fund) relative to its benchmark. Selection + Interaction
Effect shows how the decision to hold individual securities within               Health Care                              5.31                      6.78               -0.43                -0.12            -0.55
the particular sector, country or region performed relative to the
benchmark.                                                                       Communication                           10.05                     10.07               -0.13                -1.27            -1.40
Attributed performance is calculated using FactSet Research                      Services
Systems, Inc. The methodology of calculation is different from the
published NAV and will not match performance based on the                        Cash                                     1.38                      0.00               -0.27                 0.00            -0.27
published NAV. Performance shown is historical and no guarantee
of future results. Current performance may be lower or higher.                   Unassigned                              -0.05                      0.00               -0.85                -0.22            -1.07
Returns current to the most recent month-end are available at
matthewsasia.com. Investment returns and principal value will
fluctuate so that when redeemed, shares may be worth more or
less than their original cost. Benchmark performance is unaudited.
Please refer to the disclosures for index definition. Unassigned may
include fees, expense accruals, offsets, warrants and rights.

                                                              For institutional use only. Do not give, show or quote to any other person. Not to be used with retail investors. Do not duplicate or reproduce.
                                                                                                                                            © 2020 Matthews International Capital Management, LLC PT001b_2Q20      43
Attribution by Country | Matthews Asia Dividend Fund
Three Years June 30, 2017 to June 30, 2020
 Published Portfolio Return1                                    2.26%                                               Average                                                        Selection +
                                                                                                                    Portfolio             Average              Allocation          Interaction              Total
 Published Benchmark Return                                     3.50%                                                     Wt         Benchmark Wt                  Effect                Effect            Effect
 Published Relative Return2                                    -1.24%            Total Portfolio                       100.00                    100.00                -1.43                 0.34           -1.09
Attributable Portfolio Return                                   2.43%            China/Hong Kong                        37.36                      24.83                0.24                 1.14                1.38

Attributable Relative Return                                   -1.09%            Australia                                1.98                     10.52                0.24                 0.47                0.71
                                                                                 Singapore                                5.62                      2.00               -0.36                 0.47                0.11
 1   Published portfolio return represents that of the Investor Share            Philippines                              1.30                      0.61               -0.04                 0.14                0.10
     Class.
                                                                                 Taiwan                                   3.97                      6.85               -0.06                 0.14                0.08
 2   The published relative return is calculated as the difference of
     the published benchmark return from the published portfolio                 Malaysia                                 0.00                      1.29                0.07                 0.00                0.07
     return.
                                                                                 Pakistan                                 0.00                      0.03                0.01                 0.00                0.01
                                                                                 United States                            0.00                      0.09                0.01                 0.00                0.01
Benchmark: MSCI All Country Asia Pacific Index
                                                                                 United Kingdom                           0.26                      0.00               -0.02                 0.00           -0.02
The attribution report shows the extent to which the portfolio
manager’s strategies affect a fund’s performance relative to the                 New Zealand                              0.00                      0.34               -0.04                 0.00           -0.04
performance of the fund’s benchmark index. Allocation Effect
shows the effect on fund performance of either over- or under-                   Vietnam                                  1.13                      0.00               -0.08                 0.00           -0.08
weighting a market (a sector, country or region, depending on the
type of fund) relative to its benchmark. Selection + Interaction                 Thailand                                 1.77                      1.45                0.01                -0.15           -0.14
Effect shows how the decision to hold individual securities within               Indonesia                                1.82                      1.21               -0.05                -0.16           -0.21
the particular sector, country or region performed relative to the
benchmark.                                                                       Bangladesh                               0.86                      0.00               -0.22                 0.00           -0.22
Attributed performance is calculated using FactSet Research
Systems, Inc. The methodology of calculation is different from the               Japan                                  27.54                      37.69               -0.07                -0.39           -0.46
published NAV and will not match performance based on the
published NAV. Performance shown is historical and no guarantee
                                                                                 India                                    3.04                      5.11                0.15                -0.66           -0.51
of future results. Current performance may be lower or higher.                   South Korea                            11.54                       7.97               -0.16                -0.67           -0.82
Returns current to the most recent month-end are available at
matthewsasia.com. Investment returns and principal value will                    Cash                                     1.91                      0.00               -0.02                 0.00           -0.02
fluctuate so that when redeemed, shares may be worth more or
less than their original cost. Benchmark performance is unaudited.               Unassigned                              -0.08                      0.00               -1.04                 0.00           -1.04
Please refer to the disclosures for index definition. Unassigned may
include fees, expense accruals, offsets, warrants and rights.

                                                              For institutional use only. Do not give, show or quote to any other person. Not to be used with retail investors. Do not duplicate or reproduce.
                                                                                                                                            © 2020 Matthews International Capital Management, LLC PT001b_2Q20      44
You can also read