Economic Impact Analysis of Clean Energy Development in North Carolina-2021 Update
←
→
Page content transcription
If your browser does not render page correctly, please read the page content below
June 2021

Economic Impact Analysis of Clean
          Energy Development in
     North Carolina—2021 Update

                                               Prepared for

            North Carolina Sustainable Energy Association
                                4800 Six Forks Rd Suite 300
                                         Raleigh, NC 27609

                                                Prepared by

                                            Jeffrey Petrusa
                                                Avery Tilley
                                           Manuel Gonzalez

                                         RTI International
                                    3040 E. Cornwallis Road
                           Research Triangle Park, NC 27709

                                RTI Project Number 0217958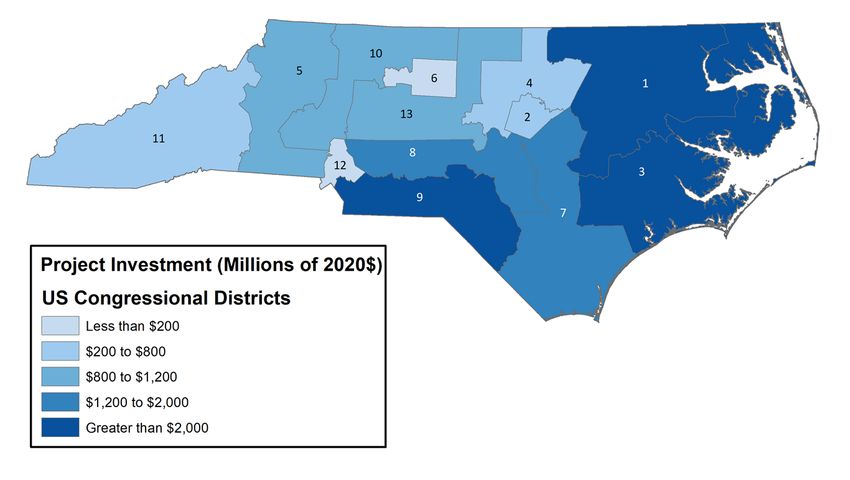
Contents

Section                                                                         Page

       Executive Summary                                                        ES-1

   1   Introduction and Analysis Approach                                         1-1
       1.1   Analysis Approach ................................................... 1-2
       1.2   About RTI International ........................................... 1-4

   2   Economic Impacts, 2007–2020                                                2-1
       2.1   Estimated Direct Impacts of Clean Energy
             Development .......................................................... 2-1
             2.1.1 Investment Value of Clean Energy Projects ....... 2-4
             2.1.2 Energy Generated or Saved from Clean
                    Energy Projects ............................................ 2-6
             2.1.3 State Incentives for Clean Energy
                    Investment .................................................. 2-8
       2.2   Secondary Impacts of Clean Energy Development ....... 2-9
             2.2.1 Changes in North Carolina Spending
                   Patterns from Renewable Energy Generation .. 2-12
             2.2.2 Changes in North Carolina Spending
                   Patterns from Energy Efficiency Initiatives ...... 2-12
       2.3   North Carolina Economy-Wide Impacts .................... 2-13
             2.3.1 Impacts Associated with Renewable Energy
                    Projects ..................................................... 2-13
             2.3.2 Impacts Associated with Major Energy
                    Efficiency Initiatives .................................... 2-15
             2.3.3 Total Impact Associated with Clean Energy
                    Projects ..................................................... 2-16

       References                                                                 R-1

                                                                                    iii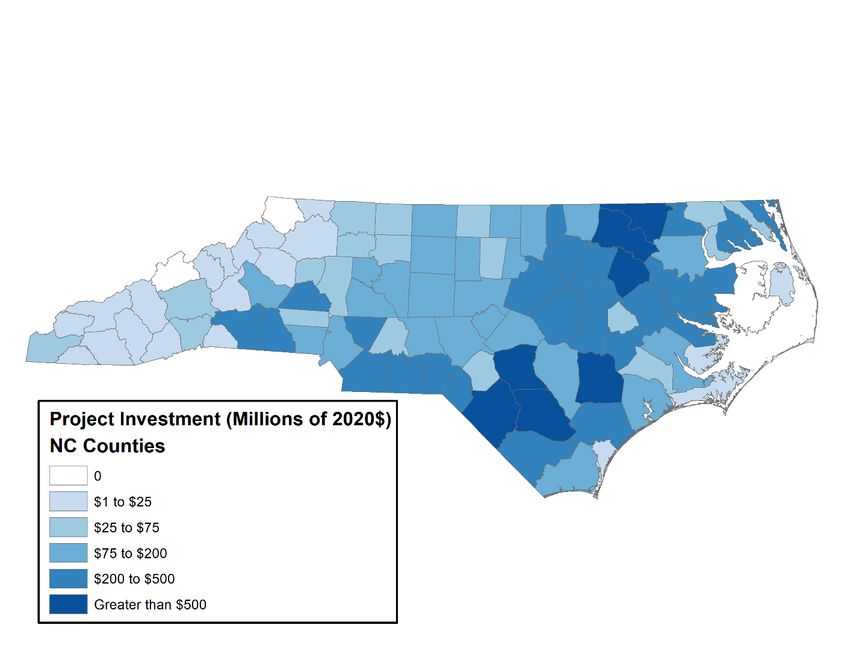
Appendices

           A      Technical Appendix ................................................. A-1
           B      Renewable Energy Projects by County and NC
                  State Legislative Districts ......................................... B-1

iv
Figures
Number Page
2-1 Figure 2-1. Clean Energy Investment in North Carolina,
2007–2020 .................................................................... 2-2
2-2 Distribution of Renewable Energy Projects across North
Carolina Counties, 2007-2020 .......................................... 2-6
2-3 Renewable Energy Direct, Indirect, and Induced
Economic Impacts Related to Clean Energy Incentives ....... 2-11
2-4 Energy Efficiency Direct, Indirect, and Induced Economic
Impacts Related to Clean Energy Incentives ..................... 2-11
B-1 NC Senate Districts Map .................................................. B-7
B-2 NC House Districts Map ................................................. B-10
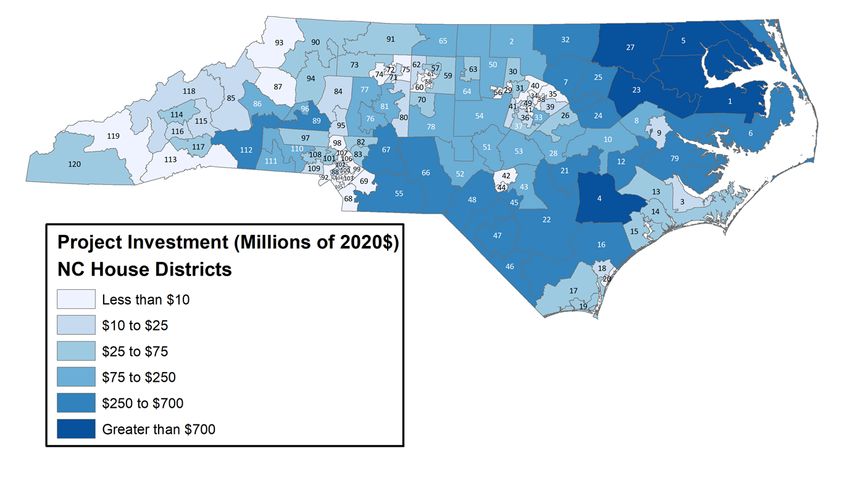
B-3 U.S. Congressional House Districts Map ........................... B-11
vTables
Number Page
ES-1. Total Economic Impacts, 2007–2020 ..................................... 2
2-1. Clean Energy Investment in North Carolina, 2007–2020 ....... 2-3
2-2. Direct Spending in Clean Energy Development by
Technology, 2007–2020 .................................................. 2-5
2-3. Cumulative Renewable Energy Generation, 2007–2020 ........ 2-7
2-4. Energy Efficiency Energy Savings, 2007–2020 ..................... 2-7
2-5. State Incentives for Clean Energy Development, 2007–
2020 ............................................................................ 2-9
2-6. Renewable Energy Projects Economic Impacts, 2007–
2020 .......................................................................... 2-14
2-7. Energy Efficiency Initiatives Economic Impacts, 2007–
2020 .......................................................................... 2-15
2-8. Total Economic Impacts, 2007–2020 ................................ 2-16
A-1. Average Cost for Solar Photovoltaic Installations by Year
and Size (AC kW, 2020$) ................................................ A-2
A-2. Sources Used in Compiling the Universe of Included
Projects ........................................................................ A-6
A-3. Inflation Adjustment Factors ............................................. A-7
A-4. Utility Energy Efficiency Programs ..................................... A-8
A-5. IMPLAN Breakout for Renewable Energy, Energy
Efficiency, and State Spending ....................................... A-12
B-1. Major Investments in Renewable Energy Across North
Carolina Counties (Millions 2020$) .................................... B-1
B-2. Major Investments in Renewable Energy Across North
Carolina Senate Districts (Millions 2020$) .......................... B-5
B-3. Major Investments in Renewable Energy Across North
Carolina House Districts (Millions 2020$) ........................... B-7
B-4. Major Investments in Renewable Energy Across North
Carolina Congressional Districts (Millions 2020$) .............. B-11
viExecutive Summary
This report presents an update to the retrospective economic
impact analysis of renewable energy and energy efficiency
investment included in the 2019 report Economic Impact
Analysis of Clean Energy Development in North Carolina—2018
Update, prepared by RTI International (2019).
The 2021 report continues to analyze the direct and secondary
effects associated with major energy efficiency initiatives and
the construction, operation, and maintenance of renewable
energy projects (collectively, “clean energy development”)
ultimately estimating the magnitude of clean energy
development’s contribution to North Carolina’s economy.
Changes in consumer, utility, and government spending
patterns are analyzed, including
§ Investment in clean energy projects in North Carolina
and their ongoing operation and maintenance.
§ How renewable energy generation and energy savings
from energy efficiency projects have changed spending
on conventional energy generation.
§ Reductions in spending due to the Renewable Energy
and Energy Efficiency Portfolio Standard (REPS)1
requirements.
§ Government funds that would have been spent on other
government services in the absence of state support for
clean energy investment.
Our research findings are as follows:
§ Approximately $19.8 billion was invested in clean energy
development in North Carolina between 2007 and 2020,
which was supported, in part, by the state government
at an estimated cost of $1.5 billion. Clean energy
investments were slightly more than 13 times larger
than the state incentives for them.
1
Under this law, investor-owned utilities in North Carolina will be
required to meet up to 12.5% of their retail electricity sales through
renewable energy resources or energy efficiency measures by 2021.
Rural electric cooperatives and municipal electric suppliers are
subject to a 10% REPS requirement.
ES-1Economic Impact Analysis of Clean Energy Development in North Carolina—2021 Update
§ Renewable energy project investment in 2020 was $1.6
billion, or 62 times the $26.2 million invested in 2007.
§ Investment in 2019 and 2020 accounted for 17% of
total cumulative investment over the last 14 years.
§ Total contribution to gross state product (GSP) was
$22.5 billion between 2007 and 2020 (see Table ES-1).
§ Clean energy development supported 291,183 annual
full-time equivalents (FTEs), equivalent to one person
working full time for a year, from 2007 to 2020.
§ Duplin, Robeson, Halifax, Edgecombe, Cumberland,
Northampton, and Bladen Counties experienced the
greatest amount of investment—more than $500 million
each between 2007 and 2020.
§ Nash, Catawba, Currituck, Scotland, Hertford, and
Beaufort Counties each experienced between $400
million and $500 million in investment between 2007
and 2020.
Table ES-1. Total Economic Impacts, 2007–2020
Gross State Fiscal
Total Outputa Productb Employment Impactc
(Million, (Million, (Full-Time (Million,
2020$) 2020$) Equivalents) 2020$)
Direct economic impact from 19,765.4 9,547.8 160,359.8 1,431.5
clean energy development
Direct economic impact from -1,043.1 -806.3 -10,291.9 -50.8
change in government
spendingd
Secondary economic impacte 22,074.4 13,722.7 141,114.8 -11.7
Total economic impact 40,796.7 22,464.2 291,182.7 1,369.0
a
Total output refers to revenue received by North Carolina individuals and businesses.
b
GSP represents the total value added. Value added is a non-duplicative measure of production that when
aggregated across all industries equals GDP. It provides a complimentary indicator to that of final sales. While
gross output is a useful measure of an individual industry's output, gross output for the economy as a whole
double-counts sales between industries and is a less reliable measure.
c
State support for clean energy projects is included in the analysis as an offset to output and is not reflected in the
fiscal impact results. Note: Sums may not add to totals because of rounding. See Appendix A for details.
d
Direct economic impact from change in government spending refers to the in-state impact of $1,418.4 million in
state clean energy incentives, less $81.3 million that, based on historical spending patterns, would have
otherwise procured goods and services from out of state.
e
Secondary impacts represent spending changes resulting from renewable energy generation and energy savings
and indirect and induced impacts associated with supply chain effects and increased labor income spending.
ES-21 Introduction and
Analysis Approach
Between 2007 and 2020, investment in clean energy
development in North Carolina increased from $56.5 million to
$19.8 billion, of which $17.4 billion (88%) was for renewable
energy projects and $2.4 billion (12%) was for major energy
efficiency initiatives.
The total amount of energy generated or saved through
renewable energy and energy efficiency programs amounted to
124.4 million MWh, which is sufficient to power nearly 9.6
million homes for 1 year.2
Although the growth in energy generation from renewable
sources has been documented in annual energy reports, the
economic impact of clean energy development—economic
activity from construction, operation, maintenance, changes in
energy use, and consequent changes in spending—on North
Carolina’s economy had not been comprehensively measured
until the 2013 report The Economic, Utility Portfolio, and Rate
Impact of Clean Energy Development in North Carolina,
prepared by RTI International and LaCapra Associates (2013).
Since its publication, RTI has published annual updates to
capture the economic impacts of new clean energy investment
for 2013 (RTI, 2014), 2014 (RTI, 2015), 2015 (RTI, 2016),
2016 (RTI, 2017), 2017 and 2018 (RTI, 2019).
This report updates the economic impact results to include
clean energy investments made in 2019 and 2020, otherwise
the analysis methodology remains unchanged.
2
The Energy Information Administration (EIA) estimates that in 2019
a North Carolina residential utility customer consumed 12,953 kWh
per year. See EIA (2020):
http://www.eia.gov/tools/faqs/faq.cfm?id=97&t=3.
1-1Economic Impact Analysis of Clean Energy Development in North Carolina—2021 Update
This work was commissioned by the North Carolina Sustainable
Energy Association, a professional and membership association,
which had no role in the preparation of the analysis or report
apart from posing research questions, suggesting data sources,
and reviewing drafts.
As in previous versions of the report, the principal research
question answered by this analysis is: What are the
comprehensive retrospective statewide economic and fiscal
impacts of clean energy development?
1.1 ANALYSIS APPROACH
The economic impact analysis contained herein uses methods
that provide results about the portion of North Carolina’s
economic activity directly and indirectly associated with clean
energy development. Clean energy development is defined to
include the construction, operation, and maintenance of
renewable energy facilities and energy efficiency initiatives.
This retrospective analysis of clean energy development
§ Analyzed the most current data available from the North
Carolina Utilities Commission (NCUC), North Carolina
Renewable Energy Tracking System (NC-RETS), the
North Carolina Department of Revenue (NC-DOR), the
North Carolina Department of Environmental Quality (NC
DEQ), and the U.S. Energy Information Administration
(EIA);
§ Measured spending for clean energy investments made
in North Carolina over the 14-year period from 2007
through 2020 along multiple dimensions, including
project value and megawatt capacity or equivalent;
§ Used a regional input-output (I-O) analysis to estimate
the gross indirect (supply chain) and induced (consumer
spending from increased labor income) impacts
throughout the state economy resulting from those
investments, including the impacts of reduced
conventional energy generation and of government
incentives over the study period; and
§ Presents the gross employment, fiscal, economic output,
and value added (gross state product [GSP]) impacts of
clean energy development on North Carolina’s economy.
Two categories of economic effects were considered.
1. Direct effects: Information was gathered to quantify the
direct investment (expenditures) related to clean energy
1-2Section 1 — Introduction and Analysis Approach
development over the period 2007 through 2020. The
following impact categories were in scope: investment in
renewable energy and energy efficiency projects and
reduction in government spending on other services to
account for the foregone tax revenue (e.g., the costs of
state policies).
2. Secondary effects: These direct economic impact
estimates were combined with spending changes
resulting from renewable energy generation and energy
savings and modeled using a regional I-O model to
measure the indirect (supply chain) and induced
(consumer spending) impacts resulting from clean
energy development.
The total economy-wide impacts represent the combination of
the two categories. Analysis results are presented as the
cumulative impact from 2007 through 2020; therefore, results
should not be interpreted as annual totals.
Unlike other economic impact studies, the analysis accounts for
selected displacement effects such as:
§ Reduced spending on conventional energy production.
§ How households and businesses would have otherwise
spent the REPS rider for the renewable energy and
energy efficiency portfolio standard.
§ How state government funding would have been spent
in the absence of state incentives for clean energy
development.
However, the analysis does not consider the alternative uses for
private investment dollars devoted to clean energy projects. As
a result, the economic impact measures used in this report are
best interpreted as gross versus net changes in state-level
economic activity.3
It is also important to note that the selected methodology does
not evaluate how North Carolina’s clean energy incentives and
policies influence investment or how state incentives and policy
interact with other federal policy. Thus, for example, the
methodology does not estimate the portion of investment that
occurred as a result of state incentives; instead, it estimates
gross changes in economic activity associated with all clean
energy investment that took place over the study period.
3
See also http://www.nrel.gov/analysis/jedi/limitations.html.
1-3Economic Impact Analysis of Clean Energy Development in North Carolina—2021 Update
1.2 ABOUT RTI INTERNATIONAL
RTI International is one of the world’s leading independent
nonprofit research institutes. Based in Research Triangle Park,
North Carolina, RTI has a mission to improve the human
condition by turning knowledge into practice. Founded in 1958
with the guidance of government, education, and business
leaders in North Carolina, RTI was the first tenant of Research
Triangle Park. Today we have 12 offices in the United States
and 13 in international locations. We employ over 4,280 across
the United States, and over 1,601 worldwide. RTI performs
independent and objective analysis for governments and
businesses in more than 50 countries in the areas of energy
and the environment, health and pharmaceuticals, education
and training, surveys and statistics, advanced technology,
international development, economic and social policy, and
laboratory testing and chemical analysis.
1-42 Economic Impacts,
2007–2020
From 2007 through 2020, $17.4 billion was invested in the
construction and installation of renewable energy projects in
North Carolina. An additional $2.4 billion was spent on
implementing energy efficiency initiatives.4 Total clean energy
development was valued at $19.8 billion.
Although investment was distributed across the state, Duplin,
Robeson, Halifax, Edgecombe, Cumberland, Northampton, and
Bladen Counties experienced the greatest amount of
investment—more than $500 million each between 2007 and
2020.
Clean energy development contributed $22.5 billion in GSP and
supported 291,183 annual FTEs statewide. As a result of
changes in economic activity from the development of clean
energy in North Carolina, state and local governments realized
tax revenue of $1.4 billion.
2.1 ESTIMATED DIRECT IMPACTS OF CLEAN
ENERGY DEVELOPMENT
As depicted in Figure 2-1 and Table 2-1, investment in clean
energy development increased substantially over the 12-year
analysis period. For example, renewable energy project
investments in 2019 and 2020 were over $1.3 billion and $1.6
billion respectively. Annual investments have been declining
over the past 5 years. Falling 52% from the peak in 2015 of
nearly $3 billion. The combined clean energy investment for
4
All dollar values are presented in real 2013 terms. Nominal values
were adjusted using the U.S. city average annual consumer price
index on all items, developed by the Bureau of Labor Statistics.
2-1Economic Impact Analysis of Clean Energy Development in North Carolina—2021 Update
2019 and 2020 accounts for 17% of the total cumulative clean
energy investment from 2007 to 2020.
Figure 2-1. Clean Energy Investment in North Carolina, 2007–2020
$3,500
$3,000
$2,500
Million (2020$)
$2,000
$1,500
$1,000
$500
$0
Investment
Investment
Investment
Investment
Investment
Investment
Investment
Investment
Investment
Investment
Investment
Investment
Investment
Investment
Incentives
Incentives
Incentives
Incentives
Incentives
Incentives
Incentives
Incentives
Incentives
Incentives
Incentives
Incentives
Incentives
Incentives
2007 2008 2009 2010 2011 2012 2013 2014 2015 2016 2017 2018 2019 2020
Renewable Energy Investment Energy Efficiency Investment State Incentives
See Appendix A for data sources. Note: State Incentives for 2020 are estimated based on growth from fiscal year
2018-2019.
2-2Section 2 — Economic Impacts, 2007–2020
Table 2-1. Clean Energy Investment in North Carolina, 2007–2020
Clean Energy State
Renewable Energy Energy Efficiency Investment Incentives
(Million, % of (Million, % of (Million, % of (Million,
Year 2020$) Total 2020$) Total 2020$) Total 2020$)
2007 $26.2 0.2% $30.2 1.3% $56.5 0.3% $1.9
2008 $76.7 0.4% $32.4 1.3% $109.0 0.6% $3.9
2009 $128.2 0.7% $57.2 2.4% $185.4 0.9% $4.6
2010 $313.4 1.8% $109.4 4.5% $422.8 2.1% $7.6
2011 $325.3 1.9% $166.9 6.9% $492.2 2.5% $14.3
2012 $775.7 4.5% $169.7 7.0% $945.4 4.8% $32.7
2013 $960.5 5.5% $164.2 6.8% $1,124.6 5.7% $59.9
2014 $1,379.7 8.0% $159.1 6.6% $1,538.8 7.8% $138.9
2015 $3,071.5 17.7% $182.1 7.6% $3,253.6 16.5% $148.3
2016 $2,650.0 15.3% $346.2 14.4% $2,996.1 15.2% $262.6
2017 $2,615.3 15.1% $269.1 11.2% $2,884.4 14.6% $294.0
2018 $2,089.1 12.0% $279.8 11.6% $2,368.9 12.0% $216.2
2019 $1,324.6 7.6% $232.8 9.7% $1,557.4 7.9% $166.6
2020 $1,617.5 9.3% $212.8 8.8% $1,830.2 9.3% $129.8
Total $17,353.6 100.0% $2,411.8 100% $19,765.4 100.0% $1,481.4
See Appendix A for data sources. Sums may not add to totals because of independent rounding.
In addition to demonstrating growth in investment value over
time, Figure 2-1 and Table 2-1 illustrate that clean energy
projects were more than 13 times as large as the state
incentives for them. Although we do not attempt to statistically
estimate the share of these investments that was motivated by
these incentive programs, it is likely that there is a strong
positive relationship.
Consistent with the 2019 report, the majority of new renewable
energy projects added in 2019 and 2020 were identified
through North Carolina Utility Commission filings. As stated in
the 2019 report, RTI had traditionally relied primarily on data
reported in NC-RETS to track renewable energy development
across the state. However, due to the high growth of renewable
energy a sizable number of new projects since 2014 are not
reflected in NC-RETS. We believe this is due to the fact that
utilities have accumulated sufficient renewable energy credits
to satisfy the targets set by the Renewable Energy Portfolio
Standard (REPS).
The remainder of Section 2.1 reviews in-depth
2-3Economic Impact Analysis of Clean Energy Development in North Carolina—2021 Update
§ Investment value of clean energy projects,
§ Energy generated or saved by clean energy projects,
and
§ State incentives for clean energy development.
2.1.1 Investment Value of Clean Energy Projects
Renewable energy investment was estimated primarily from
facilities registered with NC-RETS, supplemented with data
from EIA databases—EIA-860 and EIA-923; North Carolina’s
Department of Environmental Quality; North Carolina Utilities
Commission (NCUC) dockets for individual projects; North
Carolina GreenPower; and personal communication with
industry experts to adjust reported data or address areas where
information was incomplete. Investments in energy efficiency
and additional clean energy investments through utility
sponsored solar rebate programs were taken from program
reports submitted by utilities to the NCUC and annual reports of
the Utility Savings Initiative. See Appendix A for more
information.
Table 2-2 summarizes the cumulative direct spending in
renewable energy by category between 2007 and 2020.
Investment in renewable energy projects totaled $17.4 billion,
while energy efficiency investment totaled $2.4 billion. Thus,
total clean energy investment was $19.8 billion during the
study period.
Of the $17.4 billion investment in renewable energy projects,
§ Solar photovoltaics made up $15.8 billion (91%),
§ Biomass made up $764 million (4%), and
§ Wind made up $430 million (3%).
2-4Section 2 — Economic Impacts, 2007–2020
Table 2-2. Direct Spending in Clean Energy Development by Technology, 2007–2020
Value
Category Technology (Million, 2020$) %
Renewable energy Biogas fuel cell $77.9 0.4%
direct investment
Biomass $763.9 4.4%
Geothermal $32.6 0.2%
Hydroelectric (Economic Impact Analysis of Clean Energy Development in North Carolina—2021 Update
Figure 2-2. Distribution of Renewable Energy Projects across North Carolina Counties,
2007-2020
See also Appendix B.
2.1.2 Energy Generated or Saved from Clean Energy Projects
Tables 2-3 and 2-4 summarize the energy generated by
renewable projects and the energy saved by energy efficiency
projects between 2007 and 2020.
Renewable energy facilities generated 63.4 GWh of energy, of
which
§ 52.0% was solar photovoltaics,
§ 32.4% was biomass,
§ 4.1% was wind, and
§ 8% was landfill gas.
2-6Section 2 — Economic Impacts, 2007–2020
Table 2-3. Cumulative Renewable Energy Generation, 2007–2020
Energy Equivalent
Facilities Generated
Thousand
Technology Number % MWh %
Biogas fuel cell 2 0.0% 195 0.3%
Biomass (including combined heat and 30 0.1% 20,579 32.4%
power)
Geothermal 8,144 33.5% 202 0.3%
Hydroelectric (Economic Impact Analysis of Clean Energy Development in North Carolina—2021 Update
Thus, the total energy generated or saved from clean energy
projects is estimated to amount to at least 124 million MWh.
2.1.3 State Incentives for Clean Energy Investment
State incentives for clean energy investment, including the
renewable energy investment tax credit7 and state
appropriations for the Utility Savings Initiative, are modeled as
a reduction in spending on other government services.
Investment spending was funded, in part, through state
incentives. Through direct state government appropriations,
renewable energy projects received $1.5 billion in tax credits
and energy efficiency projects received $19.6 million. Total
government expenditures were $1.5 billion between 2007 and
2020 (Table 2-5).
For the purpose of this study, it was assumed that the money
the government spent on renewable energy and energy
efficiency programs was not spent on other government
services. Thus, the government programs contributed to the
positive investment in renewable energy and energy efficiency
of $19.7 billion.
However, the $1.5 billion spent on renewable energy and
energy efficiency programs was shifted from what the
government could have otherwise spent the money on, creating
a minor offset that reduces gross impacts slightly. Section 2.3
includes discussion that illustrates these offsets.
estimate total state energy cost savings by assuming the ratio of
the UNC system to the total state savings was constant across
years. To convert sums to 2020 U.S. dollars, we applied inflation
multipliers calculated from the CPI-U (see Table A-3).
7
This credit expired at the end of 2015. Systems installed in 2016 or
later will not qualify for this credit. Senate Bill 372, signed in April
2015, provides a delayed sunset of the tax credit for projects that
meet certain criteria and received pre-approval from the
Department of Revenue.
2-8Section 2 — Economic Impacts, 2007–2020
Table 2-5. State Incentives for Clean Energy Development, 2007–2020
Renewable Energy
Investment Energy Efficiencyd,e
Tax Credita,b,c (Utility Savings Initiative, Total
Year (Million, 2020$) Million, 2020$) (Million, 2020$)
2007 $0.5 $1.4 $1.9
2008 $2.5 $1.4 $3.9
2009 $3.2 $1.4 $4.6
2010 $6.2 $1.4 $7.6
2011 $12.9 $1.4 $14.3
2012 $31.3 $1.4 $32.7
2013 $58.5 $1.4 $59.9
2014 $137.5 $1.4 $138.9
2015 $146.9 $1.4 $148.3
2016 $261.2 $1.4 $262.6
2017 $292.6 $1.4 $294.0
2018 $214.8 $1.4 $216.2
2019 $165.2 $1.4 $166.6
2020 $128.4 $1.4 $129.8
Total $1,461.8 $19.6 $1,481.4
Note: For the Utility Savings Initiative, an appropriation of $19.6 million was taken, which we distributed evenly
across the study period for the purposes of the analysis.
a
North Carolina Department of Revenue, Policy Analysis and Statistics Division. (2007-2020). Unaudited NC-478G.
Raleigh, NC: North Carolina Department of Revenue, Policy Analysis and Statistics Division.
b
North Carolina Department of Revenue, Revenue Research Division. (2019). “Credit for Investing in Renewable
Energy Property Processed during Calendar Year 2018.” Raleigh, NC: North Carolina Department of Revenue,
Revenue Research Division.
c
State incentives were estimated for 2020 using the historical growth rate from fiscal years 2018 and 2019.
d
North Carolina Department of Commerce. (November 1, 2018). “Annual Report for the Utility Savings Initiative for
Fiscal Year July 1, 2016–June 30, 2017.” Raleigh, NC: North Carolina Department of Commerce.
e
North Carolina Department of Environmental Quality. (February 1, 2017). Personal Communication.
2.2 SECONDARY IMPACTS OF CLEAN ENERGY
DEVELOPMENT
To estimate the overall impact of clean energy development in
North Carolina, the spending described in Section 2.1 was
analyzed using an I-O model of the North Carolina economy.
The I-O model was constructed using IMPLAN software, which
is widely used to assess regional economic impacts at the local,
state, and regional levels.
2-9Economic Impact Analysis of Clean Energy Development in North Carolina—2021 Update
I-O models provide a detailed snapshot of the purchasing
relationships between sectors in the regional economy. In
response to these direct inputs, the I-O model estimates the
increases in in-state output, employment, and spending within
the supply chain for clean energy and the decreases in in-state
output, employment, and spending within the supply chain for
conventional energy.
Increased renewable energy production requires increased
employment in that sector and in the sectors in its supply chain
(indirect impacts). This increased employment, and associated
increased income, will result in increased purchases of
consumer goods and services within the state. The model
estimates these increased household expenditures (induced
impacts), including both the increased consumer spending
derived from the increased direct and indirect employment
associated with renewable energy production and the decreased
consumer spending resulting from decreased direct and indirect
employment associated with conventional energy production.
The total economic impact of clean energy development for
North Carolina is the sum of the direct, indirect, and induced
impacts. Figures 2-3 and 2-4 describe direct, indirect, and
induced impacts.
Two types of secondary economic impacts were modeled in this
study:
§ Those resulting from the value of investment dollars
spent on a clean energy project, representing indirect
and induced supply chain effects, and
§ Those resulting from the reduction in spending on the
production of conventional energy and that are
reallocated to energy efficiency and renewable project
owners.
2-10Section 2 — Economic Impacts, 2007–2020
Figure 2-3. Renewable Energy Direct, Indirect, and Induced Economic Impacts Related to
Clean Energy Incentives
Renewable Energy State
Investment Incentives Renewable Energy Generation
More Spending on Less Spending on More Spending to Less Spending on
Direct Less Spending by
Renewable Energy Other Government Renewable Energy Conventional
Impacts Projects Services Project Owners Energy Generation
Energy Customers
More Spending on Less Spending on More Spending on Less Spending on
Less Spending on
Indirect Inputs to Inputs to Other Inputs to Inputs to
Inputs to Energy
Impacts Renewable Energy Government Renewable Energy Conventional
Customer Spending
Projects Services Project Owners Energy Generation
More Spending on Less Spending on More Spending on Less Spending on Less Spending on
Induced Other Goods and
Other Goods and Other Goods and Other Goods and Other Goods and
Impacts Services Services Services Services Services
+ - + - -
Direction of Impact
Figure 2-4. Energy Efficiency Direct, Indirect, and Induced Economic Impacts Related to
Clean Energy Incentives
Energy Efficiency State
Investment Incentives Energy Savings
More Spending on Less Spending on More Spending to Less Spending on
Direct More Spending by
Energy Efficiency Other Government Energy Efficiency Conventional
Impacts Projects Services Project Owners Energy Generation
Energy Customers
Less Spending on More Spending on Less Spending on
More Spending on More Spending on
Indirect Inputs to Energy
Inputs to Other Inputs to Energy Inputs to
Inputs to Energy
Impacts Government Efficiency Project Conventional
Efficiency Projects Customer Spending
Services Owners Energy Generation
More Spending on Less Spending on More Spending on Less Spending on More Spending on
Induced Other Goods and
Other Goods and Other Goods and Other Goods and Other Goods and
Impacts Services Services Services Services Services
+ - + - +
Direction of Impact
2-11Economic Impact Analysis of Clean Energy Development in North Carolina—2021 Update
2.2.1 Changes in North Carolina Spending Patterns from
Renewable Energy Generation
To estimate the changes in spending resulting from renewable
energy generation, renewable energy produced by facilities was
estimated by applying capacity factors, either at the facility
level based on 2011 generation (EIA-923) or the technology
level (see Table 2-1). Electricity generated by these facilities
was assumed to receive $0.06/kWh8 in avoided costs for the
years 2007 through 2018, which was modeled as a transfer to
renewable generation from inputs to conventional generation.
Renewable thermal energy produced by these facilities was
modeled as a transfer of the retail electricity rate between
utilities and utility customers ($0.0675/kWh for industrial and
$0.1028/kWh for commercial and residential customers [EIA,
2015c]). Finally, the full Renewable Energy Portfolio Standard
(REPS) rider over these years was modeled as a transfer from
utility customers to renewable project owners.
As Table 2-3 stated, renewable energy facilities have generated
an estimated 63 million MWh of energy over the study period.
This generation is estimated to have resulted in a total of $3.9
billion9 in avoided cost and retail energy savings no longer
spent on conventional energy. The total REPS rider over the
study period is estimated to be $590.2 million.10
2.2.2 Changes in North Carolina Spending Patterns from
Energy Efficiency Initiatives
To estimate changes in spending resulting from energy savings
from energy efficiency, the avoided cost of energy saved by
utility energy efficiency and demand-side management
programs were calculated. These avoided costs were modeled
as a transfer from the inputs of conventional energy generation
to utility customers, in line with Duke Energy’s Save-A-Watt
8
Avoided costs received by qualified facilities vary by utility and length
of contract. This value represents a central value among those
reported in avoided cost schedules to NCUC.
9
This $2.4 billion was calculated by multiplying 55.7 million MWh
generated by non-thermal renewable projects by $60/MWh avoided
cost to yield $3,344 million. The 7,137,935 industrial thermal MWh
generated was multiplied by industrial retail savings of $71/MWh
(EIA, 2015b) to yield $506.8 million. Lastly, the 407,199
commercial and residential thermal MWh generated was multiplied
by the average retail savings of $104/MWh (EIA, 2015c) to yield
$42.5 million. Summing the three totals together yields $3,893
million.
10
This total was estimated using the most recent REPS cost data
available at the time of the analysis.
2-12Section 2 — Economic Impacts, 2007–2020
program and current energy efficiency and demand response
cost recovery mechanism.11 Energy savings from the Utility
Savings Initiative were a transfer from utilities to government
spending. A full description of how these assumptions were
implemented is provided in Appendix A.
As Table 2-4 indicated, utility programs yielded nearly 43
million MWh in energy savings over the study period. The
avoided cost for these programs, assuming $0.06/kWh was
$2.6 billion.12 Combining this with the $1.7 billion saved by the
Utility Savings Initiative yields a total energy efficiency savings
of $4.3 billion.
2.3 NORTH CAROLINA ECONOMY-WIDE
IMPACTS
In summary, total output (gross revenue) in North Carolina
associated with clean energy development, after accounting for
secondary effects, is estimated at $40.8 billion over the 14-year
period from 2007 to 2020. Clean energy development
accounted for $22.5 billion in GSP over the study period. Total
employment effects were estimated to be 291,183 FTEs over
the study period.
2.3.1 Impacts Associated with Renewable Energy Projects
As shown in the first data row of Table 2-6, $17.4 billion in in-
state spending on renewable energy projects has a direct
impact on GSP ($8.4 billion), employment (141,942 FTEs), and
state and local tax revenue ($1,291.7 million).
These renewable projects received an estimated $1.5 billion in
state tax credits between 2007 and 2020. Because in the
absence of the incentive program, the state government would
have spent the money on other government services, there is
an offsetting direct economic impact that must be considered.
Annual reports of state tax credits are published in May of the
following fiscal year. Therefore, 2020 state tax credits were
estimated using historical credits claimed from 2018-2019.
11
Duke Energy’s Save-A-Watt program was chosen as a model for
simulating the transfer of avoided energy costs for both its size and
the simplicity of its avoided cost allocation method. The “Shared
Savings Mechanism” replaced the Save-A-Watt program effective
January 1, 2014, and is reflected in this update.
12
The avoided cost was calculated by multiplying 18,018,166 MWh by
$60/MWh ($0.06/kWh) avoided cost to yield $1,081 million.
2-13Economic Impact Analysis of Clean Energy Development in North Carolina—2021 Update
According to IMPLAN’s assumptions, out of the $1.5 billion in
state tax credits, the state government would have otherwise
spent $1,354 million on in-state goods and services and spent
$108 million out-of-state for goods and services. Therefore, the
direct economic impact from the change in government
spending patterns is −$1,380.6 million. GSP, employment, and
fiscal impacts are reduced as well. Note that the second data
row of Table 2-6 shows an offsetting direct economic impact
using negative values.
The two direct impacts—the increase in renewable energy
project spending and the reduction in state government
spending on other things—are combined and analyzed to
estimate the changes in spending resulting from renewable
energy generation. Secondary impacts include the indirect and
induced impacts resulting from supply chain effects and
changes in income due to renewable energy spending.
Ultimately, the total economic impact amounts to a contribution
to GSP of $19.7 billion, 246,159 FTEs, and over $1.3 billion in
state and local tax revenue.13
Table 2-6. Renewable Energy Projects Economic Impacts, 2007–2020
Total Gross State Employment Fiscal
Outputa Productb (Full-Time Impacts
(Million, (Million, Employee (Million,
$2020) $2020) Equivalents) $2020)
Direct economic impact from renewable 17,353.6 8,432.2 141,942 1,291.7
energy
Direct economic impact from change in -1,030.7 -796.7 -10,170 -50.2
government spendingc
Secondary economic impactd 20,466.4 12,019.7 114,387 89.3
Total economic impact 36,789.3 19,655.1 246,159 1,330.7
a
Total output refers to revenue received by North Carolina individuals and businesses.
b
Gross state product represents the total value added.
c
Direct economic impact from change in government spending refers to the in-state impact of $1,461 million in
renewable tax credits, less $431 million that would have otherwise procured goods and services from out of
state. Note: Sums may not add to totals because of rounding. See also Appendix A.
13
Although not broken out in Table 2-6, the substitution of renewable
energy for conventional energy, including reduced household
spending due to the REPS rider and reduced corporate income due
to solar rebate program, resulted in a small positive impact to
employment, economic output, and state and local tax revenue.
2-14Section 2 — Economic Impacts, 2007–2020
2.3.2 Impacts Associated with Major Energy Efficiency
Initiatives
Table 2-7 provides the same impact information as Table 2-6
for the energy efficiency initiatives. It was estimated that there
was $2.4 billion in energy efficiency investment, and the
resulting energy savings and changes in spending over the
study period contributed $2.8 billion to total GSP and supported
45,024 FTEs.
As with state incentives for renewable energy projects, there is
an offsetting negative direct impact associated with
government spending on the Utility Savings Initiative and not
on other activities. If the state government were to spend
$19.6 million on other government services, $7.2 million would
have been spent out of state (second data row in Table 2-7).
The overall fiscal impact from energy efficiency incentives
becomes positive in 2015 due to a large increase in the number
of energy efficiency RECs issued in 2015 and 2016 (which was
not fully captured in the 2015 version of this report due to
underestimation). The 2008–2014 period saw a cumulative
total of 7.4 million MWh of credits while 2015–2016 had an
estimated 12 million MWh of credits issued (NC-RETS, 2017).
Table 2-7. Energy Efficiency Initiatives Economic Impacts, 2007–2020
Total Gross State Employment Fiscal
Outputa Productb (Full-Time Impacts
(Million, (Million, Employee (Million,
2020$) 2020$) Equivalents) 2020$)
Direct economic impact from energy 2,411.8 1,115.6 18,418 139.9
efficiency
Direct economic impact from change in -12.4 -9.5 -122 -0.6
government spendingc
Secondary economic impact 1,608.0 1,703.0 26,728 -101.0
Total economic impact 4,007.4 2,809.1 45,024 38.3
a
Total output refers to revenue received by North Carolina individuals and businesses.
b
Gross state product represents the total value added.
c
Direct economic impact from change in government spending refers to the in-state impact of $19.6 million in
state government procurement to the Utility Savings Initiative, less $7.2 million that would have otherwise
procured goods and services from out of state. Note: Sums may not add to totals because of rounding. See also
Appendix A.
2-15Economic Impact Analysis of Clean Energy Development in North Carolina—2021 Update
2.3.3 Total Impact Associated with Clean Energy Projects
For 2007 through 2020, the total economic activity associated
with renewable energy projects and energy efficiency initiatives
was (Table 2-8):
§ $40.8 billion in gross output (revenue),
§ $22.5 billion in GSP (value-added),
§ 291,183 FTEs, and
§ $1.4 billion in state and local tax revenues.
These results account for a comparatively small offset
associated with government spending changes because the tax
credit and appropriations for the Utility Savings Initiative
caused an estimated loss in output of $1,043 million. It should
be noted that these losses are due to a reduction in
government spending and not from any assumed issues with
governmental involvement in the energy sector.
In Table 2-8, the fiscal impact analysis shows that state and
local governments realized revenue of $1.4 billion as a result of
gross changes in economic activity.
Table 2-8. Total Economic Impacts, 2007–2020
Total Gross State Employment Fiscal
Outputa Productb (Full-Time Impacts
(Million, (Million, Employee (Million,
2020$) 2020$) Equivalents) 2020$)
Direct economic impact 19,765.4 9,547.8 160,360 1,431.5
Direct economic impact from change in -1,043.1 -806.3 -10,292 -50.8
government spendingc
Secondary economic impact 22,074.4 13,722.7 141,115 -11.7
Total economic impact 40,796.7 22,464.2 291,183 1,369.0
a
Total output refers to revenue received by North Carolina individuals and businesses.
b
Gross state product represents the total value added.
c
Direct economic impact from change in government spending refers to the in-state impact of $1,481.4 million in
state clean energy incentives, less $438 million that would have otherwise procured goods and services from out
of state. Note: Sums may not add to totals because of rounding. See also Appendix A.
2-16References
North Carolina Department of Commerce. (November 1, 2015).
“Annual Report for the Utility Savings Initiative for Fiscal
Year July 1, 2014–June 30, 2015.” Raleigh, NC: North
Carolina Department of Commerce.
North Carolina Department of Environmental Quality (NC DEQ).
(May 1, 2017). Personal communication with Len Hoey.
North Carolina Department of Revenue, Policy Analysis and
Statistics Division. (2007–2016. Unaudited NC-478G.
Raleigh, NC: North Carolina Department of Revenue,
Policy Analysis and Statistics Division.
North Carolina Department of Revenue, Revenue Research
Division. (2020). “Credit for Investing in Renewable
Energy Property Processed during Calendar Year 2019.”
Raleigh, NC: North Carolina Department of Revenue,
Revenue Research Division.
North Carolina Department of Revenue, Revenue Research
Division. (2019). “Credit for Investing in Renewable
Energy Property Processed during Calendar Year 2018.”
Raleigh, NC: North Carolina Department of Revenue,
Revenue Research Division.
North Carolina Department of Revenue, Revenue Research
Division. (2018). “Credit for Investing in Renewable
Energy Property Processed during Calendar Year 2017.”
Raleigh, NC: North Carolina Department of Revenue,
Revenue Research Division.
North Carolina Department of Revenue, Revenue Research
Division. (2017). “Credit for Investing in Renewable
Energy Property Processed during Calendar Year 2016.”
Raleigh, NC: North Carolina Department of Revenue,
Revenue Research Division.
North Carolina Department of Revenue, Revenue Research
Division. (2016). “Credit for Investing in Renewable
Energy Property Processed during Calendar Year 2015.”
Raleigh, NC: North Carolina Department of Revenue,
Revenue Research Division.
R-1Economic Impact Analysis of Clean Energy Development in North Carolina—2021 Update
North Carolina Department of Revenue, Revenue Research
Division. (2015). “Credit for Investing in Renewable
Energy Property Processed during Calendar Year 2014.”
Raleigh, NC: North Carolina Department of Revenue,
Revenue Research Division.
North Carolina Utilities Commission (2014b). “Order Approving
2011 REPS Compliance and Requiring Additional
Measurement and Verification of Energy Efficiency
Measures.” E-100 sub 135. Available at
http://starw1.ncuc.net/NCUC/portal/ncuc/portal.aspx.
Accessed September 29, 2014.
RTI International. (2019). Economic Impact Analysis of Clean
Energy Development in North Carolina—2019 Update.
Prepared for North Carolina Sustainable Energy
Association. Research Triangle Park, NC: RTI
International.
RTI International. (2017). Economic Impact Analysis of Clean
Energy Development in North Carolina—2017 Update.
Prepared for North Carolina Sustainable Energy
Association. Research Triangle Park, NC: RTI
International.
RTI International. (2016). Economic Impact Analysis of Clean
Energy Development in North Carolina—2016 Update.
Prepared for North Carolina Sustainable Energy
Association. Research Triangle Park, NC: RTI
International.
RTI International. (2015). Economic Impact Analysis of Clean
Energy Development in North Carolina—2015 Update.
Prepared for North Carolina Sustainable Energy
Association. Research Triangle Park, NC: RTI
International.
RTI International. (2014). Economic Impact Analysis of Clean
Energy Development in North Carolina – 2014 Update.
Prepared for the North Carolina Sustainable Energy
Association. Research Triangle Park, NC: RTI
International.
RTI International and La Capra Associates. (2013). The
Economic, Utility Portfolio, and Rate Impact of Clean
Energy Development in North Carolina. Prepared for the
North Carolina Sustainable Energy Association. Research
Triangle Park, NC: RTI International.
U.S. Bureau of Labor Statistics. (2021). “Consumer Price Index
All Urban Consumers.” Available at
http://www.bls.gov/cpi/#data. Accessed March 18,
2020.
R-2References
U.S. Energy Information Administration (EIA). (2012).
AEO2013 Early Release Overview.
http://www.eia.gov/forecasts/aeo/er/index.cfm.
U.S. Energy Information Administration (EIA). (2015a).
“Average monthly residential electricity consumption,
prices, and bills by state”.
www.eia.gov/tools/faqs/faq.cfm?id=97&t=3 .
U.S. Energy Information Administration (EIA). (2015b). Electric
Power Annual Data. http://www.eia.gov/electricity/
annual/?src=Electricity-f4.
U.S. Energy Information Administration (EIA). (2018). “Average
Price of Electricity to Ultimate Customers.” Available at
https://www.eia.gov/electricity/monthly/epm_table_gra
pher.php?t=epmt_5_03. Accessed February 15, 2019.
R-3Appendix A: Technical Appendix
A.1     RENEWABLE TECHNOLOGY DATA SOURCES
        AND ASSUMPTIONS
A.1.1   Solar Photovoltaic
        Installed solar photovoltaic capacity between 2007 and 2020
        was estimated based on data from North Carolina Renewable
        Energy Tracking System (NC-RETS, 2018), and the North
        Carolina Utility Commission docket system, along with using
        Google Earth to verify the existence of projects. It is important
        to note that while these data sources capture most of the
        installed renewable energy capacity in North Carolina, they are
        not intended to be comprehensive in their coverage. NC-RETS
        was established by the North Carolina Utilities Commission
        (NCUC) to issue and track renewable energy certificates
        (RECs). Utilities use the tracking system to demonstrate
        compliance with the State’s REPS policy. In more recent years,
        it has become necessary to use additional data from the NCUC
        to augment the NC-RETS data. The NCUC reports (Duke Energy
        Carolinas LLC, 2018a) provide a new source of information on
        projects operating in the state that are not reported in the NC-
        RETS database.

        Energy generated was estimated by applying a capacity factor
        of 19%, based on RTI’s review of 2011 photovoltaic generation
        in North Carolina (U.S. Energy Information Administration
        [EIA], 2011) and PVWattv2 (National Renewable Energy
        Laboratory [NREL], 2012b).

        Because of the magnitude of solar photovoltaic relative to other
        clean energy projects and the rapid decline in the cost of
        photovoltaic installations over the period (NREL, 2012a), we
        developed cost estimates for installations by size of system and
        year of installation. These estimates rely on projected
        photovoltaic project costs from developers through
        December 31, 2020, that the North Carolina Sustainable Energy
        Association (NCSEA) compiled from the NCUC. For systems in
        the database with capacity not specified as AC, RTI converted
        from DC to AC by applying a derate factor of 0.79. As a data
        quality check, RTI independently reviewed several registrations
        to verify values within the database against NCUC dockets. RTI
        further cleaned the data by removing outliers (removing values
        1.5x the interquartile range below the first and above the third
        quartile for each year). Costs for each year were then adjusted

                                                                     A-1
Economic Impact Analysis of Clean Energy Development in North Carolina—2021 Update
to 2020$ using the consumer price index (CPI) (Bureau of
Labor Statistics [BLS], 2021).
Table A-1 shows RTI’s estimates of the average costs per kW
(AC), which are consistent with other available photovoltaic
cost data sources over the study period. Annual fixed operating
and maintenance (O&M) costs were assumed to be $26/kW.
Table A-1. Average Cost
Expected
for Solar Photovoltaic
Installations by Year Year 10 kW– 100 kW– 1 MW–2
and Size (AC kW, Online 2 MW
2020$) 2006 15,791
2007 10,298 9,114 9,114
2008 10,622 10,672 12,025 5,355
2009 9,942 9,407 7,017 5,355 5,355
2010 8,850 7,644 5,889 5,355 5,355
2011 8,195 6,652 5,952 5,417 3,781
2012 7,841 6,320 5,126 4,676 4,087
2013 6,799 4,850 3,271 3,185 3,365
2014 6,260 4,798 3,137 2,433 2,956
2015 6,435 3,854 3,173 2,878 2,776
2016 5,537 4,221 2,764 2,767 2,726
2017 5,251 3,539 2,788 2,141 2,446
2018 5,531 3,807 2,788 2,229 2,665
2019 5,290 3,899 2,538 2,037 2,362
2020 5,834 3,848 1,398 1,756 2,748
A.1.2 Landfill Gas
Capacity for landfill gas (LFG) facilities was estimated using
data from NC-RETS (2021) and modified based on personal
communication for one facility. We estimated generation by LFG
facilities based on EIA 2011 and 2012 generation data (EIA,
2011, 2012) where available and otherwise applied a uniform
capacity factor. Installation and O&M costs were also based on
uniform estimates with the exception of personal
communication regarding installation costs for one facility.
In addition to standard LFG facilities, the NC-RETS (2021)
database indicated the addition of an LFG fuel cell project in
2012. Project capacity was provided by NC-RETS but was
modified based on EIA generation data (EIA, 2012). Installation
A-2Appendix A: Technical Appendix
costs were assumed to be $7,000 per kW of rated output, with
variable O&M costs of $43 per MWh (EIA, 2013).
A.1.3 Hydroelectric
NC-RETS (2021) represents the universe from which we pulled
specific hydroelectric projects. Because NC-RETS tracks only
hydroelectric projects under 10 MW, our analysis may
underestimate total hydroelectric investment over the study
period. RTI estimated new or incremental capacity at
hydroelectric facilities between 2007 and 2016 (no additional
projects in years 2017 and 2018) from NC-RETS, EIA data (EIA,
2011), and NCUC registrations (Duke Energy, 2012;
Kleinschmidt, N/A; Brooks Energy, 2008; Advantage
Investment Group LLC, 2004; Cliffside Mills LLC, 2008; Madison
Hydro Partners, 2010).
A.1.4 Biomass
Capacity for biomass facilities installed between 2007 and 2020
was estimated using data from NC-RETS (2021) and adjusted
to reflect data in NCUC registrations for two facilities (EPCOR
USA, 2009). Capacity for co-fired facilities was adjusted to
reflect the 2011 fraction of renewable fuel consumed (EIA,
2011). We estimated generation by biomass facilities based on
EIA 2011 generation data (EIA, 2011) where available and
otherwise applied a uniform capacity factor. Installation, O&M,
and fuel costs were based on uniform estimates or reported
costs in NCUC dockets or press releases where available
(Capital Power, 2011; Coastal Carolina Clean Power LLC, 2008;
Prestage Farms Incorporated, 2011).
A.1.5 Biomass Combined Heat and Power
Thermal output capacity at biomass combined heat and power
(CHP) facilities was developed from NC-RETS (2021) and NCUC
registrations for eight facilities (EPCOR USA, 2009). Capacity
for co-fired facilities was adjusted to reflect the fraction of
renewable fuel consumed (EIA, 2011). For CHP facilities in the
EIA-923 database, capacity was further adjusted to reflect the
fraction of heat generated used for electricity. We estimated
generation by biomass facilities based on EIA generation data
(EIA, 2011) where available and otherwise applied a uniform
capacity factor. Costs of these facilities are incorporated in the
biomass cost estimates discussed above.
A-3Economic Impact Analysis of Clean Energy Development in North Carolina—2021 Update
A.1.6 Wind
Wind power installations were developed from NC-RETS (2021),
North Carolina GreenPower (personal communication, March
30, 2021), and one 208MW system added via press release
(ELP, 2017). Cost for new wind investment were included in
2016 totals because construction was completed by year end
but did not generate electricity until 2017. Capacity factor and
installation and O&M costs were based on uniform estimates or
reported costs in NCUC dockets or press releases where
available (ASU News, 2009; Madison County School System,
2009).
A.1.7 Solar Thermal Heating
Estimates of solar thermal heating capacity installed between
2007 and 2020 are based on data reported in NC-RETS (2021).
RTI reviewed publicly available sources of project installation
costs, annual energy generation, and system O&M (North
Carolina Department of Commerce, 2010; NREL, 2011a) to
develop the assumptions that solar thermal systems cost
$3,500/kW to install and $60/kW for annual O&M. Installation
costs for one project were taken from a news report (News and
Observer, 2012). We assumed that solar thermal heating
systems have the same capacity factor as photovoltaic
systems.
A.1.8 Geothermal Heat Pumps
Geothermal heat pump capacity is not reported in NC-RETS.
The North Carolina Department of Environmental Quality
(NCDEQ) provided permit data for geothermal wells (NCDEQ,
personal communication, March 15, 2021). Although the
number of wells per system varies based on system type and
local conditions, given the available data, we assumed that a
typical 3-ton system in North Carolina required five wells to
convert wells to system size based on a project case study
(Bosch Group, 2007). Based on personal communication with
geothermal system contractors in North Carolina, we assumed
the cost of an average 3-ton system to be $20,000. Because of
a lack of suitable publicly available data in North Carolina,
conversion of system tons to kW and annual energy savings per
ton were estimated from available project data for a large
installation in Louisiana (NREL, 2011b). O&M cost per year are
assumed to be $35/kW (International Energy Agency [IEA],
2010).
A-4You can also read