Has China's Belt and Road Initiative Intensified Bilateral Trade Links between China and the Involved Countries? - MDPI
←
→
Page content transcription
If your browser does not render page correctly, please read the page content below
sustainability

Article
Has China’s Belt and Road Initiative Intensified
Bilateral Trade Links between China and the
Involved Countries?
Chunjiao Yu 1,2 , Ren Zhang 3 , Lian An 4, * and Zhixing Yu 2
 1    Department of International Economics & Trade, Business School, Hubei University, Wuhan 430062, China;
      yuchunjiaowh@hubu.edu.cn
 2    Open Economy Research Centre, Hubei University, Wuhan 430062, China; zhixingyu08@hotmail.com
 3    Department of Finance & Economics, McCoy College of Business Administration, Texas State University,
      San Marcos, TX 78666, USA; zhangren080@gmail.com
 4    Coggin College of Business, University of North Florida, Jacksonville, FL 32224, USA
 *    Correspondence: lian.an@unf.edu

 Received: 14 July 2020; Accepted: 12 August 2020; Published: 20 August 2020

 Abstract: The Belt and Road Initiative (BRI) is designed to intensify reciprocal trade preferentiality
 between China and the Belt-Road countries. However, there has been little research empirically
 examining the policy effects on the trade links between China and the involved countries. This paper
 attempts to evaluate the BRI effects quantitatively by constructing a new bilateral revealed trade
 preference index to measure the bilateral trade preferentiality between China and its 114 trading
 partners. Using a difference in differences model, we show that the trade of China with the Belt-Road
 countries has become more preferentially linked since the implementation of the BRI. In particular,
 the bilateral revealed trade preference index between China and the Belt-Road countries has grown
 approximately 8% faster than has that with the non-Belt-Road countries. We further show that
 the BRI effects are heterogeneous across different regions. The bilateral trade links have been
 more significantly intensified in the regions of the China–Indochina Peninsula Economic Corridor,
 the China–Pakistan Economic Corridor, the China–Central Asia–West Asia Economic Corridor and
 the Bangladesh–China–India–Myanmar Economic Corridor. The findings strongly indicate that BRI
 has been acting as a catalyst for intensifying bilateral trade preferentiality between China and the
 Belt-Road countries.

 Keywords: Belt and Boad Initiative; bilateral revealed trade preference index; difference-in-differences
 methodology

1. Introduction
      The Belt and Road Initiative (BRI), described as “China’s grand connectivity blueprint,” is the
most ambitious international project that China has initiated since 2013 [1–3]. The BRI aims to stimulate
economic growth by strengthening inter-regional cooperation over a vast area covering sub-regions
in Asia, Europe, and Africa, as the grand project has highlighted five different priorities for China
and the BRI participating countries: policy coordination, unimpeded trade, facility connectivity,
financial integration, and the bond between people [2,4]. In particular, it signals a shift in China’s
foreign policy toward prioritizing the trading relationship with her neighboring countries [5,6].
      The dominant purpose of the BRI is to adopt a win–win mode of an integrative economic project that
is free of geopolitical strategy at the regional level [3–9]. During the past seven years, China’s economic
cooperation with the Belt-Road countries has achieved remarkable results. On the one hand, the bilateral
trade between China and Belt-Road countries has significantly increased. The total trade value of goods

Sustainability 2020, 12, 6747; doi:10.3390/su12176747                      www.mdpi.com/journal/sustainability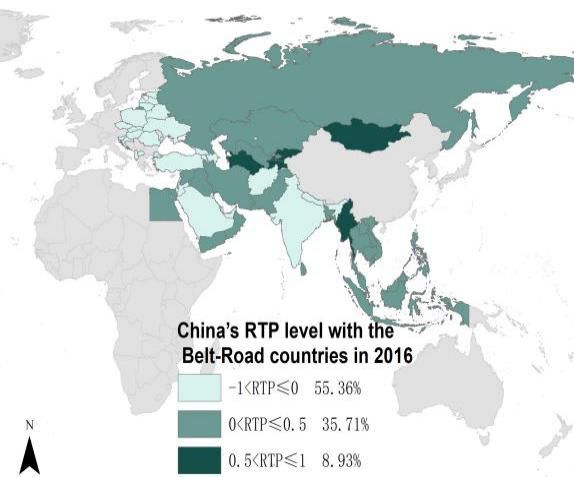
Sustainability 2020, 12, 6747                                                                          2 of 19

between China and Belt-Road countries had exceeded $7.8 trillion from 2013 to 2019, according to the
data reported by the Ministry of Commerce of China. In 2019, the growth of bilateral trade between
China and countries along the Belt and Road reached 10.8 percent, outpacing China’s aggregate trade
growth by 7.4 percentage points [10]. As for the sub-regions, the growth in bilateral trade between
China and the Association of Southeast Asian Nations (ASEAN) achieved the highest year-by-year
increase, at 14.1 percent, outpacing those with the other two vital trading partners: the United States
(US) and the European Union (EU) [11]. On the other hand, facility connectivity represented by
the six economic corridors under the BRI has been strengthened significantly. The enhancement
of regional connectivity of the six economic corridors under the BRI, which include the New
Eurasia Land Bridge Economic Corridor (NELBEC), the China–Central Asia–West Asia Economic
Corridor (CCWAEC), the China–Mongolia–Russia Economic Corridor (CMREC), the China–Indochina
Peninsula Economic Corridor (CICPEC), the Bangladesh–China–India–Myanmar Economic Corridor
(BCIMEC), and the China–Pakistan Economic Corridor (CPEC), has facilitated the trade flows along the
corridors. A prominent example is that the successful running of Nanning, China-Hanoi, and Vietnam
Cross-Border container trains [12], has significantly stimulated the trade flows along the corridor
of CICPEC.
      In light of the above achievements in China’s economic cooperation with the Belt-Road countries,
the purpose of the paper is to provide a quantitative assessment of BRI’s priority of “unimpeded trade.”
In particular, we endeavor to answer the following questions: How to quantitatively assess the impact
of BRI on the reciprocal trade preferentiality between China and the Belt-Road countries? Does there
exist any significant regional heterogeneity of the BRI effect?
      This topic is very important for several reasons: (1) Trade integration has important implications
for business cycle synchronization [13,14], and there is substantial empirical evidence indicating that
business cycles are more synchronized in countries with strong trade intensity [15–17], which provides
further indication of policy coordination [18,19], one of the five priorities of the BRI; (2) Bilateral
trade links have always played an important role in the overall relationship between countries. In a
world economy that increasingly has a regional architecture, national developments and regional
trajectories will be intertangled [20], so that countries with more intense reciprocal trade links are
inclined to have fewer trade conflicts. For example, Brülhart and Thorpe [21] find that the increase
in “two-way” trade among the East Asian economies reduces the labor market adjustment costs and,
hence, reduces the trade friction between nations and has led to the extraordinary growth in exports
from the 1970s to the mid−1990s. (3) Trade integration encourages the reallocation of resources to more
efficient activities and thus opens up opportunities and boosts demands and employment [22–24].
This is particularly important within the context of the foreseeable global economic adversity caused
by the Covid−19 pandemic. (4) Estimating the impact of the BRI on the trade links quantitatively may
provide policymakers with valuable references about making further free trade arrangements with the
Belt-Road countries.
      This paper aims to take the lead in quantitatively examining the impact of the BRI on bilateral trade
preferentiality. Specifically, we use a new measure of bilateral revealed trade preference (RTP) index
and unique trade data series to investigate the dynamics of bilateral trade preferentiality between China
and Belt-Road countries. Recently, Iapadre and Tironi [25] and Iapadre and Tajoli [26] constructed a
country-region version of RTP to map either the extent of trade regionalization or the preferentiality
of regional trade within specific regions such as the ASEAN, the Commonwealth of Independent
States (CIS) and the Southern Common Market (MERCOSUR). Iapadre and Tajoli [26] also used
the RTP indicator to construct a regional trade leadership index to measure the trade leadership
patterns in emerging regions such as ASEAN–China and the Commonwealth of Independent States
(CIS). We adopt the construction of RTP proposed by Iapadre et al. [25,26], but focus mainly on the
bilateral version of the indicator in depicting either the bilateral trade preferentiality or the intensity of
preferential trade links between China and the Belt-Road countries. As the RTP index has addressed
the range symmetry issue raised by Iapadre et al. [25,26], it can better capture either the relative
Sustainability 2020, 12, 6747 3 of 19
bilateral trade links or the preferentiality across countries compared to the traditional trade intensity
indicators, such as the export potential index, which can only depict the unilateral trade performance.
Based on the RTP indices, we find that the trade of China with the Belt-Road countries has become more
preferentially linked during the sample period of 2008–2016, as the statistical results show that China’s
average level of RTP with the Belt-Road countries grew faster than did that with the non-Belt-Road
countries, with the gap between the two groups widening since the BRI began in 2013.
We rely on the difference-in-differences (DID) methodology to gauge how the BRI impacts the
reciprocal trade preferentiality between China and the Belt-Road countries. Our empirical results show
that BRI has intensified bilateral preferential trade links between China and the Belt-Road countries,
with the RTP level between China and the Belt-Road countries growing approximately 8% faster than
that between China and the non-Belt-Road countries. Furthermore, we also confirm the existence of a
regional heterogeneity impact of the BRI. The empirical results indicate that the bilateral trade links
have been intensified more significantly in the CICPEC, the CPEC, the CCWAEC, and the BCIMEC.
Our paper is most related to the study of Foo et al. [6]. However, Foo et al. only investigate the
impact of China’s BRI on the ASEAN-China bilateral trade relationships, as the ASEAN is just one of the
sub-regions along the vast Belt-Road route. Moreover, Foo et al. only investigate the changes in trade
flows between China and ASEAN before and after the implementation of the BRI, without analyzing
the impact of the BRI on reciprocal preferential trade links. Thus, going a step further than Foo et al.,
who find that the BRI has a positive impact on the improvement in the bilateral trade partnerships
between China and the ASEAN countries located along the “Maritime Silk Road,” our paper serves as
a more comprehensive study of the impacts of the BRI on the bilateral trade linkage between China
and the Belt-Road countries.
This paper is organized as follows. Section 2 reviews the literature. Section 3 analyzes the
dynamics of preferential trade links between China and the Belt-Road countries. Section 4 applies the
DID methodology to quantitatively assess the impact of BRI on the intensity of trade links between
China and the Belt-Road countries. Section 5 summarizes the empirical findings. Section 6 presents
the concluding remarks and policy implications.
2. Literature Review
As the BRI, in essence, can be viewed as an infrastructure-led economic integration plan, one strand
of the literature that our study is related to are the studies regarding either trade relations or trade links
in the context of the regional integration. On the one hand, some studies have investigated the impact
of regional economic integration on the trade links between the economies of the sub-regions of the
Belt-Road area. For example, Kalirajan [27] provides evidences that the Indian Ocean Rim-Association
for Regional Cooperation increases trade intensity between member countries. Rana et al. [13,14]
argue that the increasing economic integration in East Asia has intensified the preferentiality of trade
relations between countries within East Asia. Iapadre and Tajoli [26] further point out the fact that the
increasing regionalization of trade and the proliferation of regional trade agreements have increased
the preferentiality of regional trade. On the other hand, Fei [28] and Williams et al. [29] argue that BRI
is expected to reshape the processes of globalization and urbanization in the coming decades. The BRI
will have profound implications for regional trade relations among the countries along the Belt-Road
route [30].
Another strand of the literature that our study is mostly related to are the studies that quantitatively
examine the impact of the BRI on the trade links. However, as the BRI is still a flexible conceptual
and institutional initiative that is far from a well-defined action plan, the vagueness of the BRI project
and the lack of data lead to paucity of empirical evidence on the assessment of the impact of the BRI.
To date, only a handful of studies have touched upon the trade linkage impact of the BRI. As significant
priority has been given to policy coordination and to unimpeded trade as facility connectivity under
the institutional framework of the BRI, it is generally agreed that the BRI will either facilitate trade or
lead to trade creation among the countries along the Belt-Road route. Han et al. [31] and Sang et al. [32]Sustainability 2020, 12, 6747 4 of 19
find complementation and competitiveness coexisting in bilateral trade relations between China and
the Belt-Road countries. Zhai [33] concludes, from using a global computational general equilibrium
model, that there will be a trade creation effect for the economies along and beyond the Belt-Road
route. More specifically, Herrero and Xu [34] confirm that EU countries will benefit considerably from
the BRI as a consequence of the reduction in transportation costs and the increase in trade volumes.
Ramasamy and Yeung [35] and Soyres et al. [36] draw similar conclusions, finding that improvements
in border administration and physical infrastructure from implementing the BRI reduce shipment time
and trade costs and are export-promoting for the countries involved. Yang et al. [37] find that most
Belt-Road countries’ foreign trade and trade terms are promoted due to the infrastructure investment
under the BRI.
Furthermore, some studies have investigated whether there is an intensification of bilateral trade
links among China and the BRI participating countries. On the one hand, some studies confirm
the positive trade linkage effect of the BRI from the perspective of the BRI participating countries.
For example, Devadason et al. [38] argue that the BRI offers another opportunity for ASEAN to expand
the trade links of its member countries and find a new market to bolster economic growth via Chinese
trade relations. Similarly, Boffa [39] quantifies trade linkages within the regional value chains between
the economies along the Belt-Road route and finds that the value-added trade has largely increased.
He argues that the BRI provides substantial room for improving trade linkages between China and
the BRI countries. In the most recent studies, Foo et al. [6] conclude that ASEAN countries benefit
from the BRI through closer international trade links. On the other hand, there is also evidence that
the implementation of the BRI has strengthened China’s trade links with the Belt-Road countries.
Sun et al. [40] and Chen et al. [41] conclude that the BRI has significantly stimulated the exports of
China to the Belt-Road countries. Li et al. [42] provide empirical evidence of the effects of the BRI on
the export performance of the inland small-to-medium enterprises located in the Western Region of
China targeting the “One Belt” area, while Yu et al. [43] find that China’s export potential to the Belt
and Road countries grew significantly after the BRI began. Moreover, evidence of the strengthening
trade links between China and the countries involved in the six economic corridors has also been
documented in Zheng et al. [44] and Karim et al. [45].
This paper contributes to the extant literature in the following respects. First, we are the first to
examine the dynamics of reciprocal trade preferentiality measured by RTP between China and the
Belt-Road countries after the implementation of BRI. The dynamics of reciprocal trade preferentiality
can better help depict the changes in reciprocal preferential trade links between China and the Belt-Road
countries. The RTP index that we employ measures the combined effect of the facilitating factors
on bilateral trade intensity (Iapadre et al. [25,26]; Cingolani et al. [46]), which can better capture the
degree of reciprocal preferential trade links resulting from policy coordination, unimpeded trade,
facility connectivity, and financial integration embodied in the BRI. Computation of the RTP indices is
very tedious work due to their sophistication, and the difficulty level is increased by the large sample
of international trade data covering the 56 Belt-Road countries and 58 non-Belt-Road countries.
Second, the paper contributes to the literature by quantitatively assessing the impact of BRI
on bilateral trade links between China and the Belt-Road countries. Although a few studies have
touched upon the trade linkage impact of the BRI, none of them have quantitatively assessed the
impact of the BRI on the reciprocal trade preferentiality between China and the Belt-Road countries.
As there is controversy concerning the win-win effects of the BRI from different economic perspectives,
the empirical results of this paper will provide rich implications for policymakers both from China and
the Belt-Road countries in the wake of the current uncertain economic climate.
Third, this paper is by far the first to examine the heterogeneous effects of the BRI on China’s
bilateral trade preferentiality with the six economic corridors under the BRI. As most trade flows along a
few high-density routes, i.e., the economic corridors [47], we explore the possible regional heterogeneous
effects of the BRI on China’s bilateral trade preferentiality. We also confirm that the implementation of
BRI has been the major driving force of intensifying bilateral trade preferentiality between China and theSustainability 2020, 12, 6747 5 of 19
Belt-Road countries, with a more conspicuous intensification effect of intra-regional trade preferentiality
found in the economic corridors of CCWAEC, CICPEC, BCIMEC, and CPEC. The conclusion that more
intensified bilateral trade preferentiality was found in the economic corridor of CICPEC is completely
consistent with Foo et al. [6].
3. Dynamics of Bilateral Trade Preferentiality between China and Belt-Road Countries
3.1. Measuring Bilateral Trade Preferentiality
Many attempts have been made to measure the bilateral trade links between two countries.
The typical measure starts with the gravity model approach pioneered by Tinbergen [48] and
Linneman [49]. However, there is a problem with the measures in that the bilateral trade shares of
different partners are strongly correlated with the total trade size, so the strength of bilateral trade
linkages is size-dependent according to Iapadre et al. [25,26]. Kojima [50] and Balassa [51] developed
the most widely used form of revealed comparative advantage index (it is, in essence, a bilateral trade
intensity index) to correct for the size-dependent problem. The traditional trade intensity index (TI) is
defined as a partner country’s share of the reporting country’s total trade divided by its share of world
trade and is calculated as Equation (1)
TIij = Sij /W j (1)
where Sij and Wj are a partner country j’s share of the reporting country i’s total trade and country j’s
weight in total trade of the rest of the world, respectively. However, three factors limit the usefulness
of this traditional trade intensity index. These are the range variability (the range of the index is not
homogeneous across partner countries), the range asymmetry (the index is asymmetric around the
geographic neutrality threshold of one), and the dynamic ambiguity (the change of the index over time
is difficult to interpret). To overcome the problems, Iapadre et al. [25,26] constructed a relative bilateral
trade intensity measurement and defined it as bilateral revealed trade preference index. In this paper,
we will employ the methodology of Iapadre et al. in specifying the bilateral RTP index to measure the
degree of reciprocal preferential trade links between China and Belt-Road countries. Following Iapadre
et al., the RTP index is calculated as Equation (2)
RTPij = (HIij − HEij )/(HIij + HEij ) (2)
where HIij = Sij /Vij = Tij /Tiw / Toj /Tow which is the ‘homogeneous’ bilateral trade intensity
index, and HEij = 1 − Sij / 1 − Vij , which is the complementary ‘extra-bilateral’ trade intensity index.
Tij indicates total trade (exports plus imports) between reporting country i and partner country j;
Tiw indicates total trade between reporting country i and the world; Toj indicates total trade between
the rest of the world (excluding country i) and partner country j; Tow indicates total trade between the
rest of the world and the whole world.
It can be seen that, being defined by the ratio between the difference and the sum of HIij and HEij ,
the RTPij index is, in essence, an indicator of relative bilateral trade intensity because it is modified
based on the traditional bilateral trade intensity defined by Equation (1). Compared to the traditional
trade intensity index, RTPij has the following good features. First, as the range of HIij goes from zero
(no bilateral trade) to infinity (only bilateral trade), with a threshold of one, when the importance
of country j for country i is equal to country j’s weight in the world trade, HIij can solve the range
variability problem of the traditional trade intensity index, as it is homogeneous in the sense that its
maximum value does not depend on the size of the partner country. Second, HEij as the complementary
‘extra-bilateral’ trade intensity index, measures the intensity of trade relations between country i and all
the other countries except country j. HEij can solve the dynamic ambiguity problem of the traditional
trade intensity index. Third, RTPij is perfectly independent of country size and is symmetrical across
partner countries in the sense that RTPij = RTPji .Sustainability 2020, 12, 6747 6 of 19
The value of RTPij ranges from minus one (no bilateral trade) to one (only bilateral trade) and
is equal to zero in the case of geographic neutrality, when the degree of reciprocal trade preference
between two trading partners is equal to each country’s weight in world trade [52]. The RTPij index
actually measures the extent to which the reciprocal trade preference between two countries differs
from the geographic neutrality benchmark based on their relative weight in world trade. The closer
the value of the RTPij index to one, the more intensively do two trading partners tend to trade with
each other than with third countries.
Similarly, a country–region version of the RTP index can also be constructed to map the reporting
country’s trade preferences within a region r according to Iapadre et al. [25,26]. Thus, the index of
RTPir can be computed simply by applying the above formula to the reporting country’s trade with the
rest of the region using Equation (3)
RTPir = (HIir − HEir )/(HIir + HEir ) (3)
where HIir is the weighted average of the corresponding bilateral indices between country i and its
regional partners, with weights given by the relative trade size of country i’s partners for the rest of the
world. The RTPir index actually measures the extent to which a region’s member countries tend to
trade more intensively with the region as a whole than with third countries. If the value of the RTP
index is greater than zero, it indicates that a specific country in a region tends to trade more intensively
with the region as a whole than with the third countries.
In this section, we will first compute the RTP indices by using Equation (2) to analyze the
dynamics of reciprocal preferential trade links between China and her trading partners over time.
While computing the above indices, we treat China as the reporting country, i, and China’s trading
partners as the partner country, j. We then compute RTPir indices by using Equation (3) to analyze
China’s intra-regional trade preferences with sub-regions of the six economic corridors along the
Belt-Road route, and we treat each region of six economic corridors (excluding China) as a single
partner, r.
The number of the BRI participating countries increased to 65 in 2019. However, due to data
availability, our sample covers only 56 Belt-Road countries and 58 non-Belt-Road trading partners
from 2008 to 2016. We take the Belt-Road countries in our sample as the treatment group and the
58 non-Belt-Road trading partners, including the US, the EU, Japan, and other developing economies
as the control group. We exclude Hong Kong SAR, Macau SAR, and Taiwan from our sample because
our focus is between China and other sovereign countries. A detailed list of the Belt-Road countries
and non-Belt-Road trading partners in our sample is shown in Tables A1 and A2 respectively.
To compute the RTP indices, we have to collect the following trade data from 2008–2016: the data
of total trade (exports plus imports) between China and both its Belt-Road and non-Belt-Road partner
countries, the total trade between China and the world, the total trade of China’s trading partners
with the whole world, total world trade, trade between the rest of the world (excluding China) and
China’s trading partners, and trade between the rest of the world (excluding China) and the whole
world. All the trade data with the classification of SITC Rev.3 are sourced from the United Nations
COMTRADE database.
Based on the computation of the RTP indices, we first examine the dynamics of the bilateral
preferential trade links between China and the 56 Belt-Road countries. Furthermore, we also analyze
the dynamics of China’s intra-regional trade preferences with the sub-regions of the six economic
corridors along the Belt-Road route. The detailed Belt-Road countries involved in the six economic
corridors can be seen in Table A3.
3.2. The Dynamics of Bilateral Preferential Trade Links between China and Belt-Road Countries
The statistical analysis of dynamics of the bilateral preferential trade links (measured by RTP
indices) between China and the 56 Belt-Road countries involves the following steps. Firstly, we computeSustainability 2020, 12, 6747 7 of 19
Sustainability 2020, 12, x FOR PEER REVIEW 7 of 20
both the0.050
average value of China’s RTP indices with the 56 Belt-Road countries (treatment group) and
the 58 non-Belt-Road trading partners (control group) from 2008 to 2016, and we plot their trend in
0.000
Figure 1. Figure 1 shows that China’s average level of RTP with the Belt-Road countries grew faster
2008 2009 2010 2011 2012 2013 2014 2015 2016
than did that with non-Belt-Road countries, with the gap between two groups widening since 2013,
-0.050
when the initiative began.
Sustainability 2020, 12, x FOR PEER REVIEW 7 of 20
-0.100
0.050
-0.150
0.000
-0.200
2008 2009 2010 2011 2012 2013 2014 2015 2016
-0.050
-0.250
BRI economies Non-BRI economies
-0.100
Figure 1. Average revealed trade preference (RTP) variation trajectory. Source: Calculated by the
-0.150 based on United Nations COMTRADE data.
authors
-0.200
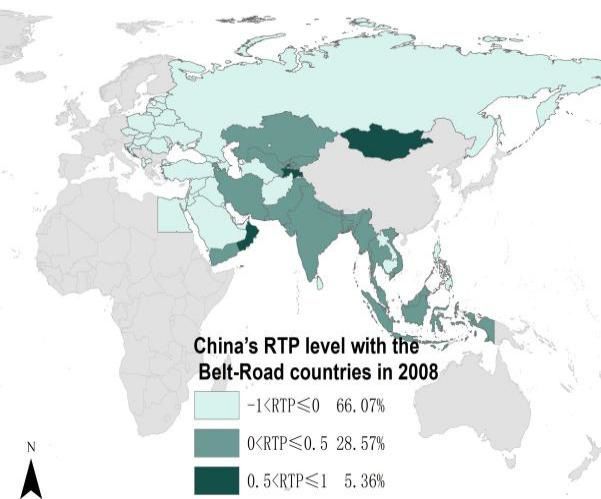
Secondly, we investigate the detailed dynamic changes of the bilateral preferential trade links
between China and the Belt-Road countries by classifying the degree of reciprocal trade
-0.250
preferentiality. We divide the RTP BRI indices between China
economies andeconomies
Non-BRI the Belt-Road countries into three
groups of interval values: (−1,0), (0,0.5), and (0.5,1). An RTP value within (−1,0) indicates a low level
Figure
of trade links
Figure 1. or
1. Average
Average revealed
preferentiality, trade
revealed tradewhereaspreference
a value
preference (RTP) variation
at (0,0.5)
(RTP) trajectory.
indicates
variation a high
trajectory. Source:
level of
Source: Calculated
bilateral by
Calculated the
trade
by thelinks
authors based on United Nations COMTRADE data.
or preferentiality, a value at (0.5,1) indicates an extremely high level of trade links or preferentiality.
We present the number and the percentage of the three different groups of countries in Figure 2. We
Secondly,
also present thewe investigate
intuitive the detailed
comparison of thedynamic
number and changes of the bilateral
the percentage of thepreferential
three differenttrade links
groups
between China
China and the
and Belt-Road
the countries
Belt-Road by
countries classifying
by the degree
classifying
of countries in 2008 to that of 2016, by visualizing the data on the map (see Figure 3). of
the reciprocal
degree oftrade preferentiality.
reciprocal trade
We divide
It can the
preferentiality. RTP
be seen indices
Wethat the between
divide the
share RTP China
indices
of the and the Belt-Road
between
“extremely China
high countries
levelandRTP”thegroup intoshows
Belt-Roadthree agroups
slight of
countries interval
into
yet three
steady
values:
groups (−1,0), (0,0.5), and (0.5,1). An RTP value within (−1,0) indicates
increasing trend. The share of the “high-level RTP” group increased from 2013 to 2015, whereaslevel
of interval values: (−1,0), (0,0.5), and (0.5,1). An RTP value within a low
(−1,0) level of
indicates trade
a links
low or
the
preferentiality,
of trade links whereas
or a value
preferentiality, at (0,0.5)
whereas indicates
a value a
at high
(0,0.5)level of
indicates bilateral
a
share of the “low-level RTP” group decreased during the same time (see Figure 2). Furthermore, it high trade
level links
of or preferentiality,
bilateral trade links
a
orvalue
can at (0.5,1)
preferentiality,
be seen indicates
a value
that both atan
the number extremely
(0.5,1) and thehigh
indicates anlevel
percentage of of
extremely tradethe links
high or of
level
“extremely preferentiality.
trade links orRTP”
high-level We present
group and the
preferentiality.
We present
number and the three
“high-level RTP” group increased significantly in 2016 compared to those of 2008 (see Figure 3). the
and the
the number
percentage of thepercentage
three of
differentthe groups different
of countriesgroups
in of
Figurecountries
2. We in Figure
also present 2. We
All
also present
intuitive the intuitive
comparison of comparison
the number of
and the
thenumber
percentage and the
of percentage
the three of the
different
the statistical results show that China and the Belt-Road countries tended to trade more intensively three
groups different
of groups
countries in
of countries
2008
with to that
each in 2016,
of
other 2008
thantoby that of 2016,
visualizing
with third by visualizing
the
countriesdata thethe
on the
after BRIdata
map (seeon
began the2013.
Figure
in map
3). (see Figure 3).
It can be seen that the share of the “extremely high level RTP” group shows a slight yet steady
increasing 45 trend. The share of the “high-level RTP” group increased from 2013 to 2015, whereas the
80.00%
share of40 the “low-level RTP” group decreased during the same time (see Figure 2). Furthermore, it
70.00%
can be seen that both the number and the percentage of the “extremely high-level RTP” group and
35
“high-level RTP” group increased significantly in 2016 compared to those of 2008 (see60.00% Figure 3). All
30
the statistical results show that China and the Belt-Road countries tended to trade more intensively
50.00%
with each 25 other than with third countries after the BRI began in 2013.
40.00%
20
45 80.00%
30.00%
15
40 70.00%
20.00%
10
35 60.00%
5 10.00%
30
0 50.00%
0.00%
25 2008 2009 2010 2011 2012 2014 2013 2015 2016
40.00%
20 BTP~(0.5,1) BTP~(0,0.5)
BTP~(-1,0) share of extremely high level 30.00%
BTP
15 share of high level BTP share of low level BTP
10 20.00%
Figure
Figure 2.
2. Changes
Changes in
in RTP
RTP level
level between
between China
China and the Belt-Road
and the Belt-Road countries.
countries.
5 10.00%
0 0.00%
2008 2009 2010 2011 2012 2013 2014 2015 2016
BTP~(0.5,1) BTP~(0,0.5)
BTP~(-1,0) share of extremely high level BTP
share of high level BTP share of low level BTP
Figure 2. Changes in RTP level between China and the Belt-Road countries.Sustainability 2020, 12, 6747 8 of 19
It can be seen that the share of the “extremely high level RTP” group shows a slight yet steady
increasing trend. The share of the “high-level RTP” group increased from 2013 to 2015, whereas the
share of the “low-level RTP” group decreased during the same time (see Figure 2). Furthermore, it can
be seen that both the number and the percentage of the “extremely high-level RTP” group and
“high-level RTP” group increased significantly in 2016 compared to those of 2008 (see Figure 3). All the
Sustainability 2020, 12, x FOR PEER REVIEW 8 of 20
statistical results show that China and the Belt-Road countries tended to trade more intensively with
each other than with third countries after the BRI began in 2013.
Sustainability 2020, 12, x FOR PEER REVIEW 8 of 20
(a) 2008 (b) 2016
Figure 3. Comparison of China and the Belt-Road countries’ RTP level in 2008 to that of 2016. (Source:
(a) 2008 (b) 2016
Constructed by the authors based on Baidu map of 2019.
Figure 3. Comparison
3.3.Figure of RTPofbetween
3. Comparison
Dynamics China and
of China andthe
China theBelt-Road
and countries’
Belt-Road countries’
the Six Economic RTP
RTP level
level
Corridors in 2008
in 2008 to thattoofthat
2016.of 2016. (Source:
(Source:
Constructed
Constructed by theby the authors
authors basedbased on Baidu
on Baidu mapmap
ofof2019.
2019.
In this section, we specifically analyze heterogeneous dynamics of China’s intra-regional trade
preferences
3.3. Dynamics
3.3. Dynamics with
of
of RTP RTPthe sixChina
between
between economic
China corridors
andthe
and theSix in the Belt-Road
Six Economic
Economic Corridors
Corridorsarea measured by RTPir indices. As
shown in Figure 4, the China–Pakistan Economic Corridor and the China–Indochina Peninsula
In this In this section,
section, we specifically
we specifically analyzeheterogeneous
analyze heterogeneous dynamics of China’s intra-regional trade
Economic Corridor witnessed the highest intra-regional RTPdynamics of China’s
during 2008–2016, with aintra-regional
slight increase trade
preferences with the six economic corridors in the Belt-Road area measured by RTPir indices. As
preferences
afterwith
2013.the sixfinding
This economic corridors
indicates in the intensification
an obvious Belt-Road area in measured RTPirpreferences
by trade
intra-regional indices. As of shown
shown in Figure 4, the China–Pakistan Economic Corridor and the China–Indochina Peninsula
in Figure China toward
4, the Corridorthe economic
China–Pakistan corridors
Economic of the CPEC
Corridor and and the CICPEC. To be more exact, the finding
Economic witnessed the highest intra-regional RTPthe China–Indochina
during 2008–2016, with aPeninsula
slight increase Economic
indicates that China and the rest of the countries (ASEAN countries) involved in the region of the
Corridor witnessed
after 2013. Thisthe highest
finding intra-regional
indicates an obviousRTP during 2008–2016,
intensification with atrade
in intra-regional slight increase after
preferences of 2013.
CICPEC have closer intra-regional trade preferentiality than is the case with other economic corridors,
China toward
This finding indicatesthe an
economic
obvious corridors of the CPEC
intensification in and the CICPEC.trade
intra-regional To be preferences
more exact, the of finding
China toward
which implies an obvious trend of trade regionalization in the CICPEC. The main reason is that these
indicatescorridors
the economic that Chinaof and theCPEC
the rest ofand
the countries
the CICPEC.(ASEAN Tocountries)
be more involvedthein the regionindicates
of the
two economic corridors are supported by free trade agreements (FTAs)exact, finding
between China and Pakistan that
CICPEC have closer intra-regional trade preferentiality than is the case with other economic corridors,
China and andthe rest of
China andtheASEAN,
countries (ASEAN countries)
respectively, where tradeinvolved in the
facilitation wasregion of the CICPEC
strengthened by the have
which implies an obvious trend of trade regionalization in the CICPEC. The main reason is that these
implementation
closer intra-regional of the
trade BRI and, hence,than
preferentiality the intra-regional
is the case tradeother
with preferences
economicwerecorridors,
intensified. which implies
two economic corridors are supported by free trade agreements (FTAs) between China and Pakistan
an obvious However,tradethe NELBEC witnessed in the lowest intra-regional
mainRTP, indicating that the intra-
and trend
China ofand regionalization
ASEAN, respectively, the
whereCICPEC.
trade Thefacilitation reason is that these
was strengthened two
by economic
the
regional trade preferentiality between China and the rest of the countries (CIS countries and central
corridors are supported
implementation byBRI
of the freeand,
trade agreements
hence, (FTAs)trade
the intra-regional between Chinawere
preferences andintensified.
Pakistan and China and
European countries) involved in the corridor is quite low in the sample period. This implies that there
However, the
ASEAN,isrespectively, NELBEC
where tradewitnessed
facilitationthe was
lowest intra-regional
strengthened byRTP, indicating that theofintra-
the implementation the BRI and,
a great potential for intensifying the trade links between China and the rest of the countries along
regional
hence, the trade preferentiality
intra-regional trade between
preferences China
wereand the rest of
intensified. the countries (CIS countries and central
the NELBEC.
European countries) involved in the corridor is quite low in the sample period. This implies that there
is a great potential for intensifying the trade links between China and the rest of the countries along
0.6
the NELBEC.
0.4
0.6
0.2
0.4
0
0.2 2008 2009 2010 2011 2012 2013 2014 2015 2016
-0.2
0
-0.4 2008 2009 2010 2011 2012 2013 2014 2015 2016
-0.2 the China–Mongolia–Russia Economic Corridor
-0.6 the New Eurasia Land Bridge Economic Corridor
-0.4 the China–Central Asia–West Asia Economic Corridor
thethe China–Indochina Peninsula
China–Mongolia–Russia Economic
Economic Corridor
Corridor
-0.6 thethe China–Pakistan
New Eurasia Land Economic CorridorCorridor
Bridge Economic
thethe Bangladesh–China–India–Myanmar
China–Central Asia–West Asia Economic Economic
CorridorCorridor
the China–Indochina Peninsula Economic Corridor
4. Evolution
FigureFigure of of
regional
the China–Pakistan
4. Evolution RTP
Economic
regional along
RTPCorridor theBelt-Road
along the Belt-Road route.
route.
the Bangladesh–China–India–Myanmar Economic Corridor
Figure 4. Evolution of regional RTP along the Belt-Road route.Sustainability 2020, 12, 6747 9 of 19
However, the NELBEC witnessed the lowest intra-regional RTP, indicating that the intra-regional
trade preferentiality between China and the rest of the countries (CIS countries and central European
countries) involved in the corridor is quite low in the sample period. This implies that there is a great
potential for intensifying the trade links between China and the rest of the countries along the NELBEC.
4. Model Specifications
To quantitatively gauge the effects of the BRI on bilateral trade intensity between China and
the Belt-Road countries, we employ the DID methodology. The Belt-Road countries belong to the
treatment group, and the non-Belt-Road countries are in the control group. As the Belt-Road Initiative
was unveiled for the first time on 7 September 2013, the period from 2014 to 2016 is considered as the
post-shock period, and, correspondingly, the period from 2010 to 2013 is taken as the pre-shock period.
The DID regression equation is specified as follows
RTPcjt = β0 + β1 BRI jt ∗ Postt + β2 δ j + β3 ηt + β4 Z jt + ε jt (4)
where RTPcjt is the reciprocal trade preference between China and its trading partner j in year t. BRIjt is
a dummy variable that has a value of 1 if a sample country is involved in the Belt-Road Initiative, and 0
otherwise; Postt is a dummy variable that takes the value 1 if the time interval is the post-shock period
of 2014–2016, and 0 otherwise; BRIjt *Postt is the interaction term that takes the value 1 if country j
belongs to the treatment group for the post-shock period, and 0 otherwise; δ j . represents country-fixed
effects; ηt represents year-fixed effects; Z jt represents other control variables, which help to isolate the
effect of the implementation of the BRI on RTP; and εit denotes the regression error term.
Following Zhang et al. [53], Gaulier et al. [54] and Shen [55], who investigate the determinants of
bilateral trade linkages, we choose the following control variables shown in Table 1. The summary
statistics of the key variables are presented in Table 2.
It is noted that the key assumptions of the DID estimation approach are satisfied. The first
assumption is the random sampling of the treatment group. We think this assumption is satisfied
due to the following reasons: (1) according to Huang [56], the BRI, as an open initiative to revive the
ancient Silk Road, is more limited in geographical coverage than many of the existing international
arrangements, so that the countries involved in the BRI are determined primarily by their geographical
location in the history; (2) just as Zhang et al. [24] and Yu et al. [43] point out, many regions along
the Belt-Road route such as the Middle East and South Asia are unstable and crisis-prone, which is
not conducive to FDI or infrastructure investment. What is more, some neighboring countries do not
trust China [5] and could even become future potential rivals in international affairs [43]. Therefore,
we argue that there is no evidence indicating that China may have chosen the BRI’s participating
countries based on economic and political considerations. The second assumption is the parallel trend
assumption underlying the DID estimation to account for unobserved variables. Figure 1 provides
graphical support for the parallel trend assumption. Figure 1 shows that China’s RTPs with the
56 Belt-Road countries (treatment group) and the 58 non-Belt-Road countries (control group) experience
almost the same growth trends before 2013. After the implementation of the BRI, the average growth
of RTP between China and the treatment group increased tremendously compared to that between
China and the control group. However, the two groups still exhibit almost the same parallel trend.Sustainability 2020, 12, 6747 10 of 19
Table 1. Definition of the control variables.
Variables Description Source
Logarithm of technology gap measured by the equation: lnTechcj = Ln{1+|m(rdit )-m(rdjt )]},
lnTechcj World Bank database
where rdit and rdjt represent the number of R&D personnel in every one million people in China and country j, respectively.
lnPGPDcj Logarithm of the gap of real GDP per capita between China and the trading partner j World Bank database
lnInfrjt Logarithm of the level of information and communication Infrastructure measured by the number of domestic Internet security servers of country j World Bank database
lnEFjt Logarithm of Economic Freedom index measured by the annual Index of Economic Freedom Report issued by the Heritage Foundation The Heritage Foundation
lnOFDIjt Logarithm of China’s Outward Foreign Direct Investment (FDI) to country j measured by the stock of China’s FDI to the host country http://olap.epsnet.com.cn/
FTAcj Dummy variable that takes a value of 1 if the FTA between China and country j entered into force, otherwise 0 CEPII database
Borcj Dummy variable that takes a value of 1 if country j shares a common border with China, otherwise 0 Statistics from WTO
Table 2. Summary Statistics.
Count Mean sd Min Max
RTPcjt 798 −0.11 0.37 −0.873 0.886
BRI*Postt 798 0.21 0.41 0.000 1.000
lnTechcj 798 6.98 0.87 0.641 8.886
lnPGPDcj 798 8.76 1.43 2.022 11.622
lnInfrjt 798 6.70 2.81 0.000 15.122
lnEFjt 798 4.13 0.17 3.063 4.493
lnOFDIjt 798 10.07 2.46 2.485 15.617
FTAcj 798 0.07 0.22 0.000 1.000
Borcj 798 0.11 0.31 0.000 1.000Sustainability 2020, 12, 6747 11 of 19
5. Empirical Results
5.1. Baseline Regression Results
To conduct further analysis, we have run an ordinary least squares regression by adopting the DID
approach specified in Equation (1). As FTA and border do not change over time, running a fixed effect
panel regression model will omit the estimated coefficient of FTA and border because of collinearity.
Therefore, the random effect panel regression models are used in all estimations.
The baseline regression results are reported in Table 3. The results in the column (1) of Table 3 show
that the effect of the BRI on RTP is significantly positive, as reflected by the positive and statistically
significant estimated coefficient of the interaction term BRI*Postt . Columns (2–5) report the estimation
results with additional control variables, including the technology gap, the gap in real GDP per capita
between China and the trading partner, the infrastructure level and Economic Freedom of China’s
trading partners, and the Outward FDI from China. The coefficients of the interaction term BRI*Postt
are still positive and statistically significant. As to the magnitude of the estimated effect of the BRI,
it increased the RTP between China and the Belt-Road countries by approximately 8% more than
that with the non-Belt-Road countries. The direct reason for this is that the BRI facilitates trade flows
between China and the Belt-Road countries. Foo et al. [6] and Yu et al. [43] also find that China’s trade
with the Belt-Road countries increased significantly after the BRI began.
Table 3. Estimated results of the baseline regression.
Variables (1) (2) (3) (4) (5)
BRI*Postt 0.0637 *** 0.0826 *** 0.0823 *** 0.0760 *** 0.0756 ***
(3.65) (4.54) (4.55) (4.19) (4.18)
lnTechcj 0.00910 0.00793 0.00804 0.00682
(0.76) (0.67) (0.68) (0.58)
lnPGPDcj 0.0131 * 0.0136 * 0.0125 0.0129 *
(1.66) (1.73) (1.59) (1.65)
lnInfrjt −0.0190 ** −0.0227 *** −0.0153 * −0.0191 **
(−2.16) (−2.64) (−1.76) (−2.24)
lnEFjt −0.253 ** −0.269 ** −0.197 * −0.214 *
(−2.21) (−2.39) (−1.73) (−1.91)
lnOFDIjt 0.0267 *** 0.0233 *** 0.0222 *** 0.0189 ***
(3.73) (3.28) (3.09) (2.66)
FTAcj 0.521 *** 0.511 ***
(4.24) (4.27)
Borcj 0.352 *** 0.340 ***
(3.89) (3.94)
Year fixed effect Y Y Y Y Y
N 798 798 798 798 798
Notes: T statistics are in parentheses. * p < 0.10, ** p < 0.05, *** p < 0.01.
5.2. Extended Regression Results
Next, we further examine the heterogeneous effects of the BRI on RTP across regions of the six
economic corridors along the Belt-Road route. Column (1) and Column (5) in Table 4 demonstrate
that the effects of the BRI on strengthening China’s intra-regional RTP with the economic corridors of
the CICPEC, the CPEC, the CCWAEC, and the BCIMEC are significantly positive, but the effects are
insignificant for the other two economic corridors. To summarize, our empirical results show that the
heterogeneous effect of the BRI on intra-regional RTP differs across regions, which indicates that the
intra-regional trade preferences between China and the economic corridors of the CICPEC, the CPEC,
the CCWAEC, and the BCIMEC have been more significantly intensified than have those with the
other two economic corridors. Similarly, Foo et al. [6] also show that the BRI further facilitates the
bilateral trade partnerships between ASEAN countries that are involved in the CICPEC and China.Sustainability 2020, 12, 6747 12 of 19
Table 4. Estimated results of the extended regression: heterogeneous effects of the BRI across regions.
Variables (1) (2) (3) (4) (5)
BRI*Postt *area 1 −0.0501 * −0.0264 −0.0255 −0.0329 −0.0323
(−1.87) (−0.95) (−0.92) (−1.19) (−1.17)
BRI* Postt *area 2 0.112 *** 0.121 *** 0.123 *** 0.117 *** 0.119 ***
(4.80) (5.16) (5.25) (5.02) (5.11)
BRI* Postt *area 3 0.0971 0.124 * 0.130 * 0.104 0.109
(1.45) (1.82) (1.92) (1.54) (1.62)
BRI* Postt *area 4 0.0844 *** 0.112 *** 0.103 *** 0.101 *** 0.0920 ***
(2.65) (3.42) (3.15) (3.12) (2.83)
BRI* Postt *area 5 0.0896 ** 0.0929 ** 0.0963 ** 0.0858 ** 0.0888 **
(2.07) (2.13) (2.21) (1.98) (2.05)
BRI* Postt *area 6 0.192 ** 0.211 ** 0.215 ** 0.191 ** 0.195 **
(2.05) (2.23) (2.28) (2.04) (2.07)
lnTECHcj 0.00500 0.00374 0.00388 0.00255
(0.42) (0.32) (0.33) (0.22)
lnPGPDcj 0.00983 0.0102 0.00914 0.00938
(1.25) (1.31) (1.17) (1.21)
lnInfrjt −0.0163 * −0.0202 ** −0.0124 −0.0162 *
(−1.87) (−2.38) (−1.42) (−1.92)
lnEFjt −0.256 ** −0.271 ** −0.200 * −0.214 *
(−2.26) (−2.44) (−1.77) (−1.94)
OFDIjt 0.0242 *** 0.0214 *** 0.0196 *** 0.0168 **
(3.42) (3.05) (2.75) (2.39)
FTAcj 0.514 *** 0.504 ***
(4.29) (4.32)
Borcj 0.347 *** 0.335 ***
(3.88) (3.98)
Year fixed effect Y Y Y Y Y
N 798 798 798 798 798
Notes: area1, area 2, area 3, area 4, area 5, and area 6 are dummies indicating whether the Belt-Road countries belong
to the region of the six economic corridors, with area 1 indicating the New Eurasia Land Bridge Economic Corridor,
area 2 indicating the China–Central Asia–West Asia Economic Corridor, area 3 indicating the China–Mongolia–Russia
Economic Corridor, area 4 indicating the China–Indochina Peninsula Economic Corridor, area 5 indicating the
Bangladesh–China–India–Myanmar Economic Corridor and area 6 indicating the China–Pakistan Economic Corridor.
T statistics are in parentheses. * p < 0.10, ** p < 0.05, *** p < 0.01.
5.3. Robustness Checks
This section performs the robustness checks. First, we conduct a placebo test to examine what
happens if the “post” dummy is set differently, for instance, 2 or 3 years before the treatment.
Considering that there may be other random factors causing the differences in RTP indices between the
control and treatment groups, the placebo test is employed to check if the effects can be replicated for
different years of the treatment, assuming that the BRI was proposed in either 2011 or 2012, rather than
2013. We rerun the baseline regression model, keeping other specifications the same. Table 5 shows the
results of the placebo test. It can be found that the coefficients of the interaction variables BRI*Postt−2
in columns (1,2) are statistically insignificant. The coefficients of the interaction variables BRI*Postt−3
in columns (3,4) are also statistically insignificant. All the findings suggest that the positive BRI impact
is not valid when assuming the BRI was proposed in either 2011 or 2012. In other words, the positive
effects of the BRI cannot be replicated for different years of the treatment. The above placebo test results
imply that the BRI has a significantly positive impact on the bilateral trade preferentiality between
China and the Belt-Road countries.
Considering that the time nodes when the Belt-Road countries respond to and participate in
the BRI are different, as the BRI is a flexible regional economic integration initiative, the second
robustness check is to investigate the lag effects of the BRI. We rerun the baseline regression with
the lag of BRI*Postt+1 and BRI*Postt+2 and the results are reported in Table 6. The coefficients of the
interaction variables of BRI*Postt+1 and BRI*Postt+2 are significantly positive (see columns (2) and (4)
in Table 6). These results show that the BRI also had a significant positive impact on the bilateral trade
preferentiality between China and the Belt-Road countries over the two years after 2013, when the
BRI was proposed. The findings also imply that the BRI has a stable and long-term positive effect on
intensifying preferential trade links between China and the Belt-Road countries.Sustainability 2020, 12, 6747 13 of 19
Table 5. The results of the placebo test.
(1) (2) (3) (4)
BRI*Postt−1 0.0242 0.0317
(1.27) (1.62)
BRI*Postt−2 0.0294 0.0295
(1.24) (1.23)
lnTECHcj 0.00334 0.00262
(0.28) (0.22)
lnPGPDcj 0.0114 0.0110
(1.45) (1.40)
lnInfrjt −0.0152 * −0.0141 *
(−1.78) (−1.66)
lnEFjt −0.207 * −0.206 *
(−1.84) (−1.83)
OFDIjt 0.0177 ** 0.0173 **
(2.44) (2.38)
FTAcj 0.509 *** 0.507 ***
(4.25) (4.23)
Borcj 0.354 *** 0.356 ***
(4.09) (4.07)
Year fixed effect Y Y Y Y
N 798 798 798 798
Notes: The variables of BRI*Postt−1 and BRI*Postt−2 , respectively, represent the BRI being assumed to be proposed
in either 2012 or 2011, rather than 2013. T statistics are in parentheses. * p < 0.10, ** p < 0.05, *** p < 0.01.
Table 6. The results of the lag effects of the BRI.
(1) (2) (3) (4)
BRI*Postt+1 0.0482 ** 0.0562 ***
(2.54) (2.86)
BRI*Postt+2 0.0298 0.0410 *
(1.24) (1.65)
lnTECHcj 0.000703 −0.00117
(0.05) (−0.08)
lnPGPDcj 0.00270 −0.00778
(0.31) (−0.73)
lnInfrjt −0.0220 ** −0.0265 ***
(−2.43) (−2.75)
lnEFjt −0.0844 −0.0400
(−0.69) (−0.29)
OFDIjt 0.0182 ** 0.0213 **
(2.32) (2.51)
FTAcj 0.503 *** 0.507 ***
(4.13) (4.07)
Borcj 0.358 *** 0.358 ***
(4.07) (3.98)
Year fixed effect Y Y Y Y
N 684 684 570 570
Notes: The variables of BRI*Postt+1 and BRI*Postt+2 represent the BRI being assumed to be popularized in 2014 and
2015, respectively. T statistics are in parentheses. * p < 0.10, ** p < 0.05, *** p < 0.01.
6. Conclusions
This study attempts to examine the policy impact of the Belt and Road Initiative (BRI) on
preferential trade links between China and the Belt-Road countries. The bilateral trade preference level
between China and 56 Belt-Road countries and 58 non-Belt-Road countries from 2008 to 2016 was
calculated. Our statistical results show that China’s average level of bilateral revealed trade preference
(RTP) with the Belt-Road countries grew faster than did that with non-Belt-Road countries, with the
gap widening since 2013, when the initiative was adopted. Furthermore, the difference-in-differences
methodology is employed to further gauge the policy impact of the BRI. We find that the RTP
level between China and the Belt-Road countries grew approximately 8% faster than did that with
the non-Belt-Road countries after the BRI began. We also confirm the existence of the regional
heterogeneity of the BRI effect and find that the intra-regional trade preferences between China and the
economic corridors of the China–Indochina Peninsula Economic Corridor (CICPEC), the China–Pakistan
Economic Corridor (CPEC), the China–Central Asia–West Asia Economic Corridor (CCWAEC), and theSustainability 2020, 12, 6747 14 of 19
Bangladesh–China–India–Myanmar Economic Corridor (BCIMEC) have been more intensified than
have those with the other two economic corridors. All these results provide strong evidence for the
efficiency of BRI in strengthening reciprocal trade links between China and the Belt-Road countries.
We argue that the empirical findings in the paper may contribute to a comprehensive discussion
of further strengthening economic cooperation, especially trade integration, under the institutional
framework of the BRI. Given the current pressure of global economic downturn and uncertainty,
it is vital to strengthen the bilateral trade partnership between China and Belt-Road countries.
Thus, the policymakers from China and the Belt-Road countries should further coordinate international
trade development policies, focusing on achieving a high level of trade facilitation and creating a more
stable trading environment along the Belt-Road route. As for China, it will make sense for Chinese
policymakers to formulate region-specific economic cooperation plans according to the regional
heterogeneity of the BRI effect. The priority should be to deepen economic cooperation in the CICPEC,
the CPEC, the CCWAEC, and the BCIMEC. The docking of infrastructure construction projects and
national development plans of the countries along these economic corridors during the process of
promoting infrastructure connectivity should be emphasized. In particular, emphasis should be placed
on upgrading the strategic partnership between China and the ASEAN countries by promoting the
deep integration of the BRI and the “ASEAN Connectivity Master Plan 2025”, focusing on helping the
less-developed ASEAN countries with infrastructure construction to boost trade and foreign direct
investment flows along the CICPEC.
The paper conducts a preliminary study by identifying a causal relationship between the BRI and
the bilateral trade preferences between China and Belt-Road countries. We argue that the empirical
findings of the paper may contribute to a comprehensive discussion of bilateral trade partnerships
between China and Belt-Road economies. The mechanics through which the BRI strengthens the
reciprocal trade preference between China and Belt-Road countries are worth discussing. Although
the BRI is just unfolding, the benefit is becoming obvious and is ready to be measured. Over time,
we will obtain more evidence of various impacts of this grand project on regional trade integration.
This paper has several limitations and can be expanded on through further research in the following
directions. First, it is worth systematically discussing the mechanics, for instance facility connectivity,
policy coordination or financial integration, through which the BRI strengthens the reciprocal trade
preference between China and Belt-Road countries. Second, as this study analyzes the effects of the
BRI on bilateral trade preferentiality from the country-specific and regional perspective, it is worth
further research distinguishing the effects of the BRI on the trade preferentiality of various industries,
for instance the machinery and electronics industry between China and the Belt-Road countries. Lastly,
further research can be conducted to investigate how the BRI impacts the trade gains of the Belt-Road
countries from participating in the regional global value chains. We leave those to future study.
Author Contributions: C.Y. and L.A. conceived and designed the research; C.Y. performed the research and wrote
the original draft; Z.Y. led data collection, performed the raw data analysis; R.Z. gave advice onto the econometric
models; C.Y., L.A. and R.Z. revised and verified the paper. All authors have read and agreed to the published
version of the manuscript.
Funding: Financial support from the National Social Science Foundation of China (grant number 16BJL102) and
Faculty Scholarship Development Grant of University of North Florida are gratefully acknowledged.
Acknowledgments: The authors thank the anonymous reviewers for their valuable comments for improving this
paper. The authors are particularly grateful to the editor, Daniel Pacurar, for his detailed comments on the paper
throughout the review process.
Conflicts of Interest: The authors declare no conflict of interest.You can also read