THE HETEROGENEOUS IMPACT OF EXTERNAL CONNECTIVITY ON THE LOCAL ECONOMIC PERFORMANCE: AN ANALYSIS AT NUTS-3 LEVEL - AISRe
←
→
Page content transcription
If your browser does not render page correctly, please read the page content below

THE HETEROGENEOUS IMPACT OF EXTERNAL CONNECTIVITY ON THE LOCAL
 ECONOMIC PERFORMANCE: AN ANALYSIS AT NUTS-3 LEVEL

 Luca Bettarelli* and Laura Resmini**

 DRAFT VERSION, DO NOT QUOTE WITHOUT PERMISSION

 Abstract

In the last decades, globalization and reductions in communication and transportation costs have
increased interactions between regions and cities worldwide, to the extent that scholars have
identified in the global connectivity a crucial driver for the local economic dynamism (van Meerten
et al., 2016). In fact, external connections allow local economies to enjoy a number of positive
externalities, out of which, knowledge diffusion, access to new markets, diversification of assets (Pain
et al. 2016). Nevertheless, the literature still struggles in addressing the following question: who
benefits more from global connectivity? If a number of scholars sustain that only few super-cities are
able to compete internationally and exploit global production networks (World Bank, 2009; Kemeny
and Storper, 2020), others suggest that connectivity is the (only) pathway out from marginality for
small and inner areas (Rodriguez-Pose and Fitjar, 2013). This paper attempts to empirically address
the above research question, by exploring a novel hand-collected dataset that maps the international
connectivity of the Italian NUTS-3 regions, along the period 2007-2015. Connectivity is measured
using information on all the ownership ties between MNEs and their subsidiaries, the main vehicles
for the economic integration between local economies (Todeva and Rakhmatullin, 2016). We classify
Italian NUTS-3 regions on the basis of four criteria: population size, degree of urbanization,
concentration of managerial functions, and the EU definition of inner area. Results show that
connectivity is relatively more important for small and inner provinces, rather than for their large
counterparts, thus sustaining the idea that promoting economic openness is a viable strategy for
relaunching the dynamism of remote and marginal areas. Moreover, connectivity impacts more on
the local economic performance when the external connections are widely spread throughout the
world and when they develop in sectors that guarantee absorption capacity.

Keywords: global connectivity, inner areas, economic dynamism, specialisation.
JEL Codes: D62, O18, R11, R12

* Corresponding author. Department of Sociology and Social Research, University of Milan-Bicocca. Mail: luca.bettarelli@unimib.it
** Department of Economics, Business and Law (Di.SE.A.DE), University of Milan-Bicocca.

 1
1. Introduction and theoretical background

Developed and developing countries are both experiencing a sharp territorial polarisation of places
with, on the one side, economically dynamic areas and, on the other side, marginal territories, which
are left behind in terms of economic opportunities and future perspectives (Rodriguez-Pose, 2018;
Iammarino et al., 2017; Iammarino et al., 2018; McKay, 2019; Kemeny and Storper, 2020). This trend
has serious concerns for the stability of a country or a macro-region as a whole, as much as people
living in marginal places are not “going to go down without a fight” (Rodriguez-Pose, 2018, p. 5).1
In the last decades, many public interventions have been designed to make places left behind catch
up with the most competitive ones (Scott, 1992; McKay, 2019). The goal of policymakers has been
to foster the economic dynamism of marginal territories, so as to switch on virtuous economic
development processes (Sinn, 2002; Rodriguez-Pose and Fratesi, 2007; Gonzalez, 2011).

What stimulates the economic dynamism at the local level has been the focus of extensive literature
(see Artelanis et al., 2006; Petrakos et al., 2007; van Hemerrt and Nijkamp, 2011). If endogenous
growth models have traditionally focused on elements such as the accumulation of physical capital,
human capital, productivity and innovation capacity (Solow, 1956; Romer, 1986; Lucas, 1988; Spear
and Young, 2018), two views have been put forward by economic geographers, both of them
concentrating on the role of interactions among socio-economic actors, but at different geographical
scale: the spatial clustering of economic activities vs. the network externalities (Neal, 2011; Camagni
and Capello, 2015; van Meerten et al., 2016; Burger and Meijers. 2016). The former has been referred
to by scholars as the buzz option, while the latter as the pipeline one (Storper and Venables, 2002,
2004; Bathelt et al., 2004; Bathelt, 2007; Rodriguez-Pose and Fitjar, 2013).

The buzz option includes theories that date back to the pioneering work by Marshall (1890, 1920),
according to which the co-location of economic activities facilitates interactive-learning and the
exploitation of scale and scope economies. Since then, the argument had evolved in many directions,
out of which, the analysis of the sectoral composition of economic activities at the local level (Jacobs,
1969; Frenken et al., 2007), the inclusion of socio-cultural dimensions (Becattini, 1975; Camagni,
and Capello, 2015), the degree of competition between local actors (Porter, 1990, 1998). Regardless
of the conceptual arguments that differentiate the above theories, a number of common aspects can
be brought to light, among them, the advantages originating from the co-location of economic
activities and, as a result, the role of agglomeration externalities (Feldman, 2000; van Meeteren et al.,
2016; Burger and Meijers, 2016). Through agglomeration and concentration of economic agents in a
spatially-bounded geographical space, a local economy is able to enjoy positive externalities – e.g.
economies of scale and scope, pooling of high-skilled labour, knowledge and technological diffusion
– which in turn stimulate the economic dynamism (Glaeser, 2011).

On the other side, last decades have seen the explosion of the globalization phenomenon, thanks to
tremendous reductions in communication, coordination and transportation costs, as well as policy
initiatives aimed at favouring the free movement of goods, services and people (Veltz, 2000;
Crescenzi and Iammarino, 2017). Today, more than ever before, production is organised around the
so-called Global Production Networks (GPNs), through which firms located in different countries
interact in order to launch a product on the market (Tylor, 2001; OECD, 2013; Inomata, 2017). At
the same time, inter-firms networks have contributed to fostering interactions between regions and
cities worldwide (Coe et al., 2004), to the extent that scholars have identified in the global
connectivity a crucial driver for the local economic dynamism (Florida, 2008; van Meeteren et al.,
2016). Interactions among distant locations is at the core of the pipeline option, in which local

1
 Recent political events, from the 2016 Brexit vote in the UK to the election of Trump in the US, to the electoral success of populist
parties throughout Europe (e.g. France, Italy, Austria), have made evident that people living in left behind places are using political
instruments, such as the ballot box, to revenge against the feeling of lack of opportunities (Rodriguez-Pose, 2017; McKay, 2019).

 2
economies connect to other places, potentially located far away, for specific purposes, being them
economic, technological, cultural, social (Arthur, 1994; Bathelt et al., 2004; Boschma, 2005). As well
as proximity-based interactions, external connectivity provides a number of positive externalities to
local economies, e.g. access to new markets, diversification of available assets, avoidance of
institutional lock-in (Capello, 2000; Foxon, 2014; Bettarelli and Resmini, 2019; Ascani et al., 2020).

Not surprisingly, when the two above approaches towards economic interactions are taken together,
one single winner seems to emerge: the city; and, it is a matter of size and degree of centrality within
the economic system (Polese, 2009; Rodriguez-Pose and Fitjar, 2013). In fact, large cities have
competitive advantages over other territorial units as far as agglomeration externalities are concerned.
They stimulate frequent face-to-face interactions between a variety of economic agents, favouring
knowledge diffusion and increasing productivity of firms and workers (Puga, 2010). This makes cities
more appealing with respect to surrounding areas, with the result that economic agents tend to
concentrate into cities, further amplifying the effects of agglomeration externalities (Melitz and
Ottaviano, 2008). But, large cities seem to be also better than other territorial units at setting up
international connections (Tylor, 2004). Thanks to concentration of high-skilled workers, productive
firms, and managerial functions, the city may represent the only place able to compete internationally
and exploit global production networks (World Bank, 2009; Kemeny and Storper, 2020).

So, how to stimulate the economic dynamism of places other than large cities? If a lot of emphasis
has been devoted to the idea that economic dynamism would have spread from core economic centres
to peripheries (World Bank, 2009), empirical evidence has demonstrated that actually the reverse is
true, with intermediate and rural areas that have become more and more marginalised as a result of
the increasing concentration of economic activities in core urban centres (McCann, 2008).
Alternatively, a number of interventions have been put in place to directly stimulate the economic
dynamism in intermediate and peripheral areas, most of them concentrating on the buzz option, e.g.
the promotion of industrial districts, clusters, innovative milieus (Camagni, 1993; Cooke et al., 1998;
Stolper and Venables, 2004). In fact, constant interactions among local firms, and between them and
local institutions and universities, would have allowed the diffusion of knowledge, the formation of
scale economies and the generation of social capital and trust, which are all crucial elements to
stimulate the economic dynamism (Gertler, 1995; Rodriguez-Pose and Fijtar, 2013). However, results
have been far from clearly optimistic (Hu, 2007; Tsamis, 2009; Rodriguez-Pose and Comptour,
2012), mainly due to the tough competition from core centres, hard to artificially overcome by
promoting economic agglomeration in absence of critical mass (McCann, 2008; Boschma, 2005).

On the other side, the pipeline option implies stimulating the economic dynamins in intermediate and
peripheral territories by promoting interactions with economic agents located outside the local area
(Rodriguez-Pose and Fijtar, 2013; Burger and Meijers, 2016). In fact, external connections may give
to local economies access to new markets, new sources of knowledge, new technologies, behind
protect them from asymmetric shocks. In line with this view, a number of scholars (e.g. Florida, 2008;
McCann and Acs, 2011; Rodriguez-Pose and Fijtar, 2013) have indicated that embeddedness in inter-
city networks turns out to be even more relevant for economic growth than urban size; in the same
vein, the European Commission (2017) has identified in the external connectivity a crucial driver for
promoting the economic dynamism of inner areas, given that “a well-connected territory offers more
and better possibilities for development […] and a more dynamic labour market” (EC, 2017, p. 3).
This suggests that not only connectivity per se may positively affect the economic performance of
local economies, but also that intermediate and peripheral areas could gain relatively more than core
centres from such a form of economic dynamism (Rodriguez-Pose and Fijtar, 2013; Burger and
Meijer, 2016; Camagni et al., 2016).

 3
With this paper, we aim to empirically investigate whether and to what extent the growth-premium
that local economies gain by being internationally connected to foreign locations only applies to urban
agglomerations, which are broadly characterised by large size – in terms of population –, and
centrality – in terms of location and concentration of core economic functions. Or, alternatively,
external connectivity may represent a viable strategy for marginal locations to step in virtuous
development paths. We do it by exploring a novel hand-collected dataset composed of all Italian
NUTS-3 regions, along a period of nine years (2007-2015). We proxy the local economic dynamism
with the per-capita GDP annual growth rate and draw a comprehensive map of the global
connectivity of Italian NUTS-3 regions, by using data at firm level.2 In fact, a crucial methodological
issue refers to the identification of which actors allow local economies to connect to foreign locations,
given that territories per se do not establish networks (Pumain, 2006; Todeva and Rakhmatullin,
2016). In the current economic system, dominated by GPNs, the natural candidate for promoting
inter-city connectivity are firms that operate internationally, thus acting as knowledge gatekeepers
(Morrison, 2008; Casi and Resmini, 2014; Todeva and Rakhmatullin, 2016; Farole et al., 2017;
Iammarino and McCann, 2018). In fact, MNEs invest in different locations so to access new markets
and to gather resources that are not available locally or too costly to extract, to then use them at home
(Rozenblat, 2010; Ascani et al., 2020). In so doing, MNEs not only stimulate inter-firms interactions
but also allow territories to interact each other. Accordingly, we collect data on all the firms, located
in the Italian province i, which have direct or indirect ownership linkages with foreign firms.3 In so
doing, we are able to accurately characterise the structure of external connectivity of Italy, up to the
NUTS-3 level, also including information on the geographical dispersion and sectoral composition
of networks, besides their intensity. In order to differentiate core and peripheral areas, we make use
of four indicators that take into account different dimensions of marginalization: population size,
degree of urbanization, concentration of managerial functions, and the EU definition of inner areas
(EC, 2017).

Results show that connectivity is relatively more important for small and inner provinces, rather than
for their counterparts, thus sustaining the idea that promoting economic openness is a viable strategy
for relaunching the dynamism of remote and marginal areas. Moreover, connectivity impacts more
on the local economic performance when the external connections are widely spread throughout the
world and when they develop in sectors that guarantee absorption capacity.

This paper contributes to existing literature at least in three ways. First, it enriches the still scant
empirical literature investigating the benefits accruing to local economies by being embedded into
GPNs. In fact, only few studies have attempted to address the above research question at city-level,
with mixed results. Capello (2000) pioneered empirical studies investigating the impact of network
externalities on the city-performance. She used data from the Health City Network of the World
Health Organization and measured performance in terms of successful local policies implemented,
finding a positive correlation between network intensity and city-performance. Neal (2011) showed
that connectivity positively affects employment in a sample of U.S. cities; the author measured
connectivity by using data on airline linkages. Meijers et al. (2016) explored whether city network
connectivity translates into a higher level of urbanization economies, proxied using an indicator of
metropolitan functions. The authors found a positive effect of (inter)national network connectivity.
Pain et al. (2016) studied the effect of connectivity on the economic growth of European and U.S.
cities, with a population of at least 500 thousand inhabitants; however, they did not find significant

2
 Data on aggregated FDI flows at sub-national level (NUTS-3) are not available; thus, papers investigating FDIs at such level of
geographical disaggregation have very often used data at firm level (see Rozenblat and Pumain, 2007; Casi and Resmini, 2014; Farole
et al., 2017). However, authors have demonstrated that firm-level data, when aggregated, provide scenarios very close to those obtained
using official aggregated data (e.g. UNCTAD).
3
 Data are issued by Amadeus dataset that records information about over 20 million companies across Europe and all extra-Europe
firms if linked to EU-based ones.

 4
results across specifications. Ascani et al. (2020) measured the external connectivity of Italian NUTS-
2 regions in terms of ownership linkages between Italian parent companies and their European
affiliates; authors found that connectivity improves the innovation capacity of Italian regions, but
only in sectors where the region is already specialized in. With this paper, we enrich existing literature
by studying the extent to which connectivity improves the economic dynamism of NUTS-3 regions,
also accounting for the networks’ geographical dispersion throughout the world and the degree of
relatedness with the local specialization profile. Second, this paper specifically takes into account
heterogeneities in the effect of external connectivity on the city-level performance, on the basis of a
number of territorial dimensions. Camagni et al. (2016) studied if and how the interplay between
network externalities and city population impacts on urban productivity, by measuring networks in
terms of collaborations in scientific projects. The authors found a negative and significant coefficient
for the interaction term, indicating that smaller cities benefit more than large ones from a more
developed network of long-distance relationships. However, the authors did not investigate
dimensions differentiating cities others than the population size, as we do.4 Third, this paper
contributes to the ongoing debate contrasting successful cities and marginal areas, which is recently
involving both scholars and policy makers (Rodriguez-Pose, 2018; Iammarino et al., 2017; McKay,
2019; Kemeny and Storper, 2020). In particular, the paper provides a novel empirical analysis, at
very disaggregated level, demonstrating that promoting the internationalization of local economic
agents may represent a viable strategy to foster the economic dynamism of intermediate and marginal
territories.

The remaining of the paper is structured as follows: in Section 2 we introduce the data we use in the
empirical analysis, Section 3 presents the methodology, Section 4 comments the results and Section
5 concludes.

2. Dataset

We run the empirical analysis at NUTS-3 level, thus considering the 110 Italian provinces. We believe
this level of disaggregation is essential since more aggregated units would not represent local
economic systems, while hiding potential intra-region disparities (Frenken et al., 2007; Ciani et al.,
2017).

We cover the period 2007-2015; thus, we end up with 990 observations, as we observe 110 provinces
over 9 years. We proxy the dynamism of the local economic system by looking at the per-capita GDP
annual growth rate, which represents the dependent variable in all specifications. Independent
variables are collected yearly at the beginning of each period.5

In order to map the external connectivity of Italian NUTS-3 regions, we use data at firm level under
the idea that networks connecting regional economies are the result of MNEs operations (Rozenblat,
2010; Casi and Resmini, 2014; Todeva and Rakhmatullin, 2016; Bettarelli and Resmini, 2019; Ascani
et al. 2020). In detail, we consider ownership ties between MNEs and subsidiaries, using the

4
 The article by Camagni et al. (2016) analysed heterogeneities in the city-level performance, according to a specific dimension: the
city size; as a result, the authors made direct reference to the borrowied size theory by Alonso (1973). According to Alonso (1973, p.
200) “a small city […] exhibits some of characteristics of a larger one if it is near other population concentrations”. Since then, a vast
literature emerged to empirically test the borrowed size hypothesis (see Phelps et al., 2001; Burger et al., 2015; Meijers and Burger,
2016; Meijers et al., 2016). However, those papers mainly focused on the location of small- and medium-size cities within a region,
and the advantages that such cities gain by being located next to large and dynamic cities. Instead, the present paper differs from the
above literature by considering the overall connectivity of local economies to foreign locations, instead of the location per se, and
dividing local economies according to a number of specific territorial features that go beyond urban size.
5
 By way of example, when we consider year 2007, dependent variable is the GDP growth rate between years 2007 and 2008, while
independent variables are collected at year 2007.

 5
information available in the Amadeus dataset, issued by Bureau van Dick.6 The dataset is particularly
suitable for this type of exercise since it registers firms’ location, sector of activity and financial
records, thus allowing us to draw a comprehensive picture of the external connectivity of Italian
NUTS-3 regions. We consider a number of dimensions related to provinces’ external connections,
that are: intensity, geographical dispersion and the degree of relatedness with the local specialisation
profile.

Intensity brings back to the traditional idea of network externalities, according to which benefits
accruing to networked users increase as much as the number of users increase (Katz and Shapiro,
1985). Accordingly, we define intensity (Intensity) as the number of linkages that connect the Italian
province i to foreign locations. In turn, we define a linkage being equal to one for any ownership tie
between a parent firm and its subsidiary.7 In a general formulation, intensity is computed as follows:

 ! = ∑! + ",$ 0, ∀ ¹ ; (1)

where j and z represent two firms, of which j is located in the Italian province i, while z abroad.

Geographical dispersion indicates how much province i’s external connectivity is geographically
spread throughout the world; this, in turn, may imply a diverse set of externalities accruing to the
networked economies (Coe et al., 2004, 2008). In fact, proximate markets may increase the market
share, while avoiding costs related to entry modes, institutions (Qian et al., 2010; Boschma, 2005);
on the other side, faraway locations ensure to local economies access to new markets, beyond
representing a valuable portfolio strategy against geographically-specific shocks (Hitt et al., 1997;
Nachum et al., 2008).

Operationally, we consider the location of all the foreign firms connected to province i. First, we split
the world in seven macro-regions: Europe (except Italy), North America, South America, Africa,
Oceania, Middle East, Far East; second, we use entropy measures to characterise the intra- and inter-
regions geographical dispersion, where the former refers to dispersion within a macro-region and the
latter between them.

In detail, we define r as one macro-region, the total number of which is R=7, and c a country within
macro-region r. Inter-geographical dispersion is then:
 &
 1
 ! = < !% ln @ A; (2)
 !%
 %'(

where !% is the proportion of the r-th macro-region to total number of linkages of province i. Intra-
geographical dispersion, instead, is defined as:

6
 We focus on linkages between a Global Ultimate Owner (GUO) and its subsidiaries, thus limiting the analysis to vertical ownership
ties only, without considering all direct ownership ties. In fact, global production networks are vertical in nature, since the head of
corporate groups decides which functions have to be de-located and where. However, our strategy may at most underestimate the effect
of external connections. To identify GUOs, we follow the standard definition provided by Amadeus, that is, a minimum percentage of
25% that must characterise the path from a subject company up to the Ultimate Owner.
7
 In order to be consistent with standard definition of network externalities, we measure the intensity in terms of number of firms with
ownership ties, without taking into account their monetary value. This method assumes that FDIs flows depend on the number of firms,
thus potentially underestimating the effect of our measure of intensity, given that we do not consider subsequent investments (Casi and
Resmini, 2014).

 6
&
 %
 1
 ! = < )% ln C % D × < %& ; (3)
 )%
 )∈% %'(

 %
where )% is the proportion of linkages in the c-th country to total number of linkages in macro-region
r, weighted by the relevance of r to the total number of macro-regions (i.e. R).

Relatedness refers to the way external connectivity relates to the local specialisation profile. In fact,
synergy between local know-how and external knowledge ensures absorption capacity (Ascani et al.,
2020). However, if resources brought into the region perfectly mirror the set of local available assets,
then they would not add anything new to the local economy (Boschma and Iammarino, 2009).

In order to compute the network relatedness index (Relatedness), we need to characterise the profiles
of both local specialisation and external connections. To do this, first we consider the following five
macro-sectors: agriculture, capital intensive services, low-capital intensive services, manufacturing
and construction/public-utilities.8 Then, we define the specialisation profile of province i in macro-
sector s as the location quotient (LQ_prov) in terms of absolute employment:

 !+ ⁄∑ !
 _ !+ = (4)
 ∑ + / ∑

Symmetrically, the profile of external connections is computed using the location quotient (LQ_net)
in terms of number of linkages, by province i and macro-sector s:

 !+ ⁄∑ !
 _ !+ = (5)
 ∑ + ⁄∑

As a result, we obtain two vectors – A and B – which represent the profiles of local specialisation and
external connections, respectively. Finally, the network relatedness is defined as the cosine similarity
index between the two vectors (Jaffe, 1993):

 Α∙Β ∑,!'( ! !
 ! = cos = = (6)
 ∥ Α ∥∥ Β ∥
 ^∑,!'( -! ^∑,!'( !-

The index ranges from zero to one, with one indicating similarity, while zero perfect orthogonality.

Controls include a set of determinants of the economic growth at NUTS-3 level, that are, human
capital (HumanCap), i.e. the proportion of people with tertiary education over total population, the
unemployment rate (Unempl), a proxy for the R&D capacity (R&D), i.e. the number of patent
applications, and the labour productivity (Prodty), i.e. gross valued added over total employment.9
We expect that human capital, R&D and productivity exert a positive effect on the local economic
performance, while unemployment negative. Moreover, in all specifications we control for the initial
level of the dependent variable: GDP per capita at time zero.

Then, we include a vector of variables indicating alternative measures of regional openness, which
may contribute to the local economic dynamism. Not considering them may potentially lead to
exaggerate the coefficients related to our connectivity variables, thus causing an omitted variable

8
 We define the five macro-sectors, according to the Nace 2-digit classification provided by Eurostat (Rev. 2).
9
 Source: Eurostat.

 7
bias. To alleviate this issue, we include the following variables: trade, i.e. imports plus exports over
GDP, and participation of Italian NUTS-3 regions into international scientific projects
(Research_project), each of them capturing a different dimension of regional openness. The former
allows us to control for commercial flows, whose impact on the local economic dynamism is very
much related to the direction of the flows and the type of traded goods and services (Bloom et al.,
2016; Coe and Helpmann, 1995; Coe et al., 2009; Keller, 2009). The latter captures the attitude of
the local system to interact with foreign locations for scientific purposes; this, in turn, may bring into
the local economy new knowledge. In order to quantify how much the province i is involved in
international scientific collaborations, we exploit the Cordis dataset, issued by the European
Commission.10

Finally, we build the dummy Island, which is equal to one for provinces with no external connections,
zero otherwise. Beyond providing information about the economic dynamism of networked and not-
networked provinces, the variable Island corrects for potential biases due to the presence of zeros in
some of the variables, as for instance the case of the geographical dispersion, where zero may mean
either no connections at all or no dispersion.

Table A1 and A2, in the Appendix, report the descriptive statistics and the correlation matrix for all
the variables, respectively.

3. Methodology

Empirically, we estimate a number of fixed-effects models of the following shape:

∆ !. = + !. + !. + ! + . + !. ; (7)

where subscripts i and t indicate NUTS-3 regions and time, respectively. Network is a vector
including all the variables related to the province i’s external connectivity, at time t; Control includes
standard determinants of economic growth and previously defined set of controls; finally, ! and .
are province and time fixed effects, respectively. The error term !. is clustered by NUTS-3 region.
The dependent variable is defined as the GDP per capita annual growth rate for each province i,
computed as follows: ∆ !" = ( "#$ − " )⁄ " .

First, we test the validity of our data collection and analyse the effects that independent variables
exert on the local economic performance by estimating a baseline specification, as in eq. (7). Then,
in order to empirically address the main research question of the paper – that is, who gains more by
being internationally connected to foreign locations –, we interact the intensity of external
connections with a set of variables differentiating Italian NUTS-3 regions according to a number of
dimensions (Dim):

∆ !" = + ( !" ∗ !" ) + !" + !" + !" + ! + " + !" (8)

In detail, we consider four different dimensions of marginalisation. First, we include the most
straightforward proxy for the size of a NUTS-3 region, i.e. the absolute population, according to the
view that characterises marginality in terms of lack of critical mass (Rodriguez-Pose and Fitjar, 2013).
Second, we measure the degree of concentration of core economic functions in each Italian NUTS-3
region. Following the Eurostat classification of economic activities, we consider total employment in
Nace Rev.2 classes related to managerial and consultancy activities (i.e. codes 6420, 6430, 6630,

10
 In detail, the dataset registers name, nationality and location of each institution involved in EU funded scientific projects. This
information allows us to accurately locate each research institution and to sum them by Italian NUTS-3 region. In light of the time
period under investigation, we limit to FP7 and H2020 projects that have been funded from 2007 on, but no later than 2015.

 8
7010 and 7022) for each province i at time t, using the Amadeus dataset.11 Third, we analyse the
degree of urbanization of each province i, according to the classification provided by the European
Commission under the label Degurba; the latter classifies all the EU NUTS-3 regions into three
groups: cities, towns/suburbs and rural areas. Fourth, we consider the identification of inner
peripheries issued by the European Commission, under the Proficency project.12 The project defines
an inner area on the basis of three, not mutually exclusive, criteria: (a) enclaves of low economic
potential; (b) areas with poor access to services of general-interest; (c) areas experiencing a lack of
relational proximity. Accordingly, we consider a NUTS-3 region being inner periphery, i.e. a dummy
Inner equal to one, if it suffers from at least one of the above criteria.

For the empirical analysis, all variables have been standardised, with mean equal to zero and standard
deviation equal to one, so to facilitate comparison between explanatory variables.

4. Results

4.1 Baseline results

Table 1 presents results from estimation of eq. (7); all columns include NUTS-3 region and year fixed
effects. Overall, coefficients respect theoretical expectations, thus confirming the quality of data at
disposal. Column (1) includes standard city-level determinants of the economic performance: human
capital, R&D and productivity positively contribute to the GDP per-capita annual growth rate, while
unemployment enters negatively in the regression equation. Particularly relevant is the effect of
human capital, with a standard deviation increase in human capital that leads to 0.305 standard
deviations increase in the GDP per-capita growth rate, almost the double than other independent
variables. This suggests to policymakers that investing in education, as well as attracting high-skilled
people, represent crucial leverages to stimulate the economic dynamism at local level (REF?). The
negative coefficient for the initial level of the GDP per-capita indicates patterns of convergence
among Italian NUTS-3 regions (Bettarelli and Resmini, 2019).

From column (2) on, we include variables related to the external connectivity of Italian NUTS-3
regions. The coefficients associated with the intensity of external connections remain positive,
significant, large in magnitude and stable across specifications, indicating that the more connected a
region is, the more dynamic its economic performance, all the rest being equal. This remains true
even when we include other variables capturing the degree of external openness of each Italian
province (column 4), i.e. trade and participation in scientific projects. Nevertheless, the involvement
in scientific projects proves to be the most relevant determinant of the local economic dynamism,
further corroborating the idea that policymakers should contribute to accumulating knowledge at local
level. As far as the geographical distribution of networks is concerned, coefficients in columns (3)
and (4) indicate that the local economic dynamism is positively affected by networks which are
geographically spread throughout the world, rather than those that develop within macro-regions.
This suggest that external connectivity is more effective in stimulating the local economic dynamism
when it either assures to local economies access diverse markets or protects regions from asymmetric
shocks, or both. Anyway, the positive and significant coefficient associated with the relatedness
variable indicates that networks need to display characteristics complementary to the one of the
regions, in order to allow regions to benefit from external knowledge, a result not new in the literature
(Ascani et al., 2020). Finally, the dummy island shows that networked regions perform better than
isolated ones.13

11
 In detail, we download information about all the firms operating in the following Nace Rev.2 sectors: 6420, 6430, 6630, 7010 and
7022. Then, we extract employment data for all those firms and aggregate them for each Italian NUTS-3 region.
12
 PROFECY project – Inner peripheries: national territories facing challenges of access to basic services of general interest.
13
 Note that the VIF test does not detect any issue of multi-collinearity, being below 3 in all the specifications.

 9
However, at this stage we are not able to say anything about who gains more from being connected
to foreign locations; in other words, we cannot say if coefficients associated with network’s variables
are homogeneous across subgroups of NUTS-3 regions, or not. The next subsection will be devoted
to addressing this research question.
Table 1: Baseline regression results
 (1) (2) (3) (4)
 DGDPpc DGDPpc DGDPpc DGDPpc
 HumanCap 0.305** 0.321** 0.260** 0.242*
 (0.131) (0.133) (0.125) (0.127)
 Unempl -0.185* -0.172* -0.160* -0.169*
 (0.095) (0.095) (0.095) (0.093)
 R&D 0.115* 0.116* 0.097* 0.095*
 (0.069) (0.070) (0.057) (0.056)
 Prodty 0.138* 0.136* 0.134* 0.121*
 (0.077) (0.077) (0.077) (0.068)
 GDPpc -0.386*** -0.390*** -0.395*** -0.397***
 (0.034) (0.035) (0.035) (0.035)
 Intensity 0.324*** 0.270*** 0.269***
 (0.099) (0.096) (0.088)
 Geo_intra 0.015 -0.000
 (0.070) (0.068)
 Geo_inter 0.098* 0.092*
 (0.057) (0.055)
 Relatedness 0.069** 0.057*
 (0.031) (0.030)
 Scientific_project 0.383**
 (0.161)
 Trade 0.154**
 (0.072)
 Island -0.132** -0.131**
 (0.056) (0.056)
 Obs. 990 990 990 990
 R-squared [within] 0.520 0.523 0.525 0.543
 NUTS-3 regions dummies Yes Yes Yes Yes
 Time dummies Yes Yes Yes Yes
 Standard errors clustered by province in parenthesis. Dependent variable: DGDPpc = ( !"# − ! )/ !
 *** p
get bigger in terms of population. Interesting, external connectivity proves to be much more relevant
for small and medium-size locations, the highest coefficient being the one associated with the NUTS-
3 regions in the 10th percentile of the population distribution, whose coefficient is the 40% higher
than that of regions in the 90th percentile. In other words, connectivity appears to benefit relatively
more small than large cities, thus representing a potential tool to stimulate the economic dynamism
in the former group of NUTS-3 regions.

Table 2: Size regression results
 Population percentiles .1 .25 .5 .75 .9
 (1) (2) (3) (4) (5)
 DGDPpc DGDPpc DGDPpc DGDPpc DGDPpc
 HumanCap 0.280** 0.280** 0.280** 0.280** 0.280**
 (0.131) (0.131) (0.131) (0.131) (0.131)
 Unempl -0.156* -0.156* -0.156* -0.156* -0.156*
 (0.093) (0.093) (0.093) (0.093) (0.093)
 R&D 0.093* 0.093* 0.093* 0.093* 0.093*
 (0.056) (0.056) (0.056) (0.056) (0.056)
 Prodty 0.210* 0.210* 0.210* 0.210* 0.210*
 (0.111) (0.111) (0.111) (0.111) (0.111)
 GDPpc -0.382*** -0.382*** -0.382*** -0.382*** -0.382***
 (0.033) (0.033) (0.033) (0.033) (0.033)
 Intensity 0.405*** 0.390*** 0.368*** 0.336*** 0.291***
 (0.106) (0.105) (0.103) (0.102) (0.101)
 GEOintra -0.057 -0.057 -0.057 -0.057 -0.057
 (0.066) (0.066) (0.066) (0.066) (0.066)
 GEOinter 0.097* 0.097* 0.097* 0.097* 0.097*
 (0.057) (0.057) (0.057) (0.057) (0.057)
 Relatedness 0.069** 0.069** 0.069** 0.069** 0.069**
 (0.029) (0.029) (0.029) (0.029) (0.029)
 Scientific_project 0.312* 0.312* 0.312* 0.312* 0.312*
 (0.159) (0.159) (0.159) (0.159) (0.159)
 Trade 0.144** 0.144** 0.144** 0.144** 0.144**
 (0.073) (0.073) (0.073) (0.073) (0.073)
 Island -0.129** -0.129** -0.129** -0.129** -0.129**
 (0.056) (0.056) (0.056) (0.056) (0.056)
 Obs. 990 990 990 990 990
 R-squared [within] 0.546 0.546 0.546 0.546 0.546
 NUTS-3 regions dummies Yes Yes Yes Yes Yes
 Time dummies Yes Yes Yes Yes Yes
 Standard errors clustered by province in parenthesis. Dependent variable: DGDPpc = ( !"# − ! )/ !
 *** p
variable. Then, the impact of external connectivity slightly decreases as much as the amount of core
economic functions in a region increases, with a maximum variation of the 7.9%. Even if less
heterogeneous, results corroborate the idea that promoting external connectivity may represent an
effective strategy to boost the dynamism in economically marginal locations.

Table 3: High_function regression results
 High_function percentiles .1 .25 .5 .75 .9
 (1) (2) (3) (4) (5)
 DGDPpc DGDPpc DGDPpc DGDPpc DGDPpc
 HumanCap 0.270** 0.270** 0.270** 0.270** 0.270**
 (0.122) (0.122) (0.122) (0.122) (0.122)
 Unempl -0.154* -0.154* -0.154* -0.154* -0.154*
 (0.092) (0.092) (0.092) (0.092) (0.092)
 R&D 0.116* 0.116* 0.116* 0.116* 0.116*
 (0.068) (0.068) (0.068) (0.068) (0.068)
 Prodty 0.126* 0.126* 0.126* 0.126* 0.126*
 (0.069) (0.069) (0.069) (0.069) (0.069)
 GDPpc -0.382*** -0.382*** -0.382*** -0.382*** -0.382***
 (0.033) (0.033) (0.033) (0.033) (0.033)
 Intensity 0.369*** 0.369*** 0.367*** 0.360*** 0.342***
 (0.101) (0.101) (0.101) (0.100) (0.099)
 GEOintra -0.093 -0.093 -0.093 -0.093 -0.093
 (0.068) (0.068) (0.068) (0.068) (0.068)
 GEOinter 0.092* 0.092* 0.092* 0.092* 0.092*
 (0.058) (0.058) (0.058) (0.058) (0.058)
 Relatedness 0.070** 0.070** 0.070** 0.070** 0.070**
 (0.028) (0.028) (0.028) (0.028) (0.028)
 Scientific_project 0.278* 0.278* 0.278* 0.278* 0.278*
 (0.147) (0.147) (0.147) (0.147) (0.147)
 Trade 0.155** 0.155** 0.155** 0.155** 0.155**
 (0.073) (0.073) (0.073) (0.073) (0.073)
 Island -0.133** -0.133** -0.133** -0.133** -0.133**
 (0.056) (0.056) (0.056) (0.056) (0.056)
 Obs. 990 990 990 990 990
 R-squared [within] 0.547 0.547 0.547 0.547 0.547
 NUTS-3 regions dummies Yes Yes Yes Yes Yes
 Time dummies Yes Yes Yes Yes Yes
 Standard errors clustered by province in parenthesis. Dependent variable: DGDPpc = ( !"# − ! )/ !
 *** p
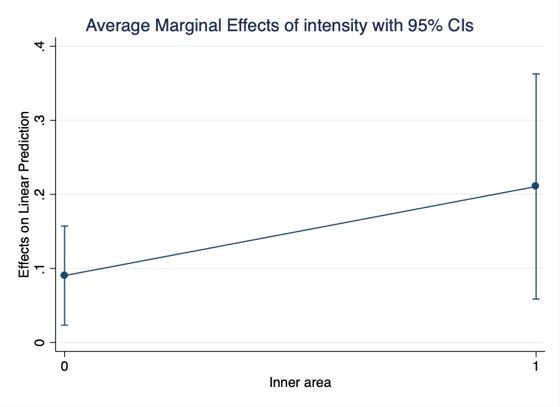
of three, not mutually exclusive, criteria: (a) enclaves of low economic potential; (b) areas with poor
access to services of general-interest; (c) areas experiencing a lack of relational proximity.
Accordingly, we construct a dummy variable inner which is equal to one if the Italian NUTS-3 region
suffers from at least one of the above criteria, and we do interact this variable with the intensity of
external connections.

In fig. 2, we plot the average marginal effect and results strengthen previous findings. Territories
defined as inner areas gain relatively more than other locations, once again suggesting to
policymakers that promoting the economic openness of marginal regions represent a potential
pathway out from economic marginality, as already noted by a number of authors (Rodriguez-Pose
and Fitjar, 2013; Camagni et al., 2016).
 Fig. 1: Degurba categories; Average marginal effects Fig. 2: Inner area categories; Average marginal effects

5. Conclusions

This paper attempts to empirically test if external connectivity may represent a tool to boost the
economic dynamism of areas, which are marginal in terms of size and degree of centrality in the
economic system. In fact, a harsh debate is nowadays spreading amidst scholars, policymakers and
the public opinion about left-behind territories and what to do to stimulate their economic dynamism.
Recent political events, from Brexit to the success of populistic parties throughout the world, have
demonstrated that not considering the fate of marginal areas with appropriate measure may cause
serious issues for the stability of a country or a macro-region as a whole.

We specifically focus on external connectivity as a pathway out from marginality for small and
remote local economies.15 A number of scholars recently noted that in the current economic system,
dominated by global production networks, connectivity to foreign locations may represent the most
relevant driver for the local economic dynamism (van Meerten et al., 2016; Crescenzi and
Iammarino, 2017). Other authors suggested that external linkages may provide for the lack of
agglomeration economies, thus contributing to fostering the economic dynamism of small and
intermediate locations (Rodriguez-Pose and Fitjar, 2013; Camagni et al., 2016). In the same vein, the
European Commission (2017) highlighted that external connectivity helps inner areas to step in
virtuous development paths, insomuch as it brings new knowledge into the local economy and makes
the labour market more dynamic. As a result, if the literature generally agrees upon the fact that
external connectivity contributes to enhancing the performance of local economies (Neal, 2011;
Meijers et al., 2016; Ascani et al., 2020), this may be even more relevant in the case of marginal and
small territories.

15
 Nevertheless, we recognize that other measures, which focus on alternative instruments – e.g. agglomeration economies –, may bring
to successful outcomes, too.

 13
With this paper, we empirically analyse (i) the effect that connectivity to foreign locations exert on
the local economic performance, measured as the annual GDP per-capita growth rate and (ii) if
baseline results prove to be homogenous across subgroups of regions, defined according to a set of
territorial dimensions; or, alternatively, if connectivity improves the performance of marginal
territories relatively more than core economic centres. We do it by exploring a novel hand-collected
dataset composed of the 110 Italian NUTS-3 regions, across the period 2007-2015. In order to map
the external connectivity of each NUTS-3 region, we make use of data at firm level; in detail, we
consider all the firms located in province i, which have direct or indirect ownership connections to
foreign firms. To address the main research question of the paper – that is, who gain more by being
connected to foreign locations - we account for different dimensions of territorial marginalisation:
size, urbanization, concentration of core economic functions and the definition of inner areas issued
by the European Commission.

We disclose interesting results, the most relevant of them being that, regardless of the way we
characterise the degree of marginalization of each Italian NUTS-3 region, marginal areas gain
relatively more than core economic centres by being connected to foreign locations through inter-
firms linkages. This is particularly true when we define marginalization in terms of lack of critical
mass (i.e. population, urbanization and inner areas); instead, it is less evident when we focus on the
degree of centrality in the economic system (i.e. concentration of core economic functions). Other
results suggest that external connectivity more effectively stimulates the economic performance of
regions when it is geographically spread throughout the world – thus favouring the access to diverse
markets and protecting local economies from asymmetric shocks –, and when local economies
guarantee a certain degree of absorption capacity, measured in terms of relatedness between networks
and local specialization profiles. Among other drivers of the economic performance, the accumulation
of knowledge turns out to be the more relevant one, both when it originates from education and
scientific collaborations.

The paper enriches the still scant literature empirically investigating how the participation in global
production networks affects the performance of a local economy with an analysis at very
disaggregated level that takes into account various dimensions of the external connectivity: intensity,
geographical dispersion and the relatedness with the local specialisation profile. Then, it further
extends that literature by considering heterogeneities in the effects that connectivity exerts on the
city-level performance. Specifically, we consider four variables that divide NUTS-3 regions
according to specific territorial dimensions, potentially characterizing the degree of marginality.
Finally, it contributes to the ongoing debate about how to stimulate the economic dynamism of
marginal areas, by indicating to policymakers that promoting the economic openness of local agents
represent an effective pathway out from marginality.

Out of the goal of this paper, but important to understand, is the analysis of inter-regions spillover
effects that may spread from one region to another. This refers to benefits that a region gains from
external connectivity that may partially spillover to other contingent regions, thus further amplifying
the positive effects generated by external connections. Further research may shed light on this point.

 14
References

Artelanis P, Arvenitidis P, Petrakos G (2006), Theoretical and methodological study on dynamic
growth regions and factors explaining their growth performance. Work Package 1 document.

Arthur B (1994) Increasing returns and path dependence in the economy. The University of Michigan
Press, Ann Arbor

Ascani A., Bettarelli L., Resmini L., (2020), “Global networks, local specialisation and regional
patterns of innovation”, Papers in Evolutionary Economic Geography (PEEG), No 2002, Utrecht
University, Department of Human Geography and Spatial Planning, Group Economic Geography

Bathelt H., Malmberg A., Maskell P. (2004), Clusters and knowledge: local buzz, global pipelines
and the process of knowledge creation, Progress in Human Geography, 28: 31-56.

Bathelt, 2007, “Buzz-and-pipeline dynamics: towards a knowledge-based multiplier model of
clusters” Geography Compass 1 1282-1298.

Becattini G. (1975), Invito alla rilettura di Marshall, introduzione a A. e M. P. Marshall, Economia
della produzione, a cura di G. Becattini, Milano, Isedi, 1975a, pp. ix-cxiv.

Betteralli L., Resmini L. (2019), “What facilitates connections between regions? An empirical
analysis based on Italy-Germany networks”, paper presented at 59th ERSA Conference, Lione 27-30
August.

Bloom N., Draca M. and Van Reenen J., (2016), Trade induced technical change? The impact of
Chinese imports on innovation, IT and productivity. Review of Economic Studies 83(1), 87-117.

Boschma R. A. and Iammarino S., 2009. Related variety, trade linkages and regional growth in Italy.
Economic Geography, 85(3), 289-311.

Boschma, R. A. (2005), Proximity and innovation: A critical assessment, Regional Studies, 39(1),
pp. 61–74.

Burger M.J. and E.J. Meijers (2016), Agglomerations and the rise of urban network externalities,
Papers in Regional Science, 95, 1

Camagni R (1993) From city hierarchy to city network; reflections about an emerging paradigm. In:
Lakshmanan TR, Nijkamp P (eds) Structure and change in the space economy: Festschrift in honour
of Martin Beckmann. Springer, Berlin

Camagni R, Capello R (2015) Second-rank city dynamics: Theoretical interpretations behind their
growth potentials. European Planning Studies 23: 1041–1053

Camagni R, Capello R, Caragliu A (2016) Static vs. dynamic agglomeration economies: Spatial
context and structural evolution behind urban growth. Papers in Regional Science

 15
Capello R. (2000), The city network paradigm: Measuring urban network externalities, Urban
Studies, 37: 1925-1945.

Ciani et al. (2017), Local labour market heterogeneity in Italy: estimates and simulations using
responses to labour demand shocks, Bank of Italy

Casi L. and L. Resmini (2014), Spatial complexity and interactions in the FDI attractiveness of
regions, Papers in regional science.

Coe N., Dicken P. and Hess M., 2008. Global production networks: realizing the potential. Journal
of Economic Geography 8, 271-295.

Coe N.M., Hesse M., Yeung H., Dicken P, Henderson J. (2004), Globalizing regional development:
A global production networks perspective, Transactions of the Institute of British Geographers, 29:
468-484.

Coe D. and Helpman E., (1995). International R&D Spillovers, European Economic Review, 39, 859-
887
Coe D., Helpman E., and Hoffmaister A.W., (2009). International R&D spillovers and institutions.
European Economic Review 53(7), 723-741.

Cooke, P., Uranga, M. G. & Etxebarria, G. (1998) Regional systems of innovation: An evolutionary
perspective, Environment and Planning A, 30(9), pp. 1563–1584.

Crescenzi, R. and Iammarino, S. (2017) Global investments and regional development trajectories:
the missing links. Regional Studies, 51(1): 97-115.

European Commission (2017) Competitiveness in low-income and low-growth regions. The lagging
regions report. Brussels, 10.4.2017 SWD(2017) 132 final.

Farole T., Hallak I., Harasztosi P., Tan S. (2017), Business environment and firm performance in
European Lagging Regions, Policy Research Working Paper n.8281, World Bank

Feldman M.P. (2000), Location and innovation: the new economic geography of innovation,
spillovers and agglomeration, in Clark G.L., Feldman M.P. and Gertler M.S. (Eds) The Oxford
Handbook of Economic Geography, pp. 373-394, Oxford University Press.

Florida R (2008) Who’s your city? How the creative economy in making where to live the most
important decision of your life. Basic Books, New York

Foxon T.J. (2014), "Technological lock-in and the role of innovation," Chapters, in: Giles Atkinson
& Simon Dietz & Eric Neumayer & Matthew Agarwala (ed.), Handbook of Sustainable
Development, chapter 20, pages 304-316, Edward Elgar Publishing.

Frenkel K., van Oort F.G., Verburg T. (2007), Related variety, unrelated variety and regional
economic growth, Regional Studies, 41 (5): 685-697.

Gertler, M. S. (1995) Being there: Proximity, organization, and culture in the development and
adoption of advanced manufacturing technologies, Economic Geography, 71(1), pp. 1–26.

 16
Glaeser E.L. (2011) The Triumph of the City: How Our Greatest Invention Makes Us Richer, Smarter,
Greener, Healthier, and Happier. Harmondsworth: Penguin.

González, S. 2011. The North/South divide in Italy and England: Discursive construction of regional
inequality, European Urban and Regional Studies, 18(1): 62-76.

Hitt M.A., Hoskisson R.E., Kim H. (1997), International diversication: effects on innovation and firm
performance in product-diversified firms, Academy of Management Journal 40 (4): 767-798.

Hu, A. G. (2007) Technology parks and regional economic growth in China, Research Policy, 36(1),
pp. 76–87.

Iammarino, S, A Rodríguez-Pose, and M Storper (2017), "Why regional development matters for
Europe's economic future", Directorate-General for Regional and Urban Policy working paper
07/2017, European Commission.

Iammarino S., A. Rodriguez-Pose, M. Storper (2018), Regional inequality in Europe: evidence,
theory and policy implications, WP18.17 Papers in Evolutionary Economic Geography, Utrecht
University

Inomata S. (2017), Analytical frameworks for global value chains: An overview, in IBRD/World
Bank, Measuring and Analyzing the Impact of GVCs on Economic Development, Global Value
Chain Development Report, Ch. 1: 15-36.

Jacobs J (1969) The economy of cities. Random House, New Yo

Jaffe A., Henderson R. and Trajtenberg M., 1993. Geographic Localization of Knowledge Spillovers
as Evidenced by Patent Citations. Quarterly Journal of Economics, 108, 577-598
Katz M., Shapiro C. (1985), Network Externalities, Competition, and Compati- bility. The American
Economic Review, 75 (3): 424-440.

Keller W., 2004. International technology diffusion. Journal of Economic Literature 42(3), 752-782.

Kemeny T. and M. Storper (2020), Superstar cities and left-behind places: disruptive innovation,
labor demand, and interregional Inequality. Working Paper (41). International Inequalities Institute,
London School of Economics and Political Science, London, UK.

Lucas, R.E. (1988), ‘On the mechanics of economic development’, Journal of Monetary Economics,
22, 3–42.

Marshall A (1920 [1890]) Principles of economics. Macmillan and Co, London

McCann, P. (2008) Globalization and economic geography: The world is curved, not flat, Cambridge
Journal of Regions, Economy and Society, 1(3), pp. 351–370.

McCann P, Acs ZJ (2011) Globalization: Countries, cities and multinationals. Regional Studies 45:
17–32

McKay L. (2019), Left Behind people, or place? The role of local economies in perceived community
representation, Electoral Studies (60).

 17
Melitz, M. and Ottaviano, G. I. P. (2008) Market size, trade and productivity, Review of Economic
Studies, 75(1), pp. 295–316.

Morrison A., 2008. Gatekeepers of knowledge within industrial districts: Who they are, how they
interact. Regional Studies 42(6), 817-835.

Neal Z. (2011), The causal relationship between employment and business neworks in U.S. cities,
Journal of Urban Affairs, 33 (2): 167-184 OECD (2013), Intercon- nected economies: benefitting
from Global Value Chains, OECD: Paris.

OECD (2008) OECD Science, Technology and Industry Outlook 2008 (Paris: OECD).

Pain K., Van Hamme G., David Q. (2016), Global networks, cities and economic performance:
Observations from an analysis of cities in Europe and the USA, Urban Studies, 53 (6): 1137-1161

Petrakos G, Arvanitidis P, Pavleas S (2007) Determinants of economic growth: the experts’ view.
Working Paper. DYNREG. http://www.esri.ie/research/current_research_projects/dynreg/ papers/

Polese, M. (2009) The Wealth and Poverty of Regions: Why Cities Matter (Chicago, IL: University
of Chicago Press).

Porter M.E. (1990), The competitive advantage of nations, Harvard Business Review.

Porter, M. (1998), On Competition: Competing across Locations, Cambridge, MA: Harvard Business
School Press.

Puga D. (2010) The magnitude and causes of agglomeration economies, Journal of Regional Science,
50(1), pp. 203–219.

Qian G., Khoury T. A., Peng, M. W., Qian, Z. (2010), The performance implications of intra and
interregional geographic diversification, Strategic Management Journal, 31 (9): 1018-1030.

Romer PM (1986) Increasing returns and long-run growth. Journal of Political Economy 94: 1002-
1037

Rodriguez-Pose, A. & Comptour, F. (2012) Do clusters generate greater innovation and growth? An
analysis of European regions, Professional Geographer, 64(2), pp. 211–231.

Rodríguez-Pose A. and R.D. Fitjar (2013), Buzz, Archipelago Economies and the Future of
Intermediate and Peripheral Areas in a Spiky World, European Planning Studies, 21:3, 355-372, DOI:
10.1080/09654313.2012.716246

Rodríguez-Pose, A. and Fratesi, U. (2007) Regional business cycles and the emergence of sheltered
economies in the southern periphery of Europe. Growth and Change, 38: 621-648.

Rodriguez-Pose A. (2018). The revenge of the places that don’t matter (and what to do about it).
Cambridge Journal of Regions, Economy and Society, 11(1):189–209.

Rozenblat C. (2010), Opening the black box of agglomeration economies for measuring cities
competitiveness through international firm networks, Urban Studies, 47: 2841-2865.

 18
You can also read