Joint Negotiating Committee for Local Authority Craft and Associated Employees - East Midlands Councils
←
→
Page content transcription
If your browser does not render page correctly, please read the page content below
Joint Negotiating Committee for Local
                  Authority
     Craft and Associated Employees
           Trade Union side: Unite, GMB

     Secretary: Ian Woodland           Chair: Andy Jones
     Unite                             Unite
     Unite House                       Leeds City Council
     128 Theobald’s Road               Unite Office
     Holborn                           Civic Hall
     London WC1X 8TN                   Leeds LS1 1UR

Joint Negotiating Committee for Local Authority Craft and Associated
            Employees: Trade Union side pay claim 2020

                                                            October 2019

                                                                       1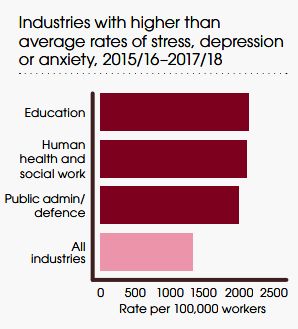
1. INTRODUCTION
The Red Book agreement provides an important framework for regulating the pay, terms
and conditions of a key section of Local Government workers and TUPE transferred staff.
The craft trade unions are unanimous in our defence of the JNC agreement as the national
agreement that applies to the unique working environment of craft workers. These workers
undertake skilled work, which is both physically demanding and carries a high safety risk,
therefore requiring a unique collective negotiating structure.
For the agreement to continue to be effective and relevant, however, both remuneration
and terms and conditions need to be comparable with other collective industry agreements.
If rates of pay continue to lag behind those paid to similarly skilled tradespeople in the
private sector, this will undermine Local Government’s ability to undertake high quality craft
work.
Low pay rates affect recruitment and retention, contribute to skills shortages and create
problems with staff morale and productivity.
Due to a decade of low pay awards workers covered by the JNC have seen their pay rates
fall by around 22% since 2010. This situation cannot continue.
For these reasons the joint trade unions are submitting the following claim:
A 10% pay rise for all Craft JNC employees (regardless of job title and
designation) whose rate of pay is higher than the minimum salaries set out in the Craft
JNC 2018-20 pay agreement circular (dated 10 April 2018), but is still contractually
linked to the annual settlement reached by the Craft JNC.
The uprating of the minimum rates for Craft workers employed directly on JNC
grades, benchmarked against average Craft pay rates within local authorities, and
industry level collective agreements.
A one day increase to all paid annual leave entitlement set out in the Red Book
A two hour reduction in the standard working week as set out in the Red Book
A comprehensive joint national review of the workplace causes of stress and
mental health throughout local authorities
A significant increase in tool allowance and insurance payments
Commitment to the continuation of the Red Book agreement
22. CONTEXT OF OUR CLAIM
Within this years ‘Workforce Focus1 report the LGA recognised that: ‘Local government
needs a suitably skilled, well-motivated and engaged workforce that meets the changing
needs of its residents to continue its work through challenging times.’
Paying staff properly and investing in career development will help deal with recruitment
and retention issues and deliver improved public services and better outcomes for service
users.
We understand that councils across the country are having to make difficult decisions on a
daily basis, trying to balance budgets during a time when funding has been slashed. Local
government has endured central government funding cuts of nearly 50% since 2010.
Between 2010 and 2020, councils will have lost 60p out of every £1 they have received from
central government.
The 2019 LGA survey of council finances found that 1 in 3 councils fear they will run out of
funding to provide even their statutory, legal duties by 2022/23. This number rises to almost
two thirds of councils by 2024/2025 or later. The LGA estimates councils will face a funding
gap of £8 billion by 2025.
Responsibility has to lie with the government over their failure to provide adequate funding
for councils and the communities that they provide for. Funding for this pay rise must come
from central government, and we recognise that central government has made significant
local government revenue funding cuts that were specifically linked to its pay cap policy in
previous years.2 Having claimed that austerity is over and that the pay cap policy has been
lifted, we believe that Ministers have a moral obligation to increase funding to local
government, including in connection with pay.
However, the Comprehensive Spending Review has now been delayed until 2020 due to
Brexit uncertainty. In previous years the LGA has said it would wait to see what settlement it
would get. In the political climate, which is unlikely to settle down in the near future, it
would not make sense to wait and we urge our employers to meet our claim as soon as
possible.
All political parties now agree public services need greater investment. Among the general
public, two in three now want the government to increase spending on public services
(Ipsos MORI poll, October 2018). But even with public opinion clearly turning against
austerity, the so called ‘end of austerity’ must mean more than just words.
1
https://www.local.gov.uk/workforce-focus
2 See HM Treasury Written Ministerial Statement on RDEL Revisions, 08 December 2011
https://hansard.parliament.uk/Commons/2011-12-08/debates/11120856000020/RDELRevisions; and the Treasury’s later
statement to GMB that in the 2013 and 2015 Comprehensive Spending Review the assumption that pay awards would be
limited to 1% ‘was included in these departmental allocations at the outset’
https://static1.squarespace.com/static/58b828f44402436b74624b8a/t/59b6af5d2278e7557ed6c1c1/1505144781989/PAY
+PINCH+REPORT+2+-+FINAL+SPREADS.pdf
33. ECONOMIC BACKGROUND
3.1. Inflation rates compared to Craft JNC pay increases
The global financial crisis was not caused by local government building workers. The Trade
Union Side refuses to accept that, more than a decade on from the banking crash, our
members should continue to pay the price.
We appreciate the fact that the last two year pay settlement did deliver above-inflation pay
rises for low paid workers. However, that settlement only recovered limited ground
compared to the sharp real-terms cuts to pay experienced by the local government
workforce since 2009.
Historically, periods of wage constraints have been followed by periods of ‘catch-up’ in line
with their trend level in subsequent years.3 The alternative is a permanent devaluation of
wages in local government.
Price changes to commodities that make up the RPI over the year to August 2019 are shown
in the table below:
Table 1: RPI figures by division
Item Average % increase to August 2019
Travel and leisure 3.0
Alcohol and tobacco 2.9
Housing and household expenditure 2.3
Personal expenditure 3.5
Consumer durables 2.7
Food and catering 2.3
All goods 2.0
All services 3.7
All items 2.6
Source: Office for National Statistics, Consumer Price Inflation Reference Tables, September 2019
Within these figures, some costs are rising significantly faster, such as electricity bills at
9.3%, gas bills at 3.2%, water and other charges 3.1%, Fares and other travel costs at 6.4%,
council tax and rates at 4.7%, clothing and footwear at 4.9% and telephone services at 4.4%.
The price of housing also remains one of the biggest issues facing employees and their
families. Across the UK, house prices rose by 1.4% in the year to March 2019 alone4 and
have risen 37% between 2010 and 2018 (see table 3 below). The average house price in
3 Monitor, Closing the NHS funding gap: how to get better value health care for patients, 09 October 2013, page 3
https://assets.publishing.service.gov.uk/government/uploads/system/uploads/attachment_data/file/284044/ClosingTheG
ap091013.pdf
4 UK House Price Index, March 2019
https://www.ons.gov.uk/economy/inflationandpriceindices/bulletins/housepriceindex/march2019#strongest-english-
growth-in-the-north-of-england-and-midlands
4England and Wales is now £302,1225. Northern Ireland experienced the biggest increase at
3.5%6, followed by Scotland at 3.3%7, Wales at 3%5 and England at 1.1%.5
Transport costs have risen significantly above reported inflation (measured against both the
RPI and the CPI). On average, local bus fares have risen by an estimated 37% in England and
by an estimated 31% in Wales since 2010, as measured by the Department for Transport’s
own index (estimates are higher when long distance services are included – please see
below).8 Regulated rail fares (a category which includes almost all commuter costs) have
risen by an average of 36% over the same period.9
Average private rents have risen by £1,900 a year compared to 201010 significantly
outstripping wages and inflation with the national cost of renting from a private landlord
having risen to a record high of £51.6bn from just £20.3bn in 200611. Private rental prices
have not grown as quickly as housing costs overall, but the average monthly rent for new
tenancies in the UK nonetheless picked up 2% over the last year to reach £936.
Though not specifically included in inflation measures, childcare costs represent a key area
of expenditure for many staff (42% of local government workers have at least one
dependent child in their household)12. Therefore, it is also worth noting that the annual
Family & Childcare Trust survey for 2019 found that the cost of a nursery place for a two-
year-old has risen by 4% since last year, with the annual cost of 25 hours care per week
hitting £6,465.
Current inflation rates can mask longer term changes in the cost of living that have taken
place since 2010. The examples below show major increases in core costs that have
surpassed average prices increases over the period.
Table 2: Examples of core price rises
Expenditure item House prices Bus & coach fares Electricity Childcare
Price rise 2010 -18 37% 51% 48% 32%
5 England and Wales House Price Index, April 2019 https://lsl-assets.s3.amazonaws.com/lslps/uploads/media_file/EW-
House-Price-Index-April-2019.pdf
6 Northern Ireland House Price Index, Q1 2019 http://www.ninis2.nisra.gov.uk/InteractiveMaps/People and Places/Housing
and Households/NIHPI/atlas.html
7 Scotland House Price Index, March 2019 https://lsl-assets.s3.amazonaws.com/lslps/uploads/media_file/YM-SCOT-House-
Price-Index-May-2019.pdf
8 Department for Transport, Local bus fares index by metropolitan area status and country: Great Britain, updated 20 June
2019 https://www.gov.uk/government/statistical-data-sets/bus04-costs-fares-and-revenue
9 GMB calculations based on regulated fare cap figures recorded in Table A5 of the House of Commons Library Briefing
Paper, Railways: fares statistics, 30 November 2018
https://researchbriefings.parliament.uk/ResearchBriefing/Summary/SN06384
10 English Housing Survey 2017 to 2018: headline report, MHCLG, 31 January 2019,
https://www.gov.uk/government/statistics/english-housing-survey-2017-to-2018-headline-report
11 https://inews.co.uk/opinion/spiralling-rents-show-housing-market-crisis-can-fixed-radical-action/
12 GMB analysis of Quarter One 2019 Labour Force Survey data.
53.2. Inflation forecasts
The Treasury average of independent forecasts and the OBR’s last forecast state that RPI
inflation will average 2.7% and 2.8% respectively over 2020. It will then run at 3% or above
every year until 2023, following the pattern shown in table 4 below.
These annual rates show the rate at which pay rises would be needed for wages just to
maintain their current value.
Table 3: Forecast annual increase in cost of living (RPI)
Source: HM Treasury, Forecasts for the UK Economy May 2019 and OBR, Economic and Fiscal
Outlook, March 2019
If these rates turn out to be correct, the cost of living the JNC Craft workforce faces will have
grown by over 15% between 2019 and 2023, following the pattern set out in table 5 below:
Table 4: Forecast cumulative increase in cost of living
Source: HM Treasury, Forecasts for the UK Economy May 2019 and OBR, Economic and Fiscal
Outlook, March 2019
6The Trade Union Side feels that our claim is a relatively modest start to the process of
reversing the significant real cuts in pay Craft JNC workers have experienced.
3.3. Average pay settlements
Pay settlements in the private sector have been running far in advance of the public sector
since 2010. While the pay freeze was in place across the public sector, the private sector
saw average rises of around 2.5%, and the private sector continued to outpace the public
sector by at least double the public sector rate during the ensuing period of the 1% pay cap.
Since 2018, the gap has been closing and table 2 below shows the latest average
settlements across a variety of sectors:
Table 5: Latest pay settlements from LRD pay line
For the three months up to and including:
2018 2019 This pay
round,
Jul Aug Sep Oct Nov Dec Jan Feb Mar Apr May Jun Aug-May
All
2.7 2.0 2.1 2.0 3.4 3.5 2.8 2.8 2.8 2.8 2.8 2.8 2.7
agreements
Private sector
2.8 2.7 2.7 3.0 3.4 3.4 2.8 2.8 2.8 2.7 2.8 2.8 2.8
Public sector
2.2 1.0 1.5 1.5 3.5 3.5 2.3 2.5 2.5 3.0 3.0 3.0 2.0
Manual
2.8 2.8 2.8 3.3 3.5 3.5 2.9 2.9 2.9 2.7 2.8 2.8 2.9
Non-manual
2.5 1.8 2.0 2.0 3.3 3.3 2.8 2.8 2.8 2.7 2.7 2.7 2.5
All industries
3.0 3.0 3.0 3.0 3.0 2.8 2.7 2.6 2.7 2.8 2.9 2.8 2.8
All services
2.6 1.8 2.0 2.0 3.5 3.5 3.0 3.0 3.0 2.8 2.8 2.8 2.5
Source: LRD Workplace Report, July 2019
3.4. Average earnings growth
Table 3 below shows trends in average earnings growth over the last two years. The
acceleration of the general rate to 3.5% by the end of 2018 and into early 2019 took average
earnings growth to its highest level in over a decade.
As in the case of pay settlements, a gap between public and private rates has been a
sustained feature of the economy, reflected in the fact that there have only been two
months in the entire period since April 2013 when private sector earnings growth has not
been running ahead of the public sector.
The end of the public sector pay cap saw the gap narrowing, though it has reasserted itself
over recent months, with private sector earnings now rising at 3.2% compared to 2.5% in
the public sector.
7Table 6: Average Earnings
Growth
Source: Office for National Statistics, Labour Market Overview UK, May 2019
Table 7: Average weekly earnings broken down by sector (seasonally adjusted)
Total Pay (including
Regular Pay %
Bonuses) %
July 2019
3 month 3 month
Single month Single month
average average
Whole economy 4.2 4.0 3.7 3.8
Private sector 4.2 4.1 3.8 3.9
Public sector 3.7 3.7 3.2 3.5
Public Sector excluding financial services 3.7 3.7 3.3 3.5
Services 4.4 4.2 3.8 4.0
Finance and business services 5.3 5.3 4.4 4.6
Manufacturing 2.0 2.4 2.3 2.4
Construction 7.0 6.2 5.5 5.3
Wholesale, retailing, hotels & restaurants 2.9 2.8 3.1 3.2
Source: ONS UK Labour Market Statistical Bulletin, September 2019
Forecasts of average earnings predict that growth will average 3% in 2020 and then run in
excess of 3% over the following three years, as per the pattern below.
8Table 8: Forecast average earnings growth
Source: HM Treasury, Forecasts for the UK Economy May 2019 and OBR, Economic and Fiscal
Outlook, March 2019
In other words, a significant above inflation pay rise is required to address local government
workers’ fall in living standards since 2010 and to avoid suffering damage to recruitment
and retention.
4. JNC CRAFT PAY - A FAIR AND DECENT PAY RISE
The key factor in attracting high quality new entrants into the local government building
service sector and retaining existing skills is to offer an attractive pay and terms and
conditions package. Unfortunately, this has not been the case.
The punitive public sector pay cap and rapidly rising inflation has had a deep impact on
workers standard of living in local authorities. Many workers on Red Book rates have
suffered a real terms loss of earning of 22% on the 2009/10 rates. Cumulatively that means
that those workers have missed out on thousands of pounds in their pocket. For workers on
higher rates pegged to the Red Book the figures would be even higher.
For too many years JNC pay rates have been left to whither on the vine and for many
councils they have become far removed from the reality of craft rates of pay. The Trade
Union side recognises that in many local authorities craft pay is now set through locally
agreed pay rates and in all cases that the Trade Union side are aware of these are
significantly higher than the rates within the Red Book.
According to analysis from Unite the lowest rate for craft pay ranges from £3,000 to £9,000
higher than the Building Labourer rate, while the Engineering and Electrician rate are in
some cases between £15,000 and £20,000 higher.
9It is clear then that the current minimum rates within the agreement need to be
substantially refreshed to make them meaningful to craft workers within local authorities.
4.1. JNC pay rates and low pay
Across the political spectrum there is growing consensus for the need for a £10 an hour
minimum wage as a common sense solution to the unsustainable problem of topping up low
pay via tax credits - a cost to the Treasury that has now ballooned to £30bn a year.
Since May 2018, Labour Party policy has been to establish £10 an hour as the minimum
wage for all workers, regardless of age. The Conservative Party has made it plain that it is
considering setting two-thirds of average earnings as the next target for the National
Minimum Wage, with a recent pledge to rise it to £10.50 in the next 5 years.
There is also good reason to call on the Government to fund a local authority pay rise.
Analysis by the IPPR, found that 43% of the cost of raising public sector pay would be
returned to the Treasury through taxation and lower social security costs.13
The current rates within the JNC all amount to significantly less than £10 an hour. The union
side believe that Craft pay rates must be set significantly higher than the statutory wage
floor for unskilled roles.
Table 9: JNC pay rates
JNC Grades Hourly pay Weekly pay Annual pay rate
rate 2019 rate 2019 2019
1 Building Labourer £9.18 £339.66 £17,711
2 Heating & Ventilation Mate £9.36 £346.45 £18,065
3 Building Craft Operative £9.36 £346.45 £18,065
4 Plumber £9.55 £353.37 £18,426
5 Engineer & Electrician £9.74 £360.45 £18,795
4.2. Comparing to Construction Industry rates
The JNC Craft agreement rates of pay also do not compare well with those in the
construction industry. For example, in the Construction Industry Joint Council (CIJC) them
minimum hourly rate for craft workers is currently £12.67 per hour while in the major
electrical and mechanical agreement, the Joint Industry Board (JIB), the minimum rate for
an approved electrician is £16.77 per hour with overtime rates at time and a half and double
time. The recently negotiated rate of pay for the plumbing trade sees the basic rate of pay
for a plumber/gas fitter increase to £13.29 per hour in January 2019. Each of these rates
place the JNC rates into perspective amounting to between 55% and 65% of the industry
craft agreement minimum rates.
The rates of pay across the major agreements in the sector have included recent pay rises
far in excess of those agreed in the JNC over recent settlements. The CIJC rose by 2.9% in
June 2019, and the JPMES rate is increasing by 8.45% to between 2018 and 2020, with the
13IPPR, Uncapped Potential: The Fiscal and Economic Impact of Lifting the Public Sector Pay Cap, November 2017,
https://www.ippr.org/files/2017-11/uncapped-potential-november2017.pdf
10JIB rate rising by 8.25% over the same period. Any analysis of these rates clearly illustrates
that the JNC agreement reflects the lowest level of pay for construction tradespersons in
the UK.
The JNC rates already lag behind the wider industrial rates paid in the sector. This is set to
worsen with the already widely known sector skills shortage being influenced by Brexit
looming with the very real potential to limit the pool of workers that is available to the
wider construction sector (the construction sector is more reliant on EU nationals’ labour
than the average for all industries).14 In addition, an increased focus on the housebuilding
sector across the UK and the ability of local authorities to be involved in alleviating the
housing crisis will further exacerbate the shortage of craft persons available.
If we consider this alongside the historic failure of the construction industry sector to train a
sufficient level of apprenticeships across the whole of the UK, including all areas of the
construction and built environment, both public and private, the damaging spectre of
recruitment and retention problems for Local Government building departments become
easily identifiable.
The trade union side demands that employers commit to valuing the very resource that
supports the success of the authorities in providing valuable public services. The attraction
of workers to enter into the skilled trades in local government will be pressurised further
should rates continue to weaken against the growing influence of the construction sector
which will be further boosted by investment in major capital projects, such as HS2, and
Hinkley.
The UK government is placing a real strategic interest in the sector shown by the recent
sector deal announcement as part of the UK Industrial Strategy and it is vital that this years’
negotiations see a substantial increase in skilled workers pay to prevent any skills shortage
arising. This would enable local government to continue to deliver and increase new build
housing alongside repairs and maintenance services. Any negotiated settlement must take
into account the need for parity with workers in similar occupations within the industry and
recognise that JNC rates are the lowest in the sector.
The Trade Union side is therefore seeking a fair pay increase that recognises that the last
settlement only began to remedy the years of financial hardship suffered by building
workers post financial crisis.
The offer should also ensure no widening of the differential between Craft, General
Operative and Apprentices. The offer needs to far exceed recent settlements, catch up with
other industrial agreements, and recognise that the industrial success of companies
depends on attracting high quality workers. Any offer also needs to recognise the financial
14
See ONS, One and three digit industry data, UK, 2018, data produced in response to a user request
submitted by GMB, 01 May 2019
https://www.ons.gov.uk/employmentandlabourmarket/peopleinwork/employmentandemployeetypes/adhoc
s/009906oneandthreedigitindustrydatauk2018
11hardship suffered by Local Government craft workers as a result of the pay freeze and pay
restraint over the previous decade referenced earlier in this document.
The Trade Union side is therefore seeking:
A 10% pay rise for all Craft JNC employees (regardless of job title and
designation) whose rate of pay is higher than the minimum salaries set out in the
Craft JNC 2018-20 pay agreement circular (dated 10 April 2018), but is still
contractually linked to the annual settlement reached by the Craft JNC.
The uprating of the minimum rates for Craft workers employed directly on
JNC grades, benchmarked against average Craft pay rates within local authorities,
and industry level collective agreements.
5. RED BOOK TERMS AND CONDITIONS
5.1. Pay related conditions
Union members report attacks on overtime, allowances, standby payments, annual leave,
sick pay and weekend working, while many have mentioned that their roles have been
downgraded through restructuring and many employers have continued to use unpaid shut
down days over Christmas or other public holidays.
Unite’s recent survey highlighted examples of standby payments frozen for many years with
members not receiving any increases alongside the annual pay award. Unite members have
reported standby payments frozen for between 6 and 10 years in some places. There are
even reports of management avoiding paying standby altogether.
5.2. Sickness, stress and absences
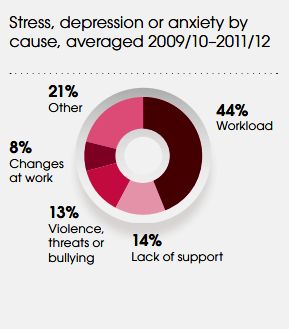
The UK is suffering from an epidemic of stress and anxiety. Work-related stress, depression,
and anxiety now account for 57% of all sick days15. 15.4 million working days were lost due
to work-related stress, depression or anxiety in 2017/18. One in four sick days in the UK is
the result of workload16 – the biggest single cause of sick leave by some distance.
Analysis by the Health and Safety Executive (HSE) of Labour Force Survey statistics shows
that this is an acute issue within local authority services with human health and social work,
public administration and education all accounting for the highest levels of average rates of
stress, depression or anxiety.17
15http://www.hse.gov.uk/statistics/causdis/stress.pdf?utm_source=govdelivery&utm_medium=email&utm_campaign=dig
est-8-nov-18&utm_term=report&utm_content=stress-stats
16http://www.hse.gov.uk/statistics/causdis/stress.pdf?utm_source=govdelivery&utm_medium=email&utm_campaign=dig
est-8-nov-18&utm_term=report&utm_content=stress-stats
17 http://www.hse.gov.uk/statistics/overall/hssh1718.pdf
12Table 10: Stress, depression or anxiety
Source: ONS Labour force survey
This is recognised in union surveys, for example in the recent Unite survey 75% of members
reported experiencing work-related stress in the last 12 months, and 61% said that stress
was one of issues they were most concerned about at work (second only to pay).
64% of respondents to GMB’s 2019/20 members’ survey said that they were stressed at
work. Respondents who said they stressed a work further rated their stress levels at an
average level of 6.5 out of ten. 5% of local government workers report that they were made
ill by their work in the last year, above the average for other employees.18
Sickness absence levels can be seen as a proxy indicator for the wellbeing of staff and this
has been recognised by the LGA in its Workforce Focus report19.
This highlights that:
• On average in 2016/17, 4.3% of days were lost due to sickness and 8.7 days per FTE
employee.
• By comparison in 2015/16, 4.9% of days were lost due to sickness and 8.8 days per
FTE employee.
• The earliest available comparable figures are for 2011/12 when on average 4.2% of
days was lost, 8.4 days per FTE employee.
• The most common cause of sickness absence in 2016/17 was ‘stress, depression,
anxiety, mental health and fatigue’ (28.9% of days lost).
18
Compared to an average of 4.2% for all workers. GMB analysis of Quarter One 2019 Labour Force Survey
data.
19 https://www.local.gov.uk/sites/default/files/documents/11%20170%20Workforce%20Focus_03_web.pdf
13Across the whole economy, as a rough comparison the average number of days lost per FTE
in 2018 across the whole economy was 4.1. This means that local authority sickness rates
are over double those for the economy as a whole.
In contrast to local authority statistics, the Labour Force Survey shows that economy-wide
sickness absence has broadly been falling over the last two decades.
Table 11: Number of days lost through sickness per worker, 1993 to 2017, UK
Source: Labour Force Survey person datasets, ONS
The 2017 Stevenson / Farmer review of mental health and employers20 for the government
found that the cost of poor mental health to Government is between £24 billion and £27
billion which includes the costs of providing benefits, falls in tax revenue and costs to the
NHS. One of its core recommendations to employers is for them to “provide employees with
good working conditions and ensure they have a healthy work life balance and opportunities
for development”
The Trade Union Side therefore calls for a comprehensive joint national review of the
workplace causes of stress and mental ill health throughout local authorities.
5.3. A culture of long hours
The negative impacts of long hours and high workloads are well documented. Long hours
can lead to serious and long term mental and physical ill health, stress, fatigue and increases
in workplace accidents21. For example researchers that studied22 the work habits of more
than 600,000 people in the US, UK, and Australia, found that people who work more than 55
hours a week are 33% more likely to suffer a stroke and have a 13% greater risk of heart
attack than those who work 35-40 hours weekly.
20https://assets.publishing.service.gov.uk/government/uploads/system/uploads/attachment_data/file/658145/thriving-at-
work-stevenson-farmer-review.pdf
21 http://www.hse.gov.uk/research/hsl_pdf/2003/hsl03-02.pdf
22 https://www.thelancet.com/journals/lancet/article/PIIS0140-6736(15)60295-1/fulltext
14Research also shows the impact that long hours can have in decreasing productivity within
organisations23, lowering morale and leading to increased staff turnover24.
In contrast studies have found that reducing working time and taking holidays is extremely
good for morale and health - it can even prolong lives25. Researchers who studied 974
vacationers from the Netherlands discovered that even planning for a holiday makes people
happier before they go26. Researchers have also shown that more time off improves
productivity and is therefore good for employers and the economy as a whole.27
Reducing working time has wider societal benefits too. It give staff more time to contribute
to society, supporting family and friends, volunteering or getting more involved in the wider
community or politics. The New Economics Foundation (NEF)28 has pointed to studies that
show that reducing working time is also better for the environment29 and good for gender
equality given women shoulder more than 60% of unpaid work30.
Working time practices and norms have not stayed static over time, and it is right that they
should be reviewed and updated. NEF modelling has shown that UK working time has
lagged behind long term national trends over recent years. If average hours had continued
to fall at post-war levels after 1980, then the UK should be on target to reach a 30-hour
working week by 204031.
The Global Workforce Happiness Index32 that studies workplace wellbeing also found that
the top ten countries make work-life balance a priority with employers enacting strategies
to ensure their staff achieve this.
The economy is rapidly changing as is evidenced by a recent report from the ONS that
illustrated the threats automation poses to workers33, particularly women workers. Staff
side unions believe that automation needs to deliver for ordinary people and that reducing
working time without loss of pay is a crucial part of the necessary response to increased
automation and digitalisation of the economy – an issue that the LGA and local authority
employers have been actively exploring in recent years34.
Yet union surveys highlight that 10 years of austerity is taking a huge toll on local authority
staff with low pay settlements, expanding responsibilities and redundancies leading to
increased workloads and a culture of long hours.
23 http://ftp.iza.org/dp8129.pdf
24 https://www.employment-studies.co.uk/system/files/resources/files/352.pdf
25 https://www.eurekalert.org/pub_releases/2018-08/esoc-tav082318.php
26 https://link.springer.com/article/10.1007%2Fs11482-009-9091-9
27 https://hbr.org/2015/06/are-we-more-productive-when-we-have-more-time-off
28 https://neweconomics.org/2018/11/five-reasons-why-nef-supports-the-4-day-week-campaign
29https://www.researchgate.net/publication/323366145_Working_hours_and_carbon_dioxide_emissions_in_the_United_
States_2007-2013
30https://www.ons.gov.uk/employmentandlabourmarket/peopleinwork/earningsandworkinghours/articles/womenshould
ertheresponsibilityofunpaidwork/2016-11-10
31 https://neweconomics.org/2019/03/average-weekly-hours-fell-faster-between-1946-and-1979-than-post-1980
32 https://universumglobal.com/insights/global-workforce-happiness-index-2/
33https://www.ons.gov.uk/employmentandlabourmarket/peopleinwork/employmentandemployeetypes/articles/whichocc
upationsareathighestriskofbeingautomated/2019-03-25
34 https://www.local.gov.uk/our-support/workforce-and-hr-support/workforce-videos/working-digital-council-video
15Mass redundancies have inflicted misery on the workers who lost their jobs, and also on
their families. It has also led to an explosion of pressure on the remaining workers who are
constantly expected to do ‘more with less.’ Measures that were supposed to reduce the
impact of cuts to funding and staffing levels have not delivered. A recent academic study
found that the move to shared services did not cut the cost of delivery. It has however left
many of our members with higher workloads, more complex duties, and longer commutes.
For example in Unite’s recent all members’ survey:
• 54% of members reported frequently or always working more than their contractual
hours. That included nearly a quarter who “always” did, while a further 30% said that
they did so “sometimes”.
• 32% reported working more than 4 hours extra a week including 10% that worked
more than 8 hours extra. A further 23% worked between 2 and 4 hours extra a week
and 25% said that they regularly worked up to 2 hours extra a week.
• Only 17% of Unite members reported receiving overtime rates for these additional
hours with 25% reporting that they were all completely unpaid.
• 75% of Unite members reporting experiencing work-related stress in the last 12
months.
• Over 50% of members rated morale in their workplaces as either “bad” or “terrible”
as opposed to only 11% that thought it was “good” or “excellent”.
A GMB study found that local government workers are significantly more likely to work
unpaid overtime compared to those in other occupations.35 An updated analysis, based on
the latest available figures, produced similar results: 28% of local government workers
normally work unpaid overtime, according to the Labour Force Survey, compared to 15% of
all employees. The average local government worker who worked unpaid overtime
contributed an additional 6.2 hours per week.36
It should be noted that even these figures may represent an underestimate. GMB asked NJC
workers in its 2019/20 members’ survey if they regularly worked unpaid overtime: nearly
half (48%) said that they did. The NHS Staff Survey also reports higher rates of unpaid
overtime working than the Labour Force Survey.
Unpaid overtime is being worked on an industrial scale. It represents an enormous goodwill
contribution by a workforce that is approaching its breaking point. The Trade Union Side
strongly believes that workers should be paid for all the hours they work. If full-time local
government workers who regularly work unpaid overtime were remunerated for their
additional hours, they would be due an immediate pay rise of 25%.37
35
Civil Service World, Civil servants ‘work more unpaid overtime than private sector staff,’ 25 July 2017
https://www.civilserviceworld.com/articles/news/civil-servants-%E2%80%98work-more-unpaid-overtime-
private-sector-staff%E2%80%99
36
GMB analysis of Quarter One 2019 Labour Force Survey data.
37
Illustrative calculation based on a local government worker who works 37 paid hours per week and 6.2
additional unpaid hours, compared to if those additional hours had been paid on time and a half.
16The Trade Union Side is therefore seeking:
A one day increase to the minimum paid annual leave entitlement set out in the
Red Book
The Trade Union side is seeking an increase of 1 annual leave day to the current holiday
entitlement. It is proposed by the trade union side that this be taken to coincide with
International Workers’ Memorial Day on 28th April, or the closest Monday if the 28th falls
on a Saturday or Sunday. This would enable local authority craft workers to pay tribute to
the many workers across the construction sector that have lost their lives in the course of
their daily duties.
A two hour reduction in the standard working week set out in Green Book with no
loss of pay
The Trade Union side are proposing a reduction of the working week from the current 36
hours in London and 37 hours in the rest of the UK, to 35 hours, without detriment. There
has been no change in working hours since 1999 and bringing this group of workers in line
with the average working week in the UK of 35 hours, is long overdue.
By supporting a reduction in working hours in the JNC Craft agreement employers would be
supporting a model of working that promotes a work–life balance, comprising the following
elements:
commitment to improving the organisation of work by each level of management,
from supervisor to chief executive, union representatives and all grades of staff;
understanding what the concepts of productivity and profitability, job security, job
satisfaction and working time mean for management, unions and workforce;
trust, which is built by working in partnership to identify and solve problems jointly;
representation from all groups of staff who will be affected;
involvement, through the widest possible consultation, so that staff have the
opportunity to contribute to solutions;
listening to aspirations and expectations;
considering ideas seriously – recognising that every idea, including the ones you
don't like, needs to be examined;
transparency, by keeping staff fully informed;
testing solutions – it is usually best to test new practices through a voluntary pilot
study during which employees can to revert to existing terms and conditions if they
wish;
action on possible solutions rather than shelving the issue until it is too late;
Instilling confidence in a positive outcome.
5.4. Exit payments
The Trade Union Side is also extremely concerned about the planned attack on our
members’ terms and conditions in the form of the Treasury’s proposal to cap exit payments
at £95,000. If implemented, the Treasury’s flawed regulations will have a particular negative
effect on local government workers due to its inclusion of strain costs in the cap’s
calculations. As the LGA has calculated, a long-serving female member of the Local
17Government Pension Scheme who earns £23,500 a year and is made redundant above the
age of 54 could be capped.
The effects of the cap will be on low to middle paid workers will be multiplied with each
year that passes due to the non-inclusion of an index link to a £95,000 figure that has not
changed since 2015. The proposed cap in 2019 is already effectively worth £85,000
compared to its value in 2015.
Table 12: Forecast real value of the unindexed cap (£000s)38
2015 2016 2017 2018 2019 2020 2021 2022 2023
RPI 95 93.3 90.1 87.2 84.7 82.4 80.0 77.6 75.3
CPI 95 94.3 91.9 89.6 87.8 86.1 84.5 82.8 81.2
If pensions are a form of deferred pay then it is likely that implementation of the cap will
give rise to demands for higher uplifts to regular pay and allowances in the future.
In the view of the Trade Union Side, this planned central government interference – which
rides roughshod through past collective agreements – makes a mockery of Ministers’ claims
that they play no role in the setting of local government workers pay and terms and
conditions. Consequently, in our view, the fact that the draft regulations have been brought
forward strengthens the case for the provision of additional central funding to help meet
the costs of this claim.
In addition, we believe that the Government's continued 'pause' in the redistribution of
excess monies generated by the cost cap mechanism in the Local Government Pension
Scheme in the wake of the McCloud judgement undermines government assurances and
collective bargaining principles, and represents a further blow to the real take home pay of
our members in local government. We further believe that the 'pause' is further evidence
that Ministers continue to play an active role in the setting of pay and terms and conditions
in local government.39
5.5. Job losses
Across the UK, an estimated 876,000 jobs have been lost in local government since June
2010 – a reduction of 30%. Local government has arguably been hit by more severe job
losses than any other part of the public sector. But conversely, there has been no decrease
in the statutory functions of local authorities - with many of these services seeing a
significant increase in demand over the same period (children’s services, adult social care
services and homelessness support). In addition, redundancy payments have cost councils
an estimated £4 billion in England alone.40
38 https://www.gmb.org.uk/sites/default/files/exit-cap-consultation-response.pdf
39 For more information see: https://www.gmb.org.uk/news/court-ruling-means-government-should-pay-24-billion-back-
public-sector-workers
40 The Guardian, Redundancies have cost English councils £4bn since 2010 – study, 13 September 2018
https://www.theguardian.com/society/2018/sep/13/councils-in-england-spend-4bn-on-220000-redundancies-since-2010
18Table 13: UK local government employment (headcount)41
This loss of staffing, budgets and increased demand means that local services are suffering.
For those staff who remain (predominantly women), this has increased workloads, pressure
and stress - all against the backdrop of ever shrinking real-terms pay.
With considerably fewer workers to provide local services, local government staff deserve a
pay rise that reflects the massive increase in their productivity. Those workers left behind
are attempting to pick up the workloads of former colleagues, as well as do their own work
on declining pay and conditions.
5.6. Recruitment and retention
Recruitment and retention is a key priority for councils. As of 2017/18, 78% of councils are
experiencing recruitment and retention difficulties, with 10% feeling forced to enact a
recruitment freeze at some point during 2017/18 (LGA workforce survey 2017/18). This
issue is particularly acute for a variety of professional and specialist roles, including social
work, planning and building control.
Successive workforce surveys conducted by the LGA make it apparent that pressures are
rising. Although there are discontinuities in the data series, it is clear that the trend is
towards pressures returning to or even exceeding pre-crash levels.
Local authorities’ reported average vacancy rate of 8% (rising to 9.5% for unitary
authorities) is significantly higher than the averages for wider public sector and in the
economy as a whole.
41ONS, Public sector employment quarterly estimates, December 2018 data
https://www.ons.gov.uk/employmentandlabourmarket/peopleinwork/publicsectorpersonnel/datasets/publicsectoremplo
ymentreferencetable
19Table 14: LGA reported recruitment and retention measures
[Note – the 2010/11 survey no longer appears to be online]
Vacancy rate Turnover Councils experiencing
rate recruitment difficulties
2008 - 12 83
2009 10 11 52
2011/12 4.5 13.1 -
2012/13 6.5 11.4 -
2013/14 8.2 11.9 74
2014/15 7 13 -
2015/16 5.4 13.2 71
2016/17 8.9 13.4 74
2017/18 8 13.4 78
Brexit is also having an impact on the labour market. Around half of councils have noticed a
recent reduction in the number of EU/EEA nationals applying for posts or leaving the
organisation. As employers across the economy are reporting a similar impact the labour
market is likely to tighten and local government employers need to meet our claim to
ensure that they remain competitive.
The growing and widespread use of agency workers to fill gaps comes at a hefty cost to the
public purse - with council’s already heavily dependent on temporary workers. During the
last ten years, agency staff in some London boroughs have comprised up to a quarter of the
total headcount.
With many local government workers approaching retirement, there is a genuine concern
over how councils will attract the next generation of young council staff if pay remains low
compared to similar jobs in the rest of the public or even in the private sector.
Meeting the Trade Union Side’s pay claim this year will encourage workers to apply and
remain in post. With the general unemployment rate in the UK economy at its lowest level
in 44 years, employers reporting that they are experiencing the strongest growth in
recruitment pressures since 2001,42 and vacancies escalating across the economy,
competitive wages are becoming ever more crucial.
5.7. Tool allowances and tool insurance
Due to the increase in the cost of tools and as more craft workers are undertaking bolt-on
skills, they need access to a wider range of tools. The Trade Union side is therefore calling
for a significant increase in tool allowance so that it doubles from the current rate and
properly reflects the prohibitive cost to building workers to replace tools on a like for like
basis when required. Councils must realise that ensuring building workers have the correct
tools to complete works supports the efficiency and productivity of the services provided.
42 Bank of England Agents’ scores, recruitment difficulties measure.
20Trade union members are reporting that both the wage levels currently paid and the
allowances for tools is woefully inadequate and means that providing tools is done at the
workers’ expense. All craft workers should be eligible for a fair level of tool allowance and
insurance and a consistent rate should be introduced for all including those occupations that
are currently excluded, such as roofers and scaffolders. The trade union side is further
calling for a tool insurance policy where all tools are replaced on al like for like basis.
6. CONTINUATION OF THE RED BOOK
The Trade Union side believes that maintaining the Red Book remains the only way to
effectively guarantee that the vast number of employment matters, specific to local
authority craft workers is addressed in a standardised manner within this specific context.
Examples are: tool allowances, working at heights, payment for work in discomfort and
inconvenience, abnormal working time, extra payments for continuous extra skill or
responsibility and provisions for apprentices and young trainees.
The existence of a separate national agreement and pay and conditions bargaining
arrangement for Craft and Associated Employees is due to the widely accepted view that it
is the most efficient way to address the distinct employment conditions of these workers. As
a consequence of this distinction, the ‘comparators’ for Craft and associated employees are
similar workers in the private sector construction industry.
7. CONCLUSION
Local government craft workers face immense pressure – ever increasing workloads,
deteriorating pay and conditions, and persistent job insecurity. Against the odds, they have
delivered efficiency savings year-on-year, but we have reached the limit of what can be
squeezed from an exhausted and demoralised workforce.
Paying local government staff properly makes economic sense. It is an investment in both
local services and the local economy. It is also unsustainable to continue to subsidise
employers who pay lower wages through income support measures such as tax credits.
The Trade Union Side believes our claim is just and fair. Craft workers should and must get
the decent and fair pay rise that they need and deserve.
We expect the LGA to enter into meaningful negotiations with us on our claim. We are
concerned that their engagement with us on collective bargaining has deteriorated in recent
years and has not always been in keeping with Labour Relations (Public Service) Convention,
1978 (No.15). This convention promotes collective bargaining for public employees, as well
as other methods allowing public employees’ representatives to participate in the
determination of their conditions of employment. It also provides that disputes shall be
settled through negotiation between the parties or through independent and impartial
machinery, such as mediation, conciliation and arbitration…’
21INVESTING IN THE JNC CRAFT WORKFORCE IS MONEY WELL SPENT
22You can also read