Cycling & Walking Investment Strategy - Report to Parliament Moving Britain Ahead
←
→
Page content transcription
If your browser does not render page correctly, please read the page content below
Cycling & Walking Investment Strategy
Report to Parliament

Moving Britain Ahead

CP194                         February 2020

February 2020
Cycling and Walking
    Investment Strategy
    Report to Parliament

                Presented to Parliament
         by the Secretary of State for Transport
              by Command of Her Majesty

                     February 2020

CP 194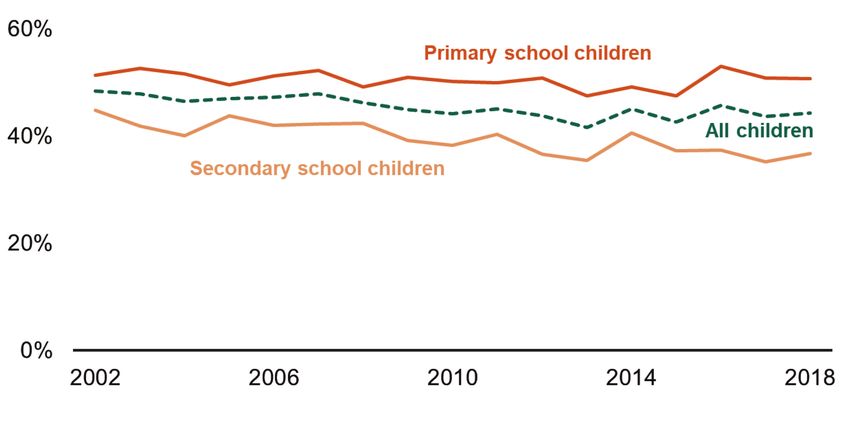
© Crown copyright 2020

This publication is licensed under the terms of the Open Government Licence v3.0
except where otherwise stated. To view this licence,
visit nationalarchives.gov.uk/doc/open-government-licence/version/3.

Where we have identified any third party copyright information you will need to obtain
permission from the copyright holders concerned.

This publication is available at www.gov.uk/official-documents.

ISBN 978-1-5286-1676-8

CCS1019352508              02/20

Printed on paper containing 75% recycled fibre content minimum

Printed in the UK by the APS Group on behalf of the Controller of Her Majesty’s
Stationery Office
Contents
Foreword 4
1. Introduction 6
The Cycling and Walking Investment Strategy 6
2. Achievements 9
Overall progress 9
Action plan 9
3. Funding 22
Allocations and expenditure 22
4. Working across government 25
5. The Impact on Cycling & Walking - Statistical Analysis 28
Walking Activity 28
Cycling Activity 30
Walking to School 32
Cycle Ambition Cities 33
Road safety for pedestrians and cyclists 34
6. Impact of programmes 37
Progress toward CWIS aims and targets 37
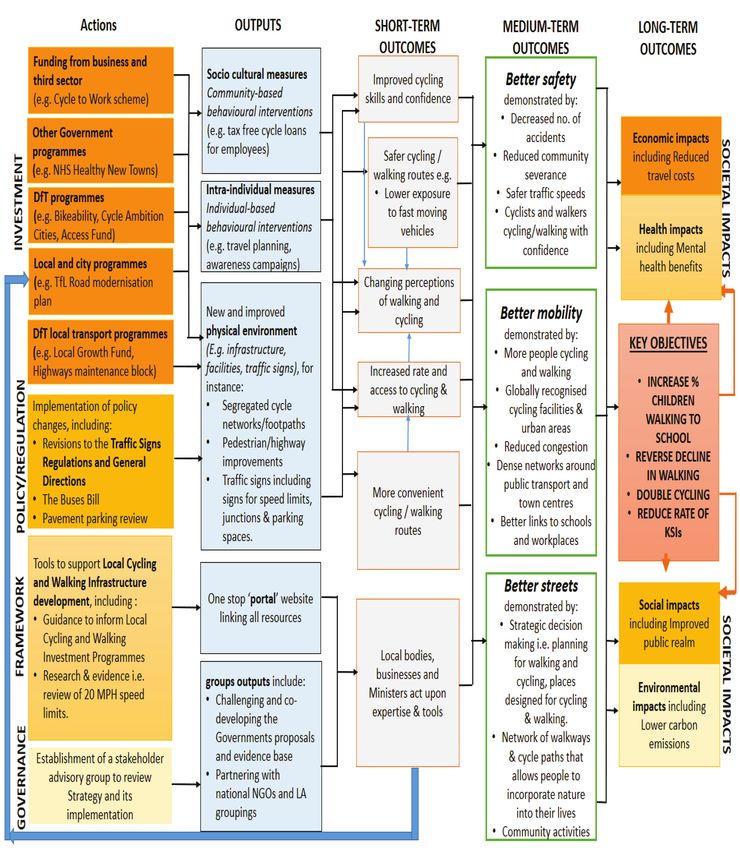
Overall theory of change 38
Monitoring and evaluation 39
Cycling and waking case studies 41
Use of the CWIS models 41
Supplementary benefits 41
7. Other developments 42
CWIS Safety Review 42
Cycling and walking safety rapid evidence assessment 43
National Cycle Network (NCN) 43
e-cargo bikes / last mile delivery 43
Road Safety Statement 44
Future of Mobility: Urban Strategy 44
3
Foreword

       Air quality, carbon emissions, health and wellbeing, congestion on our roads are all
       serious issues facing our society today. A common thread is that investment in
       cycling and walking can improve them all. Whether you are commuting to work, going
       to the shops or visiting friends and family, our aim is for active travel to play a part in
       your journey, a small step - or revolution of the wheel - that helps create places
       where we want to live and work.

       In April 2017, the first ever statutory Cycling and Walking Investment Strategy
       (CWIS) set out ambitious plans to make cycling and walking the natural choices for
       short journeys, or as part of a longer journey, by 2040. Interest from metro mayors
       and local councils has been so great that £1.2 billion has already been invested 1 and
       a further £1.2 billion is projected over the next two years 2 for infrastructure and other
       active travel projects. This is double the projected level of spend envisaged in 2017
       and increases spending in England, outside London, from £3.50 per head to over
       £10 per head, a further increase from our last published figures in February 2019. 3

       This is the first report to Parliament on progress in delivering CWIS. It sets out what
       has been achieved by this investment and how it is helping to deliver your
       Government's aims and targets. Some highlights include:

       •    The flagship £191 4 million Cycle Ambition Cities programme has seen some
            significant increases in active travel on key routes across eight cities. The
            investment has increased cycling volumes by between 12-69% between 2012-
            17 5.

       •    The £50 million Bikeability training programme has helped hundreds of thousands
            of school children per year to cycle safely and with confidence on England's
            roads. 2018/19 was a record year with 411,000 school children trained.

       •    The £80 million "Access Fund" has seen 25 local authorities engage with their
            communities to help people walk or cycle to places of work and education. A
            highlight has been the "Walk To" project. This supported 95 employers and

1
  Estimated spend 2016/17 to 2018/19.
2
  Projected spend 2019/20 to 2020/21.
3
  Compares average spend per head over SR15 period against SR10 period.
4
  £191m provided in total 2013-17. Total funding £210m from 2013 to 2019, including National Parks funding.
5
  Cycle Ambition Cities Interim Report, TfQL, 2019.

                                                                  4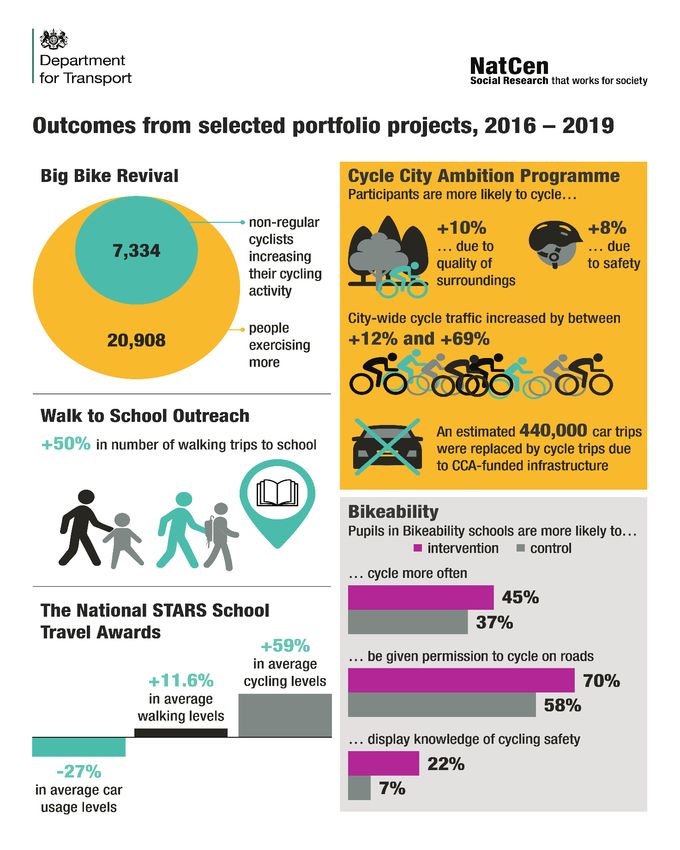
reached over 1,300 employees each year with the aim of increasing the number
               of people choosing to walk for all or part of their daily commute and make walking
               a natural part of their working day.

          •    A £2 million package of support has helped 46 local authorities prepare "Local
               Cycling and Walking Infrastructure Plans" (LCWIPs), enabling them to create
               town and city-wide network plans and prioritise projects for investment. 33 plans
               have now been completed, enabling long-term decisions to be taken.

          The latest statistics from 2018 show that walking has increased by 16% since 2015
          to 347 stages per person per year whilst cycling stages have increased by 2% since
          2015 and 22% since the 2013 baseline to 1006 million stages.

          When using adjusted figures to account for changes in severity reporting systems,
          the number of cyclists killed or seriously injured on England’s roads has remained
          relatively stable over the past 4 years, with 3,884 KSI in 2018. This represents a 4%
          decrease since 2015. 6

          I recognise that we still have some way to go to deliver the ambition set out in the
          Strategy. The forthcoming multi-year "Spending Review", expected later in 2020, will
          be the vehicle for identifying both the scale and type of investment required to meet
          our aims and targets and for considering any revisions to our existing objectives (the
          2025 walking aim has already been met, a new higher target is required).

          Analysis undertaken for DfT indicates that current funded policy will fill around 40% of
          the gap towards doubling cycling by 2025 7. Substantial further investment is
          therefore required over the next five-year period. The £350 million Cycle
          Infrastructure Fund announced in the Conservative Party Manifesto is only the start
          of this investment. This will be further built upon by the creation of a long-term
          programme and budget that dramatically increases investment in cycling and
          walking, including through the £100 billion of additional infrastructure spending
          announced for national renewal of roads, rail and other infrastructure that helps to
          generate growth.

          The Government’s aim is simple: to maximise the impact of this investment and
          create better connected, healthy and sustainable communities that ensure economic
          growth and prosperity can spread across every region of our nation.

          Chris Heaton-Harris MP
          Minister of State with responsibility for cycling and walking

6
    When using adjusted figures to account for changes in severity reporting systems.
7
    CWIS Investment Model, interim results and evidence reports

                                                                     5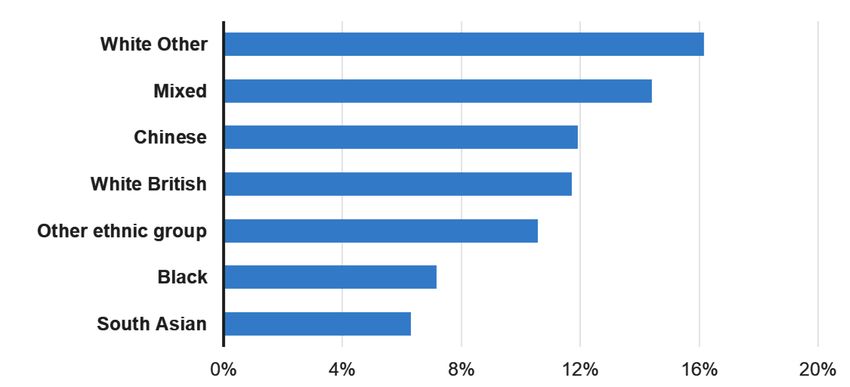
1. Introduction

          The Cycling and Walking Investment Strategy

1.1 The Infrastructure Act introduced a duty on the Secretary of State for Transport to
    bring forward a Cycling and Walking Investment Strategy (CWIS) in England. In July
    2015 Part 2 of the Infrastructure Act (Cycling and Walking Investment Strategies)
    was enacted through the Infrastructure Act 2015 (Commencement No. 3)
    Regulations 2015. 8

1.2 The Infrastructure Act states that the Cycling and Walking Investment Strategy 9 must
    specify:

          •    Objectives to be achieved during the period to which it relates; and,

          •    The financial resources to be made available by the Secretary of State for the
               purpose of achieving those objectives.

1.3 The Act also states that the Secretary of State must, from time to time, lay before
    Parliament a report on the progress towards meeting its objectives. This is the first
    report to Parliament on the progress made towards achieving the aims, targets and
    objectives set out in the Strategy and it covers the period 2016/17 to 2018/19.

8
    http://www.legislation.gov.uk/ukpga/2015/7/contents/enacted
9
    https://www.gov.uk/government/publications/cycling-and-walking-investment-strategy

                                                                   6
Aims and Objectives

1.4 The Government's long-term ambition is to make cycling and walking the natural
    choices for shorter journeys, or as part of a longer journey, by 2040. For this to be
    realised our towns and cities need to have an environment that properly enables and
    incentivises higher levels of active travel. A range of short and long-term objectives
    were set out in the Strategy, as follows:

     Objectives to be achieved by 2020

     •   Increase cycling and walking activity;

     •   Reduce the number of cyclists killed or seriously injured on England's roads; and,

     •   Increase the percentage of school children that walk to school.

     Aims and targets to be achieved by 2025

     •   Double cycling: where cycling activity is measured as the estimated total number
         of cycle stages made each year, from 0.8 billion stages in 2013 to 1.6 billion
         stages in 2025;

     •   Increase walking activity: where walking activity is measured as the total
         number of walking stages per person per year, to 300 stages per person per year
         in 2025;

     •   Increase the percentage of children that usually walk to school: from 49% to
         55% of children aged 5 to 10 in 2014 in 2025.

     Ambition by 2040

1.5 The Government's ambition is to make cycling and walking the natural choices for
    short journeys, or as part of a longer journey, by 2040.

                                              7
The contribution to wider government objectives

1.6 The Cycling and Walking Investment Strategy helps deliver the following linked
    strategies and policies:

        •    Clean Growth Strategy, as part of wider policies to reduce car-km through mode
             shift to cycling, walking and public transport. 10

        •    Future of Mobility: Urban Strategy, as a key way to tackle congestion, improve
             sustainability and boost connectivity whilst enabling opportunities to increase
             investment and export opportunities for UK companies and create high-quality
             jobs, including for e-bikes. Walking, cycling and active travel must remain the best
             options for short urban journeys. 11

        •    Clean Air Strategy, as part of a range of interventions to halve the harm to
             human health from air pollution in the UK by 2030. 37 Local Authority groupings
             are required to develop plans to tackle persistent air pollution problems.
             Investment in active travel complements clean air zones and other traffic restraint
             measures. 12

        •    Prevention is Better Than Cure approach, as a core element of work to
             increase physical activity and to help deliver the Prime Minister’s grand challenge
             for people to enjoy at least five extra healthy, independent years of life by 2035. 13

        •    Sport England Strategy: Towards an Active Nation, as part of a range of
             interventions aiming to get half a million more people active by 2020 including
             100,000 people from lower socio-economic groups. Walking and cycling are
             popular & accessible ways of keeping active. 14

        •    Childhood Obesity Plan Chapter 1 & 2, as part of a range of policies which aim
             to halve childhood obesity by 2030, with walking and cycling to school key actions
             to keep children physically active. 15 16

10
   https://www.gov.uk/government/publications/clean-growth-strategy
11
   https://www.gov.uk/government/publications/future-of-mobility-urban-strategy
12
   https://www.gov.uk/government/publications/clean-air-strategy-2019
13
   https://www.gov.uk/government/publications/prevention-is-better-than-cure-our-vision-to-help-you-live-well-for-longer
14
   https://www.sportengland.org/active-nation/our-strategy/
15
   https://www.gov.uk/government/publications/childhood-obesity-a-plan-for-action
16
   https://www.gov.uk/government/publications/childhood-obesity-a-plan-for-action-chapter-2

                                                                    8
2. Achievements
Overall progress
2.1 The Strategy set out a 4-year action plan outlining key short-term interventions to
support delivery of the aims and targets. Of the 26 actions outlined in the CWIS,
around half are substantively completed and many of the remaining actions are long-
term interventions that will continue until the end of 2020/21, such as the Access
Fund, Bikeability, Cycle Rail and third sector behaviour change initiatives. A small
number of actions have been superseded by more appropriate or more ambitious
interventions.
2.2 The actions have also been supplemented by additional actions agreed by Ministers
to help deliver the outcomes of the Strategy. These include creating a safe
environment for pedestrians and cyclists through the CWIS Safety Review Action
Plan, upgrading the National Cycle Network (NCN) and enabling more sustainable
last-mile delivery of goods through the use of e-cargo bikes. A summary of progress
in delivering the Government's Response to the CWIS Safety Review, agreed NCN
projects and relevant actions from the Last Mile Delivery Response document are
included later in this report.
Action plan
2.3 The actions were split into four themes: financial investment, behaviour change,
safety and partnership. This report sets out the progress made against delivering
those actions against the key themes. The following is a summary of progress and
key outputs delivered and outcomes achieved over the period April 2016 to March
2019:
9Financial Investment
Action Progress Key outputs / outcomes delivered
to March 19
Access Fund 17 Since 2016, £80m has been invested 147 workplaces and 9 schools
in the Access Fund (including the benefitting from cycling
25 local authorities improvements (access and security).
Sustainable Travel Transition Year in
deliver behaviour
2016). Behavioural change
change projects 13,724 campaigns and events.
campaigns, training and engagement
that encourage
with businesses, schools, employees Public behavioural change
cycling and
and jobseekers will continue to campaigns and events delivered
walking.
March 2021. 18 (digital and physical, including led
rides) engaging 1,922,574 people.
10,338 businesses, workplaces and
organisations engaged.
6,931 schools engaged.
3,624 events and courses delivered.
84,672 people trained (including
maintenance and proficiency).
Deliver the Cycling The Cycling and Walking to Work Pilots projects delivered in 2017
targeting job seekers, employees and
and walking to Fund invested £5.6m in 3 city
businesses.
work fund 19 to regions, Greater Manchester
connect people with Combined Authority, Liverpool City
employment and Region and West Yorkshire
apprenticeships. Combined Authority.
17
https://www.gov.uk/government/publications/access-fund-funding-decisions-2017-to-2020
18
The Access Fund will also be extended into 2020/21 alongside an additional £20m of investment.
19
https://www.gov.uk/government/news/64-million-government-funding-to-encourage-more-cycling-and-walking-to-work
10Action Progress Key outputs / outcomes delivered
to March 19
Deliver Cycle £191m 21 (from 2013-17) of funding 12-69% increase in cycling volumes
Ambition Cities has been provided to eight groups of on key routes.
programme in cities and programmes of work are
eight cities: 80% complete. Some schemes have
155.3 miles of new segregated cycle
Birmingham, been delayed by wider road network
routes.
Cambridge, Greater development projects but all are
Manchester, expected to be substantially
Newcastle, complete by March 2020. 186.4 miles of new on & off road
Norwich, Oxford, routes for cyclists and pedestrians.
West of England,
West Yorkshire. 20 136 miles of off-road cycling signage
and resurfacing improvements.
77 miles of quality road
improvements for cyclists and
pedestrians.
300 new and upgraded cyclists and
pedestrian crossings.
3,380 new and upgraded cycle
parking places.
25 stations benefitting from cycle
improvements and facilities.
780 workplaces and schools
benefitting from new infrastructure.
Deliver Bikeability This period has seen continued 355,756 training places were
cycle training to growth in the £63m Bikeability delivered in 2016/17.
school children in training for schoolchildren. The
order to give the Department has enhanced the
404,791 training places were
next generation of delivery model for Bikeability,
delivered in 2017/18.
cyclists the skills appointing a dedicated charity (The
and confidence to Bikeability Trust) to undertake quality
cycle safely on assurance, promotion and 411,000 training places were
local roads. 22 programme development. This has delivered in 2018/19.
saved on operating costs, as well as
boosting the potential for Bikeability
to attract non-government funding.
20
Cycle Ambition Cities Interim Evaluation Report, TfQL 2019.
21
£191m provided in total 2013-17. Total funding £210m from 2013 to 2019, including National Parks funding.
22
https://bikeability.org.uk/support/publications/
11Action Progress Key outputs / outcomes delivered
to March 19
Update Cycle to In June 2019 the Department According to data from the
work scheme published refreshed Cycle to Work stakeholder group, Cycle to Work
providing a tax- Scheme Guidance to support hire of Alliance, the Cycle to Work Scheme
efficient, salary- more expensive cycles, included e- has involved over 40,000 employers
sacrifice employee bikes and adapted bikes. across the country, and has
benefit, introduced contributed to help more than 1.6
in the 1999 Finance million commuters to cycle to work.
Act, which provides
a way of
encouraging more
adults to take up
cycling. 23
23
https://www.gov.uk/government/publications/cycle-to-work-scheme-implementation-guidance
12Behaviour Change
Action Progress Key outputs / outcomes
delivered to March 2019
Deliver the Big Bike Revival Almost £3m has been provided 13,061 cycling trips generated.
social marketing campaign by to Cycling UK to deliver the Big
Cycling UK, which aims to get Bike Revival over the last three 40,036 people reached.
people who own a bike, but do years. The scheme targets
not currently use it, back in the people on low incomes, those 76% people reached now
encouraged to cycle.
saddle through engaging a from ethnic minorities, people
network of established not in work and those who do
1,077 free events delivered.
community-focused initiatives. not meet the Government’s
The campaign helps to make physical activity guidelines to
125 volunteer and bike
cycling accessible to those that get into cycling. The Big Bike recycling centres helped
stand to benefit the most, Revival aims to incentivise the deliver events.
typically hard to reach 42% of the population who
communities within some of have access to a bike but who 7,504 bikes fixed.
the more deprived regions of don’t cycle.
society. 24 9,025 people cycling more.
3,163 people became regular
cyclists.
Promote Electric Bicycles, On 1st April 2019, the e-cargo bike grant programme
including e-bikes and e-cargo Government launched a £2m ongoing.
bikes. 25 e-cargo bike grant programme
which is being delivered by the
Updated cycle to work
Energy Saving Trust, with the
guidance has been published
support of the Bicycle
which enables hiring of e-bikes
Association and UK Cycle
for commuting.
Logistics Federation.
The Government also provided
£100k for capacity building in
the industry to support the
sharing of good practice from
the UK and overseas.
24
https://www.cyclinguk.org/bigbikerevival
25
https://www.energysavingtrust.org.uk/transport/freight-and-retrofit/ecargo-bike-grant-fund
13Action Progress Key outputs / outcomes
delivered to March 2019
Deliver Walk to School Almost £3m has been invested WOW - year-round walk to
Outreach to overcome barriers into the Walk to School school challenge, covering 207
to walking and help the programme, run by the charity schools and supporting 55,000
Government reach its target of Living Streets, since 2015. The children in each of the last 3
55% of children walking to programme is run in years.
school by 2020. 26 partnership with local and
combined transport authorities.
84% of journeys to school
were walked all or part of the
way, a 47% increase on the
baseline walking rate of 57%.
+50% in number of walking
trips recorded (via Travel
Tracker app) each day from
Sept – Oct 2018.
Conduct Behavioural Insights The outcomes of the The trials identified the
Trials to design and evaluate Behaviour Insight Trial at importance of early
low-cost, scalable interventions Heathrow was published in intervention to improve
aimed at increasing the 2017. sustainable travel for
sustainable travel of employees by offering
employees. 27 personalised commuter plans,
increasing car sharing
registration, free buses travel
for one week and try a bike on
us.
Develop PlusBike and provide In 2016, Rail Delivery Group Website and app updated with
clear and easy-to-understand (RDG) launched a new details of facilities at stations
guidance on taking bikes on campaign highlighting the such as the number of cycle
trains, train carriage rules, bike PlusBike information portal to parking spaces, rules about
parking at stations and nearby make cycle-friendly train travel taking bikes on trains, whether
cycle hire as you plan your rail easier to access and reservations are available or
journey. 28 understand. required, and even links to
local cycle-hire businesses.
PlusBike is available via the
National Rail website and app
through journey planner.
PlusBike website received over
110,000 views last year.
26
https://www.livingstreets.org.uk/walk-to-school?gclid=EAIaIQobChMInOfyytOC5QIVia3tCh3xmQpEEAAYASAAEgLBGvD_BwE
27
https://assets.publishing.service.gov.uk/government/uploads/system/uploads/attachment_data/file/586376/sustainable-travel-
evaluation-of-low-cost-workplace-interventions.pdf
28
www.nationalrail.co.uk/plusbike
14Action Progress Key outputs / outcomes
delivered to March 2019
Deliver Cycle Rail 3 funding rounds delivered 4,000 new cycle parking
infrastructure improvement to since 2016/17, providing spaces created since 2016/17.
make it more convenient to £15.6m of funding. Of this,
cycle to railway stations £6.8m is being invested over
through the provision of new, 2019/20 to create an extra Improved cycle storage and
high quality cycle parking and 2,300 cycle spaces at 48 safety through 15 secure cycle
cycle access. stations across England, hubs since 2016/17.
enabling commuters to cycle
directly to the station and lock
up their bike securely. This 4km pedestrian and cycling
funding is also supporting path linking Aylesbury Vale
construction of two new station Parkway with the village of
community link projects at Waddesdon and Waddesdon
Chatham and Cambridge. Manor.
Updated Cycle Rail Toolkit,
guidance document.
Deliver the Modeshift STARS Since 2016, £60K per year has 69 organisations now signed
[Sustainable Travel been invested in the Modeshift up to deliver STARS locally
Accreditation and Recognition STARS scheme which with their schools with almost
for Schools] national awards continues to successfully 4,000 individual schools
scheme that recognises engage 1,400 schools and registered on the Modeshift
schools that have shown their pupils. The aim is to STARS website.
excellence in supporting increase this 1,600 schools in
cycling, walking and other 2019/20.
forms of sustainable travel. 29 1,200 schools nationally have
achieved STARS accreditation.
29
https://www.modeshiftstars.org/
15Safety
Action Progress Key outputs / outcomes
delivered to March 2019
Deliver actions from the Road In June 2018, the Department Progress report published in
Safety Statement 2015, which published a progress report on June 2018.
set out the vision, values and the delivery of the planned
priorities to bring down the actions from the Road Safety
numbers of people killed and Statement and has made
injured on our roads. 30 some good headway: 15 of the
23 short-term actions have
been delivered including 3
where the original objectives
have been exceeded.
Deliver enhancements to the Highways England is 101 cycle schemes.
Strategic Road Network committed to supporting active
through Highways England's travel and making the Strategic
120 new crossings for cyclists,
Cycling, Safety and Integration Road Network accessible and
pedestrians and/or horse-
Designated Fund safer for cyclists by delivering
riders.
Programme. 31 200 new cycling facilities and
improved crossing points by
2021. During 2019-20 286 upgrades to existing
Highways England will deliver crossings.
109 schemes from the Cycling,
Safety and Integration
Designated Fund. These will
deliver a total of 57 new or
improved crossings and 50
cycle schemes.
Support cycling and walking In October 2018 a national The additional £20m funding
projects on HS2 routes through cycleway feasibility study provided for Sustrans in 2019
HS2 Road Safety Fund. 32 associated with HS2 was to deliver a range of activation
published. HS2 Ltd. has projects to upgrade the
undertakings and assurances National Cycle Network (NCN)
on cycling provision and some across England will include
of the options set out in the routes around the HS2 route to
feasibility report are deliverable improve connectivity of the
through collaboration between NCN.
HS2 Ltd. and local authorities.
The Department and HS2
officials meet on a regular
basis to continually review
opportunities for both cycling
and walking HS2 can deliver.
30
https://www.gov.uk/government/speeches/road-safety-recent-progress-and-future-work
31
https://www.gov.uk/government/publications/highways-england-delivery-plan-update-2019-to-2020
32
https://www.gov.uk/government/news/30-million-to-improve-road-safety-for-communities-along-hs2-route
16Action Progress Key outputs / outcomes
delivered to March 2019
Complete an internal review of Work on an impact The internal review work
Traffic Regulation Orders assessment and a public completed in early 2019, just
(TRO) for pavement parking consultation document is prior to the Transport Select
laws, taking into account the planned for 2019. Committee’s (TSC) launch of
concerns of the high street and its inquiry into pavement
Ministers will consider future
other businesses and those of parking in April. The
legislative options arising from
disability groups and others Committee published its
the Department's policy review,
with a related interest. 33 conclusions in September.
alongside the conclusions
outcome of the Transport
Select Committee (TSC) in the
coming months.
Evaluate effectiveness of In July 2014, Atkins, AECOM The drivers’ and residents’
20mph speed limits (signed and Professor Mike Maher of views were self-reported and
only) based on twelve case University College London, not tested. The headline
study schemes in England and were commissioned by the findings are:
various comparator areas with Department for Transport to
20mph limits are supported by
a 30mph limit in place. 34 conduct the study into 20mph
the majority of residents and
speed limits.
drivers.
Research completed and
reports published in November
2018. There has been a small
reduction in median speed
It concluded that there was
(less than 1mph).
insufficient evidence that there
has been a significant change
in collisions and casualties Vehicles travelling at higher
following the introduction of speeds before the introduction
20mph limits in residential of the 20mph limit have
areas. reduced their speed more than
those already travelling at
lower speeds.
Update guidance on tactile Research is underway to N/A.
paving, including guidance on inform the updates.
the use of tactile paving and Announcement of plans for
broader guidance on updating guidance, late 2019.
accessibility related design,
known as inclusive mobility.
33
https://www.parliament.uk/business/committees/committees-a-z/commons-select/transport-committee/inquiries/parliament-
2017/pavement-parking-17-19/
34
https://assets.publishing.service.gov.uk/government/uploads/system/uploads/attachment_data/file/757307/20mph-headline-report.pdf
17Action Progress Key outputs / outcomes
delivered to March 2019
Refresh of cycle design In August 2018, the Draft report has been
guidance, to provide clearer, Department announced that developed, publication planned
more current, relevant the Minister had commissioned for autumn 2019.
guidance informed by the Cycle Proofing Working
international, UK, London Group to develop national
Design Standards and Active guidance and best practice for
Travel Design Guidance in cycling and walking
Wales. infrastructure, so that all road
users can benefit from the best
facilities.
Deliver Cycle Safety Fund to Successful projects announced 7 roundabout and junction
improve road safety, helping in February 2018 as part of the improvement schemes
create more bike-friendly Cycle Safety Review. £7m underway. Schemes involve
areas. 35 safety improvement schemes significant improvements for
delivered in the 6 Cycle people who walk or cycle, in
Ambition Cities, Bristol, Leeds, delivery.
Cambridge, Birmingham,
Norwich, Manchester.
35
https://www.gov.uk/government/news/multimillion-pound-government-funding-boost-for-cycle-safety
18Partnership
Action Progress Key outputs / outcomes
delivered to March 2019
Support development of Local Following publication of an All 46 local authorities
Cycling and Walking "expression of interest" expected to substantially
Infrastructure Plans process, and technical complete LCWIPs in 2019/20.
(LCWIPs) to enable a long- guidance on the LCWIP Over half of these are
term approach to developing process, the Department complete as of December
local cycling and walking received 78 applications from 2019.
networks, ideally over a 10- local authorities for support to
year period, and form a vital develop their plans. Of these,
part of the Government’s 46 authorities were selected to
strategy to increase the take part in a pilot programme
number of trips made on foot to benefit from a £2m package
or by bicycle. 36 of strategic and technical
support.
Technical support for local See LCWIPs. See LCWIPs.
bodies
Develop the Propensity to The Department continues to A "schools layer" was added to
Cycle Tool (PCT) to provide support the development of the incorporate data on school
authorities with an objective Propensity to Cycle Tool (PCT) travel alongside enhanced
analysis of where there is the - a free, open source strategic integration with the WebTAG
greatest propensity for future planning tool that has been appraisal framework.
cycling and walking stages in developed in partnership with
future years. 37 four universities: Cambridge,
Propensity to Cycle Tool (PCT)
Leeds, Westminster and the
has also helped local
London School of Hygiene &
authorities develop LCWIPs.
Tropical Medicine.
36
https://www.gov.uk/government/publications/local-cycling-and-walking-infrastructure-plans-technical-guidance-and-tools
https://www.pct.bike/
37
19Action Progress Key outputs / outcomes
delivered to March 2019
Deliver cycling and walking Development of Clean Air Delivery of 21 projects
schemes through National Air Fund. underway to improve
Quality Plan for Nitrogen infrastructure and encourage
Dioxide. Early Measures Fund 21 schemes across 8 areas, increased cycling and walking
2017/18 was precursor to including Basildon Council & activity.
Clean Air Fund. 38 Rochford District Council,
Bristol City Council,
Middlesbrough Borough
Council, Newcastle City
Council, North Tyneside
Council and Gateshead
Council, Birmingham City
Council, Leeds City Council,
Nottingham City Council,
Southampton City Council &
New Forest District Council.
Changes to Bus Services Bill The main points of the Bus Bus Services Act was passed
by Parliament in 2017.
to enable greater levels of Services Act are:
cycling and walking. 39
- To strengthen arrangements
for partnership working in the
sector by introducing
‘enhanced partnerships’;
- To introduce new franchising
powers with decision-making
at a local level;
- To provide for a step change
in the information available to
bus passengers.
Working with the third sector Creation of Cycling and Stakeholder Advisory Group
Walking Investment Strategy continues to meet formally four
Stakeholder Advisory Group. times per year, alongside a
range of policy specific working
group meetings.
38
https://www.gov.uk/government/consultations/air-quality-additional-measures-to-support-individuals-and-businesses-affected-by-local-
no2-plans
39
http://www.legislation.gov.uk/ukpga/2017/21/contents/enacted
20Outputs
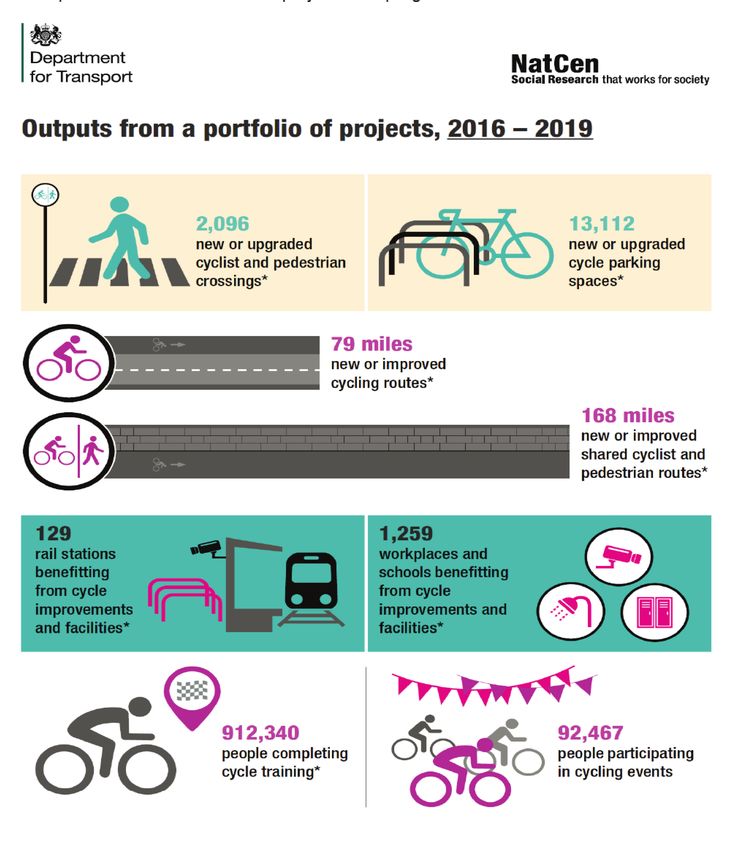
2.4 40The Department commissioned NatCen Social Research to produce a synthesis of
monitoring, reporting and evaluation across the various active travel projects and
programmes covered in this report. The table below shows a summary of selected
outputs achieved across these projects and programmes.
40
Cycling and Walking Evidence Review - outputs & outcomes from a portfolio of projects 2004 - 2019, Natcen Social Research, 2019.
213. Funding
Allocations and expenditure
3.1 The Infrastructure Act, which established the Strategy, requires the setting out of
financial resources available which are aligned with each Spending Review period,
the first being from 2016/17 to 2020/21.
3.2 Around £2.4 billion of investment in cycling and walking is projected over 5 years and
spending on cycling and walking, outside of London, is expected to more than double
from around £3.50 per head to over £10 per head over the current Spending Review
period.
3.3 The CWIS originally projected £1.2 billion of investment to 2020/21. This has already
been invested to the end of 2018/19 on cycling and walking across all relevant
government funding streams, including almost £390 million of ring-fenced funding.
This funding covers England, outside London, and TfL provides further funding for
London.
3.4 The tables below show direct investment in cycling and walking from the Department
for Transport from 2016/17 to 2020/21, as well as investment from wider government
funds over this period. The CWIS investment schedule, published alongside this
report, provides a breakdown of these funds and where they have been allocated,
including an assessment of the proportion of investment from wider government
funds. 41
41
CWIS Investment Schedule
22Department for Transport funding for cycling and walking
Funding Source Projected investment Spend to end 2018/19
2016/17-20/21
Access Fund £80m £60m
Bikeability £63m £37.5m
Cycle Ambition Cities £99m 42 £99m
Cycle Safety Fund £7m £7m
Cycle Rail £14m £12.8m
Highways England Designated £84m £51m
Funds
National Cycle Network £22m £22m
National Outreach Projects & £16.8m £16.8m
Innovation 43
Total ring-fenced £385.8m £306.1m
Wider government funding that is projected or allocated to cycling and walking
Funding Source Projected investment Spend to end 2018/19
2016/17-20/21
Local Growth Fund £683m £400m
Integrated Transport Block £114m £85m
Highways Maintenance Fund 44 £283m £153m
National Air Quality Plan £16m £9.6m
National Productivity £77m £25m
Investment Fund
Highways Maintenance £8m £8m
Challenge Fund
Transforming Cities Fund £320m £60m
Cross-government £550m £174m
Infrastructure Funds 45
Total non ring-fenced £2051m £914.6m
Total £2436.8m £1220.7m
42
£191m provided in total 2013-17. Total funding £210m, including National Parks funding from 2013 to 2019.
43
Outreach and innovation initiatives include Big Bike Revival, Walk to School Outreach, Cycling and Walking to Work Fund, Small
Business Research Initiative, Local Cycling and Walking Infrastructure Plan (LCWIP) pilots and National Cycle Network development
projects.
44
Pre 18/19 estimates assumes 5% on cycling and walking, 9% post 18/19 following funding formula amendments.
45
Only a proportion of these funds have been allocated. Projection assumes average of 5% of applicable infrastructure funds will be
spent on active travel. These include the £2.5bn Transforming Cities Fund, £5.5bn Housing Infrastructure Fund, £1bn Sport England
Sports Strategy (including Local Delivery Pilots), £220m Clean Air Fund, £30m HS2 Environment and Safety Fund and £675m High
Streets Fund. The proportion will vary across different types of infrastructure funding, potentially from around 2% to 10% of fund
allocation.
23A survey of local authorities
3.5 The Department recently surveyed over a hundred local authorities asking them a
range of questions about cycling and walking in their local areas. Survey responses
have been received from around 40 local authorities in England, giving an indication
about levels of infrastructure and spending around the country. Nevertheless,
national averages may differ from figures presented here due to relatively small
responses rates.
3.6 These surveys give an indication of the current levels of cycling and walking
infrastructure in England. For example, the average length of all cycle lanes in
surveyed local authorities was around 80 miles, including both segregated and non-
segregated routes. This represents around 40 miles of cycle lanes for every 1000
miles of roads 46. While the total length of cycle lanes is typically longer in rural
areas 47 (avg. 70 miles rural vs 90 miles urban), there are typically more cycle lanes
per 1000 miles of roads in urban areas (avg. 50 miles urban vs 10 miles rural).
3.7 Average spending by surveyed local authorities was around £6 per person per year
in 2018/19, comprising around £5 capital spending and around £1 revenue. This is
around half the average spending per person outside of London in this year 48.
Investment per person is typically higher in urban areas with average spending of
around £9 per person per year in urban areas compared to around £4 in rural areas.
Average spending per person in surveyed local authorities has remained largely
unchanged over the last four years.
3.8 The surveys also provide evidence for the proportion of local authority’s total
transport capital budget over the last 4 years (since 2015/16) which has been spent
on cycling and walking 49. Spending on cycling and walking accounted for on average
13% of surveyed local authorities transport capital budgets, ranging from 2% to 40%.
While average spending is in line with evidence from the CWIS Safety Review
Consultation response document from November 2018 50 (10-13%), the range of
surveyed responses reported here is significantly greater than previous estimates.
Results from the survey also suggests that there’s little difference between the
proportion of transport capital spending on walking and cycling between rural and
urban local authorities. The Department is considering further surveys to understand
local cycling and walking investment in order to measure progress with encouraging
local authorities to spend 15% of local transport infrastructure budget on active
travel. 51
46
All road types including motorways, ‘A’ roads and minor roads - https://www.gov.uk/government/statistical-data-sets/road-length-
statistics-rdl
47
Urban and rural defined here using the ONS urban/rural classification. ‘Rural’ is defined as ‘mainly rural’ or ‘largely rural’. ‘Urban’ is
defined as ‘urban with city and town’, ‘urban with minor conurbation’ or ‘urban with major conurbation’. That the category ‘urban with
significant rural’ isn’t included in either rural or urban.
https://www.gov.uk/government/statistics/2011-rural-urban-classification
48
Page 4, https://assets.publishing.service.gov.uk/government/uploads/system/uploads/attachment_data/file/603527/cycling-walking-
investment-strategy.pdf
49
Excluding private contributions.
50
https://www.parliament.uk/documents/commons-committees/transport/jesse-norman-to-lilian-greenwood-active-travel-evidence-
session-follow-up-21052019.pdf
51
CWIS Safety Review Response Action Plan
244. Working across government
4.1 The Department is also working closely with other government departments to
ensure that relevant place-based funds are eligible for cycling and walking provision,
as well as assisting with assessing bids for funding. The key cross-Government
transport and infrastructure funds are listed below.
Local Growth Fund52
4.2 The Local Growth Fund has provided £12 billion to local enterprise partnerships or
LEPs (partnerships between local authorities and businesses) for projects that
benefit the local area and economy. A survey of local enterprise partnerships has
shown that an estimated £683 million has been invested in active travel projects 53.
Integrated Transport Block and Highways Maintenance Fund54
4.3 Between 2016-2021, around £114 million from the Integrated Transport Block for
micro-enhancement projects up to £3 million and £283 million from the Highways
Maintenance Fund for smaller upgrades is expected to go towards delivering and
maintaining cycling and walking infrastructure. For Highways Maintenance Funding,
this is based on pre- 2018/19 estimates of 5% spent on cycling and walking and 9%
post 18/19 following funding formula amendments. Integrated Transport Block
assumes 11% investment on cycling and walking, in line with earlier spend
proportions.
Clean Air Fund (National Air Quality Plan) 55
4.4 Around £16 million of the £220 million capital and revenue funding available through
the Department for Environment, Food and Rural Affair's (DEFRA) Clean Air Fund
over the period 2018/19 to 2020/21, will be used by eligible local authorities to
support measures that will make it easier to change to alternative modes of transport.
52
https://www.gov.uk/government/collections/local-growth-deals#growth-deals:-round-3
53
Local Growth Fund Survey of LEPs
54
https://www.gov.uk/government/publications/local-transport-capital-block-funding
https://www.gov.uk/government/publications/highways-maintenance-funding-allocations-201516-to-202021
55
https://www.gov.uk/government/news/260-million-of-clean-air-funding-launched-by-government
25National Productivity Investment Fund 56
4.5 76 projects from across the country were awarded funding totalling £244 million to
bring benefits to local road users such as improving access to public transport sites,
opening up more roads for cyclists, addressing key local traffic ‘pinch points’ and
supporting the development of new housing. Around £77 million will be invested in
active travel projects.
Highways Maintenance Challenge Fund57
4.6 The local highways maintenance challenge fund enables local highway authorities in
England to bid for major maintenance projects that are otherwise difficult to fund
through the usual formula funding allocations they receive from government. In 2015,
tranche 1 was launched and, with additional schemes added in the summer of 2015,
34 schemes were funded, awarded £285 million in total. In autumn 2017, tranche 2A
awarded £75 million to 19 projects following a further competition. A further tranche
of the challenge fund will be available for 2019 to 2020 and 2020 to 2021, with a total
of £198 million in funding.
A proportion of this funding is invested in improving active travel infrastructure.
Transforming Cities Fund 58
4.7 The £2.5 billion Transforming Cities Fund (TCF) will improve local transport links to
make it easier to travel between often more prosperous city centres and frequently
struggling suburbs. Some £320 million is known to have been allocated by authorities
to active travel schemes, which represents around a third of all investment under the
TCF. The Mayor of Manchester has announced that £160 million of their allocation
will be used to improve cycling and walking infrastructure through the Bee Network;
indicative TCF plans for Liverpool City Region Combined Authority (LCRCA) include
£30m on 600km of commuter cycle routes across LCR; West Midlands Combined
Authority (WMCA) have allocated about £43 million of their TCF allocation on
transport plans which include a cycling programme; and Tees Valley Combined
Authority (TVCA) have indicated £2.63 million of their TCF will be allocated to
improving cycle links between Wynyard and Billingham.
Housing Infrastructure Fund 59
4.8 The £5.5 billion Housing Infrastructure Fund is available to local authorities for
infrastructure to unlock housing. A proportion of this funding will be used to enable
transport connectivity, including using active modes.
56
https://www.gov.uk/government/uploads/system/uploads/attachment_data/file/653071/npif-regional.csv/preview
57
https://www.gov.uk/government/publications/apply-to-the-local-highways-maintenance-challenge-fund
58
https://www.gov.uk/government/publications/apply-for-the-transforming-cities-fund
59
https://www.gov.uk/government/publications/housing-infrastructure-fund
26Sport England's Sports Strategy (including local delivery pilots) 60
4.9 Sport England’s Strategy: Towards an Active Nation aligns with the Government’s
Sporting Future Strategy and aims to get 500,000 people active by 2020 and meeting
the Chief Medical Officer (CMO) recommendation of 150 minutes of physical activity
per week, including 250,000 women, and get 100,000 from lower socio-economic
groups moderately active. It is backed by £1 billion of investment over four years up
to 2021, including £75 million through a number of local delivery pilots. The pilots
focus on a range of physical activity interventions, including active travel. PE Sports
Premium initiatives also include active travel.
HS2 Environment and Safety Fund 61
4.10 The £30 million Environment and Safety fund aims to make improvements in rural
areas along the line of the High Speed 2 route. This includes supporting traffic
calming, safer junctions or better pedestrian crossings all of which will benefit
facilities for cycling and walking.
High Streets Fund62
4.11 The £675 million High Streets Fund aims to renew and reshape town centres and
high streets in a way that improves experience, drives growth and ensures future
sustainability. This includes improvement to transport infrastructure and the public
realm, including to support higher levels of cycling and walking.
Stronger Towns Fund 63
4.12 The £3.6 billion Stronger Towns Fund offers funding between 2019-2026 to create
new jobs, help train local people and boost growth. This includes local improvements
to support high levels of cycling and walking.
60
https://www.sportengland.org/media/10629/sport-england-towards-an-active-nation.pdf
https://www.sportengland.org/our-work/local-delivery-pilots-community-of-learning/pilots-on-a-page/
https://www.gov.uk/guidance/pe-and-sport-premium-for-primary-schools
61
https://www.gov.uk/government/news/30-million-to-improve-road-safety-for-communities-along-hs2-route
https://www.gov.uk/government/news/8-million-of-extra-hs2-funding-to-benefit-local-communities-and-woodlands-between-birmingham-
and-crewe
62
https://www.gov.uk/government/publications/future-high-streets-fund
63
https://www.gov.uk/government/news/100-places-to-benefit-from-new-towns-fund
275. The Impact on Cycling & Walking -
Statistical Analysis64
5.1 Data from the Department for Transport National Travel Survey (NTS) and the Sport
England Active Lives Survey (ALS) are used to monitor the CWIS aims and
objectives. Latest results are detailed below.
Walking Activity
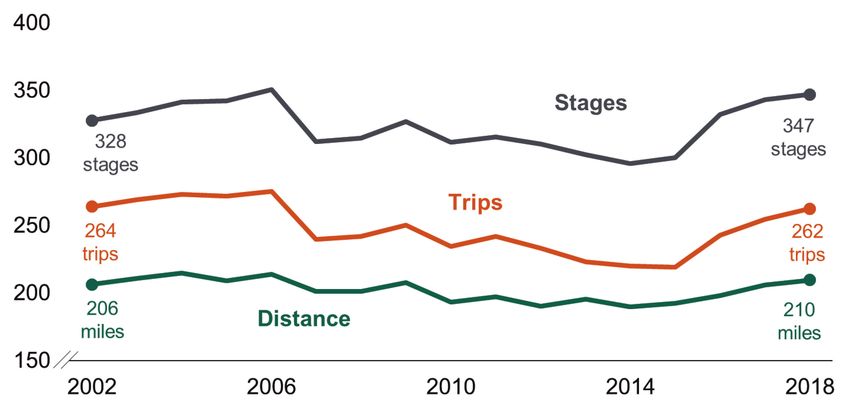
5.2 In 2018, people made an average of 347 walking stages (a 16% increase since
2015) and walked an average of 210 miles. People have walked more often and
further distances over the last three years, following a period of decline.
Average number of stages, trips and miles walked per person per year,
England, 2002 to 2018
64
https://www.gov.uk/government/collections/walking-and-cycling-statistics
28Age and Gender
5.3 In 2018, women on average made 23 more walking trips than men and walked 5
miles further. Women in their thirties (aged 30 to 39) made the highest number of
walking trips on average.
Walking trips per person per year, by age and gender, England, 2018
400 274 trips
251 trips
300
200
100
0
0-16 17-20 21-29 30-39 40-49 50-59 60-69 70+
Age
Ethnicity
5.4 In 2017-18, the proportion of adults that walked at least once a week varied by
ethnicity, between 58% for Black adults to 73% for White Other adults.
Proportion of adults walking at least once a week by ethnicity, 2017-18
White Other
Mixed
White British
Chinese
Other ethnic group
South Asian
Black
0% 20% 40% 60% 80%
29Socio-economic classification
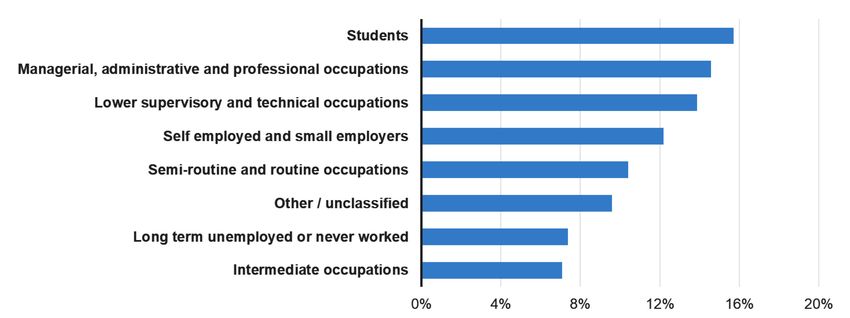
5.5 In 2017-18, the NS-SEC (National Statistics Socio-economic classification) group
with the highest proportion of adults walking at least once a week was students at
79%. Those in the other/unclassified group had the lowest proportion with 56%
walking at least once a week, followed by long term unemployed or never worked at
57%.
Proportion of adults walking at least once a week by NS-SEC group, 2017-18
Students
Managerial, administrative and professional occupations
Intermediate occupations
Self employed and small employers
Lower supervisory and technical occupations
Semi-routine and routine occupations
Long term unemployed or never worked
Other / unclassified
0% 20% 40% 60% 80% 100%
Cycling Activity
5.6 In 2018, people cycled an estimated total of 1,006 million stages, an increase of 22%
since 2013 (CWIS baseline).
Total stages cycled per year in millions, England, 2005 to 2018
30Age and gender
5.7 In 2018, on average men made 15 more cycle trips than women (25 trips compared
to 10 trips), and cycled almost four times further than women (92 miles compared to
25 miles). Adults aged 40–49 made the most cycling trips for both men and women.
Cycling trips per person per year, by age and gender, England, 2018
40
25 trips
35 10 trips
30
25
20
15
10
5
0
0-16 17-20 21-29 30-39 40-49 50-59 60-69 70+
Age
Ethnicity
5.8 In 2017-18, the proportion of adults that cycled at least once a week was highest for
White Other adults at 16% and lowest for South Asian adults at 6%.
Proportion of adults cycling at least once a week by ethnicity, 2017-18
31Socio-economic classification
5.9 Students were the NS-SEC group with the highest proportion of adults cycling at
least once a week (16%) while adults who were long term unemployed or never
worked, and in intermediate occupations were the lowest at 7%.
Proportion of adults cycling at least once a week by NS-SEC group, 2017-18
Walking to School
5.10 In 2018, 44% of all children (aged 5-16) usually walked to school. 51% of primary
school children (aged 5-10) usually walked to school. 37% of secondary school
children (aged 11-16) usually walked to school.
Proportion of children who usually walk to school, by age band, England, 2002
to 2018
32Cycle Ambition Cities65
5.11 The tables below show the proportion of adults walking/cycling at least once a week
in London and the Cycle Ambition Cities in 2015-16 and 2017-18. The tables also
include the percentage point change between those years and whether the change
was significant.
Proportion of adults walking at least once a week
City 2015-16 2017-18 Percentage
point change
London 72.1% 73.0% 0.9
Birmingham 63.2% 62.4% -0.8
Cambridge 77.5% 82.4% 4.9
Greater Manchester 64.4% 66.1% 1.7
Newcastle 70.0% 70.6% 0.6
Norwich 79.2% 72.3% -6.8
Oxford 80.5% 80.0% -0.6
Bristol 72.1% 73.9% 1.8
Leeds 65.5% 71.6% 6.1
Proportion of adults cycling at least once a week
City 2015-16 2017-18 Percentage
point change
London 12.9% 12.8% 0.0
Birmingham 9.0% 9.9% 0.9
Cambridge 56.9% 57.5% 0.6
Greater Manchester 8.9% 9.5% 0.5
Newcastle 13.2% 13.3% 0.1
Norwich 23.3% 20.4% -2.8
Oxford 38.8% 39.2% 0.4
Bristol 19.7% 21.3% 1.6
Leeds 8.5% 10.3% 1.8
65
https://www.gov.uk/government/collections/cycling-and-walking
33Road safety for pedestrians and cyclists
5.12 Data from the Department for Transport on personal injury road accidents reported to
the police (Stats19) are used to monitor safety trends for pedestrians and cyclists for
the CWIS. Latest results are detailed below.
5.13 Changes in severity reporting have impacted the number of serious injuries reported
to the police and trends presented here are based on 2018 adjustments for this
change. 66
5.14 The number of pedestrian fatalities in England has remained broadly constant since
2010, and since then year-on-year changes are likely to be due to natural variation.
There were 398 pedestrians killed on England's roads in 2018.
Pedestrian fatalities, England 2008-2018
Source: DfT Stats19
5.15 Adjusting for changes in severity reporting, the number of pedestrians killed or
seriously injured in England was 6,083 in 2018 and has declined by 18% since 2008.
66
More details on changes in severity reporting and adjustments are available in Reported road casualties Great Britain, annual report:
2018: https://www.gov.uk/government/statistics/reported-road-casualties-in-great-britain-annual-report-2018. Adjustments are subject to
revision.
34Pedestrians killed or seriously injured, England 2008-2018
Source: DfT Stats19
5.16 The number of pedal cyclists killed on England's roads was 90 in 2018 and has
remained at a similar level since 2008. Any changes since that point are most likely
to be as a result of natural variation.
Pedal cyclist fatalities, England 2008-2018
Source: DfT Stats19
355.17 Adjusting for changes in severity reporting, the number of pedal cyclists killed or
seriously injured in England has increased by 21% since 2008. In 2018, an estimated
3,884 cyclists were killed or seriously injured, a 1% increase from the previous year.
Pedal cyclists killed or seriously injured, England 2008-2018
Source: DfT Stats19
366. Impact of programmes
Progress toward CWIS aims and targets
6.1 The Department has developed a number of CWIS active travel models to forecast
the impact of investment on cycling and walking stages.
6.2 Results from the models found that with current funded policy (to 2020/21), around
40% of the gap to double cycling by 2025 is forecast to be filled (around 1120 million
stages per year). Investment beyond current levels is needed if this target is to be
met.
6.3 The 2025 aim for walking stages has already been exceeded (347 stages per person
per year in 2018), even taking into account a methodology change in the National
Travel Survey 67. No substantive further change in walking rates is forecast as a result
of current funded policy.
6.4 Over the last three years there has been an upward trend in walking rates, following
a period of decline. Investment in walking is not expected to be the only factor
causing this trend, further work is planned to better understand reasons for this
change and determine whether the trend will continue.
6.5 These forecasts take account of change in active travel that has already happened
since 2013; change that is expected to happen as a result of current funding and
change that is expected to happen as a result of current land use planning policy.
6.6 Most changes in walking and cycling rates has historically been concentrated in a
few local authority districts. In fact, census data shows 80% of the gross uplift in
cycling to work between 2001 and 2011 was due to change in just 30 local authority
districts, of which 17 were London boroughs.
6.7 Even without further investment beyond current funding, the model forecasts this
change will continue, with London and non-London local authority districts with
significant growth driving the uplift in both cycling and walking. For non-London local
authority districts where significant growth is not expected, typically little or no
change in cycling is predicted, whist walking is predicted to decrease in some of
these areas.
67
Walking and Cycling Statistics 2018: Notes and Definitions (page 4)
37You can also read