Economic Benefits of Wolf Creek Generating Station - An Economic Impact Study by the Nuclear Energy Institute
←
→
Page content transcription
If your browser does not render page correctly, please read the page content below
Economic
  Benefits of
  Wolf Creek
  Generating
   Station
 An Economic Impact
     Study by the
Nuclear Energy Institute
Economic Benefits of
    Wolf Creek
 Generating Station
    An Economic Impact
        Study by the
   Nuclear Energy Institute

            July 2005

              ©2005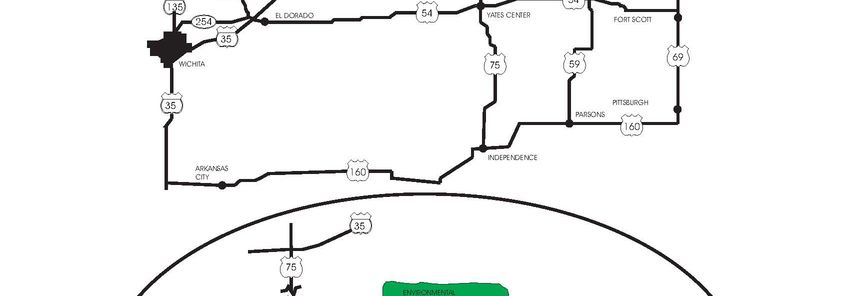
Economic Benefits of Wolf Creek Generating Station

                                                     2
Economic Benefits of Wolf Creek Generating Station

Contents

EXECUTIVE SUMMARY .................................................................................................................................................................. 5

SECTION 1: INTRODUCTION ...................................................................................................................................................... 7

SECTION 2: THE WOLF CREEK GENERATING STATION................................................................................................. 9

SECTION 3: ECONOMIC AND FISCAL IMPACTS.................................................................................................................. 15

SECTION 4: ADDITIONAL BENEFITS PROVIDED BY WOLF CREEK........................................................................... 27

SECTION 5: NUCLEAR INDUSTRY TRENDS....................................................................................................................... 29

SECTION 6: ECONOMIC IMPACT ANALYSIS METHODOLOGY ................................................................................. 35

                                                                                          3
Economic Benefits of Wolf Creek Generating Station

                                                     4
Economic Benefits of Wolf Creek Generating Station

Executive Summary
Wolf Creek Generating Station in Coffey County, Kan., is an integral part of the local economy.
The plant is owned by Kansas City Power & Light Co. (a Great Plains Energy Inc. company), Westar
Energy and Kansas Electric Power Cooperative Inc. Wolf Creek Nuclear Operating Corp. operates the
facility.

Besides its economic output, the plant provides jobs, labor income and tax revenues. Additionally, there
are important intangible benefits, such as clean air, environmental stewardship and stable, affordable
electricity prices. According to this study by the Nuclear Energy Institute, Wolf Creek’s economic
impact reaches beyond the local community to the state and nation.

Operation of the Wolf Creek plant increased Coffey County’s economic output by $7.9 million and
Kansas’ economic output by $79.9 million in 2003. Adding the direct value of the plant’s electricity
generation brings the county’s economic output attributable to Wolf Creek to $607.9 million in Coffey
County and $680 million in Kansas. The operation of Wolf Creek and the secondary effects of the plant
account for 682 jobs in Coffey County and 2,014 jobs in Kansas. These jobs account for $57.7 million in
earnings to workers in Coffey County and $129.3 million in Kansas. Additionally, the plant and its
related economic activity resulted in almost $30 million in state and local tax payments.

Wolf Creek employs 1,028 people, with 55 percent living in Coffey County. An estimated 561 full-time
employees live in the cities of Burlington, Gridley, Lebo, LeRoy and Waverly. The plant employs nearly
a third of the working population in Waverly and 27 of every 100 working people in Burlington. In
addition, these jobs pay 57 percent above the average Coffey County salary. Economic activity generated
by Wolf Creek creates another 121 jobs in the county.

The plant’s principal expenditure in Coffey County is employee compensation. In 2003, Wolf Creek paid
$55.4 million to employees living in the county and an additional $48.2 million to employees residing
elsewhere in Kansas. Additionally, the economic activity created by the Wolf Creek plant accounted for
$2.3 million in employee compensation in Coffey County and an additional $23.4 million in other areas
of the state. Together, the direct and indirect compensation from the plant resulted in $57.7 million in
labor income in the county and an additional $71.6 million in other areas of Kansas.

Wolf Creek makes substantial purchases in Coffey County, where the plant spent $1 million in 2003.
Purchases totaled $5.6 million in Kansas and $110.8 million in the United States. Economic activity
generated by Wolf Creek’s purchases and operation also led to $7.9 million in increased output in the
county and $79.9 million in the state, as mentioned above.

Wolf Creek pays an estimated $24.8 million in state and local taxes annually. The economic activity
generated by the plant contributes another $5 million in state and local taxes through increased business,
corporate, payroll and personal taxes. By combining direct and indirect tax benefits, the Wolf Creek plant
pays nearly $30 million in state and local taxes.

Besides the economic benefits Wolf Creek provided, the plant generated more than 10 million megawatt-
hours of electricity in 2004, approximately 19 percent of Kansas’ electricity needs. This low-cost
electricity helped keep energy prices affordable in the Southwest Power Pool North Sub-Region, where
the Wolf Creek plant resides. In 2004, Wolf Creek’s production cost was 1.44 cents per kilowatt-hour,
compared to an average production cost of 1.69 cents per kilowatt-hour for the rest of the regional market.

Wolf Creek is also an integral part of the local community, as seen in charitable giving by Wolf Creek
Nuclear Operating Corp. and its employees. In 2004, Wolf Creek raised a record-setting $167,886 and
surpassed the $1 million mark for contributions to the United Way since 1997. The United Way
committee and Wolf Creek volunteers also participate in the United Way Day of Caring each year. This

                                                    5
Economic Benefits of Wolf Creek Generating Station

day is set aside to help those in need by planting flowers, repainting buildings or preparing homes for the
summer or winter.

Besides volunteer work for nonprofit organizations and charitable contributions, Wolf Creek employees
serve on various organizational committees to build relationships with local communities.

The company and its employees also recognize the importance of educating and informing the public
about the plant and nuclear energy. Wolf Creek’s many programs ensure the maintenance of positive
relationships with area communities and their citizens through community involvement, charitable
sponsorship and education opportunities.

                                                     6
Economic Benefits of Wolf Creek Generating Station

Section 1: Introduction
This economic impact study by the Nuclear Energy Institute1 (NEI) examines the economic, fiscal and
other benefits provided by the Wolf Creek Generating Station, operated by Wolf Creek Nuclear Operating
Corp. The plant is owned by Kansas City Power & Light Co. (a Great Plains Energy Inc. company),
Westar Energy and Kansas Electric Power Cooperative Inc.

This study also analyzes the economic and other benefits that the plant provides to Coffey County, the
state of Kansas and the United States. The analysis uses detailed data from Wolf Creek to assess those
benefits.

Although focused primarily on benefits to the local community, this study also analyzes state and national
benefits. These include direct impacts—such as people employed by the plant, expenditures within the
community and corporate tax payments—and indirect impacts, such as jobs created indirectly by plant
expenditures in the local economy. The study also discusses other benefits provided by the plant, such as
reliable, low-cost electricity, its contributions to air quality as an emission-free source of electricity, and
land stewardship.

Wolf Creek Nuclear Operating Corp. and NEI cooperated in developing this study. The company
provided data on employment, operating expenditures and tax payments, as well as guidance on details
specific to Coffey County and the plant.

NEI coordinated the project and applied a nationally recognized model to estimate the direct and indirect
impacts of the plant on the local community. RTI International, a nonprofit research organization in
Research Triangle Park, N.C., developed the methodology employed in this study. This is the seventh
such study conducted by NEI.

The remainder of this report contains five sections:

    •   Section 2 provides background on Wolf Creek, including costs, employment, plant history and
        performance, taxes, and local area details, such as total employment and earnings, as well as
        regional electricity prices.
    •   Section 3 examines the economic and fiscal impacts of the plant at local, state and national levels.
    •   Section 4 provides data on benefits not captured by the model, such as the plant’s contributions to
        the community and the environment.
    •   Section 5 outlines recent trends in the nuclear energy industry as a whole, including cost,
        performance and safety.
    •   Section 6 discusses the methodology used to complete the study and Impact Analysis for
        Planning, the economic modeling software employed as part of this effort.

1
 The Nuclear Energy Institute is the policy organization of the nuclear energy and technologies industry and
participates in both the national and global policymaking process.

                                                         7
Economic Benefits of Wolf Creek Generating Station
8Economic Benefits of Wolf Creek Generating Station
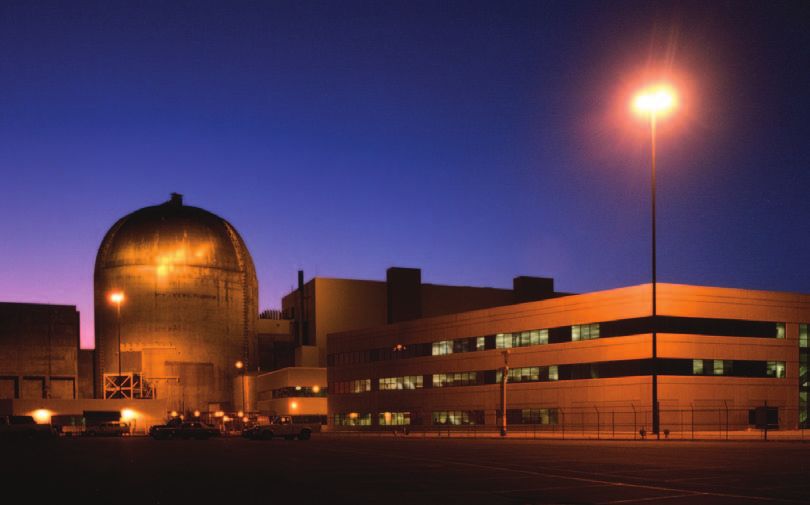
Section 2: The Wolf Creek Generating Station
This section provides background information on Wolf Creek and Coffey County to frame the results of
this report. It includes a brief history of the plant and information on its cost, employment, performance
and taxes. This section also provides information on local area details of Coffey County, its major cities
and the state of Kansas, including earnings, local tax collections, regional electricity cost and total
employment.
2.1 History and Information
The Wolf Creek Generating Station is located near Burlington, Kan., a town of about 2,800 inhabitants.
The plant is located on Coffey County Lake, approximately 3.5 miles northeast of Burlington. The plant
lies in Coffey County, which has a population of about 8,900.
Table 2-1. Wolf Creek Generating Station: At a Glance
Unit MWe Commercial Operation Year License Expiration Year Reactor Type
Unit 1 1,228 1985 2025 PWR
MW = megawatts; PWR = pressurized water reactor
Wolf Creek Generating Station, a 1,228-megawatt pressurized water reactor, began commercial operation
in 1985. Kansas Gas & Electric Co. operated the plant in 1986, but operation was transferred to Wolf
Creek Nuclear Operating Corp. in January 1987.
Throughout most of its operation, Wolf Creek has been a competitive component of the U.S. nuclear energy
industry. Since it began operating, the plant has maintained capacity factors above the industry average.
Capacity factor, a measure of
efficiency, is the ratio of Figure 2-1. 3-Year Average Capacity Factors
actual electricity generated
compared to the maximum 100%
possible generation if the 90%
plant were to operate at full
80%
capacity for one year.
70%
In 1998, Wolf Creek
60%
had its best year, with
a capacity factor of 50%
102 percent. 40% INDUSTRY
WOLF CREEK
30%
20%
10%
0%
86 87 88 89 90 91 92 93 94 95 96 97 98 99 00 01 02 03 04
Source: Energy Information Administration, Nuclear Regulatory Commission
9Economic Benefits of Wolf Creek Generating Station
Figure 2-2. The Wolf Creek Generating
Station and Surrounding Area
10Economic Benefits of Wolf Creek Generating Station
2.2 Generation
Wolf Creek generated more than 10 million megawatt-hours of electricity in 2004. The plant
provides about 19 percent of the electricity generated in Kansas each year. Plant output was driven
by a high capacity factor that reached 99 percent in 2004.
Wolf Creek provides power for the Southwest Power Pool North Sub-Region. Efficient performance
has made the Wolf Creek power plant cost-competitive in the sub-region. Wolf Creek had an average
production cost of 1.44 cents per kilowatt-hour in 2004, compared to an average production cost of
1.69 cents per kilowatt-hour for other electricity generators in the region.
Production costs represent the operations, maintenance and fuel costs of the plant. They do not
include depreciation, interest or ongoing capital costs. Contributions to the Nuclear Waste Fund,
established to pay for the disposal of used reactor fuel from commercial nuclear plants, are contained
within fuel costs. Customers of nuclear-generated electricity pay for the fund.
Table 2-2. Southwest Power Pool North Sub-Region
Production Cost and Generation in 2004
Average Production Cost Generation
Generation Source (in Cents/kWh) (in Million MWh)
Wolf Creek 1.44 10.13
Coal 1.46 48.25
Natural Gas 5.80 2.27
Oil 6.61 0.96
Region Total (Including Wolf Creek) 1.69 61.98
kWh = kilowatt-hour; MWh = megawatt-hour
Wolf Creek’s low production costs help make wholesale electricity prices affordable in Kansas.
Although Wolf Creek’s exact contribution is difficult to measure, an estimate can be made by
determining how much average production costs in the region would increase if a combined-cycle
natural gas plant (the plant of choice for new generation) replaced the Wolf Creek plant. Substituting
a combined-cycle natural gas plant for Wolf Creek in 2004 would have resulted in an increase in
average regional generation costs from 1.69 cents per kilowatt-hour to 2.40 cents per kilowatt-hour.
11Economic Benefits of Wolf Creek Generating Station
2.3 Employment
Besides providing affordable electricity to Kansas, Wolf Creek is a substantial employer in Coffey
County. The plant employs 1,028 full-time workers, of which 561 reside within the county. Full-
time employees include 358 people from Burlington, 78 from Waverly and 67 from Lebo. Another
35 employees reside in LeRoy, and 23 in Gridley. Wolf Creek employs 27 percent of working people
in Burlington and nearly a third of Waverly’s working population.
The jobs provided by the plant also are typically higher paying than most jobs in the area. Full-time
Wolf Creek employees who live in Coffey County earned, on average, about $71,101 in 2003. This
was approximately 57 percent higher than the average earnings of other workers in the county—about
$45,210 a year.
Table 2-3. Wolf Creek/Study Region Employment (Coffey County)
Wolf Creek City/County Totala
Percentage Employed
Permanent of Employed Average Work Average
City Employees Work Force Earningsb Force Earningsb
Burlington 358 27.3% $73,516 1,311 $44,968
Waverly 78 29.8% $65,781 262 $42,863
Lebo 67 14.3% $72,756 468 $44,116
LeRoy 35 13.5% $57,231 273 $35,420
Gridley 23 13.6% $67,859 169 $38,370
Coffey County Total 561 12.7% $71,101 4,431 $45,210
a Census 2000
b Earningsare defined as the sum of wage and salary income and represent the amount of income received regularly before
deductions for personal income taxes, Social Security, Medicare, etc.
12Economic Benefits of Wolf Creek Generating Station
Table 2-4. Top Ten Cities/Towns by Total Employees
Wolf Creek City/County Totala
Average Employed Average
City/Town County Employees Earningsb Work Force Earningsb
Burlington Coffey 358 $73,516 1,311 $44,968
Emporia Lyon 137 $77,269 13,183 $38,496
Waverly Coffey 78 $65,781 262 $42,863
Lebo Coffey 67 $72,756 468 $44,116
Ottawa Franklin 52 $82,285 5,840 $42,055
Garnett Anderson 39 $64,524 1,498 $39,062
LeRoy Coffey 35 $57,231 273 $35,420
Topeka Shawnee 26 $74,189 59,101 $44,230
Westphalia Anderson 23 $63,151 190 $25,612
Gridley Coffey 23 $67,859 169 $38,370
a Census 2000
b Earningsare defined as the sum of wage and salary income and represent the amount of income received regularly before
deductions for personal income taxes, Social Security, Medicare, etc.
Table 2-5. Top Ten Cities/Towns by Percent of Employed Work Force
Wolf Creek City/County Totala
Percentage Employed
of Employed Average Work Average
City/Town County Work Force Employees Earningsb Force Earningsb
Waverly Coffey 29.8% 78 $65,781 262 $42,863
Burlington Coffey 27.3% 358 $73,516 1,311 $44,968
Lebo Coffey 14.3% 67 $72,756 468 $44,116
Gridley Coffey 13.6% 23 $67,859 169 $38,370
LeRoy Coffey 12.8% 35 $57,231 273 $35,420
Westphalia Anderson 12.1% 23 $63,151 190 $25,612
Garnett Anderson 2.6% 39 $64,524 1,498 $39,062
Emporia Lyon 1.0% 137 $77,269 13,183 $38,496
Ottawa Franklin 0.9% 52 $82,285 5,840 $42,055
Topeka Shawnee 0.04% 26 $74,189 59,101 $44,230
a Census 2000
b Earningsare defined as the sum of wage and salary income and represent the amount of income received regularly before deductions
for personal income taxes, Social Security, Medicare, etc.
13Economic Benefits of Wolf Creek Generating Station
2.4 Local Taxes
Wolf Creek also makes substantial tax payments. In 2003, Wolf Creek paid $24 million in property
taxes to Coffey County. That same year, Coffey County collected approximately $29.3 million in
total property taxes. Wolf Creek’s property tax payments were 82 percent of the county’s total
property tax levy.
Table 2-6. Property Taxes Paid by Wolf Creek
Percentage
Property Taxes Paid Total Property Paid by Wolf
Location by Wolf Creek Plant Tax Collecteda Creek
Coffey County $24,047,900 $29,323,336 82%
State of Kansas $566,703 $2,651,360,991Economic Benefits of Wolf Creek Generating Station
Section 3: Economic and Fiscal Impacts
The economic and fiscal impacts of Wolf Creek’s operations go well beyond what the plant spends on
purchases, wages, salaries, employee benefits and taxes. They also reflect the strong stimulus that
plant operations provide to key measures of economic activity—the value of electricity production,
employment and labor income—in the local and state economies.
Wolf Creek’s spending lifts economic activity throughout the local and state economies. The private
sector feels the effects in the form of increased sales and employment, and the public sector through
increased tax revenues to support the provision of public services.
Estimates of these effects were developed by applying the Impact Analysis for Planning (IMPLAN)
model to expenditure data provided by Wolf Creek Nuclear Operating Corp., operator of the Wolf
Creek plant. (For more information on IMPLAN, see Section 6.)
3.1 Plant Expenditures in Coffey County
Wolf Creek expenditures in Coffey County totaled $56.5 million in 2003. Spending within the
county represented approximately 26 percent of the plant’s total spending of $214.4 million and
52 percent of the $109.3 million of spending in Kansas.
The expenditure totals for Coffey County provided by Wolf Creek Nuclear Operating Corp. appear in
Table 3-1, which contains the 10 sectors receiving the largest amount of Wolf Creek spending. The
categories are from among IMPLAN’s 509 sectors and are listed largely according to the IMPLAN
description for each. Total compensation, which includes benefits, salaries and wages, is listed
separately.
Tables 3-2 and 3-3 present similar expenditure totals for the state of Kansas and the United States,
respectively.
15Economic Benefits of Wolf Creek Generating Station
Table 3-1. Wolf Creek Expenditures in Coffey County
Description Amount
Waste Management and Remediation Services $404,902
State and Local Government Electric Utilities $232,461
Automotive Repair and Maintenance $94,556
Facilities Support Services $78,221
Maintenance and Repair Construction $62,071
Industrial Machinery Manufacturing $47,151
Business Support Services $39,723
Industrial Process Variable Instruments $18,665
Miscellaneous Store Retailers $11,435
Travel Arrangement and Reservation Services $10,950
Other $37,933
Subtotal $1,038,068
Total Compensationa $55,444,442
TOTAL $56,482,510
a Total compensation includes wages, salaries and fringe benefits based on data provided by Wolf Creek
Nuclear Operating Corp.
Total compensation for labor is $55.4 million and represents approximately 98 percent of Wolf
Creek’s expenditures in Coffey County. A large portion of the plant’s labor expenditures (employee
benefits, salaries and wages) stay “home” in the county. As expected, the county’s share is much
larger than the share at the state and national levels.
The largest non-labor expenditure in the county totaled $404,902, for waste management and
remediation services, representing payments for collection and removal of trash and non-hazardous
waste materials from the Wolf Creek facility. Trash generated by the plant is disposed of at the
Coffey County Landfill. As a result, the plant’s trash removal expenditures have a significant
economic impact on the county.
The next largest non-labor expenditure, at $232,461, was for state and local government electric
utilities. This amount represents plant payments made to the local utility for off-site power and
transmission services.
Many of the top sectors in Table 3-1 involve service expenditures. The prevalence of service sectors
illustrates the plant’s heavy reliance on contracted labor to perform specialized work, including
facilities and business support services in such areas as cafeteria, groundskeeping and janitorial
duties. Other examples are equipment and machinery rental, and general maintenance and repair
services.
16Economic Benefits of Wolf Creek Generating Station
3.2 Plant Expenditures in Kansas
In 2003, Wolf Creek spent $109.3 million for products and services (including labor) in Kansas. The
total includes $56.5 million dispersed in Coffey County and $52.8 million spent in other areas of
Kansas. Spending within the state represents approximately 51 percent of the plant’s total
expenditures of $214.4 million.
Table 3-2 provides details on spending within the state. Total compensation is the largest category at
$103.6 million and represents about 95 percent of the total. This is slightly less than the share of total
compensation for Coffey County spending. Instead, more money is spent on products and non-labor
services in the rest of Kansas.
Table 3-2. Wolf Creek Expenditures in Kansas
Description Amount
Professional and Technical Services $1,026,376
State and Local Government Agencies $684,544
Waste Management and Remediation Services $404,902
Employment Services $385,261
Maintenance and Repair Construction $353,643
Facilities Support Services $321,356
State and Local Government Electric Utilities $238,557
Industrial Process Variable Instruments $183,565
Petroleum and Coal Products Manufacturing $176,112
Business Support Services $157,719
Other $1,700,978
Subtotal $5,633,013
a
Total Compensation $103,620,884
TOTAL $109,253,897
a
Total compensation includes wages, salaries and fringe benefits based on data provided by Wolf Creek Nuclear
Operating Corp.
As in Table 3-1, large contracts are identified to show the most important expenditures at the state
level. The largest category is professional and technical services, which represents membership in,
and services of, highly specialized professional and technical organizations serving the electric power
and nuclear industries.
Payments to state and local government agencies, the second-largest non-labor expenditure category
for Kansas, totaled $684,544. This represents payments to state agencies, such as the Kansas
Adjutant General and the Department of Health and Environment, for emergency preparedness and
worker health and safety.
17Economic Benefits of Wolf Creek Generating Station
Employment services is another large state-level expenditure, totaling $385,261. This sector
represents payments for specialized temporary labor during outages and major plant repairs. Waste
management services continue to be a significant component of spending at the state level, as do
services associated with basic plant maintenance and payments to state electric utilities.
3.3 Plant Expenditures in the United States
Wolf Creek expenditures for products and services (including labor) purchased in the United States
totaled $214.4 million in 2003. Besides expenditures of $109.3 million in Coffey County and other
areas of Kansas, the plant spent $105.1 million elsewhere in the United States, largely for specialized
products and services unique to the nuclear industry.
Table 3-3. Wolf Creek Expenditures in the United States
Description Amount
Other Basic Inorganic Chemical Manufacturing $20,841,703
Other Federal Government Enterprises $12,707,835
Insurance Carriers $12,402,785
Architectural and Engineering Services $10,998,392
Other Maintenance and Repair Construction $9,746,980
Scientific Research and Development Services $4,963,966
Industrial Process Variable Instruments $3,476,907
Business Support Services $3,205,773
Waste Management and Remediation Services $2,932,392
Other Computer Peripheral Equipment Manufacturing $2,434,859
Other $27,085,243
Subtotal $110,796,835
a
Total Compensation $103,620,884
TOTAL $214,417,719
a
Total compensation includes wages, salaries and fringe benefits based on data provided by Wolf Creek
Nuclear Operating Corp.
Table 3-3 details national expenditures. Total compensation ($103.6 million) remains the largest
category, representing 48 percent of the total. Compensation as a share of the U.S. total is lower
because plant employees live almost entirely in Kansas (especially in Coffey County), while spending
on products and non-labor services is concentrated outside the state.
Other basic inorganic chemical manufacturing, the largest non-labor spending category, represents
plant spending on nuclear fuel. The second-largest non-labor expenditure group—other federal
government enterprises—primarily represents plant payments made to the U.S. Nuclear Regulatory
18Economic Benefits of Wolf Creek Generating Station
Commission and the U.S. Department of Energy for licensee fees and future waste disposal cost.
NRC fees paid by U.S. nuclear plants cover the cost of nuclear plant regulation.
Payments to insurance carriers constitute another large spending category at the national level. This
sector includes expenditures for employee insurance plans, as well as insurance for plant capital. Due
to the considerable employee liability associated with an entity of Wolf Creek’s size, underwriting by
large, national insurance companies is necessary. A nuclear plant also requires specialized insurance
against risks related to situations such as long-term shutdowns, decontamination and
decommissioning.
The next three largest national spending categories are for architectural and engineering services,
maintenance and repair, and scientific research and development. Purchases in these sectors are not
unique to Wolf Creek, and reflect the need for highly specialized skills and services at nuclear plants.
These expenditures reflect the plant’s commitment to safe operations and improved performance
through high availability rates and capacity factors.
Other large spending categories are similar to the state-level expenditures, with the exception of the
waste management category. Expenditures for waste management and remediation services at the
national level constitute removal of hazardous waste materials.
3.4 Taxes Paid and Accrued
Wolf Creek paid $24.8 million in state and local taxes in 2003. This total is comprised mainly of
property taxes paid to the local areas surrounding the plants. Additionally, the plant made payroll tax
payments of $5.6 million to the federal government.
Table 3-4. Taxes Paid by Wolf Creek Nuclear Plant
Description Amount
Federal Government
Payroll Tax $5,649,334
Other $4,727
Total Federal Taxes $5,654,061
State and Local Government
Property Tax $24,639,242
Other $209,514
Total State and Local Taxes $24,848,756
Total Taxes Paid $30,502,817
19Economic Benefits of Wolf Creek Generating Station
3.5 Economic Impacts on Geographic Area
Summary economic impacts for each of the three geographic areas—Coffey County, Kansas and the
United States—are presented in Table 3-5. The three economic impact variables are:
• output—the value of production of goods and services
• labor income—the earnings of labor
• employment—measured in jobs provided.
Table 3-5. Impact of Wolf Creek on Local, State and National Economies
Direct Secondarya Total
Coffey County
Output $600,000,000 $7,853,063 $607,853,063
Labor Income $55,444,442 $2,256,337 $57,700,779
Employment 561 121 682
Kansas
Output $600,000,000 $79,907,338 $679,907,338
Labor Income $103,620,884 $25,636,614 $129,257,498
Employment 1,028 986 2,014
United States
Output $600,000,000 $640,950,380 $1,240,950,380
Labor Income $103,620,884 $230,049,405 $333,670,289
Employment 1,028 5,940 6,968
a
Secondary effects include indirect and induced impacts. Indirect impacts measure the effect of input suppliers on
expenditures by Wolf Creek Nuclear Operating Corp., while induced impacts measure the effects produced by the change
in household income resulting from Wolf Creek expenditures.
These overall economic impacts are divided into direct or secondary effects. The direct effects reflect
the industry sector and geographical distribution of Wolf Creek’s spending without any subsequent
spending effects.
The secondary effects include subsequent spending effects and are divided into two types: indirect
and induced. Indirect effects show how the plant’s spending patterns alter subsequent spending
patterns among input suppliers. Induced effects reflect how changes in labor income influence the
final demand for goods and services, which then has an impact on all sectors producing basic,
intermediate and final goods and services.
The direct effects are based on the estimated value of the power production from the Wolf Creek
plant of $600 million for 2003. This output value is based on Wolf Creek’s estimated revenues for
2003.
20Economic Benefits of Wolf Creek Generating Station
This output value is divided among consumer benefits, investor returns, plant purchases, salaries and
taxes, which reflects the total output of products and services associated with Wolf Creek. This total
includes the expenditures for products and services (including labor) itemized in Tables 3-1, 3-2 and
3-3.
The direct employment entry (1,028 jobs) for the United States is Wolf Creek’s employment level in
2003. Workers from Coffey County fill the majority of these jobs (about 55 percent). The direct
labor income entries reflect the geographic distribution pattern of Wolf Creek employment.
As Table 3-5 indicates, direct effects are the largest contributor to total effects for each measure of
economic impact for Coffey County and Kansas. Secondary effects are most important as a share of
the total effects in the United States.
Within the secondary effects, induced effects are larger than indirect effects for Coffey County and
Kansas, because the direct effects on labor income are large and the final demand changes affect more
sectors than are included in the indirect effects. The induced effects represent the increased local
output due to the additions Wolf Creek makes to the local employment base.
A helpful way of measuring the ripple effects is by using multipliers, which show the ratio of the
plant’s “total economic impact” to its “direct economic impact” and can be measured for each
geographic region. Multipliers essentially measure how many dollars are created in the economy for
every dollar spent by the plant.
In terms of output, Wolf Creek’s direct impact for the local area is $600 million, while its total impact
is $608 million. Thus, the total output multiplier for Coffey County is 1.01 (or $608 million divided
by $600 million). This indicates that for every dollar of output from the Wolf Creek plant, the Coffey
County economy produces $1.01.
Using the same formula, the output multiplier is 1.13 for Kansas and 2.07 for the United States. This
means for every dollar of Wolf Creek output, the state economy produces $1.13 and the U.S.
economy produces $2.07.
3.6 Economic Impacts on Local Industry
Wolf Creek’s economic impacts spread over nearly every economic sector. Although the direct
effects are concentrated in a few sectors, the secondary effects—and especially the induced effects—
increase the dispersion of economic impacts across other sectors. The most-affected sectors vary by
geographic area.
Table 3-6 presents the 10 sectors most affected by the plant in Coffey County, based on total output.
Since local salaries dominate plant spending, the impacts in the local area are most notable in areas
that cater to the plant’s employment base.
The sector most affected in terms of total output is power generation and supply, which includes the
electricity produced by the plant. Thus, all direct effects are included in this sector. It is also the
largest sector, based on total output, in the state and national economies, as shown in Tables 3-7 and
3-8, respectively.
21Economic Benefits of Wolf Creek Generating Station
The next most-affected sector is housing values. This is not a traditional business/industry sector, so
it had no impacts on labor income or employment. Instead, it is a special sector developed by the
U.S. Department of Commerce that estimates what homeowners would pay if they rented, rather than
owned, their homes. In essence, it creates an industry from owning a home.
The sole product (or output) of this industry is home ownership, purchased entirely by personal
consumption expenditures from household income. In effect, this sector captures increases in housing
values caused by increased labor in the area resulting from the plant.
The other sectors most affected by Wolf Creek are related to providing goods and services to the
plant’s large employment base, including hospitals, doctor and dentist practices, restaurants, retail
stores, retailers, and automotive dealerships. Indirect spending by plant employees boosts the sales
and work forces of these industries, typically operated by local small business owners.
Table 3-6. Wolf Creek’s Impacts on the Most-Affected Industries in Coffey County
Industry Description Output Labor Income Employment
Power Generation and Supply $600,415,259 $55,542,708 562
Housing Values $1,552,916 $0 —
Physicians, Dentists, Health Care Providers $770,457 $471,625 12
Wholesale Trade $727,535 $274,963 7
Food Services and Drinking Places $652,238 $258,549 19
Monetary Authorities/Credit Intermediaries $485,021 $102,258 4
Automotive Repair and Maintenance $444,394 $88,595 3
Food and Beverage Stores $238,756 $89,717 7
Motor Vehicle and Parts Dealers $194,175 $90,961 3
State and Local Government Agencies $187,230 $53,156 2
Other $2,185,082 $728,247 63
TOTAL $607,853,063 $57,700,779 682
22Economic Benefits of Wolf Creek Generating Station
3.7 Economic Impacts on State Industry
Table 3-7 uses the same sectors applied in Table 3-6 to illustrate the plant’s economic impact on
the state of Kansas. Again, the power generation and supply sector and housing values are the
most-affected categories.
The other entries in Table 3-7 for the most-affected industries in Kansas are similar to those in
Coffey County.
Table 3-7. Impact of Wolf Creek on the Most-Affected Industries in Kansas
Industry Description Output Labor Income Employment
Power Generation and Supply $601,288,310 $103,925,744 1,032
Housing Values $8,297,632 — —
Hospitals $4,729,985 $1,729,719 46
Wholesale Trade $4,393,019 $1,675,468 35
Physicians, Dentists, Health Care Providers $3,981,990 $2,471,508 47
Food Services and Drinking Places $3,943,016 $1,728,715 99
Real Estate $2,967,492 $348,246 29
Monetary Authorities/Credit Intermediaries $2,621,160 $552,463 16
Automotive Repair and Maintenance $2,426,381 $490,365 18
Motor Vehicle and Parts Dealers $1,798,271 $896,611 24
Other $43,460,082 $15,438,659 668
TOTAL $679,907,338 $129,257,498 2,014
23Economic Benefits of Wolf Creek Generating Station
3.8 Economic Impacts on U.S. Industry
Table 3-8 illustrates Wolf Creek’s economic impact on the United States. Again, the most-affected
sectors are power generation and housing values, in terms of total output. The third-largest sector is
wholesale trade, a general category that reflects sales of a broad range of goods and services by
wholesalers.
The 10 most-affected sectors (based on output) in the United States are similar to the 10 most-
affected sectors in Coffey County and Kansas. The main differences are in the insurance carriers,
basic inorganic chemical manufacturing and engineering and architectural services sectors. Impacts
for these categories are derived from direct expenditures of the plant, rather than indirect or induced
effects.
Table 3-8. Wolf Creek’s Impacts on the Most-Affected Industries in the United States
Industry Description Output Labor Income Employment
Power Generation and Supply $607,387,405 $105,370,576 1,043
Housing Values $29,816,192 — —
Wholesale Trade $28,125,382 $10,787,446 196
Insurance Carriers $26,569,026 $8,249,471 149
Real Estate $23,805,672 $2,799,183 156
Hospitals $19,239,790 $7,693,779 176
Food Services and Drinking Places $17,568,124 $7,680,608 442
Other Basic Inorganic Chemical Manufacturing $16,771,922 $3,555,714 43
Monetary Authorities/Credit Intermediaries $16,607,248 $3,474,669 72
Architectural and Engineering Services $14,841,386 $9,220,172 164
Other $440,218,233 $174,838,671 4,527
TOTAL $1,240,950,380 $333,670,289 6,968
24Economic Benefits of Wolf Creek Generating Station
3.9 Tax Impacts
The effect of Wolf Creek’s spending extends beyond the taxes paid directly on the plant. This
spending has direct impacts on income and value creation, which in turn affects taxes paid on that
income and value. Similarly, the secondary effects of plant purchases on other products and services,
in addition to the increased economic activity itself, lead to additional income and value creation, as
well as additional tax revenues. These additional or “induced” effects on tax payments are much
larger than the taxes paid directly. Table 3-9 describes these results.
Wolf Creek is responsible for almost $30 million in state and local tax revenue, either directly or
indirectly. Much of the indirect expenditures are the result of additional property tax revenue created
by the large number of employees at the Wolf Creek plant.
At the federal level, Wolf Creek’s operations resulted in $65.5 million in tax revenue, mostly from income
and Social Security taxes.
Table 3-9. Tax Impacts of Economic Activity Induced by Wolf Creek
Taxes Induced
Taxes Paid by by Wolf Creek Total
Wolf Creek Expenditures Tax Impacta
Federal Government
Payroll Tax $5,649,334 $24,819,788 $30,469,122
Corporate Tax — $6,102,465 $6,102,465
Personal Tax — $24,650,405 $24,650,405
Business Tax $4,727 $4,259,165 $4,263,892
Total Federal Government $5,654,061 $59,831,823 $65,485,884
State and Local Government
Payroll Tax $7,619 $25,655 $33,274
Corporate Tax — $113,107 $113,107
Personal Tax — $830,481 $830,481
Business Tax $24,841,137 $4,057,740 $28,898,877
Total State and Local Government $24,848,756 $5,026,983 $29,875,739
Total Taxes $30,502,817 $64,858,806 $95,361,623
a
The total tax impact includes taxes paid by Wolf Creek and other entities as a result of the economic activity created by Wolf
Creek expenditures.
25Economic Benefits of Wolf Creek Generating Station
3.10 Summary
Wolf Creek has substantial economic impacts on Coffey County and Kansas. When compared with
their respective economies, those relative impacts are highest for Coffey County, next highest for
Kansas and lowest for the United States.
Like other nuclear plants, Wolf Creek buys many specialized products and services not available in
local and state economies. National and international markets typically provide these products and
services.
The state and local economic effects of the plant are substantial, largely because of the buying power
created by Wolf Creek’s high wages, salaries and benefits. In turn, plant employees buy goods and
services provided locally. This spending supports many small businesses in the area.
26Economic Benefits of Wolf Creek Generating Station
Section 4: Additional Benefits Provided by Wolf Creek
Community trust in Wolf Creek’s ability to ensure public health and safety through operating the
plant safely, reliably and efficiently is vital to the company’s survival and success. The company and
its employees recognize the importance of educating and informing the public about the plant and
nuclear energy. Wolf Creek’s many programs ensure the maintenance of positive relationships with
area communities and their citizens through community involvement, charitable sponsorship and
educational opportunities. Educating the public is an investment in Wolf Creek’s future and being a
good neighbor is important to the plant and its employees.
The plant offers outreach programs to organizations interested in learning more about Wolf Creek and
the industry. Each year, numerous Speakers Bureau participants offer presentations to various
groups, such as civic and service organizations, schools and science clubs. Plant personnel offer a
variety of presentations, from “How Wolf Creek Works” to a radiation demonstration. This provides
an interactive way for people of all ages to learn about Wolf Creek and the benefits of nuclear energy
as a safe, reliable and environmentally responsible electricity source.
Wolf Creek employees staff informational booths and participate in area parades at the Kansas State
Fair, Kansas Association of Teachers of Science Kamp, Kansas State University’s Engineering Open
House, Earth Day, Environmental Awareness Day and area Christmas parades.
Wolf Creek sponsors FunFlight at Burlington’s May Daze Festival, a county student scholarship,
Governor’s Fishing Classic, Grants for Excellence, Boy Scout workshops and Girl Scout events.
Other plant-sponsored activities include safety fairs in area elementary schools, presidential awards
for teachers in math and science disciplines, and Sonia Kovalevsky Mathematics Day at Emporia
State University.
One of the most successful plant sponsorships is the Governor’s Fishing Classic. For the past eight
years, Wolf Creek, along with Kansas Wildscape Foundation, Coffey County Sheriff’s Department
and the Kansas Department of Wildlife and Parks, has co-sponsored the fishing tournament held on
Coffey County Lake. The two-day event includes a celebrity fishing and golf tournament that draws
more than 100 anglers and golfers. Children from local Hooked on Fishing, Not on Drugs chapters
learn about ethical fishing practices and water safety. They also participate in their own fishing
tournament. More than 60 Wolf Creek volunteers assist with the fishing classic by launching boats,
registering participants, measuring fish and helping youngsters bait hooks, remove fish from hooks
and measure fish.
In 2003, Wolf Creek volunteers created a “Green Team,” an environmental stewardship group that
guides and completes special environmental projects. These volunteers have installed bluebird and
kestrel nest boxes around the plant site, improved quail habitat, sampled ponds on company property,
and worked on Environmental Education Area trails.
Wolf Creek participates in other environmental programs, including a program that introduced
Peregrine falcons to the Wolf Creek site to reduce the population of predator birds. Other
environmental programs include a quail habitat demonstration project and goose nesting structures
on plant property.
27Economic Benefits of Wolf Creek Generating Station
In 2001, approximately 30 International Brotherhood of Electrical Workers employees from the Wolf
Creek plant constructed a fire escape for the Emporia Rescue Mission, a shelter for homeless men.
Union members also built platforms and stairs and performed other construction services.
Wolf Creek employees give generously to surrounding communities through contributions to the
United Way. The 2004 campaign was an especially memorable one. In 2004, Wolf Creek raised a
record-setting $167,886 and surpassed the $1 million mark for contributions to the United Way since
1997. The plant raised the funds through pledges, golf tournaments and silent auctions. The United
Way committee and Wolf Creek volunteers also participate in the United Way Day of Caring each
year. This day is set aside to help those in need by planting flowers, repainting buildings or preparing
homes for the summer or winter.
Employees continue their involvement with local communities by participating in the American
Cancer Society’s Relay for Life, Law Enforcement Torch Run for Special Olympics, MS-150 bike
ride, annual warm blanket and canned food drive, holiday toy drive and community blood drives.
Besides this volunteer work for nonprofit organizations, Wolf Creek employees serve on various
organizational committees to build relationships with local communities.
28Economic Benefits of Wolf Creek Generating Station
Section 5: Nuclear Industry Trends
The U.S. nuclear energy industry has steadily improved performance and cost, while also improving
plant safety. The nuclear energy industry is a model of industrial safety.
Total electricity production for U.S. nuclear power plants reached a record 788.6 billion kilowatt-
hours in 2004. Power plant performance is measured by capacity factor, which compares the amount
of electricity actually produced by a plant with the maximum achievable. U.S. nuclear power plants
achieved an average capacity factor of 90.5 percent in 2004. At the same time, production costs for
those plants have been among the lowest of any baseload fuel source.
5.1 Nuclear Industry Performance
U.S. nuclear power plants have increased their output and improved their performance significantly
over the past 10 years. Nuclear energy represents about 20 percent of all electricity generated in the
United States. Since 1990, the industry has increased total output equivalent to that of 26 new, large
nuclear plants. This increase in output occurred without building any new nuclear plants.
Figure 5-1.
U.S. Nuclear Industry Net Electricity Generation
(37% increase from 1990 to 2004)
800 788.6
750
700
Billion kilowatt-hours
650
600
550
500
450
400
90 91 92 93 94 95 96 97 98 99 00 01 02 03 04
Source: Energy Information Administration
Meanwhile, overall capacity factors for U.S. nuclear power plants increased dramatically over the
past decade, reaching about 90.5 percent in 2004. By contrast, the industry’s average capacity factor
for the industry was 60 percent in the late 1980s. One of the key reasons for the increased capacity
factor has been the shortening of refueling outage times.
29Economic Benefits of Wolf Creek Generating Station
Nuclear plants need to Figure 5-2.
shut down to refuel Nuclear Industry Average Capacity Factors
approximately every 18 to 100 (1990-2004)
24 months. Refueling 95
represents one of the major 90
90.5
Capacity Factor (%)
determinants of nuclear 85
plant availability.
80
75
In the past 10 years, the
70
durations of refueling
65
outages have been
60
declining. In 1990, the
55
average refueling outage
90 91 92 93 94 95 96 97 98 99 00 01 02 03 04
took 105 days to complete.
Source: Energy Information Administration
By 2004, this number
declined to an average of
44 days, and companies continue to apply best practices to reduce further this average length of
refueling. The record for the shortest outage is 14.67 days for a boiling water reactor and 15.67 days
for a pressurized water reactor.
5.2 Cost Competitiveness
Along with increasing output, the U.S. nuclear industry has continued to decrease the cost of its
operations. In 2004, nuclear power had a production cost of 1.68 cents/kilowatt-hour. In the past
decade, nuclear production costs have dropped by about one-third because of the increased capacity
factor of U.S. plants. Since most nuclear plant costs are fixed, greater electricity production lowers
costs. However, nuclear plants also have taken steps to reduce their total cost through improved work
processes.
Figure 5-3. U.S. Electricity Production Costs
(1995-2004 in constant 2004 cents per kilowatt-hour)
$8.00
$7.00
$6.00 Gas 5.87
Oil 5.39
$5.00
$4.00
$3.00
Coal 1.92
$2.00
Nuclear 1.68
$1.00
$0.00
1995 1996 1997 1998 1999 2000 2001 2002 2003 2004
Source: Energy Velocity, Electric Utility Cost Group
30Economic Benefits of Wolf Creek Generating Station
Table 5-1. Wholesale Electricity Prices by Region
(in cents per kilowatt-hour)
Region 2004 Average 24/7 Power Prices
Northeast/Mid-Atlantic 5.31
Southeast 4.62
Midwest 4.22
South Central 4.88
Northwest 4.62
Southwest 4.92
Because of low production costs and excellent safety performance, nuclear plants are highly
competitive in today’s energy markets. Ultimately, the primary test of nuclear energy’s
competitiveness is how well it performs against market prices. In this respect, nuclear energy is
highly competitive. The average production cost at the nation’s 103 reactors was 1.68 cents per
kilowatt-hour in 2004, lower than the average price in all regional markets. Nuclear energy is also
competitive with futures market prices, one of the best ways to judge what prices will be in the year
ahead.
Nuclear plants provide a unique degree of price stability for two reasons. First, production costs for
nuclear plants are comprised of costs not associated with fuel. Fuel markets tend to be volatile, so the
production costs of generation sources tied to fuel expenses are highly volatile, as they swing with
variations in the market. Fuel represents only 25 percent of the production cost of nuclear energy,
but it makes up
75 percent to Figure 5-4. Monthly Fuel Cost to Electric Generators
90 percent of the
(in 2004 cents per kilowatt-hour from 1995 to 2004)
cost of natural
gas-, coal- and 14
petroleum-fired
generation. 12
Second, nuclear
fuel prices are 10
much more stable
than that of fossil 8
fuels, particularly
6 GAS 6.0
natural gas and
petroleum. OIL-H 4.8
4
Because of its
stable, low
2
production cost, COAL 1.5
nuclear energy 0
URAN .5
can help mitigate 1995 1996 1997 1998 1999 2000 2001 2002 2003 2004
large electricity Source: Energy Velocit
price swings. Source: Energy Velocity
31Economic Benefits of Wolf Creek Generating Station
5.3 Industry Safety
The nuclear industry’s recent performance and cost achievements occurred in an era of outstanding
safety at U.S. nuclear plants. In 2004, the nuclear energy industry was close to meeting all 2005
safety goals set by the Institute of Nuclear Power Operations (INPO) and the World Association of
Nuclear Operators (WANO). These entities track safety and performance data in 10 important areas.
One key indicator tracked by INPO and WANO is the number of unplanned automatic plant
shutdowns. The U.S. industry has made dramatic improvements in the number of unplanned
automatic shutdowns, dropping from a median of 7.3 shutdowns per reactor in 1980 to 0 in 2004.
Other safety and performance indicators tracked by the Nuclear Regulatory Commission confirm
the excellent safety performance of U.S. nuclear plants. The NRC tracks data on the number of
“significant events” at each nuclear plant. (A significant event is any occurrence that challenges
a plant’s safety system.) The average number of significant events per reactor has declined from
0.77 per year in 1988 to 0.02 in 2003.
In addition to safe operations, U.S. nuclear plants continue to improve their already high levels of
worker safety. According to NRC data, radiation exposure to workers (measured in rems) decreased
from an average of about 1 rem per year in 1973 to 0.16 rem per year in 2003. Both the historical and
current doses per employee are far below the regulatory limit of 5 rems per year.
Figure 5-5. Significant Events: Annual Industry Average
(Number of events per reactor 1990-2003)
0.5
0.45
0.5
0.40
0.4
0.4
0.3
0.25 0.26
0.3 0.21
0.2 0.17
0.2
0.10
0.08
0.1
0.04 0.03 0.05 0.04
0.1 0.02 0.02
0.0
90 91 92 93 94 95 96 97 98 99 00 01 02 03
Source:
Source: Nuclear
Nuclear Regulatory
Regulatory CommissionCommission Information
Information Digest Digest
32Economic Benefits of Wolf Creek Generating Station
Figure 5-6. Nuclear's Superior Safety Record (2003)
Nuclear Industry's Industrial Safety Accident Safety Rates Compared to Other Industries
4.0 3.8
3.5
Industrial Accident Safety Rate*
3.0
2.5
2.0
2.0
1.5
1.0
0.5 0.25
0.0
Nuclear Electric Utilities Manufacturing
*Number of accidents resulting in lost work, restricted work, or job transfer per 200,000 worker hours.
Sources: World Association of Nuclear Operators, U.S. Bureau of Labor Statistics.
General worker safety is also excellent at U.S. nuclear power plants—far safer than in the U.S.
manufacturing sector. WANO and the Bureau of Labor Statistics provide information on the
industrial accident safety rate. This statistic measures the lost workday accidents or fatalities per
200,000 worker hours. The nuclear industry has improved its industrial accident safety rate from
0.46 in 1996 to 0.25 in 2003. By comparison, the U.S. manufacturing industry had an industrial
accident safety rate of 3.8.
5.4 Current Industry Events
The excellent economic and safety performance of U.S. nuclear plants has increased interest in
nuclear energy by the electric utility industry, the financial community and policymakers. This is
evidenced by the increasing number of plants seeking license renewals from the NRC.
Originally licensed to operate for 40 years, nuclear plants can safely operate for longer periods. The
NRC granted the first 20-year license renewal to the Calvert Cliffs plant in Maryland in 2000. As
of June 2005, 32 plants have received license extensions, and 41 reactors have either submitted
applications or formally announced that they will seek to renew their licenses. License renewal is an
attractive alternative to building new electric capacity because of nuclear energy’s low production
costs and the return on investment provided by extending a plant’s operational life.
Besides relicensing current plants, interest has recently increased in building new nuclear plants.
Three companies—Entergy, Dominion Energy and Exelon—have submitted early site permit
applications to the NRC to test the agency’s permitting process for new reactor sites.
Three groups of energy companies are seeking to collaborate with the U.S. Department of Energy to
test a new licensing process for building and operating an advanced nuclear reactor called a combined
construction and operating license. The effort is part of DOE’s Nuclear Power 2010 program,
established to foster the development of next-generation nuclear power plants.
33Economic Benefits of Wolf Creek Generating Station
34Economic Benefits of Wolf Creek Generating Station
Section 6: Economic Impact Analysis Methodology
The methodology used to estimate the economic impacts of the Wolf Creek nuclear power plant is
called input/output analysis. Several operational input/output models are available in the
marketplace. The market leaders are Impact Analysis for Planning (IMPLAN), Regional Economic
Models Inc. and Regional Input-Output Modeling System II. The study’s authors selected the
IMPLAN model primarily because of the availability of the model and data sets. Other important
factors were its relevance to the particular application, as well as its transparency and ease of use.
This section presents typical applications of input/output analysis and explains the methodology and
its underpinnings. It also describes how Wolf Creek data and the IMPLAN model estimate the local,
state and national economic impacts of the plant’s operation.
6.1 Use of Input/Output Models
Input/output models capture input, or demand, and output, or supply, interrelationships for detailed
business, industry and government sectors in a geographic region. They also capture the consumption
of goods and services for final demand by these sectors and by the household sector.
The basic geographic region is a county, but model results can be developed at the multi-county,
state, multi-state and national levels. These results are particularly useful in examining the total
effects of an economic activity or a change in the level of that activity.
These models typically are used when the following key questions need to be addressed:
• How much spending does an economic activity (such as a power plant) bring to a region
or local area?
• How much of this spending results in sales growth by local businesses?
• How much income do local businesses and households generate?
• How many jobs does this activity support?
• How much tax revenue does this activity generate?
These models also are useful in addressing related questions, such as the geographic and industry
distribution of economic impacts. Typical applications of these models include facility or military
base openings and closings, transportation or other public infrastructure investments, industrial
recruitment and relocation, and tourism.
6.2 Overview of the Input/Output Methodology
Input/output models link various sectors of the economy—e.g., agriculture, construction, government,
households, manufacturing, services and trade—through their respective spending flows in a
reference year. These linkages include geographic linkages, primarily at national, state and county
levels.
Because of these linkages, the impact of an economic activity in any sector or geographic area on
other sectors and areas can be modeled. These impacts can extend well beyond the sector and area in
which the original economic activity is located. They include not only the direct, or initial, effects of
the economic activity, but also the secondary, or “ripple,” effects that flow from this activity.
35You can also read