K-12 Finance 2020 - A Citizen's Guide to Washington State
←
→
Page content transcription
If your browser does not render page correctly, please read the page content below
A Citizen's Guide to Washington State

K-12 Finance

           2020
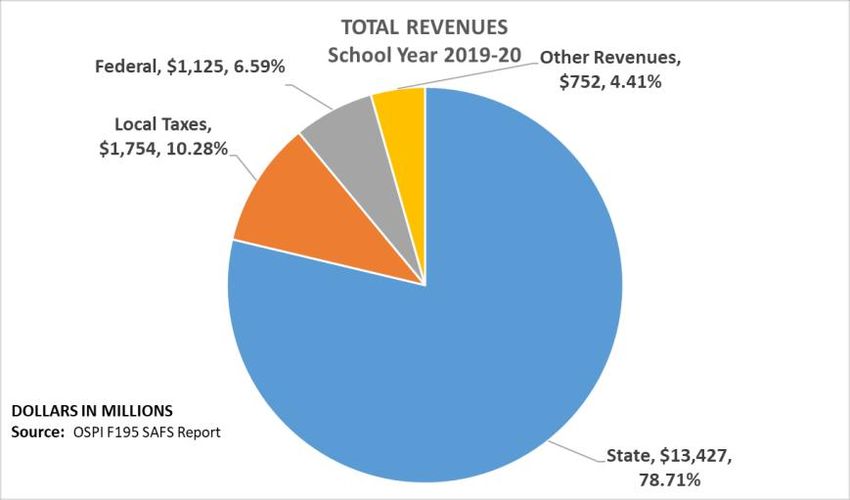
Table of Contents

How does recent legislation affect K-12 instruction and funding of basic
education? .......................................................................................... 2
How many students attend K-12 schools in the state? .................................. 2
How are public schools in Washington organized? ..................................... 2
What does the Washington State Constitution provide regarding K-12 public
schools? ………………………………………………………………………… 3
How has this constitutional provision been interpreted in the state courts? ....... 3
What is the McCleary decision? .............................................................. 4
How has the State implemented the Program of Basic Education? ................. 7
What is the role of the federal government in public elementary and secondary
education? ........................................................................................ 16
What is Initiative 1351? ...................................................................... 17
How much of the state near-general fund is spent on K-12 public schools? .... 18
How do school districts receive local funding?  ........................................ 19
What is Local Effort Assistance and Levy Equalization? ........................... 20
How does the state lottery support public schools? ................................... 20
What are other types of dedicated funding utilized by school districts? ......... 21
How is school construction funded in the state? ....................................... 22
How has the amount of the near-general fund support of K-12 public schools
changed since 2005? ........................................................................... 22
How much of total K-12 funding comes from the state? ............................. 25
What are school district expenditures by activity? .................................... 26
What are school district expenditures by student and program? ................... 28
How has total per-student spending changed since 2000?........................... 30
How has state per-student funding changed since 2000? ............................ 31
How is the salary level for teachers determined? ...................................... 31
What is the average salary level for teachers? .......................................... 32
How is the salary level of administrators and classified staff determined? ..... 33
How does Washington fund school employee health benefits? .................... 34
How does Washington compare to other states? ....................................... 35

2
Introduction
    The 2020 Citizen’s Guide to K-12 Finance is offered to provide a clear
and simple overview of K-12 financial issues. It provides general
information on K-12 finance by answering frequently asked questions.

     For more in-depth information about K-12 finance, see Organization
and Financing of Washington Public Schools published by the Office of
Superintendent of Public Instruction (OSPI). It is available at:
http://www.k12.wa.us/safs/PUB/ORG/Org.asp. The information presented
in this document is based on statewide data.

     For information about a specific school district, inquire with that school
district. Detailed K-12 fiscal data, on both statewide and district-specific
levels, are also reported on the Washington State fiscal transparency website
at: http://fiscal.wa.gov/k12.aspx.

    The 2020 Citizen’s Guide to K-12 Finance was prepared by non-partisan
Senate Committee Services staff supporting the Senate Ways and Means
Committee and the Senate Early Learning & K-12 Education Committee,
with the assistance from staff of the Legislative Evaluation and
Accountability Program (LEAP) Committee.

    Questions regarding the guide or requests for additional copies should
be addressed to:
    Senate Ways and Means Committee
    311 John A. Cherberg
    Olympia, Washington 98504-0482
    Telephone: 360-786-7716
    Fax: 360-786-7615
    http://www.leg.wa.gov/Senate/Committees/WM/Pages/default.aspx

                                                                              1
How does recent legislation affect K-12 instruction and
funding of basic education?
In response to the McCleary decision, the enactment of Engrossed
House Bill (EHB) 2242 (Chapter 13, Laws of 2017, 3rd special session) and
its implementing appropriations in the 2017-19 operating budget increased
state allocations for school staff salaries and changed the way these salaries
are established and adjusted in the future. Under these reforms, future state
salary allocations will be updated, if necessary, to ensure that state basic
education allocations continue to provide market-rate salaries, and that
regionalization adjustments reflect actual economic differences between
school districts. In addition, EHB 2242 provides new state common school
tax revenues, increases state programming and funding for a number of K-12
basic education programs, reforms how local levy revenues are calculated
and their uses, and enacts other reforms to further increase the transparency,
accountability, and efficiency of school funding. A more detailed
description of these changes is provided in later parts of this document.
Additional information regarding this legislation is also provided on OSPI's
public website: http://www.k12.wa.us/safs/INS/2242/2242.asp.
Additional changes were made to K-12 funding with the enactment of
Engrossed Second Substitute Senate Bill (E2SSB 6362) (Chapter 266, Laws
of 2018, regular session). The most significant changes included moving
ahead the schedule for increased state salary allocations for school
employees to the 2018-19 school year, increasing the special education
excess cost multiplier, adding another regionalization adjustment, and
adding an experience factor to provide additional funding to school districts
that meet certain instructional staff requirements.
How many students attend K-12 schools in the state?
In the 2018-19 school year, the most current year for which data is
available, over 1,105,300 students were enrolled at 2,430 public schools
across the state.
In addition, it is estimated that about 84,058 students attended private
schools and 21,916 students received home-based instruction during the
2018-19 school year.
How are public schools in Washington organized?
The public school system in Washington involves various entities at
both the state and local levels, including the Legislature, the Governor, the
State Board of Education, OSPI, the federal Department of Education, the
State Auditor’s Office, the Professional Educator Standards Board,
Educational Service Districts, the Washington State Charter School
2Commission, and local school districts. Each of these entities plays a role in
establishing educational policies, implementing these policies, or providing
administrative and financial oversight of the public school system.
Washington is largely considered a "local control" state. Each school
district is governed by a locally-elected school board whose members serve
staggered four-year terms. Local school district boards have broad
discretionary power to determine and adopt policies not in conflict with
other law that provide for the development and implementation of
instructional programs, activities, services, or practices that the school
district board of directors determine will promote education or effective
management and operation of the school district.
Currently, the state has a total of 295 school districts. Each school board
hires a Superintendent who oversees the day-to-day operation of the school
district.
What does the Washington State Constitution provide
regarding K-12 public schools?
"It is the paramount duty of the state to make ample
provision for the education of all children residing within
its borders, without distinction or preference on account
of race, color, caste or sex."
—Washington Constitution, article IX, section 1
This constitutional provision is unique to Washington. While other
states have constitutional provisions related to education, no other state
makes K-12 education the "paramount duty" of the state.
How has this constitutional provision been interpreted
in the state courts?
A handful of Washington State Supreme Court cases have addressed
basic education under Article IX of the Washington Constitution. The Court
has interpreted Article IX, section 1 of the state constitution to mean that the
state must define a "program of basic education" within the guidelines of the
Court, distinguished from all other educational programs or services, and
amply fund it from regular and dependable sources that cannot be dependent
on local tax levies.
The Court has found that this "paramount duty" is superior in rank and
above all others. Neither fiscal crisis nor financial burden changes the
Legislature’s constitutional duty. The state has no duty to fund programs
outside the definition of "basic education." School districts may use local
3property tax levies to fund enrichment programs and programs outside the
legislative definition of basic education. However, the use of local levies
cannot reduce the state’s obligation to fund basic education.
The Court does not require the state to provide a total education or the
offerings of all knowledge, programs, subjects or services; however, the duty
goes beyond mere reading, writing, and arithmetic. The Court has noted that
a basic education also "embraces broad educational opportunities needed in
the contemporary setting to equip children for their role as citizens and as
potential competitors in today’s market as well as in the marketplace of
ideas." Additionally, the Court found that the education required by the
constitution does not reflect a right to a guaranteed educational outcome.
The Court has acknowledged that the Legislature has an obligation to
review the definition of a basic education program as the needs of students
and the demands of society evolve. However, any reduction from the basic
education program must be accompanied by an educational policy rationale
and not for reasons unrelated to educational policy.
What is the McCleary decision?
The most recent court decision to address Article IX, section 1 of the
state constitution is McCleary v State, 173 Wn.2d 477, 269 P.3rd 227, which
was decided in January 2012. In McCleary, the Washington State Supreme
Court found that the State had failed to meet its paramount constitutional
duty to amply fund a program of basic education because the level of state
resources fell short of the actual cost of the basic education program.
The Court acknowledged that the Legislature had enacted promising
reforms in ESHB 2261 (Chapter 548, Laws of 2009), which, if fully funded,
would remedy deficiencies in the K-12 funding system. The Court retained
jurisdiction to help facilitate the Legislature's compliance with its
constitutional duty.
In the 2012 legislative session, the Legislature created the Joint Select
Committee on Article IX Litigation (Committee) to facilitate communication
with the Washington Supreme Court on school funding. In July 2012, the
Court ordered the Committee to annually report on legislative progress to
amply fund a program of basic education. The reports can be found at:
http://leg.wa.gov/JointCommittees/Archive/AIXL/Pages/default.aspx.
In January 2014, the Court declared the State was not on target to meet
its 2018 constitutional funding obligations. The Court directed the State to
submit, no later than April 30, 2014, a complete plan for fully implementing
its program of basic education for each school year up to the 2017-18 school
year. In April 2014, the Committee submitted its third report to the Court,
which concluded there was no agreement reached on the full implementation
plan. The Court subsequently found the State in contempt for failing to
comply with the Court's order to submit a plan but did not impose sanctions.
4The Court ordered the State must purge its contempt by adjournment of the
2015 session or the Court would reconvene and impose sanctions or other
remedial measures.
After a third special session, the Legislature adopted a 2015-17 biennial
budget and the State submitted its annual post-budget report to the Court on
July 27, 2015. The Court found that the 2015-17 operating budget made
significant progress in some key areas. For example, the Court noted that
the budget provided full funding for transportation and would fully
implement all-day kindergarten by the 2016-17 school year, which was one
year ahead of schedule.
However, the Court also noted that with a looming deadline for 2018
compliance, there was still no plan to fund K-3 class sizes of 17 students,
and most importantly, the State had failed to offer any plan to fund increased
state allocations for teacher salaries, a major component of the State's
deficiency. On August 13, 2015, the Court found the State to be in
continued contempt of court and imposed a $100,000 per day penalty until
the State adopted a complete plan for complying with Article IX, section 1
by the 2018-19 school year.
During the 2016 legislative session, the Legislature enacted Engrossed
Second Substitute Senate Bill (E2SSB) 6195 (Chapter 3, Laws of 2016),
which created an Education Funding Task Force (EFTF) to gather data
concerning compensation that school districts pay above the state basic
salary allocations. More specifically, the legislation required the hiring of an
independent consultant to assist the EFTF by collecting K-12 public school
staff total compensation data; identifying market rate salaries that are
comparable for certificated, administrative, and classified staff; and
providing analysis regarding whether a local labor market adjustment
formula should be implemented and if so, which market adjustment factors
and methods should be used.
During the 2016 legislative interim, the EFTF met 11 times to analyze
data and deliberate on policy options for resolving the remaining element for
fully funding its enacted policy reforms. In establishing the EFTF, the
Legislature declared it would enact legislation by the end of the 2017
legislative session to eliminate school district dependency on local levies to
support the state's program of basic education. The Court, in its October 6,
2016 order, recognized "that the Legislature had committed itself in E2SSB
6195 to satisfying the State's paramount duty by the end of the 2017
legislative session." The Court further recognized that "the Legislature
cannot realistically determine the appropriations necessary for full funding
of basic education, including salaries, without the updated data that the
current task force is charged with gathering and presenting." As part of its
order, the Court clarified that full state funding of basic education must be
implemented by September 1, 2018; however, the Legislature must enact a
fully compliant program by the end of the 2017 session.
5The Court issued an order on November 15, 2017 and concluded that the
State has met its constitutional duty to fully fund basic education with regard
to MSOC; pupil transportation; and categorical programs of basic education,
including special education, the Highly Capable Student Program, the
Transitional Bilingual Instructional Education Program (TBIP), and the
Learning Assistance Program (LAP).
The Court also found the new salary allocation model established by
EHB 2242 is sufficient to recruit and retain competent teachers,
administrators, and staff. However, the Court held that the State remains out
of compliance because changes to basic education salaries created under
EHB 2242 are not fully implemented by the September 1, 2018 deadline.
Following the passage of E2SSB 6362 during the 2018 session, which
moved full salary funding to the 2018-19 school year, the Court issued an
order ending the McCleary case on June 7, 2018.
6How has the State implemented the Program of Basic
Education?
In order to carry out its constitutional responsibility, the Legislature
passed the Basic Education Act of 1977 (BEA), which defined a "basic
education" by establishing goals, minimum program hours, teacher contact
hours, and a mix of course offerings for a school district to provide.
Currently, at least some portion of the seven programs (general
apportionment; the Special Education Program for students with disabilities;
some pupil transportation; the LAP for remediation assistance; the TBIP; the
Highly Capable Program; and the educational programs in juvenile detention
centers and state institutions) fall within the Legislature’s definition of basic
education.
The Legislature has also implemented the reform package under SHB
2261 (Chapter 548, Laws of 2009) and SHB 2776 (Chapter 236, Laws of
2010), by putting into place the new funding formulas and fully
implementing the enhancements for K-3 class size reductions, pupil
transportation, all-day kindergarten, and increased MSOC funding.
The Legislature implemented the funding enhancements and reforms
under EHB 2242 (Chapter 13, Laws of 2017, 3rd special session). For the
2017-18 school year, the changes included increased funding for LAP,
Special Education Program, Highly Capable Program, TBIP, and reduced
class sizes for career and technical education and skill centers.
The 2018-19 school year included additional funding enhancements for
K-12 state salary and health benefit allocations and state funding for
professional learning days. State funding for three professional learning
days will be fully implemented in the 2020-21 school year.
The Legislature increased special education funding with the
implementation of E2SSB 5091 (Chapter 387, Laws of 2019). The bill
made three significant changes to special education funding: (1) the special
education multiplier was increased from 0.9609 to 0.995 beginning in the
2019-20 school year, and was changed to a tiered multiplier beginning the
following school year. The tiered multiplier is 1.0075 for students spending
80 percent or more in a general education setting, and 0.995 for students
spending less than 80 percent in a general education setting; (2) access to the
special education safety net was increased by lowering the threshold to
qualify for the safety net; and (3) funding was provided for professional
development for inclusionary practices.
General Apportionment - The General Apportionment formula provides
foundational state funding to school districts and funds basic education as
well as some non-basic education adjustments. The amount received by
each school district varies based on certain characteristics of the district with
enrollment being the largest factor. As discussed in more detail below,
7generally, enrollment drives the number of certificated, administrative, and
classified staff, and the associated salaries and benefits, allocated to the
district as well as the allocation of funds for other non-employee related
costs.
On average, the statewide allocation through the General Apportionment
formula is estimated to be $9,173 per student in the 2019-20 school year.
General Apportionment formula:
The General Apportionment formula follows the prototypical school
model. Prototypes illustrate a level of resources to operate a school of a
particular size with particular types and grade levels of students. Allocations
to school districts are based on actual full-time equivalent (FTE) student
enrollment in each grade in the district, adjusted for small schools and
reflecting other factors in the state's biennial budget. Under SHB 2776
(Chapter 236, Laws of 2010), the Legislature designed a funding formula
that allocates funding in three primary groups:
• schools,
• district-wide support, and
• central administration.
The number of funded teachers is derived from class size and teacher
planning time as determined by the Legislature (see Table 1). The
calculation for deriving the number of funded teachers is:
(Enrollment / Class Size) x (1 + Planning Time Factor) = Teachers
Other staff types are derived by using staff ratios for each school type:
elementary, middle, and high school. Each prototype has a theoretical
number of students and designated levels of staffing. The funding to each
district is scaled according to actual enrollment in each of the grade ranges.
For example, an elementary school is assumed to have 400 students in
the prototypical model. If a district has 800 elementary-grade students, it
will receive funding for double the number of staff positions (shown in
Table 2, below). The class sizes represent the levels of funding associated
with assumed ratios of students to teachers, given certain assumptions about
the length of a teacher's day and the amount of time reserved for planning.
Funding is for allocation purposes only (except for the categorical, or
dedicated, programs), and it is up to the school district to budget the funds at
the local level. Beginning with the 2011-12 school year, OSPI began
reporting how school districts are deploying those same state resources
through their allocation of staff and other resources to school buildings, so
that citizens are able to compare the state assumptions to district allocation
decisions for each local school building. The information, by school
8building, is available from OSPI at: https://www.k12.wa.us/policy-
funding/school-apportionment/district-allocation-state-resources-portal.
One of four1 funding enhancements included in SHB 2776 (Chapter 236,
Laws of 2010) requires average class size for grades K-3 to be reduced
beginning in the 2011-13 biennium and beginning with schools with the
highest percentage of low-income students, until the class size in the formula
is 17.0 students per classroom teacher. Beginning with the 2019-20 school
year, funding for reduced class sizes in K-3 is contingent upon, and
proportional to, the school's demonstrated actual class size for K-3.
EHB 2242 (Chapter 13, Laws of 2017, 3rd sp. Session) also included
funding to reduce class sizes for grades 7-12 career and technical education
classes from 26.57 to 23 students per class and skills centers from 22.76 to
20 students per class.
Table 1: School Year 2019-20 Class Sizes
Grade Class Size
Grades K-3 17
Grades 4-6 27
Grades 7-8 28.53
Grades 9-12 28.74
Career & Tech. Ed (CTE) 7-8 23
CTE 9-12 23
Skills Centers 20
Lab Science 19.98
Length of teacher day is assumed to be 5.6 hours in elementary school
and 6.0 hours in middle and high school. Planning time is assumed to
be 45 minutes per day in elementary school and 60 minutes in high
school.
The 2019-21 state operating budget maintains existing prototypical
school building staffing unit assumptions for administrative and classified
staff as provided in the following table:
1
Other required enhancements include: Funding for full-day kindergarten; substantially
increased funding for materials, supplies, and operating costs (MSOC); and substantially
enhanced funding for pupil transportation.
9Elementary Middle High
Table 2: Staffing School School School
Prototypical school size:
Number of students 400 432 600
Staff per-school:
Principals/administrators 1.2530 1.3530 1.8800
Librarian/media specialist 0.6630 0.5190 0.5230
School nurses 0.0760 0.0600 0.0960
Social workers 0.0420 0.0060 0.0150
Psychologists 0.0170 0.0020 0.0070
Guidance counselors 0.4930 1.2160 2.5390
Instructional aides 0.9360 0.7000 0.6520
Office support & non-instructional aides 2.0120 2.3250 3.2690
Custodians 1.6570 1.9420 2.9650
Classified staff for student & staff safety 0.0790 0.0920 0.1410
Parent involvement coordinators 0.0825 0.0000 0.0000
District-wide support is funded under the prototypical model in addition
to the staffing levels presumed to be needed for individual school buildings,
since these services need to be provided across the district. Funding is based
on overall student enrollment levels.
Table 3: District-wide Support
Number of students 1,000
Per 1,000
Classified Staff
Students
Technology 0.628
Facilities, Maintenance, Grounds 1.813
Warehouse, Laborers, Mechanics 0.332
Under the prototypical formula, administration costs directly associated
with prototypical schools are included in those staffing levels — for
example, the number of principals and level of office support needed for
each elementary school, middle school, and high school. Central
administration, however, is funded as an additional 5.3 percent of other
staffing units generated by the formula. These general staffing units on
which the 5.3 percent is calculated include K-12 teachers, school-level
staffing, and district-wide support; it does not include additional staffing for
vocational programs, specialized classes, or categorical programs such as
programs for highly capable students, special education, or the learning
assistance program.
10Finally, the prototypical funding formula for General Apportionment
includes an allocation for MSOC, formerly known as non-employee related
costs. Initially established based on district information from the 2007-08
school year, the formula provides the following per pupil funding amounts,
which are adjusted annually for inflation.
The 2019-21 biennial budget provides $1,293.16 per student for MSOC
in school year 2019-21 and $1,320.32 per student for MSOC in school year
2020-21, at a total biennial cost of approximately $2.7 billion. The 2019-21
biennial budget also provides enhancements for students in grades 9-12 and
students enrolled in career and technical education and skill center programs
at a total biennial cost of approximately $343 million.
Table 4: SY 2019-20 and 2020-21 Budgeted Materials, Supplies, and Operating
Costs (MSOC)
Per-Student Allocation Per-Student Allocation
MSOC Component
SY 2019-20 SY 2020-21
Technology $135.91 $138.75
Utilities and insurance 369.29 377.04
Curriculum and textbooks 145.92 148.99
Other supplies 289.00 295.07
Lbrary materials 20.79 21.23
Instructional professional development for
22.57 23.04
certified and classified staff
Facilities' maintenance 182.94 186.79
Security and central office 126.74 129.41
Total $1,293.16 $1,320.32
Students in grades 9-12 $1,470.80 $1,501.69
Students in CTE & skill center programs $1,529.98 $1,562.11
Special Education - The state funding formula for special education is
based on the additional "excess costs" of educating students receiving
special education services. The "excess cost" amount is provided for two
categories of students. The formula was implemented in 1995 and did not
change until the 2018 legislative session when the special education excess
cost multiplier was increased from 0.9309 to 0.9609. The multiplier was
increased to 0.995 in the 2019 legislative session, beginning in the 2019-20
school year, and will change to a tiered multiplier beginning in the 2020-21
school year. The tiered multiplier is 1.0075 for students spending 80 percent
or more in a general education setting, and 0.995 for students spending less
than 80 percent in a general education setting.
For birth through four-year olds who are eligible for and enrolled in
special education, the special education allocation is 115 percent of the
district’s average per-student General Apportionment allocation.
For five to 21-year olds, the state special education allocation is 99.5
percent of the district’s average per-student General Apportionment
11allocation. The allocation will be somewhat higher in the 2020-21 school
year because of the additional funding provided to districts that have 80
percent or more of students requiring special education services in a general
education setting.
In addition to the per-student special education allocations described
above, the special education funding structure includes safety net funding for
districts that can show extraordinary special education program costs beyond
state and federal resources. The 2019-21 biennial budget appropriates $158
million for this purpose. This amount includes the additional funding that
was provided to lower the state safety net threshold from 2.7 times the
average per pupil expenditure to 2.3 times the average per pupil expenditure.
The total 2019-21 biennial budget for special education is approximately
$3.5 billion. The estimated average additional special education per pupil
amount is $9,696 for Fiscal Year (FY) 2020 and $10,158 for FY 2021.
Pupil Transportation - A revised transportation formula was effective
September 1, 2011, and fully implemented in the 2014-15 school year.
The new formula phased in funding for the transportation of students "to
and from school" as part basic education. The new formula requires the
funding to be calculated using a regression analysis of major cost factors that
are expected to increase (or decrease) the prior year's pupil-transportation
costs, including the count of basic and special education-student ridership,
district land area (geography), roadway miles, the average distance to
school, and other statistically-significant coefficients. State funding in the
2019-21 biennial budget for pupil transportation is approximately $1.2
billion.
As part of this funding, the state provides funding for school bus
replacement costs using a depreciation schedule. Annual payments are made
to districts from the year a bus is purchased until it reaches the end of its
scheduled lifecycle.
State allocations are deposited into the district's Transportation Vehicle
Fund to be used only for the purchase of new buses or for major repairs.
Learning Assistance Program (LAP) - LAP provides remediation
assistance to students scoring below grade level in reading, math, and
language arts. However, districts receive LAP allocations based on the
number of students in poverty, as measured by eligibility for free or reduced-
price lunch.
As with other categorical programs, the prototypical funding formula
provides a designated number of hours of instruction per week. (A
"categorical" program is one in which funds may be used for only the
dedicated program and may not be re-allocated for use elsewhere in the
12school district.) State law provides 2.3975 hours of LAP instruction per-
week, assuming class sizes of 15 students per certificated instructional staff.
EHB 2242 created a new program within LAP. This new, additional
program establishes a high-poverty, school-based LAP allocation for schools
with at least 50 percent of the students who are eligible for free- or reduced-
priced meals. The new, additional minimum allocation in statute must
provide on a statewide average 1.1 hours per week in extra instruction with a
class size of 15. School districts must distribute this allocation to the school
buildings that generate the allocation. The funding must supplement and not
supplant the district's expenditures for LAP for these schools. The LAP
enhancements translate to additional funding of approximately $889 million
for the 2019-21 biennium.
Transitional Bilingual Instructional Education (TBIP) - TBIP was
created by the Legislature in 1979. State TBIP funding supports students
whose primary language is other than English and whose English skills
impair learning to achieve proficiency in English. TBIP funds may also be
used to provide training to staff in the TBIP.
As with other categorical programs, the funding formula provides a
designated number of hours of instruction. For students in grades K through
6 and assuming class sizes of 15 students per certificated instructional staff,
the formula provides 4.778 hours of bilingual instruction per week. EHB
2242 also provides funding for two additional hours of instruction per week
for students in grades 7 through 12, increasing the minimum allocation to a
total of 6.778 hours, with a class size of 15 students. The formula translates
to additional funding of approximately $412 million in the 2019-21 biennial
budget.
Funding for transitional support for up to two years after a student has
exited the TBIP is also provided to assist students who have met the
proficiency standards.
Under current law, 3.0 hours of additional instruction are provided for
students who exited the program in the immediate prior two years.
Institutional Education Programs - The state funds a 220-day
educational program for children in certain institutions. School districts,
educational service districts, or others receive institutional education moneys
if they provide the educational programs. While the amounts vary based on
the type and size of program, the current institutional education allocation is
approximately $28 million for the 2019-21 biennium. In the 2019-21
biennial budget, $2.7 million was appropriated to assist institutional students
with unique educational needs.
Highly Capable Program - The Highly Capable, or gifted students,
program is funded under basic education statutes for up to 5.0 percent of a
13school district's basic education student enrollment and, as is the case with
other categorical programs, the allocation cannot be used for other programs.
As with other categorical programs, the funding formula for the Highly
Capable Program provides a designated number of hours of instruction per
week, in this case 2.159, assuming class sizes of 15 students per certificated
instructional staff. The formula translates to additional funding of
approximately $62 million for the 2019-21 biennium.
Full-Day Kindergarten - The definition of basic education also provides
full-day instruction for kindergarten students (180 full days and 1,000 hours
of instruction) similar to grades 1 through 12. State funded full-day
kindergarten was fully implemented in school year 2016-17.
The Legislature also funds a variety of programs and activities outside
of its definition of basic education. The chart below reflects the funding for
the 2019-21 biennium (FY 2020 and FY 2021) for the seven programs
currently defined as "basic education" as well as the funding for other K-12
programs and activities funded by the state.
142019-21 Biennial Operating Budget BASIC EDUCATION PROGRAMS
(Dollars in Millions)
General Apportionment (RCW 28A.150.260) $19,294 70.7%
Special Education (RCW 28A.150.370) $2,959 10.8%
Transportation (RCW 28A.160.150) $1,231 4.5%
Learning Assistance Program (RCW 28A.165) $890 3.3%
Bilingual (RCW 28A.180) $412 1.5%
Highly Capable Program (RCW 28A.185) $62 0.2%
Institutions (RCW 28A.190) $32 0.1%
Sub-Total: Basic Education Programs $24,879 91.1%
2019-21 Biennial Operating Budget NON-BASIC EDUCATION PROGRAMS
(Dollars in Millions)
Compensation Adjustments $1,106 4.0%
Local Effort Assistance (Levy Equalization) $755 2.8%
Education Reform $272 1.0%
Grants and Pass-Through Funding $71 0.3%
OSPI & Statewide Programs $61 0.2%
Educational Service Districts $26 0.1%
Professional Educator Standards Board $20 0.1%
Food Service $14 0.1%
State Board of Education $3 0.0%
Charter Schools $100 0.4%
Charter School Commission $0.3 0.0%
Sub-Total: Non-Basic Education Programs $2,428 8.9%
TOTAL - STATE FUNDS* $27,307 100%
*State Funds include the General Fund-state, Opportunity Pathways Account, the
Education Legacy Trust Account, and the Pension Funding Stabilization Account together
known as Total Near General Fund.
15What is the role of the federal government in public
elementary and secondary education?
Public K-12 education is primarily a state and local responsibility.
However, the federal role in education has been evolving and increasing
over time. Although the federal Constitution, which gives United States
(U.S.) Congress its authority to act, is silent on the subject of education,
Article I, Section 8, of the U.S. Constitution provides that Congress has the
power to provide funding for the general welfare of the United States.
Congress has relied on this provision when enacting federal assistance
programs addressing education, including the education of students with
disabilities (the IDEA) and the Americans with Disabilities Act (ADA) and
the education of students in poverty (Title I programs). State participation in
these programs is voluntary; however, if the state accepts the federal funds,
then the state must comply with all of the federal program requirements.
Federal funds comprise approximately 7.2 percent of total school district
general fund revenues. Additionally, the due process and equal protection
clauses of the U.S. Constitution provide the basis for the anti-discrimination
laws (Title VI, Title VII, and Title IX) enacted by Congress. The federal
courts have also had a significant impact on public education, especially in
the areas of racial segregation, First Amendment and due process rights of
students and employees, school finance, and education programs for students
who have limited English proficiency and for students with disabilities.
The No Child Left Behind Act of 2001 (NCLB) reauthorized the
Elementary and Secondary Education Act of 1965 (ESEA). This legislation
greatly expanded the federal role in public education. NCLB required all
students to meet state proficiency on the statewide reading and mathematics
assessments by 2014. Schools and school districts that received federal Title
I funding and failed to meet this proficiency target were subject to sanctions,
including that parents must be notified by letter that the school is "failing" to
meet their adequate yearly progress goals, and 20 percent of each school's
Title I funds must be set aside to provide transportation to students who
transfer from failing school into a passing school, and to provide supplemental
education services to students such as tutoring programs.
The federal Every Student Succeeds Act (ESSA) is the most recent
reauthorization of the ESEA and replaced NCLB in 2005. The stated focus
of ESSA is an emphasis on equity, continuous improvement for all schools,
provision of effective educators, and greater flexibility for the use of federal
resources. ESSA requires states to submit a state plan to implement the ESSA
provisions. OSPI submitted Washington State's plan on September 18, 2017.
The submitted plan can be accessed at Washington's Consolidated ESSA Plan.
The plan went into effect starting in the 2017-18 school year and was revised
on January 12, 2018.
16What is Initiative 1351?
I-1351, approved by state voters in November 2014, changed the
staffing values in the public school basic education funding allocation
statute, which specifies minimum allocations for K-12 class sizes and school
staff.
I-1351 values lower class sizes, which increases the number of teachers
for which state funds are allocated and, in general, increases other school
staff. The Legislature delayed implementation to begin in the 2019-21
biennium, with complete implementation required in the 2021-23 biennium.
EHB 2242 repealed the provisions of the I-1351. The enriched staffing
values established under I-1351 are re-established in a separate chapter. By
legislative mandate, OSPI convened a workgroup of stakeholders and issued
a report to the legislature in December 2019 outlining a phase-in plan for
staffing enrichments. If any of the enriched staffing values are specifically
funded by the Legislature with reference to the chapter in which they are
found, then those enriched staffing values become basic education.
17How much of the state near-general fund is spent on K-
12 public schools?
The state general fund is the largest single fund within the state budget.
It is the principal fund supporting the operation of state government.
Given the purposes are similar and fund transfers between the two are
common, the education legacy trust account is often discussed in
combination with the state general fund. Together, they are referred to as
the state near-general fund.
In the 2019-21 biennium (FY 2020 and FY 2021), the Legislature
appropriated $27.3 billion, or about 51.5 percent, of the state near-general
fund for the support and operation of K-12 public schools.
The following chart shows how the state near-general fund budget is
currently allocated:
General
2019-21 Biennial Operating Budget Government,
$0.71, 1%
Other*, $3.55, 7%
Natural Resources,
Higher Education, $0.45, 1%
$4.19, 8%
Dollars in billions
K-12 Public
Schools, $27.31,
51%
Human Services,
$16.76, 32%
*Other includes special appropriations, judicial, other education, legislative, and transportation
18How do school districts receive local funding?
School districts are authorized to raise funds locally for their districts
through excess levies, which are voter-approved and limited in duration.
In 2019, 288 of the state's 295 school districts passed local levies for
enrichment activities. In addition to enrichment levies, school districts are
also authorized to collect voter-approved transportation vehicle levies, which
are used to pay for school buses or other school transportation equipment.
Local school district enrichment levy revenues are deposited in the school
district's general fund. In the 2018-19 school year, enrichment levies made
up an estimated 12.3 percent of total school district operating revenues on
average on a statewide basis.
Since 1977, the Legislature has limited the amount school districts may
collect through enrichment levies, previously referred to as maintenance and
operation (M&O) levies. Prior to enactment of EHB 2242 in 2017, a school
district's maximum levy authority was a percentage of the state and federal
funding received by the school district in the prior year. EHB 2242 changed
the maximum enrichment levy to the lesser of $2,500 per pupil or a rate of
$1.50 per $1,000 of assessed value effective in calendar year 2019.
In the 2019 session, ESSB 5313 (Chapter 410, Laws of 2019) increased
the maximum enrichment levy to the lesser of $2,550 per pupil ($3,000 for
districts with more than 40,000 students) or a rate of $2.50 per $1,000 of
assessed value which takes effect in calendar year 2020. Beginning in
calendar year 2020, the $2,550 per pupil cap is increased by inflation.
Beginning with levies collected in calendar year 2020, school district
enrichment levies are subject to a new requirement for pre-ballot approval
by OSPI. Before a school district may submit an enrichment levy to the
voters, it must receive OSPI's approval of an expenditure plan for the
enrichment levy. OSPI may approve the plan if it is determined that the
district will spend enrichment levy revenues and other local revenues only
for permitted enrichment activities.
EHB 2242 established requirements for the review and approval
process, including timelines for OSPI to make its decision on approval; the
opportunity for districts to resubmit requests for approval to OSPI; and
criteria for OSPI approval of changes to a previously approved enrichment
expenditure plan. The same requirements also apply to transportation
vehicle enrichment levies.
19What is Local Effort Assistance and Levy Equalization?
The LEA program, also referred to as state levy equalization, was
created in 1987 to mitigate the effect that above average property tax rates
have on the ability of school districts to raise local M&O revenues to
supplement the state's basic program of education.
LEA is a program that provides state funding to equalize the property
tax rates that taxpayers would otherwise pay for enrichment levies and to
provide tax relief to tax payers in high tax rate school districts.
LEA funding is specifically designated and is not part of the school
district's basic education allocation. In calendar year 2019, 178 of 295
school districts were eligible for LEA, of which 177 received LEA
distributions totaling approximately $331 million.
LEA provides assistance to any school district that does not generate an
enrichment levy of at least $1,500 per student when levying at a rate of
$1.50 per $1,000 of assessed value.
An eligible school district’s maximum LEA is equal to the school
district's resident enrollment multiplied by the difference of $1,500, and the
school district's enrichment levy amount calculated on a per pupil basis at a
rate of $1.50 per $1,000 of assessed value. School districts that are eligible
for LEA but not levying the maximum allowable levy receive LEA in
proportion to their actual levy collection. Beginning in calendar year 2020,
the $1,500 per-pupil cap is increased by inflation.
How does the state lottery support public schools?
When the state lottery was established in 1982, the state was in an
economic recession. The Legislature deposited the lottery revenues into the
state general fund, which supports K-12 public schools, higher education,
human services, natural resources, and other state programs. Prior to the
actual creation of the lottery, there were various proposals to dedicate the
lottery proceeds to the developmentally disabled, public schools, or state
institutions. While none of these proposals were enacted into law, they may
have contributed to the popular misconception that the lottery had been
entirely dedicated to K-12 education.
As a result of the passage of Initiative 728 in 2000 (the K-12 2000
Student Achievement Act), almost all lottery revenues were, in fact,
dedicated for educational purposes (with the exception of about 10 percent,
which was dedicated by previous legislation for debt service on the stadiums
in Seattle).
It should be noted that while I-728 dedicated lottery revenues to
educational purposes, the Legislature passed legislation in 2002 that
authorized a new lottery game that is not subject to the distribution for
educational purposes. The legislation authorized state participation in a
20multi-state lottery (now named Mega Millions), with the profits from the
game going to the state general fund. The legislation had provisions
addressing the concern that some people might play the new multi-state
lottery rather than the existing lottery games and, therefore, diminish the
base revenues for educational purposes. For this reason, the legislation
required $102 million annual transfers to make the educational-related
accounts "whole" before distributing any excess profits to the general fund.
In other words, it was intended that the educational related activities would
receive as much money as they would have without the multi-state lottery.
In 2010, under E2SSB 6409, the Legislature created the Washington
Opportunity Pathways Account (WOPA). Beginning in FY2011, all net
revenues from in-state lottery games not otherwise dedicated to debt service
on the Safeco Stadium, CenturyLink Field and Exhibition Center were
dedicated to the new account. All net income from the multi-state lottery
games, other than those dedicated to the Problem Gambling Account, were
deposited into the WOPA rather than into the state general fund and used for
specified early-learning, higher-education, and economic-development
programs.
In 2016, the Legislature passed E2SSB 6194 which funds charter
schools through the WOPA. Prior to September 2015, charter schools had
received funding from the state general fund but a Washington Supreme
Court ruling found that charter schools are not common schools and are not
eligible to receive funding from common school property taxes, which are
deposited in the state general fund.
What are other types of dedicated funding utilized by
school districts?
Over three-fourths of a typical school district’s expenditures are for the
day-to-day operation of the school district and are funded in the school
district’s general fund. For this reason, this document primarily focuses on
these expenditures. However, it should be noted that school districts also
use other funds including:
• Capital Project Funds, which are used for some facility
construction and remodeling costs;
• Debt Service Funds, which are used for the repayment of bond
debt;
• Associated Student Body Funds, which are used for student
activities;
• Enrichment Levy Funds to be used for enrichment outside of
the state's definition of basic education; and
• Transportation Vehicle Funds, which are used for purchasing
school buses.
21How is school construction funded in the state?
The Washington Constitution treats capital construction differently from
operating costs of basic education, and it is not part of the State's obligation
under Article IX. (See, Washington Supreme Court Order in McCleary
issued on November 15, 2017). Since statehood, the State Constitution has
assumed that school district voters will incur debt to construct school
facilities.
Additionally, in each biennial capital budget, the state provides financial
assistance to school districts for constructing new, and remodeling existing
school buildings. The state-assistance program is based on two principles:
(1) state and local school districts share the responsibility for the provision
of school facilities; and (2) there is an equalization of burden among school
districts to provide school facilities regardless of the wealth of the districts.
To be eligible for state funding, a school district must have a space or
remodeling need and must secure voter approval of a bond levy or other
funding for the local share of a school project. Once the local share is
secured, the state money is allocated to districts based on a formula
comprised primarily of a set of space and cost standards/allocations and
a matching ratio based on the relative wealth of the district.
The state program does not reimburse all costs related to a project.
Costs not eligible for reimbursement include site-acquisition costs;
administrative buildings; stadiums/grandstands; most bus garages; and local
sales taxes. Construction-related costs that are eligible include eligible
construction costs per-square-foot; architectural and engineering fees;
construction management; value-engineering studies; furniture and
equipment; energy conservation reports; and inspection and testing.
How has the amount of the near-general fund support of
K-12 public schools changed since 2005?
As depicted on the following chart, the amount of state near-general
funds spent for K-12 public schools has increased from $11.7 billion to
$27.3 billion per biennium since the 2005-07 biennium. The major factor
contributing to the decline in the 2009-11 biennium is the impacts from the
economic recession.
22Total Near General Fund (State) K-12 Expenditures:
$30
2005-07 to 2019-21 Budget (nominal)
$ in Billions
$25
2019-21 Biennial Budget
$20
$15
$10
$5
$0
2005-07 2007-09 2009-11 2011-13 2013-15 2015-17 2017-19 2019-21
In a ddition to state funds displayed above, one-time federal stimulus funds s upplemented programs that are typi cally funded with s tate
dol lars, primarily i n 2009-11. The American Recovery a nd Reinvestment Act (ARRA) of 2009 i ncluded state Fiscal Stabilization funds for
Wa s hington State in the amount of $362 mi llion in fiscal year 2009 a nd $357 million in fiscal year 2010, a ppropriated by the Legislature to
hel p fund levy equalization a nd the Student Achievement program. In fiscal year 2011, the Legislature a ppropriated $208 mi l lion in additional
one-time federal funds (Education Jobs Act) to cover part of general apportionment payments.
23The chart below shows total near-general fund expenditures for K-12 public
schools as a percent of the statewide total. They have varied over the
biennia, with a low of approximately 39 percent in 2005-07 to a high of
approximately 51.5 percent today. Increases in the share for K-12 funding
can be attributable to increased K-12 funding, decreased funding for other
programs, or both.
Percent of Total Near General Fund Spent of K-12
Public Schools
60%
50.3% 51.5%
50% 47.4%
45.4%
42.6% 43.4%
40.8%
2019-21 Biennial Budget
38.9%
40%
30%
20%
10%
0%
2005-07 2007-09 2009-11 2011-13 2013-15 2015-17 2017-19 2019-21
24How much of total K-12 funding comes from the state?
In addition to state funding, school districts receive funding from the
federal government, local taxes, and other miscellaneous sources. The
sources of funding budgeted by school districts for operating costs for the
2019-20 school year are provided below.
State — Approximately 79 percent of budgeted school district revenues are
from state sources. This amount consists of funding for the seven categorical
programs currently defined as "basic education" (general apportionment; the
special education program for students with disabilities; some pupil
transportation; LAP; TBIP; the Highly Capable program; and educational
programs in juvenile detention centers and state institutions) as well as a
variety of other grants, allocations, and items funded from the state general
fund and the education legacy trust account.
Local Taxes — Approximately, $1.8 billion, or 10 percent of the total
school district revenues is derived from local taxes, which are primarily
enrichment levies.
Federal — School districts are estimated to receive $1.1 billion from federal
sources for the 2019-20 school year. This represents about 7 percent of their
total revenue. This includes funding for the implementation of the federal
Individuals with Disabilities Education Act (IDEA); instructional assistance
and other strategies aimed at improving student achievement in high-poverty
schools; a variety of professional development activities; the school lunch
and other nutrition programs; financial assistance to compensate school
districts as the result of federal land ownership; and a variety of smaller
allocations and grants.
25Other Revenue & Reserves — This category, totaling $752 million, or
about 4 percent of total funding, includes a variety of miscellaneous sources
such as charges and fees for non-basic education programs, school lunch
charges, revenue from other school districts, rental income, donations, and
the use of reserves or fund balance.
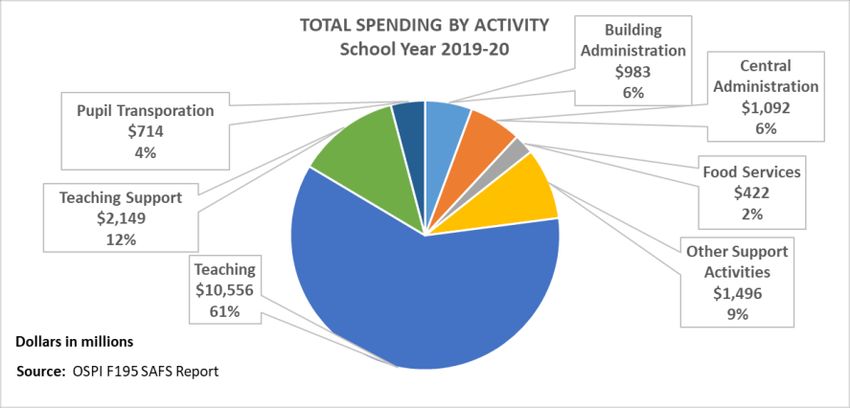
What are school district expenditures by activity?
One way to examine school spending is to identify how school districts
spend the money received from state, federal, local, and other sources.
School districts report detailed data to OSPI, including the "activities" on
which they spend money. The budgeted amounts for each activity for the
2019-20 school year are depicted below.
Teaching — For the 2019-20 school year, school districts have budgeted
approximately $10.6 billion (61 percent of the total) for teaching activities.
This includes payments for salaries and benefits for classroom teachers,
direct classroom instruction, extracurricular activities, and payments to other
districts for educational services.
Teaching Support — School districts budgeted $2.1 billion on teaching
support activities for the 2019-20 school year. This represents approximately
12 percent of total school district spending. This includes guidance
counseling, library services, audio-visual functions, psychological services,
health-related activities, and other services that support the delivery of
teaching services.
Other Support Activities — After teaching, the largest activity grouping
for school district spending is utilities, grounds care, plant operation and
maintenance, insurance, information systems, and other support functions.
26For the 2019-20 school year, school districts budgeted approximately $1.5
billion, or 9 percent of their total spending, on this activity.
Central Administration — Approximately $1 billion, or 6 percent, of total
school district spending is for central administration. This includes school
board functions, the superintendents’ offices, business functions, human
resources, centralized programs, and other district-level administrative
functions.
Building Administration — For the 2019-20 school year, school districts
budgeted $983 million, 6 percent of total school district spending, on unit
administration. This includes expenditures for principals and other building-
level administrative functions.
Pupil Transportation — School districts budgeted $714 million, or 4
percent, on pupil transportation for the 2019-20 school year. This includes
bus and other vehicle operating costs, related maintenance, and program
supervision.
Food Services — Approximately $422 million, or 2 percent of total
spending, is for food-operation functions, including program supervision and
federal-nutrition programs, in the 2019-20 school year.
27You can also read