Non-Invasive Sheep Biometrics Obtained by Computer Vision Algorithms and Machine Learning Modeling Using Integrated Visible/Infrared Thermal ...
←
→
Page content transcription
If your browser does not render page correctly, please read the page content below
sensors
Article
Non-Invasive Sheep Biometrics Obtained by
Computer Vision Algorithms and Machine
Learning Modeling Using Integrated
Visible/Infrared Thermal Cameras
Sigfredo Fuentes 1, * , Claudia Gonzalez Viejo 1 , Surinder S. Chauhan 2 , Aleena Joy 2 ,
Eden Tongson 1 and Frank R. Dunshea 2,3
 1    Digital Agriculture, Food and Wine Sciences Group, School of Agriculture and Food, Faculty of Veterinary
      and Agricultural Sciences, The University of Melbourne, Parkville, VIC 3010, Australia;
      cgonzalez2@unimelb.edu.au (C.G.V.); eden.tongson@unimelb.edu.au (E.T.)
 2    Animal Nutrition and Physiology, Faculty of Veterinary and Agricultural Sciences, The University of
      Melbourne, Parkville 3010, Australia; ss.chauhan@unimelb.edu.au (S.S.C.);
      aleenajoyj@student.unimelb.edu.au (A.J.); fdunshea@unimelb.edu.au (F.R.D.)
 3    Faculty of Biological Sciences, The University of Leeds, Leeds LS2 9JT, UK
 *    Correspondence: sfuentes@unimelb.edu.au

 Received: 26 September 2020; Accepted: 4 November 2020; Published: 6 November 2020

 Abstract: Live sheep export has become a public concern. This study aimed to test a non-contact
 biometric system based on artificial intelligence to assess heat stress of sheep to be potentially used
 as automated animal welfare assessment in farms and while in transport. Skin temperature (◦ C)
 from head features were extracted from infrared thermal videos (IRTV) using automated tracking
 algorithms. Two parameter engineering procedures from RGB videos were performed to assess Heart
 Rate (HR) in beats per minute (BPM) and respiration rate (RR) in breaths per minute (BrPM): (i) using
 changes in luminosity of the green (G) channel and (ii) changes in the green to red (a) from the
 CIELAB color scale. A supervised machine learning (ML) classification model was developed using
 raw RR parameters as inputs to classify cutoff frequencies for low, medium, and high respiration rate
 (Model 1). A supervised ML regression model was developed using raw HR and RR parameters from
 Model 1 (Model 2). Results showed that Models 1 and 2 were highly accurate in the estimation of RR
 frequency level with 96% overall accuracy (Model 1), and HR and RR with R = 0.94 and slope = 0.76
 (Model 2) without statistical signs of overfitting

 Keywords: animal welfare; skin temperature; artificial intelligence; heart rate; respiration rate

1. Introduction
     Live animal exports have been lately under scrutiny by the public and animal welfare advocates [1],
especially live export though shipping, related to welfare conditions and heat stress during long
trips up to six weeks by sea, which in extreme cases can result in the death of animals in rates up
to 2–3.8% [2]. Specifically, these mortality rates have been recently found in animal shipments from
Australia through the Persian Gulf, which can reach temperatures of 36 ◦ C with 95% relative humidity
resulting in heat stress [3].
     Heat stress events for animals are not only restricted to animal transport through sea or land,
but it can also happen in farms due to increased ambient temperatures related to climate change,
which can directly impact the health and welfare of animals [4–7]. There have been several types
of research investigating the genetic resilience and adaptation of animals to heat stress [8–11] and

Sensors 2020, 20, 6334; doi:10.3390/s20216334                                     www.mdpi.com/journal/sensors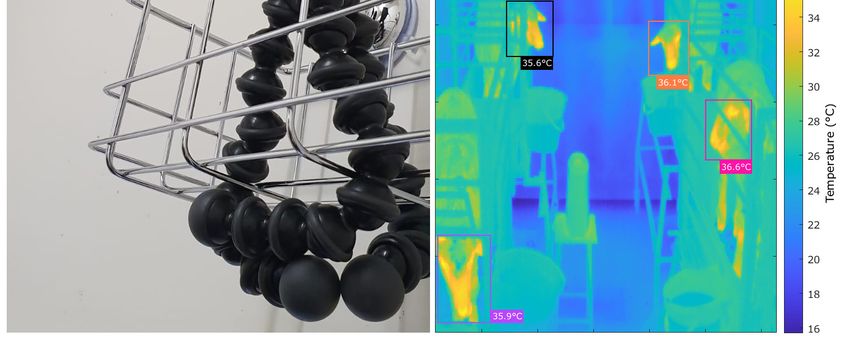
Sensors 2020, 20, 6334                                                                             2 of 18

mitigation strategies [12–14]. Many of these studies have based their assessment of heat stress
on environmental indices, such as ambient temperature and relative humidity combined to form
a temperature-humidity index (THI) [14–16]. The THI can be coupled with direct assessment of the
effects of heat stress using physiological responses through manual monitoring [17,18], using sensors
directly located on animals [19], behavioral assessments or including molecular, cellular and metabolic
biomarkers [20–22]. These methods, though very reliable and robust, are intensive, requiring animal
restraining, are labor-intensive, and time-consuming, also requiring specialized instrumentation and
technical know-how from the personnel acquiring the data. Moreover, the use of intravaginal/rectal
devices or contact sensors can be stressful for the animals [23].
     Applications of artificial intelligence (AI) and machine learning modeling (ML) have been recently
implemented to analyze environmental factors, such as THI, and its effects on heat stress of dairy cows
and final productivity and quality of milk to maximize the utility of big data available from robotic
dairy farms [24]. Further, AI and ML have been applied for processing and modeling remotely sensed
information, which may offer a powerful tool to automatically extract critical physiological data from
videos and infrared thermal imagery from animals and welfare analysis or the effects on quality of
products [23,25–27].
     Non-invasive methods to assess heat stress, based on remote sensing, have shown to be promising,
as they avoid biases in the physiological data obtained from animals due to stresses imposed by
wearable sensors, such as collars, polar sensors (for respiration and heart rate measurements),
or intravaginal/rectal sensors for body temperature measurements [23,28]. Specifically, computer vision
and infrared thermal remote sensing techniques have been recently applied to assess animal stress
based on skin temperature and respiration rate [23,29] or the detection of heart rate and respiratory
rates in pigs through luminosity changes from RGB videos of animals [29,30].
     One of the main constraints in applying remote sensing techniques on sheep involves the thick fleece
from unshorn animals, which presents a thick resistance layer from the skin. The advantage of utilizing
these remote sensing techniques on pigs, especially hairless breeds, is that reflectance from visible and
infrared thermal wavelengths are a direct representation of skin changes. Hence, non-invasive methods
are required to be applied to body sections with less hair or wool in sheep and with outputs that can be
representative, such as the head and face parts [23,30,31]. Specifically, these areas mainly correspond
to the nose for respiration and heart rate and the whole head for skin temperature, especially focused
on the eye section, since they are the only exposed internal organs to the environment, which may
represent core body temperatures.
     This study aimed to test a non-contact biometric system based on artificial intelligence to assess
heat stress of sheep to be potentially used as automated animal welfare assessment in farm and while in
transport. Specifically, it was focused on the automatic tracking of regions of interest (ROI) from sheep
RGB videos and infrared thermal videos (IRTV) and the assessment of physiological information such as
skin temperature, respiration rate (RR), and heart rate (HR) modeled using machine learning algorithms
of sheep subjected to thermoneutral and controlled heat stress conditions. The system proposed
was based on an affordable and integrated RGB 4K video camera and a high-resolution thermal
infrared camera. It was further recommended an artificial intelligence approach to extract information
automatically from sheep that could be coupled to blockchain [32,33] to have an independent assessment
of animal welfare to be applied in the farm and transport or vessel environments. The latter could allow
research on automated systems to ameliorate heat stress on farm animals or during transportation,
such as mister or sprinklers, and will offer a blockchain system for control and certification of good
practices on the farm or transportation to abattoirs or export markets.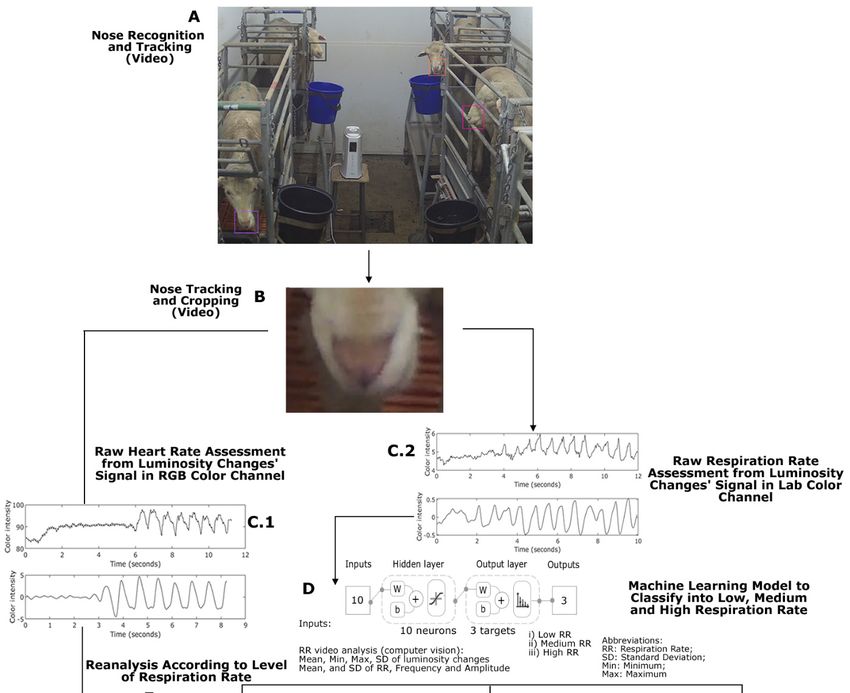
Sensors 2020, 20, 6334 3 of 18
2. Materials and Methods
2.1. Location, Animal Treatments, and Data Acquisition
This study was based on live animals and approved by the Faculty of Veterinary and Agricultural
Sciences, University of Melbourne Animal Ethics Committee (AEC#1914872.1). It was conducted at
The University of Melbourne (UoM), Dookie Campus, Victoria, Australia (36◦ 220 4800 S, 145◦ 420 3600 E).
Twelve sheep (Merino lambs 4–5 months old) were acclimatized to indoor facilities and housed in the
individual pens for 3 days before starting measurements. They were fed a mixed ration (50% pellets,
25% oaten, and 25% Lucerne chaff) formulated to meet or exceed the National Research Council
(NRC) [34] requirements, complemented with fresh water ad libitum. Room exhaust ventilation was
performed using fans through the whole time of the experiments to simulate ventilation usually
performed during live sheep export shipments. The latter mainly rely on mechanical ventilation
using fans to remove heat and water vapor produced by animals, to ventilate moisture produced
from manure pads, and to remove any possible build-up of noxious gases. After acclimatization,
sheep were relocated to metabolic cages and housed in two temperature and relative humidity control
rooms (Figure 1), conditioned to have two treatments with six sheep exposed to cyclic heat stress:
(i) room at 28–40 ◦ C and 40–60% relative humidity (RH), the cycles consisted of high temperatures
of 36–40 ◦ C every day from 8:00 to 16:00, and then reduced to 28–30 ◦ C, and thermoneutral (control)
conditions (ii) room at 18–21 ◦ C and RH between 40 and 50%. The temperature (T) and RH were
recorded every 30 min in each room using a universal serial bus (USB) temperature and humidity
data logger (TechBrands; Electus Distribution, Rydalmere, NSW, Australia). These data were used to
calculate the THI using the formula from Equation (1), which was specially developed for sheep [35].
THI = T − (0.31 − 0.31RH )(T − 14.4) (1)
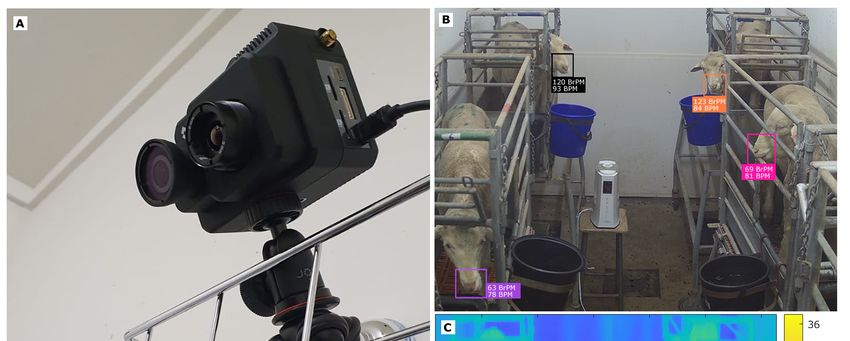
An integrated RGB video and infrared thermal video (IRTV) camera, FLIR® Duo Pro (FLIR Systems,
Wilsonville, OR, USA) was fixed in each room using a small rack and tripod for stabilization (Figure 1A).
This device has two cameras to record simultaneously RGB videos (Resolution: 4000 × 3000; Field of
View: 56◦ × 45◦ ) and IRTV (with a resolution of 336 × 256; Field of View: 35◦ × 27◦ ; Thermal Sensitivity:
Sensors 2020, 20, 6334                                                                                                    4 of 18
Sensors 2020, 20, x FOR PEER REVIEW                                                                                      4 of 18

     Figure 1.1.Images
                  Imagesshowing
                            showing thethe   experimental
                                        experimental   layoutlayout   for thermoneutral
                                                               for thermoneutral   (control)(control)
                                                                                               and heatand
                                                                                                         stressheat  stress
                                                                                                                chambers
     chambers
     and          and implementation
          implementation        of featureoftracking
                                              feature algorithms
                                                      tracking algorithms     and machine
                                                                    and machine      learninglearning     (ML) Models
                                                                                                (ML) Models       1 and 21
     and 2 developed,
     developed,    with (A)with
                              the(A) the®FLIR
                                  FLIR    Dup®ProDupcamera
                                                      Pro camera
                                                              setup,setup,  (B) shows
                                                                      (B) shows         the selected
                                                                                 the selected   regionregion    of interest
                                                                                                         of interest (ROI:
     nose)  from   each  sheep   visible and  extraction  of corresponding    respiration    rate  and heart
     (ROI: nose) from each sheep visible and extraction of corresponding respiration rate and heart rate      rate  values
     from
     valuesthefrom
                videotheanalysis using machine
                         video analysis           learning learning
                                          using machine    (Models 1(Models
                                                                        and 2), and (C)2),the
                                                                                1 and         selected
                                                                                            and  (C) theregion  of interest
                                                                                                          selected  region
     (ROI:  face) (ROI:
     of interest   from each
                          face) sheep  and automatic
                                from each   sheep and tracking
                                                        automatic  and  extraction
                                                                     tracking  and of  temperature
                                                                                    extraction         values (◦ C)values
                                                                                                  of temperature      from
     the
     (°C)infrared
          from thethermal
                      infraredvideo   (IRTV)
                                thermal  videoanalysis.  Abbreviations:
                                                (IRTV) analysis.            BrPM: breaths
                                                                   Abbreviations:              per minute;
                                                                                    BrPM: breaths             BPM: BPM:
                                                                                                       per minute;   beats
     per minute.
     beats  per minute.

2.2. Computer Vision Analysis to Obtain Biometrics
2.2. Computer Vision Analysis to Obtain Biometrics
      The radiometric IRTVs were saved in sequence file extension (seq) and batch converted to Audio
      The radiometric IRTVs were saved in sequence file extension (seq) and batch converted to Audio
Video Interleaved (AVI) using the Sense Batch software (Sense Software, Warszawa, Mazowsze, Poland).
Video Interleaved (AVI) using the Sense Batch software (Sense Software, Warszawa, Mazowsze,
The latter was also used to extract in batch and parallel the radiometric data from each frame from
Poland). The latter was also used to extract in batch and parallel the radiometric data from each frame
all thermal videos in comma-separated values (csv) files. The IRTV was imported to MATLAB®®
from all thermal videos in comma-separated values (csv) files. The IRTV was imported to MATLAB
R2020a (MathWorks Inc., Natick, MA, USA) and the Video Labeler functions from the Computer Vision
R2020a (MathWorks Inc., Natick, MA, USA) and the Video Labeler functions from the Computer
Toolbox™ 9.2 in MATLAB® R2020a         were then used to select and track ROIs focusing on the head
Vision Toolbox™ 9.2 in MATLAB® R2020a were then used to select and track ROIs focusing on the
from each animal (automatic). Specifically, for sheep, the face was selected because the hottest visible
head from each animal (automatic). Specifically, for sheep, the face was selected because the hottest
spots are found in the eyes and nose (Figure 1C). Once the ROIs were tracked, labels were saved
visible spots are found in the eyes and nose (Figure 1C). Once the ROIs were tracked, labels were
automatically, and a customized algorithm written in MATLAB® R2020a          by the DAFW Group from
saved automatically, and a customized algorithm written in MATLAB® R2020a by the DAFW Group
UoM was used to obtain the maximum (Max), mode, and standard deviation (SD) of the temperatures
from UoM was used to obtain the maximum (Max), mode, and standard deviation (SD) of the
from each frame from the selected ROI. Additionally, the mean, Max, mode, and SD from the Max
temperatures from each frame from the selected ROI. Additionally, the mean, Max, mode, and SD
temperatures from all frames were calculated.
from the Max temperatures from all frames were calculated.
      For the analysis of raw signals related to HR and RR, the RGB videos acquired in QuickTime
      For the analysis of raw signals related to HR and RR, the RGB videos acquired in QuickTime
Movie (MOV) file-extension were used. These were analyzed using the Video Labeler functions from
Movie (MOV) file-extension were used. These were analyzed using the Video Labeler functions from
the Computer Vision Toolbox™ 9.2 in MATLAB®® R2020a and the point tracker algorithm, which can
the Computer Vision Toolbox™ 9.2 in MATLAB R2020a and the point tracker algorithm, which can
detect features defined as a region of interest (ROI) and track one or more region of interest (ROI)
detect features defined as a region of interest (ROI) and track one or more region of interest (ROI)
based on the Kanade–Lucas–Tomasi (KLT) algorithm. For this specific study, the nose section was
Sensors 2020, 20, 6334                                                                            5 of 18

based on the Kanade–Lucas–Tomasi (KLT) algorithm. For this specific study, the nose section was
used as ROI for both HR and RR analysis (Figure 1B), as this is the area in which less wool may be
found, as other areas may interfere with the readings creating biases in the data extracted. The ROI
labels obtained were automatically exported and used to crop the RGB videos to get smaller videos
only from the nose area from each sheep selected. These cropped videos were then automatically
analyzed to obtain the signal changes from luminosity and different channels (RGB, CIELAB) using
a modified version of the raw video analysis (RVA) algorithm developed as a function to measure
HR in humans using the photoplethysmography (PPG) method [38] developed by the DAFW Group
from UoM. This algorithm applies a fast Fourier transformation (FFT) for the transformation of the
time signal to frequency and uses a second-order Butterworth filter with cutoff frequencies (Hz) for
analysis. To assess raw signals related to RR, the RVA algorithm was modified (RVAm) to determine
the luminosity changes in the “a” channel from the CIELAB color scale (green to red). The raw
signals from computer vision analysis of cropped videos were evaluated within the cutoff frequency
range 0.33–3.1 Hz for a ML classification model (Model 1, detailed in the machine learning modeling
subsection), and the respiration cutoff frequency ranges used were according to the outputs of Model 1
described in detail below for low: 0.2–1.2 Hz; medium: 1.2–2.2 Hz, and high: 2.2–3.2 Hz. On the other
hand, to assess HR, the luminosity changes in the green (G) channel of the RGB color scale were used
within a frequency range of 0.83–3.00 Hz, since the normal and stressed HR for sheep had a lower
spread in values compared to RR.
     All the steps mentioned above were automated into a pipeline code using components as functions,
which are represented in the diagram of Figure 2, in which the only supervised processes are the initial
ROI selection for the IRTVs and RGB Videos.

2.3. Statistical Analysis and Machine Learning Modeling
     Linear regression analysis for temperature data with intercept passing through the origin and
p ≤ 0.05 as criteria were used to compare the skin and rectal temperature measurements using the
manual methods against each other and the non-invasive infrared thermal biometrics (IRTV) with
XLSTAT ver. 2020.3.1 (Addinsoft, New York, NY, USA). Furthermore, linear regression analysis
for RR and HR data measured manually and from videos using computer vision analysis with
a single frequency range for RR and using frequency ranges for low, medium, and high, as previously
mentioned, were performed. Statistical parameters, such as determination coefficient (R2 ), p-value,
and root means squared error (RMSE) were calculated to test the goodness of fits.
     Based on a proposed parameter engineering procedure, raw RR-related parameters obtained
from RGB Video analysis, using the RVAm algorithm and a single frequency range (0.33–3.1 Hz),
of mean, minimum (Min), maximum (Max), and standard deviation (SD) of luminosity changes
and mean, SD, frequency, and amplitude were used as inputs to develop an initial ML supervised
pattern recognition model to classify the sheep cropped videos into low, medium, and high respiration
frequencies (Model 1; Figure 2D). For this procedure, a customized MATLAB® code, developed by the
authors, was used to test 17 artificial neural networks (ANN) training algorithms [39]. The Bayesian
Regularization algorithm was selected as the best performing algorithm from this procedure based
on the accuracy [correlation coefficient (R)] and best performance (means squared error (MSE)) with
no signs of overfitting. This algorithm does not require a validation stage as it updates the weights
and biases according to the optimization of the model, and is very effective on avoiding overfitting
especially for small and/or noisy datasets [39–41]. Samples were divided randomly with 70% used
for training (n = 94), and 30% for testing (n = 40). Figure 2D shows the model diagram with the
two-layer feedforward network with a tan-sigmoid function in the hidden layer and Softmax function
in the output layer. Ten neurons were selected as the best performance with no under- or over-fitting,
which was obtained from a neuron trimming test (data not shown).
were assessed in batch to find the best model based on output statistics. The Bayesian Regularization
   algorithm was selected as the best performing from this procedure. For modeling purposes, samples
   were divided randomly as follows: 70% (n = 94; observations (n × targets) = 188) for training and 30%
   (n = 40; observations (n × targets) = 80) for testing. Figure 2F depicts the model diagram showing the
   two-layer feedforward network with a tan-sigmoid function in the hidden layer and a linear transfer
   function
Sensors        in 6334
        2020, 20, the output layer. Ten neurons were selected as the best performance with no under- or 6 of 18
   over-fitting, which was obtained from a neuron trimming test (data not shown).

        Figure
     Figure  2. 2. Diagramshowing
                Diagram      showingthethealgorithms
                                           algorithms pipeline
                                                      pipelinefor
                                                               forRGB
                                                                   RGBvideo
                                                                         videoanalysis
                                                                               analysisprocess from
                                                                                         process     (A)(A)
                                                                                                  from   region
                                                                                                            region of
        of interest selection; (B) cropped  videos from sheep  feature to be analyzed; (C1) raw  video analysis
     interest selection; (B) cropped videos from sheep feature to be analyzed; (C1) raw video analysis (RVA)
     for heart rate (HR) signals using the green channel (RGB); (C2) modified RVA (RVAm) for respiration
     rate (RR) analysis using the “a” channel (CIELAB) wide cutoff frequency range; (D) machine learning
     pattern recognition (Model 1) to obtain actual cutoff frequency range; (E) re-analysis of RR signals;
     (F) regression machine learning (Model 1) to obtain accurate HR an RR. Model diagram abbreviations:
     w: weights; b: bias.

     Once the videos of sheep were classified automatically into low, medium, and high RR by
cutoff frequency ML analysis, the videos are automatically reanalyzed using the corresponding
frequency ranges, low: 0.2–1.2 Hz; medium: = 1.2–2.2 Hz; high: 2.2–3.2 Hz, by calling three separated
functions. From this analysis, the outputs from raw RR and HR parameters were used as inputs
Sensors 2020, 20, 6334 7 of 18
to develop a fitting/regression model to predict the real values of RR and HR based on the manual
measurements as targets (Model 2). Again, 17 different training algorithms [40] for artificial neural
networks (ANN) were assessed in batch to find the best model based on output statistics. The Bayesian
Regularization algorithm was selected as the best performing from this procedure. For modeling
purposes, samples were divided randomly as follows: 70% (n = 94; observations (n × targets) = 188)
Sensors 2020,
for training and20, 30%
x FOR(n = 40;
PEER observations (n × targets) = 80) for testing. Figure 2F depicts7the
REVIEW of 18
model
diagram showing the two-layer feedforward network with a tan-sigmoid function in the hidden layer
(RVA) for heart rate (HR) signals using the green channel (RGB); (C2) modified RVA (RVAm) for
and a linear transfer
respiration function
rate in theusing
(RR) analysis output layer.
the “a” Ten neurons
channel (CIELAB) were selected
wide cutoff as therange;
frequency best performance
(D)
with no under-
machineor over-fitting,
learning which was
pattern recognition obtained
(Model from
1) to obtain a neuron
actual trimming
cutoff frequency test(E)
range; (data not shown).
re-analysis
Multivariate
of RR signals;data analysis machine
(F) regression based on a biplot
learning (Model (variables
1) to obtainand samples)
accurate ofModel
HR an RR. principal component
diagram
abbreviations: w: weights; b: bias.
analysis (PCA) was performed using XLSTAT to find relationships and patterns among the data
between real physiological parameters and estimated using computer vision tools and models
Multivariate data analysis based on a biplot (variables and samples) of principal component
proposed. The cutoff point of 60% of data variability explained by the total of both PC1 and PC2 was
analysis (PCA) was performed using XLSTAT to find relationships and patterns among the data
considered to test significance [42]. The THI index calculated using Equation (1) was also included to
between real physiological parameters and estimated using computer vision tools and models
compare
proposed. from
data sheep
The cutoff in control
point of 60% ofand
dataheated chambers.
variability explained by the total of both PC1 and PC2 was
considered to test significance [42]. The THI index calculated using Equation (1) was also included to
3. Results
compare data from sheep in control and heated chambers.
Figure 3a shows the results from the linear regression of rectal and skin temperatures measured
3. Results
with the manual/traditional methods compared to those obtained from the IRTV analysis. There was
a narrowFigure 3a shows
distribution ofthe results from the
temperatures fromlinear regression
all sources of rectal
(from and skin
around 35−40 ◦ C) since measured
temperatures the study was
performed on live animals. The linear regression passing through the originanalysis.
with the manual/traditional methods compared to those obtained from the IRTV (0,0) wasThere was
statistically
a narrow distribution of temperatures from all sources (from around 35−40 °C) since the study was
significant (p < 0.001) and presented a very high correlation and determination coefficients (R = 0.99;
performed on live animals. The linear regression passing through the origin (0,0) was statistically
R2 = 0.99; RMSE = 0.66; slope =0.97) between these two parameters with 3.6% of outliers (4 out of 110)
significant (p < 0.001) and presented a very high correlation and determination coefficients (R = 0.99;
basedR2on the 95% confidence intervals. On the other hand, Figure 3b shows the results from the linear
= 0.99; RMSE = 0.66; slope =0.97) between these two parameters with 3.6% of outliers (4 out of 110)
regression
based on of the
observed skin temperature
95% confidence (manual/traditional
intervals. On the other hand, Figure methods)
3b showsand the values
the results fromobtained
the linear from
the remote
regression sensing analysis
of observed skinusing the IRTVs.
temperature These relationships
(manual/traditional methods)were alsovalues
and the statistically
obtainedsignificant
from
(p < the
0.001) with an R 2 = 0.99 (R = 0.99); RMSE = 1.66; slope = 1.02. Based on the 95% confidence
remote sensing analysis using the IRTVs. These relationships were also statistically significant (p
< 0.001)
intervals, it with
only an
hadR2 2.73%
= 0.99 (R
of=outliers
0.99); RMSE = 1.66;
(3 out slopeSimilarly,
of 110). = 1.02. Based on the3c95%
Figure confidence
shows intervals,
the results from the
linearit regression
only had 2.73% of outliers
of observed (3 out
rectal of 110). Similarly,
temperature Figure 3c shows
(manual/traditional the results
methods) and from the linear
the values obtained
fromregression
the remoteofsensing
observed rectal temperature
analysis (manual/traditional
using the IRTVs. The lineal model methods)
resultedand the very
with valueshighobtained
correlation
from the remote sensing analysis using the IRTVs. The lineal model resulted with very high correlation
and determination coefficients (R = 0.99; R2 = 0.99) and was statistically significant (p < 0.001) with
and determination coefficients (R = 0.99; R2 = 0.99) and was statistically significant (p < 0.001) with
RMSE = 1.71; slope = 0.98 and 3.6% of outliers (4 out of 110) based on the 95% confidence intervals.
RMSE = 1.71; slope = 0.98 and 3.6% of outliers (4 out of 110) based on the 95% confidence intervals.
(a) (b)
Figure 3. Cont.
Sensors 2020, 20, 6334 8 of 18
Sensors 2020, 20, x FOR PEER REVIEW 8 of 18
Sensors 2020, 20, x FOR PEER REVIEW 8 of 19
(c)
(c)
Figure
Figure 3. Linear
3. Linear regressions
regressions comparing
comparing results
results fromfrom (a) rectal
(a) rectal vs. temperatures
vs. skin skin temperatures measured
measured manually
manually
Figure 3.using a
Linear digital thermometer
regressions (DT),
comparing (b) observed
results from skin
(a) temperature
rectal vs. skin
using a digital thermometer (DT), (b) observed skin temperature (manual) vs. temperature (manual) vs. temperature
temperatures measured
from the
from the infrared
manually using athermal
digital video analysis
thermometer (IRTV),
(DT), and (c) observed rectal temperature vs.(manual) vs.
infrared thermal video analysis (IRTV), and (c)(b) observed
observed skin temperature
rectal temperature (manual)
(manual) temperature
vs. temperature
temperature from the
from the infrared IRTV analysis.
thermal Abbreviations:
video analysis (IRTV), and Obs:(c)
observed,
observedConf:
rectalConfidence.
temperature (manual) vs.
from the IRTV analysis. Abbreviations: Obs: observed, Conf: Confidence.
temperature from the IRTV analysis. Abbreviations: Obs: observed, Conf: Confidence.
Figure 4a shows the linear regression between RR and HR measured manually and raw signal
Figure 4A shows the linear regression between RR and HR measured manually and raw signal
analysis related
Figure to HR the
4a shows andlinear
RR using computer
regression visionRR
between analysis
and HR with a singlemanually
measured cutoff frequency
and rawrangesignal
analysis
for
related
respiration
analysis
to
related
HR
rate
and RR
to (0.33–31.
HR and RR
using
Hz)using
computer
and HR
vision
(0.83–3.00
computer
analysis
Hz).analysis
vision It can be
with a
observed
with
single
a singlethat
cutoff frequency
the frequency
cutoff correlationrangeand
range
for respiration
determination rate
for respiration (0.33–31.
coefficients
rate Hz)
were
(0.33–31. Hz) and
very
andHR HR(0.83–3.00
low = 0.15; R2Hz).
(R(0.83–3.00 ItItcan
= 0.02;
Hz). pcan beobserved
< 0.001)
be observed
with RMSE that
that the
= 23.73
the correlation
and and
and slope
correlation
determination
=determinationcoefficients
0.09 mainly represented were
coefficients by were very
thevery low
poorlow (R =
correlation 0.15;
(R = 0.15;found R 2 = 0.02; p < 0.001) with RMSE = 23.73 and
for pthe
R = 0.02;
2 RR raw
< 0.001) data.
with RMSEOn =the other
23.73 andhand,
slope
==0.09
slopeFigure
0.094b
mainly
shows
mainly represented byby
the same manually
represented thethe poor
measured
poor correlation
correlation andfound
HR found RRfor for
the the
rates RR RR
againstrawraw
the data.
raw
data. Onother
Oncomputer
the the other
hand,hand,
vision
analysis
FigureFigure using
4b
4B shows showsdifferent
the the
same cutoff
same frequency
manually
manually ranges HR
measured
measured for
HR RRandaccording
and RR ratesto
RR rates low, medium,
against
against thethe
raw raw or computer
high values
computer vision
vision
(low:
analysis 0.2–1.2
analysis
using usingHz;different
different medium:
cutoff = 1.2–2.2
cutoff
frequency Hz;
frequency high:
rangesranges2.2–3.2
for for
RRRR Hz). It canto
according
according beto observed
low,
low, that or
medium,
medium, the correlation
orhigh
highvalues
values(low:
increased
(low:
0.2–1.2 significantly
Hz;0.2–1.2
medium: Hz; =medium: (R = 0.78;
1.2–2.2 R 2 = 0.61;
= 1.2–2.2
Hz; high: Hz; phigh:
2.2–3.2< 0.001) compared
2.2–3.2
Hz). Hz).be
It can to Figure
It observed
can 4a,
be observedwith
that RMSE
thethat the= correlation
correlation21.81 increased
and
slope = 0.67.significantly
increased (R = 0.78; R2 = 0.61; p < 0.001) compared to Figure 4a, with RMSE = 21.81 and
significantly (R = 0.78; R = 0.61; p < 0.001) compared to Figure 4A, with RMSE = 21.81 and slope = 0.67.
2
slope = 0.67.
(a) (b)
Figure 4. Linear
Figure regressions
4. Linear regressionscomparing
comparing results from(a)
results from (A)respiration
respiration
raterate
(RR)(RR)
and and
heartheart rate (HR)
rate (HR)
measured manually (x-axis) and using computer vision analysis with a single cutoff frequency
measured manually (x-axis) and using computer vision analysis with a single cutoff frequency range for range
for respiration
respiration rate (0.33–3.1
rate (0.33–3.1 Hz; y-axis),
Hz; y-axis), and (B)and (b) respiration
respiration rate rate
and and heart
heart raterate measured
measured manually
manually (x-axis)
and using computer vision analysis with the corresponding cutoff frequency range for respiration
rate according to low, medium or high respiration rate (low: 0.2–1.2 Hz; medium: = 1.2–2.2 Hz;
high: 2.2–3.2 Hz; y-axis).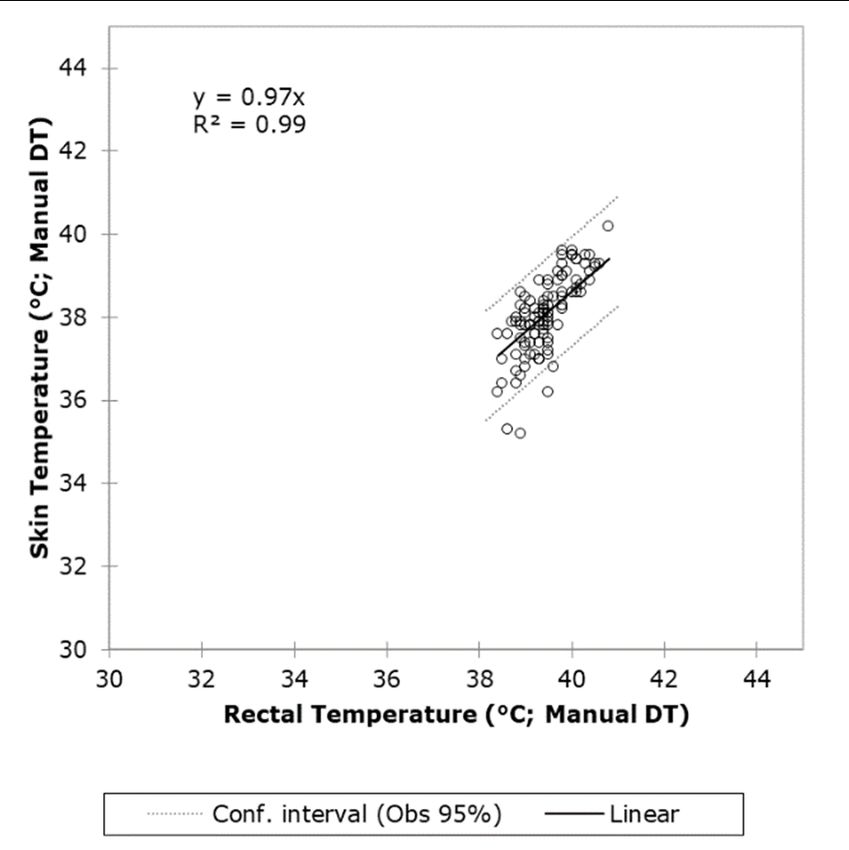
Sensors 2020, 20, x FOR PEER REVIEW                                                                                 9 of 18

      (x-axis) and using computer vision analysis with the corresponding cutoff frequency range for
      respiration rate according to low, medium or high respiration rate (low: 0.2–1.2 Hz; medium: = 1.2–
Sensors2.2 Hz;20,
        2020,  high:
                  63342.2–3.2 Hz; y-axis).                                                               9 of 18

     Table 1 shows the results from the ML pattern recognition model to classify cropped videos from
sheepTable
       into1low,
              shows   the results
                  medium,     andfrom
                                   highthe
                                        RR,ML   pattern recognition
                                             according   to the cutoffmodel   to classify
                                                                        frequencies   for cropped    videos
                                                                                           these three       from
                                                                                                        levels.  It
sheep
can be observed that it presented a very high overall accuracy (96%) with no signs of overfittingcan
       into low, medium,     and high RR,  according  to the  cutoff frequencies  for these   three levels. It  as
be
theobserved
    MSE of the that it presented
                 training         a very
Sensors 2020, 20, 6334 10 of 18
Sensors 2020, 20, x FOR PEER REVIEW 10 of 18
Table
Table 2. 2. Results
Results of of
thethe artificial
artificial neural
neural networks
networks regression
regression model
model (Model
(Model 2) 2) showing
showing statistical
statistical data
data
such as correlation coefficient (R), slope, and performance based on means squared error (MSE) forfor
such as correlation coefficient (R), slope, and performance based on means squared error (MSE)
each
each stage.
stage.
Stage Stage Samples
Samples Observations
Observations RR Slope Performance
Slope (MSE)(MSE)
Performance
Training 94 188 0.98 0.94 72
Training 94 188 0.98 0.94 72
Testing Testing40 40 80 80 0.84
0.84 0.86 0.86 512 512
Overall Overall134 134 268 268 0.94
0.94 0.92 0.92 - -
Figure
Figure 6. 6.Artificial
Artificialneural
neuralnetwork
networkoverall
overallfitting
fittingmodel
modelshowing
showingthethecorrelation
correlationcoefficient
coefficient(R),
(R),
observed
observed (x-axis), and
(x-axis), predicted
and (y-axis)
predicted respiration
(y-axis) respirationrate and
rate heart
and rate
heart values.
rate Abbreviations:
values. Abbreviations: BrPM:
BrPM:
breaths per
breaths minute;
per minute; BPM: beats
BPM: perper
beats minute;
minute;T: T:
Targets.
Targets.
Figure
Figure 7 shows
7 shows the
thePCAPCAcomparing
comparing the HR,
the HR,RR,RR,and
and skin temperature
skin temperature measured
measured with
withmanual
manual
techniques
techniques (HRreal,
(HRreal,RRreal,
RRreal,andand
SkTreal) withwith
SkTreal) those predicted
those predictedusingusing
Model 2 (HRM2,
Model and RRM2)
2 (HRM2, and
and RRM2)
measured by computer vision algorithms (SkTcv), as well as the THI (Equation
and measured by computer vision algorithms (SkTcv), as well as the THI (Equation (1)) for sheep (1)) for sheep from
both
fromtreatments (control(control
both treatments and heat stress)
and heat in different
stress) days/times
in different of measurements.
days/times of measurements.The resulting PCA
The resulting
described a total aoftotal
PCA described 82.92% of total
of 82.92% ofdata
total variability (PC1:(PC1:
data variability 65.04%; PC2:PC2:
65.04%; 17.88%).
17.88%). It can bebe
It can observed
observed
that
that the manual measurements and those assessed using the proposed methods were closelyrelated.
the manual measurements and those assessed using the proposed methods were closely related.
Furthermore,
Furthermore,skin skintemperature
temperaturewas wasrelated
relatedtotoTHI.
THI.AsAs expected,
expected,there
therewaswas a clear
a clear separation
separation andand
clustering
clusteringbetween
betweenthe thesheep
sheepphysiology
physiologyunder undercontrol
controltreatment
treatment(blue
(bluecircles)
circles)compared
compared totothose
those
under
under heat
heatstress
stress(red crosses),
(red crosses),with
withthe latter
the latterassociated
associated with
withhigher
higherRR,
RR,skin
skintemperatures,
temperatures,and andTHI.THI.
PC1,
PC1,which
which is is
the
themain
mainresponsible
responsible forfor
the
theseparation
separation ofof
thethedata according
data according totothe treatments,
the treatments, is is
more
more
related
relatedtoto
RRRR andandskin
skintemperature,
temperature, with
withHR HRwith
withlower
lower variability related
variability related toto
PC2.
PC2. TheTheTHI
THIvalues
values
obtained in this study ranged from 18 to 20 for control and between 27 and 36
obtained in this study ranged from 18 to 20 for control and between 27 and 36 for heat stress for heat stress conditions
(data not shown).
conditions (data not shown).Sensors 2020, 20, 6334 11 of 18
Sensors 2020, 20, x FOR PEER REVIEW 11 of 18
7. Principal
Figure 7.
Figure components analysis
Principal components analysis of
of data
data measured
measured withwith manual
manual techniques (i) SkTreal:
techniques (i) SkTreal: skin
skin
temperature real, (ii) HRreal: heart rate real, (iii) RRreal: respiration rate real, and those
temperature real, (ii) HRreal: heart rate real, (iii) RRreal: respiration rate real, and those measured measured
using
using computer
computer vision analysis
vision analysis and predicted
and predicted using the using
machinethelearning
machine learning
models (iv)models (iv) temperature
SkTcv: skin SkTcv: skin
temperature
computer computer
vision, vision,
(v) RRM2: (v) RRM2:
respiration raterespiration
from Modelrate from
2, (vi) Model
HRM2: 2, (vi)
heart rateHRM2: heart 2,
from Model rate
andfrom
the
Model 2, and the temperature-humidity index (THI) from each day of the control
temperature-humidity index (THI) from each day of the control and heat stress rooms. and heat stress rooms.
4. Discussion
4. Discussion
4.1. Selection of Critical Sheep ROIs, Features Tracking, and Automation
4.1. Selection of Critical Sheep ROIs, Features Tracking, and Automation
Due to constraints in the experimental chambers related to interference from the metabolic cages
Due tohead
and sheep constraints
movement in thethrough
experimental chambers related
them, especially to interference
while feeding (Figure from
8), it the
wasmetabolic cages
not possible to
and sheep head movement through them, especially while feeding (Figure 8),
use single co-registered ROIs for RGB videos and IRTV. The latter would have simplified the modeling it was not possible to
use single however,
procedure; co-registered
resultsROIs
could forhave
RGBbeenvideos
only and IRTV. toThe
applicable latterwith
animals would have
visible simplified
features the
and with
modeling procedure; however, results could have been only applicable to animals
no obstructions through the whole video recordings, rather than those with obstructions like bars from with visible
features and with
the cage (Figure no Hence,
8A,B). obstructions through the
the methodology whole video
proposed recordings,
has greater practicalrather than those
applications with
in penned
obstructions like bars from the cage (Figure 8A,B). Hence, the methodology
and transported animals. By selecting the whole head of the sheep as ROI for IRTV analysis (Figure 8;proposed has greater
practical applications
red rectangles), in penned and
with automated transported
maximum animals.extraction,
temperature By selecting the whole
it gives headprobability
a higher of the sheepof
as ROI for IRTV analysis (Figure 8; red rectangles), with automated maximum
extracting meaningful temperature information from the eyes, nose or mouth regions at any specific time temperature
extraction,
from cropped it gives
videosa even
higher probability
when the headof extracting
moves acrossmeaningful temperature
obstacles, such as bars frominformation from the
the cages (Figure 8).
eyes, nose or mouth regions at any specific time from cropped videos
Furthermore, without obstructions and considering nose and mouth regions as ROI, a simplifiedeven when the head moves
across obstacles, extraction
skin temperature such as bars could fromalsothe
havecages
been(Figure 8). Furthermore,
easily implemented without
by signal obstructions
analysis of peaks and
and
considering nose and mouth regions as ROI, a simplified skin temperature extraction
valleys that represents mathematically the variability between temperatures related to inhalations could also have
been easily implemented
and exhalations by signal
using a similar RVAanalysis
analysisofofpeaks and valleys
the signal (Figure that represents
2). However, mathematically
considering the
obstacles
variability between temperatures related to inhalations and exhalations using
(metabolism cage bars) and head movement through them (Figure 8), the temperature variability coulda similar RVA analysis
of thebeen
have signal (Figure
biased and2). However,
difficult consideringfrom
to discriminate obstacles
those (metabolism cage bars)
related to obstacles and8A),
(Figure head movement
which would
through them (Figure 8), the temperature variability could have been biased and difficult to
discriminate from those related to obstacles (Figure 8A), which would have rendered this potentialIn the case of HR and RR, ROIs were selected from the nose/mouth region of the animals since
they have more hairless skin exposed (Figure 8; blue rectangles). The nose region is considered the
best area to measure RR as it is where inhalation and exhalation occurs and the area in which a large
number of blood vessels are found in sheep [43,44], which also allows measuring HR more accurately.
Specifically,
Sensors 2020, 20,from
6334 these ROIs, changes in luminosity are related to the rushing in and out of 12 the
of 18
bloodstream and cooling down and warming up of skin surfaces, which can be related to HR and
RR, respectively. This would happen obviously on surfaces of living and breathing organisms,
have rendered
making inanimate this potential
obstacle’s simple procedure
luminosity with
unchanged andhigher
easy toerrors in skin either
discriminate temperature estimation
by signal analysis
similar to Figure 4A. On the contrary, the
from RGB video or to be detected by ML modeling. method proposed in this research resulted in high accuracy
compared to measured skin and rectal temperatures with closer relationship from the 1:1 line for skin
temperatures as expected (Figure 3).
A B
Figure 8. Examples of sheep with head and features tracked as region of interest (ROI) for the head
(blue rectangles) for infrared thermal video (IRTV) analysis and nose/mouth regions (blue rectangles)
for heart
Figure and respiration
8. Examples rates
of sheep analysis
with head from RGB video
and features analysis
tracked behindofbars
as region (A) and
interest through
(ROI) thehead
for the bars
(B) of cages.
(blue rectangles) for infrared thermal video (IRTV) analysis and nose/mouth regions (blue rectangles)
for heart and respiration rates analysis from RGB video analysis behind bars (A) and through the bars
In the case of HR and RR, ROIs were selected from the nose/mouth region of the animals since
(B) of cages.
they have more hairless skin exposed (Figure 8; blue rectangles). The nose region is considered
theComputer
4.2. best areaVision
to measure
AnalysisRRofas
Rawit isSignals
whereObtained
inhalationfromand exhalation occurs and the area in which
Videos
a large number of blood vessels are found in sheep [43,44], which also allows measuring HR more
The sensitivity
accurately. of the
Specifically, rawthese
from signal analysis
ROIs, extracted
changes from computer
in luminosity vision
are related algorithms
to the rushing related to
in and out
raw HRbloodstream
of the and RR can beanddetermined
cooling downby the
anduse of specific
warming up cutoff
of skinfrequency ranges can
surfaces, which (Hz)beasrelated
determined
to HR
by
and RR, respectively. This would happen obviously on surfaces of living and breathingcontrol
the RVA and RVAm algorithms [38]. Since the range of RR observed for sheep under and
organisms,
heated environments is very high (27–240 BrPM) compared to HR (63–132 BPM),
making inanimate obstacle’s luminosity unchanged and easy to discriminate either by signal analysis the selection of
cutoff frequency
from RGB to to
video or extract RR raw
be detected bydata is critical. By selecting the whole range cutoff frequency
ML modeling.
range, results showed low sensitivity when compared to observed RR data (Figure 4a).
4.2. Accuracies for HR
Computer Vision and respiration
Analysis ratesObtained
of Raw Signals found through computer vision analysis with different
from Videos
cutoff frequencies for sheep to obtain raw HR and RR (Figure 4b) were in accordance to those using
The sensitivity of the raw signal analysis extracted from computer vision algorithms related to
similar methodologies for cattle [31] and pigs [30]. In the case of HR, this study had a narrower range
raw HR and RR can be determined by the use of specific cutoff frequency ranges (Hz) as determined
between 55 and 135 BPM, with the lower range consistent to the average HR reported for lambs
by the RVA and RVAm algorithms [38]. Since the range of RR observed for sheep under control and
without stress of 57 ± 5 [45].
heated environments is very high (27–240 BrPM) compared to HR (63–132 BPM), the selection of
For RR rate analysis, a review showed that by using cutoff frequencies between 0.20 and 0.40 Hz
cutoff frequency to extract RR raw data is critical. By selecting the whole range cutoff frequency range,
in the case of sheep and goats corresponded to RR of 12–24 BrPM. However, a breathing frequency
results showed low sensitivity when compared to observed RR data (Figure 4A).
study in ruminants recorded RR of 54 BrPM, equivalent to 0.9 Hz, which is within the reference range
Accuracies for HR and respiration rates found through computer vision analysis with different
for adult sheep of 12–72 breaths per minute [46]. In this study, RR ranged from around 45–260 BrPM,
cutoff frequencies for sheep to obtain raw HR and RR (Figure 4B) were in accordance to those using
which is consistent with ranges found in other sheep studies under normal and heat stress conditions,
similar methodologies for cattle [31] and pigs [30]. In the case of HR, this study had a narrower range
between 55 and 135 BPM, with the lower range consistent to the average HR reported for lambs without
stress of 57 ± 5 [45].
For RR rate analysis, a review showed that by using cutoff frequencies between 0.20 and 0.40 Hz
in the case of sheep and goats corresponded to RR of 12–24 BrPM. However, a breathing frequency
study in ruminants recorded RR of 54 BrPM, equivalent to 0.9 Hz, which is within the reference range
for adult sheep of 12–72 breaths per minute [46]. In this study, RR ranged from around 45–260 BrPM,
which is consistent with ranges found in other sheep studies under normal and heat stress conditions,
such as BrPM values between 31 and 247 BrPM [47]. Hence, higher RR corresponding to stressedSensors 2020, 20, 6334 13 of 18
sheep corresponded to three times higher than those associated with around 1 Hz frequency. By using
maximum values of 3 Hz for higher RR values, resulting in more accurate raw RR obtained from
computer vision algorithms (Figure 4B).
4.3. Machine Learning Modeling to Extract Further Sheep Biometrics
The ANN pattern recognition algorithm (Model 1) was able to pre-process the data to obtain these
specific cutoff frequency ranges for RR analysis, which increased the accuracy and performance of
Model 2 compared to lower accuracies and performances using a single frequency cutoff range for
both HR and RR and computer vision analysis (Figure 4B). By using computer vision analysis for
skin temperature extraction and ANN models 1 and 2 allowed full automation in the estimation of
HR and RR from RGB video and IRTV. Furthermore, the integrated FLIR cameras used have direct
connectivity drivers to be used within MATLAB® environments that can allow real-time extraction of
sheep biometrics using the codes developed in this study as shown in Figure 1B, C. From Figure 2,
the only supervised procedure is the initial ROIs selection for visible animals, making the rest of the
process automatic through the pipeline of algorithms, functions and ML models proposed (Figure 2).
Pre-processing of videos using a wider cutoff frequency range for signal analysis of cropped
videos from sheep, plus classification (Model 1) and re-analysis, it takes around 20 s for a 1-min
video approximately, using parallel computing capabilities on a 4-core laptop PC. Hence, using higher
computer capabilities, it was estimated for this time requirement to be between 3–5 s to allow
signal stabilization and cut start to initiate real-time rendering of outputs as shown in Figure 1B, C.
Specifically for HR in humans, the same pre-analysis periods can be found for commercial software,
such as FaceReader (Noldus, Wageningen, The Netherlands) and the computer application Cardiio
(Cardiio, Inc., Cambridge, MA, USA) for smartphones and tablet PCs.
4.4. Comparison between Non-Invasive Biometrics and Environmental Heat Stress Indices
In previous studies, sheep exhibit heat stress with THI ≥ 23 for Mediterranean dairy sheep and
THI ≥ 27 in Comisana dairy sheep [48]. These THI values are consistent with the ranges for heat
stress treatment applied in this study (THI: 26–36). Sheep regulate heat through panting mainly;
hence, the RR is the main heat regulatory mechanism for these animals [47]. Very high RR values
found for heat-stressed sheep (260 BrPM) were related to the highest THIs between 27 and 36 (Figure 7).
From the same figure, vectors related to THI, skin temperature, and RR (for both observed and extracted
through biometrics) were related as expected, which help to maintain a relatively constant maximum
HR showing heat stress regulation. Higher THI is related to higher panting from sheep, which helps
reducing skin and the internal temperature of animals. Some sheep from the heat stress treatments
appear in the PCA graph close to the control cluster, which may correspond to more genetically resilient
sheep to heat stress [49,50].
4.5. Artificial Intelligence System Proposed Based on Algorithms and Models Developed
Automatic ROI selection from sheep can be achieved through the training of deep learning
algorithms to recognize specific sheep features, such as those for the head and nose/mouth
regions. This has been achieved using convolutional networks for pigs [51], wildlife animals [52],
marine animals [53], and chimpanzee faces [54], among others. Other methodologies based on ML,
such as discriminant analysis, independent components Analysis, and ANN, among others, have been
used for animal detection, classification, and tracking [55–59].
Previously, an AI system to reduce heat stress and increase milk production and quality has been
proposed for dairy farms based on the analysis of THI data and cow management information through
ML [24]. From the latter study, automatic drafting doors are controlled from ML outputs that transport
the cows to the milking area or to a sprinkler-based system to reduce heat stress. A similar method can
be implemented here using the algorithms and models developed in this study (Figure 9A). The system
proposed has the advantage that there are no physical obstacles between the camera/analysis hubSensors 2020, 20, x FOR PEER REVIEW 14 of 18
camera/analysis hub and the individual sheep monitored. In open environments, this AI system
could be coupled with virtual fencing systems through collars and the internet of things (IoT) to
Sensors 2020, 20, 6334 14 of 18
automate the separation of heat-stressed sheep towards a sprinkler cooling system (Figure 9A).
Virtual fencing has been successfully applied for automated cattle control systems [60,61], for sheep
[62,63],
and thewith acceptable
individual ethical
sheep frameworks
monitored. assessed
In open for their implementation
environments, [62,64].
this AI system could be coupled with
The
virtual AI systems
fencing proposed
systems throughcan alsoand
collars be implemented
the internet ofinthings
confined
(IoT)sheep in the preparation
to automate or
the separation
during transport (Figure 9B), which could be coupled to blockchain [32,33] to have
of heat-stressed sheep towards a sprinkler cooling system (Figure 9A). Virtual fencing has been an unbiased
control and independent
successfully assessmentcattle
applied for automated of animal
controlwelfare
systems to[60,61],
be applied in the[62,63],
for sheep farm and
withtransport or
acceptable
vessel
ethicalenvironments.
frameworks assessed for their implementation [62,64].
Figure 9.9.Representation
Representation of potential
of potential artificial
artificial intelligence
intelligence applications
applications implementing
implementing models
models developed
developed
in this studyinfor
this
(A)study
in farmfordetection
(A) in farm detection ofsheep
of heat-stressed heat-stressed sheep
and isolation and isolation
towards a coolingtowards
or shadeda
area from
cooling ornon-stressed
shaded area sheep by synchronization
from non-stressed sheep bywith an automated sorting
synchronization with angate, and (B)sorting
automated detection of
gate,
heat (B)
and stress for sheep
detection in transport
of heat stress forcoupled
sheep inwith coolingcoupled
transport fan systems.
with cooling fan systems.
The AI systems proposed can also be implemented in confined sheep in the preparation or
5. Conclusions
during transport (Figure 9B), which could be coupled to blockchain [32,33] to have an unbiased
This study proposed the implementation of automated computer vision algorithms and machine
control and independent assessment of animal welfare to be applied in the farm and transport or
learning models to obtain critical biometrics from recorded RGB, and infrared thermal videos from
vessel environments.
sheep, to help in the automated assessment of heat stress. The implementation of the proposed system
requires affordable hardware capabilities, such as the FLIR integrated cameras, which can include
5. Conclusions
dedicated AI micro-processors and blockchain technology. The user-friendly AI system proposed
This study proposed the implementation of automated computer vision algorithms and machine
learning models to obtain critical biometrics from recorded RGB, and infrared thermal videos from
sheep, to help in the automated assessment of heat stress. The implementation of the proposed systemSensors 2020, 20, 6334 15 of 18
requires affordable hardware capabilities, such as the FLIR integrated cameras, which can include
dedicated AI micro-processors and blockchain technology. The user-friendly AI system proposed
would be able to analyze non-invasive biometrics from sheep in the farm automatically, and through
their transport to secure animal welfare, through independent analysis of information incorporating
blockchain technology for control purposes. Advances proposed in this paper could offer an AI-based
system to monitor animal welfare in farms, and also as a tool to assess animal welfare in transport by
land or sea independently, using blockchain. The latter not only could serve governments to audit live
animal exports but also the industry in general, for more transparency to the public in their treatment
of living animals for human consumption.
Author Contributions: Conceptualization, S.F., and C.G.V.; data curation, C.G.V.; formal analysis, C.G.V.;
funding acquisition, S.S.C.; investigation, S.F., C.G.V., S.S.C., A.J., and F.R.D.; methodology, S.F., C.G.V., and A.J.;
project administration, S.S.C.; resources, S.S.C., and F.R.D.; software, S.F., and C.G.V.; supervision, S.F., C.G.V.,
and F.R.D.; validation, S.F., and C.G.V.; visualization, S.F., C.G.V., and E.T.; writing—original draft, S.F., and C.G.V;
writing—review and editing, S.F., C.G.V., S.S.C., A.J., E.T., and F.R.D. All authors have read and agreed to the
published version of the manuscript.
Funding: This study was partially funded by The University of Melbourne Early Career Researcher Grant 2019.
Conflicts of Interest: The authors declare no conflict of interest.
References
1. Rice, M.; Hemsworth, L.M.; Hemsworth, P.H.; Coleman, G.J. The Impact of a Negative Media Event on Public
Attitudes towards Animal Welfare in the Red Meat Industry. Animals 2020, 10, 619. [CrossRef] [PubMed]
2. Norman, G. Available online: https://www.mla.com.au/research-and-development/search-rd-reports/
final-report-details/National-livestock-export-industry-sheep-cattle-and-goat-transportperformance-
report2017/3852#:~{}:text=National%20livestock%20export%20industry%20sheep%2C%20cattle%20and%
20goat%20transport%20performance%20report%202017&text=The%20overall%20mortality%20rate%
20for,of%200.80%25%20observed%20in%202016 (accessed on 11 July 2020).
3. Davey, A.; Fisher, R. Available online: https://www.agriculture.gov.au/sites/default/files/documents/draft-ris-
animals-australia-attachment-pegasus-report.pdf (accessed on 11 July 2020).
4. Das, R.; Sailo, L.; Verma, N.; Bharti, P.; Saikia, J. Impact of heat stress on health and performance of dairy
animals: A review. Vet. World 2016, 9, 260. [CrossRef] [PubMed]
5. Rojas-Downing, M.M.; Nejadhashemi, A.P.; Harrigan, T.; Woznicki, S.A. Climate change and livestock:
Impacts, adaptation, and mitigation. Clim. Risk Manag. 2017, 16, 145–163. [CrossRef]
6. Lacetera, N. Impact of climate change on animal health and welfare. Anim. Front. 2019, 9, 26–31. [CrossRef]
[PubMed]
7. Gonzalez-Rivas, P.A.; Chauhan, S.S.; Ha, M.; Fegan, N.; Dunshea, F.R.; Warner, R.D. Effects of heat stress
on animal physiology, metabolism, and meat quality: A review. Meat Sci. 2020, 162, 108025. [CrossRef]
[PubMed]
8. Mallard, B.A.; Husseini, N.; Cartwright, S.; Livernois, A.; Hodgins, D.; Altvater-Hughes, T.; Beard, S.;
Karrow, N.; Canovas, A.; Schmied, J. Resilience of High Immune Response (HIR) Genetics in the Context of
Climate Change: Effects of Heat Stress on Cattle with Diverse Immune Response Genotypes. J. Immunol.
2020, 204 (Suppl. 1), 92.4.
9. Mayorga, E.J.; Renaudeau, D.; Ramirez, B.C.; Ross, J.W.; Baumgard, L.H. Heat stress adaptations in pigs.
Anim. Front. 2019, 9, 54–61. [CrossRef]
10. Joy, A.; Dunshea, F.R.; Leury, B.J.; Clarke, I.J.; DiGiacomo, K.; Chauhan, S.S. Resilience of Small Ruminants to
Climate Change and Increased Environmental Temperature: A Review. Animals 2020, 10, 867. [CrossRef]
[PubMed]
11. Osei-Amponsah, R.; Chauhan, S.S.; Leury, B.J.; Cheng, L.; Cullen, B.; Clarke, I.J.; Dunshea, F.R.
Genetic selection for thermotolerance in ruminants. Animals 2019, 9, 948. [CrossRef]
12. Rashamol, V.P.; Sejian, V.; Bagath, M.; Krishnan, G.; Archana, P.R.; Bhatta, R. Physiological adaptability of
livestock to heat stress: An updated review. J. Anim. Behav. Biometeorol. 2018, 6. [CrossRef]
13. Henry, B.; Eckard, R.; Beauchemin, K. Adaptation of ruminant livestock production systems to climate
changes. Animal 2018, 12, s445–s456. [CrossRef] [PubMed]You can also read


