Sanitary Survey - Review - North Kent Coast 2021 - Carcinus Ltd
←
→
Page content transcription
If your browser does not render page correctly, please read the page content below
Sanitary Survey- Review

North Kent Coast – 2021

             Document No. – J0591/20/12/07

Carcinus Ltd, Wessex House, Upper Market Street, Eastleigh, Hampshire, SO50 9FD.

Tel. 023 8129 0095

https://www.carcinus.co.uk/

Cover image: Whitstable Beach © Roger Jeffries, CC-BY-SA 2.0.

Page | i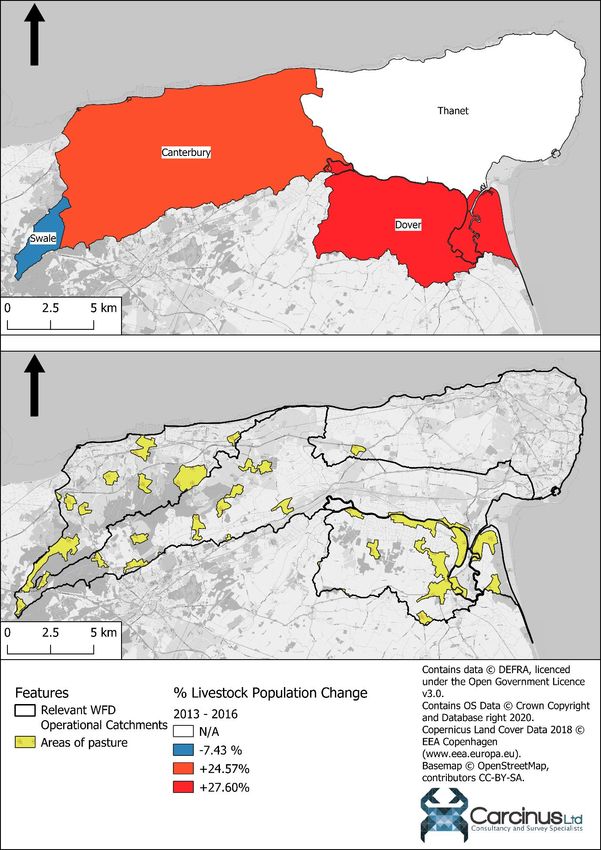
Carcinus Ltd – Document Control Sheet

 Client                                  Food Standards Agency (FSA)

 Project Title                           Sanitary Survey Review

 Document Title                          Sanitary Survey -North Kent Coast

 Document Number                         J0591/20/12/07

 Revision                                3.1

 Date                                    21 May 2021

Revisions
 Revision No.         Date                         Comment

 1.1                  15 December 2020             Draft for FSA review

 2.0                  20 January 2021              Draft for external consultation

 2.4                  04 May 2021                  Update following external consultation

 3.1                  25 June 2021                 Final Document

Document QA and Approval
                                 Name                             Role                           Date

 Author                          Joshua Baker                     Freshwater and Marine          25 June 2021
                                                                  Ecologist

 Checked                         Matthew Crabb                    Director                       25 June 2021

 Approved                        Matthew Crabb                    Director                       25 June 2021

Initial Consultation
 Consultee                                 Date of consultation                        Date of response

 Canterbury City Council                   15 October 2020                             28 October 2020

 Environment Agency                        15 October 2020                             02 November 2020

Consultation on draft report
 Consultee                                 Date of consultation                        Date of response

 LAG                                       08 February 2021                            08 March 2021

 Environment Agency                        08 February 2021                            08 March 2021

A sanitary survey relevant to the bivalve mollusc beds in North Kent Coast was undertaken
in 2011 in accordance with Regulation (EC) 854/2004 (which was replaced by retained EU

Page | ii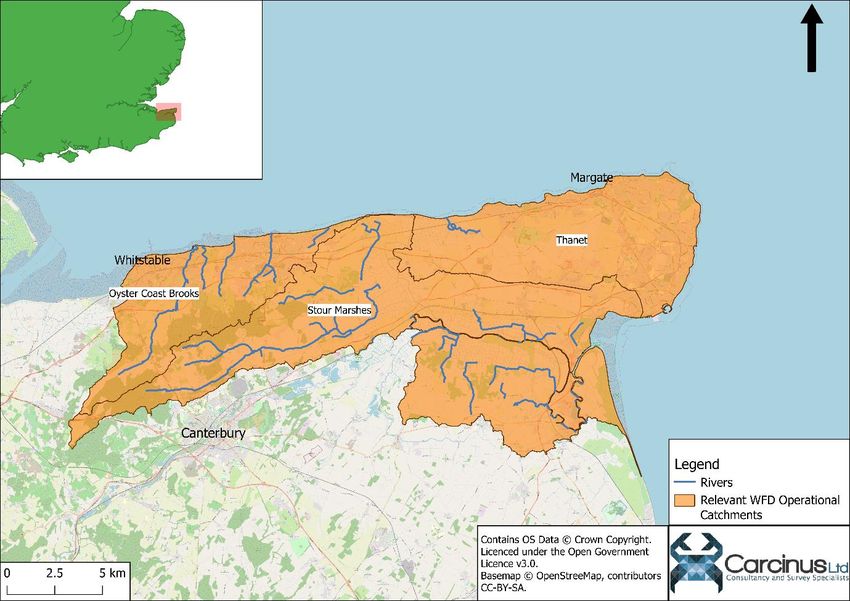
Law Regulation (EU) 2017/625, with sanitary survey requirements now specified in retained
EU Law Regulation (EU) 2019/627). This provided appropriate hygiene classification zoning
and monitoring plan based on the best available information with detailed supporting
evidence. In line with regulatory and EU guidance the Food Standards Agency (FSA)
undertakes targeted sanitary survey reviews to ensure public health protection measures
continue to be appropriate. This report provides a review of information and
recommendations for a revised sampling plan if required. Carcinus Ltd (Carcinus) undertook
this work on behalf of the FSA. Carcinus accepts no liability for any costs, losses or liabilities
arising from the reliance upon or use of the contents of this report other than by its client.

Dissemination
Food Standards Agency, Canterbury City Council. The report is publicly available via the
Carcinus Ltd. website.

Recommended Bibliographic Citation:
Carcinus Ltd (Carcinus), 2021. Review of the North Kent Coast 2011 Sanitary Survey.
Carcinus reports on behalf of the Food Standards Agency, to demonstrate compliance with
the requirements for classification of bivalve mollusc production areas in England and Wales
under retained EU Law Regulation (EU) 2019/627.

Page | iii
Contents
1     Introduction ........................................................................................................................ 1
    1.1      Background.................................................................................................................. 1
    1.2      North Kent Coast Review ............................................................................................ 1
    1.3      Assumptions and limitations ....................................................................................... 2
2     Shellfisheries ....................................................................................................................... 3
    2.1      Description of Shellfishery .......................................................................................... 3
      2.1.1         Pacific oysters ...................................................................................................... 3
      2.1.2         Native oysters ...................................................................................................... 4
      2.1.3         Cockles ................................................................................................................. 4
      2.1.4         Mussels ................................................................................................................ 4
      2.1.5         Tapes spp. ............................................................................................................ 5
    2.2      Classification History ................................................................................................... 5
3     Pollution sources ................................................................................................................ 6
    3.1      Human Population ...................................................................................................... 6
    3.2      Sewage ........................................................................................................................ 9
    3.3      Agricultural Sources .................................................................................................. 12
    3.4      Wildlife ...................................................................................................................... 15
    3.5      Boats and Marinas..................................................................................................... 16
    3.6      Other Sources of Contamination .............................................................................. 17
4     Hydrodynamics/Water Circulation ................................................................................... 17
5     Rainfall .............................................................................................................................. 18
6     Microbial Monitoring Results ........................................................................................... 19
    6.1      Summary Statistics and geographical variation ........................................................ 19
    6.2      Overall temporal pattern in results........................................................................... 25
    6.3      Seasonal patterns of results ...................................................................................... 28
7     Conclusion and overall assessment .................................................................................. 31
8     Recommendations ............................................................................................................ 33
    8.1      Pacific Oyster ............................................................................................................. 33
    8.2      Native oyster ............................................................................................................. 35
    8.3      Mussels ...................................................................................................................... 37
    8.4      Cockles ....................................................................................................................... 38

Page | iv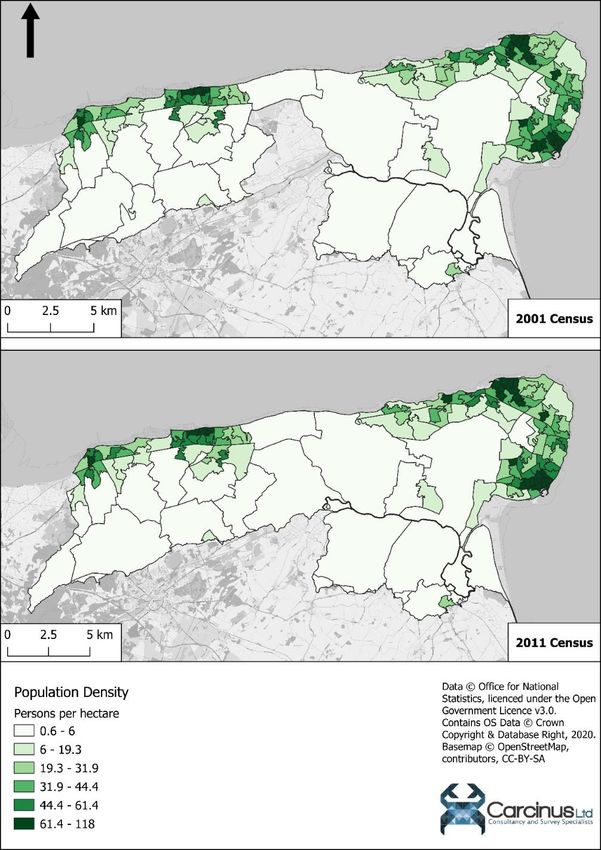
8.5      Tapes spp. .................................................................................................................. 39
    8.6      General Information .................................................................................................. 40
      8.6.1         Location Reference ............................................................................................ 40
      8.6.2         Shellfishery ......................................................................................................... 40
      8.6.3         Local Enforcement Authority(s) ......................................................................... 40
9     References ........................................................................................................................ 45
Appendices............................................................................................................................... 47
    Appendix I. Breakdown of Population Change.................................................................. 48
    Appendix II.           North Kent Coast Sanitary Survey, 2011 .................................................... 50
About Carcinus Ltd ................................................................................................................... 51
Contact Us ................................................................................................................................ 51
Environmental Consultancy ..................................................................................................... 51
Ecological and Geophysical Surveys ........................................................................................ 51
Our Vision................................................................................................................................. 51

Page | v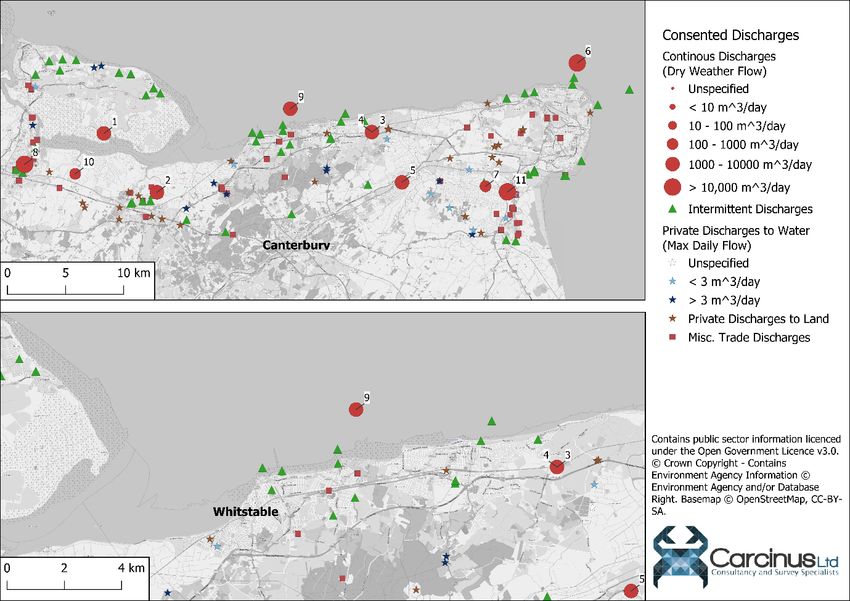
List of figures
Figure 1.1 Overview of North Kent Coast. ................................................................................. 2
Figure 2.1 Current classification zones and associated Representative Monitoring Points
(RMP)s. ....................................................................................................................................... 6
Figure 3.1 Human population density in 2001 and 2011 census Super Output Areas (lower
layer) that intersect the North Kent coast catchment. ............................................................. 7
Figure 3.2 Population change between the 2001 and 2011 censuses for Wards and Electoral
divisions (based on 2011 boundaries) that are within or partially within the North Kent Coast
hydrological catchment (wards have been clipped to the boundary of the hydrological
catchment). 2001 Census data have been transposed to 2011 wards using the UK Data
Service’s GeoConvert tool (UK Data Service, 2020) to facilitate comparison. Numbers within
wards are identifiers that can be used in combination with Appendix I to provide more
detail. ......................................................................................................................................... 8
Figure 3.3 Locations of all consented discharges in the vicinity of the North Kent Coast
BMPA. Labels refer to continuous discharges, details of which can be found in Table 3.1. ... 10
Figure 3.4 Livestock population change between 2013 and 2016 for Local Authority Districts
and areas of pasture within the North Kent catchment.......................................................... 13
Figure 3.5 Locations of moorings, marinas and other boating activities near the North Kent
Coast BMPA.............................................................................................................................. 16
Figure 5.1 Mean daily rainfall (mm) per month for the Sarre Penn at Calcott monitoring
station (NGR: TR173624) for the period (A) 2006 - 2011 (pre sanitary survey) and (B) 2012 -
2017 (post-sanitary survey). .................................................................................................... 18
Figure 6.1 Geometric mean E. coli results from Official Control monitoring at bivalve RMPs
within the North Kent Coast BMPA. ........................................................................................ 20
Figure 6.2 Boxplots of E. coli levels at native oyster RMPs sampled within the North Kent
Coast BMPA 2003-Present. Central line indicates median value, box indicates lower – upper
quartile range and whisker indicates minimum/maximum value excluding outliers (points
>1.5 x interquartile range). ...................................................................................................... 23
Figure 6.3 Boxplots of E. coli levels at Pacific oyster RMPs sampled within the North Kent
Coast BMPA 2003-Present. ...................................................................................................... 24
Figure 6.4 Boxplots of E. coli levels at mussel RMPs sampled within the North Kent Coast
BMPA 2003-Present. ................................................................................................................ 24
Figure 6.5 Boxplots of E. coli levels at cockle RMPs sampled within the North Kent Coast
BMPA 2003-Present. ................................................................................................................ 25
Figure 6.6 Timeseries of E. coli levels at native oyster RMPs sampled within the North Kent
Coast BMPA 2003 – Present. Scatter plots are overlaid with loess model fitted to data. ...... 26
Figure 6.7 Timeseries of E. coli levels at Pacific oyster RMPs sampled within the North Kent
Coast BMPA 2010 – Present (A) and following the sampling commencing at Tankerton RMPs
(B). Scatter plots are overlaid with loess model fitted to data................................................ 27
Figure 6.8 Timeseries of E. coli levels at mussel RMPs sampled within the North Kent Coast
BMPA 2013 – Present. Scatter plots are overlaid with loess model fitted to data. ................ 27

Page | vi
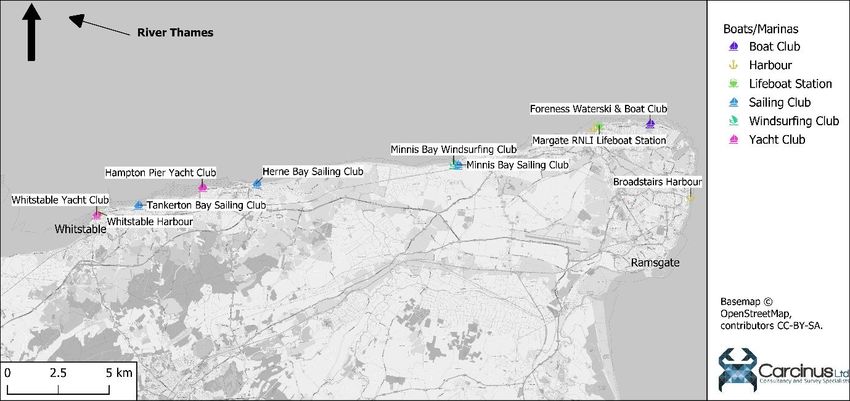
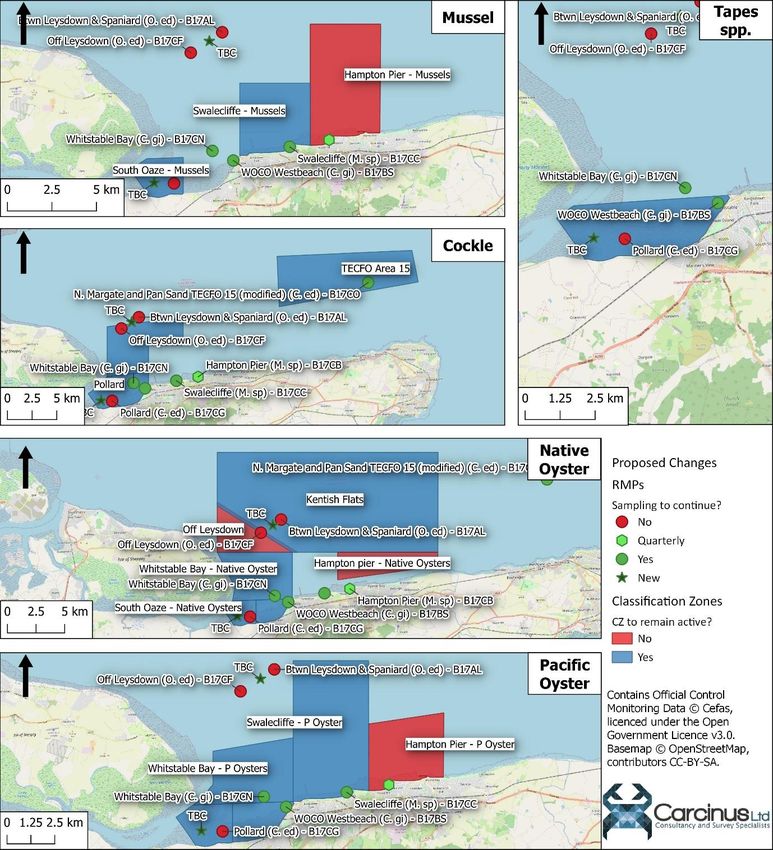
Figure 6.9 Timeseries of E. coli levels at cockle RMPs sampled within the North Kent Coast
BMPA 2013 – Present. Scatter plots are overlaid with loess model fitted to data. ................ 28
Figure 6.10 Boxplots of E. coli levels per season at native oyster RMPs sampled within the
North Kent Coast BMPA 2003 - present. ................................................................................. 29
Figure 6.11 Boxplots of E. coli levels per season at Pacific oyster RMPs sampled within the
North Kent Coast BMPA 2010 - present. ................................................................................. 30
Figure 6.12 Boxplots of E. coli levels per season at mussel RMPs sampled within the North
Kent Coast BMPA 2013 - present............................................................................................. 30
Figure 6.13 Boxplots of E. coli levels per season at cockle RMPs sampled within the North
Kent Coast BMPA 2013 - present............................................................................................. 31
Figure 8.1 Proposed Classification Zone boundaries and RMPs for the North Kent Coast
BMPA........................................................................................................................................ 44

List of tables
Table 3.1 Details of all continuous discharges in the vicinity of the North Kent Coast BMPA.
.................................................................................................................................................. 10
Table 3.2 Livestock data for the North Kent Coast catchment in 2013 and 2016. .................. 14
Table 5.1 Summary statistics for rainfall before and after the sanitary survey. ..................... 19
Table 6.1 Summary statistics of E. coli (MPN/100 g) from RMPs sampled from 2003 onwards
(Data cut off at November 2020). ............................................................................................ 21
Table 8.1 Proposed sampling plan for the North Kent Coast BMPA. Suggested changes are
given in bold red type. ............................................................................................................. 41

Page | vii
1 Introduction
1.1 Background
In line with Article 58 of retained EU Law (EC) Regulation 2019/627 and the EU Good
Practice Guide (European Commission, 2017), Carcinus Ltd (Carcinus) is contracted to
undertake reviews of sanitary surveys on behalf of the Food Standards Agency (FSA). The
FSA undertakes targeted sanitary survey reviews to ensure public health protection
measures continue to be appropriate.

The report considers changes to bacterial contamination sources (primarily from faecal
origin) and the associated loads of the faecal indicator organism Escherichia coli (E. coli) that
may have taken place since the original sanitary survey was undertaken. It does not assess
chemical contamination, or the risks associated with biotoxins. The assessment also
determines the necessity and extent of a shoreline survey based on complexity and risk. The
desktop assessment is completed through analysis and interpretation of publicly available
information, in addition to consultation with stakeholders.

1.2 North Kent Coast Review
This report reviews information and makes recommendations for a revised sampling plan
for existing mussel (Mytilus edulis), cockle (Cerastoderma edule), soft shell clams (Tapes
spp.), native (Ostrea edulis) and Pacific oyster (Crassostrea gigas) classification zones off the
North Kent Coast (Figure 1.1). This review explores any changes to the main microbiological
contamination sources that have taken place since the original sanitary survey was
conducted. Data for this review was gathered through a desk-based study and consultation
with stakeholders.
An initial consultation with the Local Authorities (LAs) and Environment Agency (EA)
responsible for the production area was undertaken in October and November 2020. This
supporting local evidence is valuable to assist with the review and was incorporated in the
assessment process.
Following production of a draft report, a wider external second round of consultation with
LAs and Local Action Group (LAG) members was undertaken in January and February 2021.
It is recognised that dissemination and inclusion of a wider stakeholder group, including
local industry, is essential to sense-check findings and strengthen available evidence. The
draft report is reviewed taking into account the feedback received.
The review updates the assessment originally conducted in 2011 and sampling plan as
necessary and the report should read in conjunction with the previous survey (which is
presented in Appendix II).
Specifically, this review considers:
(a) Changes to the shellfishery (if any);
(b) Changes in microbiological monitoring results;
(c) Changes in sources of pollution impacting the production area or new evidence relating
to the actual or potential impact of sources;
Page | 1
(d) Changes in land use of the area; and
(e) Change in environmental conditions.

Sections 2 - 6 detail the changes that have occurred to the shellfishery, environmental
conditions and pollution sources within the catchment since the publication of the original
sanitary survey. A summary of the changes is presented in section 7 and recommendations
for an updated sampling plan are described in section 8.

1.3 Assumptions and limitations
This desktop assessment is subject to certain limitations and has been made based on
several assumptions, namely:
    • Accuracy of local intelligence provided by the Local Authorities (LA) and Environment
       Agency (EA).
    • The findings of this report are based on information and data sources up to and
       including November 2020;
    • Only information that may impact on the microbial contamination was considered
       for this review; and
    • Official Control monitoring data have been taken directly from the Cefas data hub,
       with no additional verification of the data undertaken. Results up to and including
       November 2020 have been used within this study. Any subsequent samples have not
       been included.

Figure 1.1 Overview of North Kent Coast.

Page | 2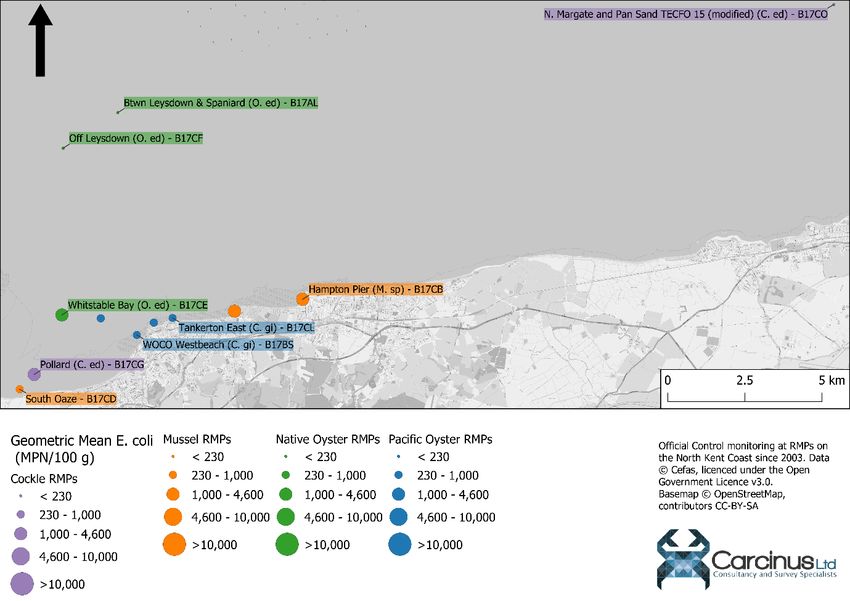
2 Shellfisheries
2.1 Description of Shellfishery
Harvesting of shellfish in the waters off the North Kent coast is controlled under the Kent
and Essex Inshore Fisheries and Conservation Authority (KEIFCA) Area A Byelaws (KEIFCA,
2020), except for those areas that are conferred rights under any historic right of Several
Fishery, Act of Parliament, Royal Charter or other rights. These byelaws set out the rights
and restrictions that apply to fishermen wanting to utilise the fishing waters and applies to
the entire area considered in this review. Under the byelaw, limits on harvesting mean that
no more than 13.6 m3 of mussels within a 24-hour period may be harvested. Additionally,
fishermen dredging for shellfish may not operate a dredge that has an opening that exceeds
2 m when fishing for mussels, 85 cm for scallops or 4 m for oysters. The byelaws also impose
minimum landing sizes; no more than 10% (by weight) of landed mussels should be able to
pass through a space 18 mm width and no oysters that fit through a circular ring 7 cm
diameter may be removed, though this restriction does not apply to Pacific oysters.
Furthermore, the KEIFCA reserves the right to close a fishery where the bed “is so severely
depleted as to require temporary closure in order to ensure recovery, or any bed or part of a
bed contains mainly immature shellfish which in the interest of the protection and
development of the fishery ought not to be disturbed for the time being, or any bed of
transplanted shellfish ought not to be fished until it has become established…”.
The boundaries of the North Kent Bivalve Mollusc Production Area (BMPA) are not distinct,
with the western boundary extending into the Swale BMPA and the northern boundary
extending to the Thames Estuary BMPA. For the purposes of this review, only those
classification zones identified as falling within the North Kent BMPA in the September 2020
update to the designated BMPAs in England and Wales (FSA, 2020) have been considered.
2.1.1 Pacific oysters
The original sanitary survey (undertaken in 2011) described that the Pacific oyster fishery off
the North Kent coast was concentrated around two trestle cultivation sites off Whitstable.
However, due to naturally occurring stocks across the entire intertidal zone, it
recommended the creation of seven classification zones (CZs), forming one contiguous zone
stretching from the western boundary to Nayland Rock in Margate. These CZs were:
Nayland Rock, Minnis Bay, Reculver, Hampton Pier, Swalecliffe, Swalecliffe Outfall,
Westbeach and South Oaze. Of these CZs, only Hampton Pier, Swalecliffe, South Oaze and
Westbeach possess a current classification. These CZs are now concentrated on the western
side of the Production Area (Figure 2.1). Based on the information available, Nayland Rock
and Minnis Bay CZs appear not to have been ever formally awarded a classification for
Pacific oyster harvesting. Consultation with the LA indicated that the trestle culture
operations off Whitstable have increased in size, in part due to the decreased labour
intensity of harvesting trestles as opposed to dredge.

Page | 3
No IFCA landing statistics are available for the Pacific oyster fishery, although consultation
with the LAG indicated that production around the Whitstable Bay area is about 200-300
tonnes per year. No accurate statistics are available for other areas of the BMPA.
2.1.2 Native oysters
The original sanitary survey reported that naturally occurring native oyster beds were
present in the western part of the BMPA, and made recommendations to divide the large,
single CZs into 6 smaller CZs; Swalecliffe outfall, Westbeach, South Oaze, Whitstable Bay, Off
Leysdown & Kentish Flats. The Swalecliffe outfall CZ was never awarded a classification, and
the eastern boundary of the Whitstable Bay CZ has been moved westwards from its original
position, in line with the eastern boundary of the Kentish Flats CZ to its current position on a
line drawn north from TR 1068 6717 (Figure 2.1). The eastern part of the original CZ is now
referred to as Hampton Pier, and extends from the eastern boundary of the Kentish Flats CZ
to the eastern boundary of the Swalecliffe CZ (which is classified for Pacific oyster and
mussels). The other CZs have remained as recommended in the original sanitary survey.
As no IFCA landing statistics are available for the native oyster fishery, the extent of fishing
effort is based on consultation with the LA, who indicated that the current level of effort
within this fishery is approximately 4 boats, removing several hundred oysters, several times
a week in peak season.
2.1.3 Cockles
The original sanitary survey describes the presence of a significant cockle dredge fishery
within the outer Thames Estuary. Within the survey area, the main beds lay off Leysdown,
on the Hamm grounds, off Whitstable on the Pollard grounds, at Minnis Bay from the
intertidal zone and offshore on Hook Spit and Margate Sands, although indicated that they
may be present anywhere with a suitable sandy substrate. Based on this distribution, the
original survey recommended the creation of the following CZs; Pollard, Swale Entrance,
Hook & Margate Sands, Minnis Bay and Swalecliffe Outfall. Of these, only the Pollard and
Swale Entrance CZs are active and it is not clear whether the remaining CZs were ever given
an active classification. The North Margate Sand and Pan Sands CZ, which is TECFO1 Area
15), covers part of the original Hook & Margate Sands CZ, although it does not extend as far
south.
Consultation with the LA indicated that the cockle fishery is smaller than the oyster
fisheries, with 2/3 boatloads of cockles landed over an approximate four-week period
during the year. Again, it is not clear what proportion of this effort is within which CZ.
2.1.4 Mussels
The original sanitary survey describes that mussels in the survey area have a wide but
patchy distribution, with most stock comprising undersized ‘seed’ mussels. It recommended
that the classifications for this species align with those for native oysters (Section 2.1.1). Of

1
 TECFO – Thames Estuary Cockle Fishery Order, 1994. Available at:
https://www.legislation.gov.uk/uksi/1994/2329/contents/made.

Page | 4
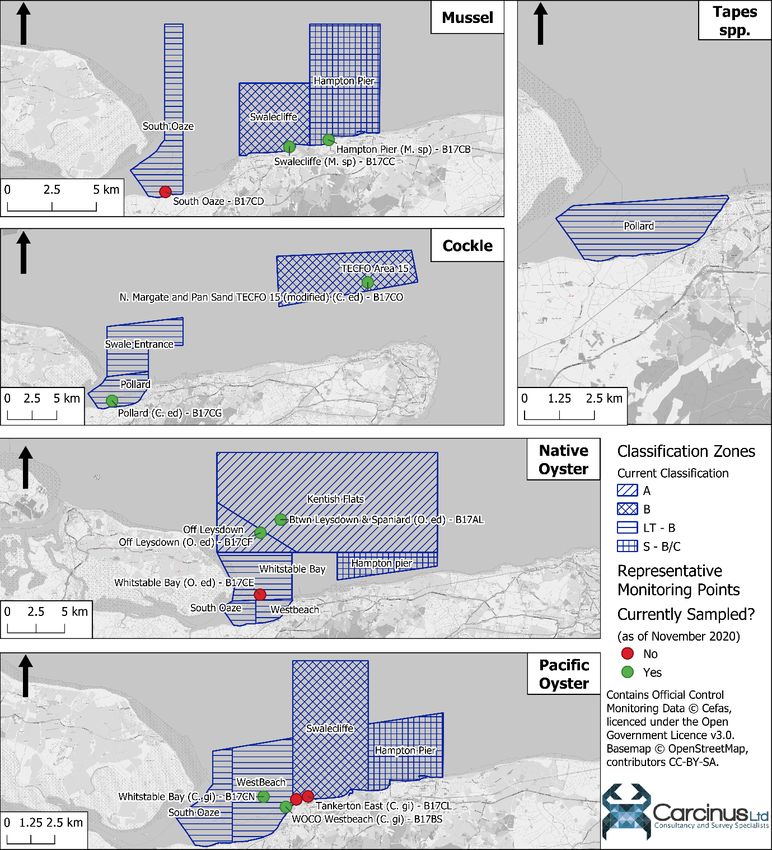
these CZs, only South Oaze, Swalecliffe and Hampton Pier possess a current classification. It
is not clear what prompted the declassification of the remaining CZs, although it is likely due
to lack of stock for harvesting/sampling, given the patchy and ephemeral nature of the stock
for this fishery.
No estimate of the current landings from this fishery were available to the authors of this
review.
2.1.5 Tapes spp.
The original sanitary survey recommended the inclusion of CZs across the entire North Kent
coast for the harvesting of Tapes spp. (Manilla clams & Palourdes / native clams) within the
sampling plan. These CZs were Pollard, Minnis Bay, Swale Entrance, Swalecliffe Outfall,
Swalecliffe, Hampton Pier, Reculver & Nayland Rock. The Sanitary Survey identified that
there was no need to classify the CZs covering the area from Whitstable to Nayland Rock as
no commercial harvesting was taking place at present. Only the Pollard CZ currently holds a
classification and it is not clear whether any of the other CZs were ever awarded a
classification.
Consultation with the Local Authority indicated that stocks of this species exist in the same
areas as cockles, although no stock is currently landed commercially.

2.2 Classification History
The sampling plan proposed in the original sanitary survey was complex, classifying a total
of 34 CZs for the five different harvested species, covering the entirety of the North Kent
Coast. Since publication, the boundaries of these CZs have not changed significantly (with
the exception of the Whitstable Bay native oyster CZ). However, the majority of these CZs
are not currently classified, and it is not clear whether classification was ever awarded. With
the exception of the North Margate Sand and Pan Sands CZ, all the current CZs are
concentrated in the area between the mouth of the River Swale and the village of Reculver.
The locations of all active CZs in the North Kent BMPA are shown in Figure 2.1. There are
currently 17 CZs within the North Kent BMPA that have an active classification, with more
than half having LT-B classifications (Figure 2.1). The Hampton Pier CZ has a Seasonal B/C
classification for all three species, with the Class B season falling between 1st September –
31st January, reverting to Class C at all other times. Two CZs, Kentish Flats and Off Leysdown,
both hold Class A classifications for native oyster harvesting.

Page | 5
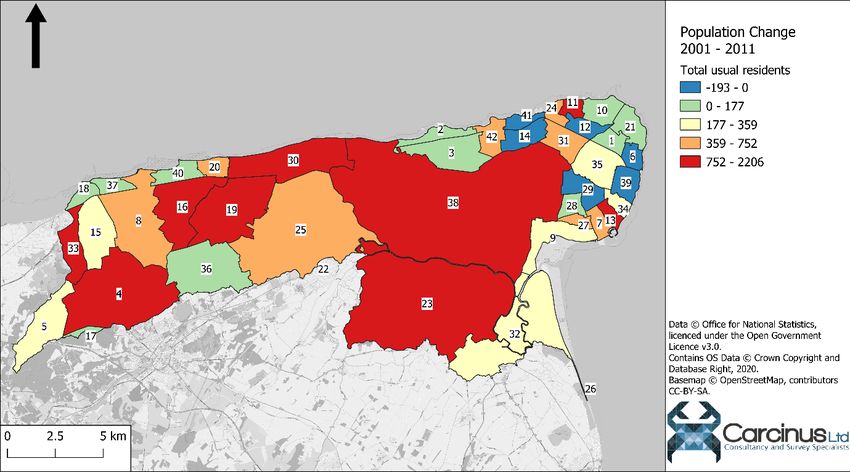
Figure 2.1 Current classification zones and associated Representative Monitoring Points
(RMP)s.

3 Pollution sources
3.1 Human Population
The original sanitary survey cites population data from 2004. The data collected during the
last full census of the United Kingdom conducted in 2011 has been compared to the data of
the 2001 census to give an indication of changes in the human population within the
catchment. These censuses have been used as no further population data are freely
available. Population change has only been quantified in areas assessed in the original

Page | 6
sanitary survey; consultation with the LA indicated that significant increases in Faversham
and the Isle of Sheppey have occurred, although these have not been quantified here.
Changes in human population densities in census Super Output Areas (lower layer) and total
population within wards within or partially within the North Kent catchment between the
2001 and 2011 censuses are shown in Figure 3.1 and Figure 3.2.

Figure 3.1 Human population density in 2001 and 2011 census Super Output Areas (lower
layer) that intersect the North Kent coast catchment.

In general, population has increased across the catchment, particularly around the towns of
Margate, Seasalter and Whitstable. Only 6 wards showed a decrease in population over the
time period. Highest population densities remain along the coastline, particularly at the
western and eastern extremes of the catchment. Much of the catchment beyond this

Page | 7
remains relatively rural, with population densities of
The original sanitary survey stated that a population increase of approximately 20% occurs
during the summer months, due to the popularity of the catchment as a holiday destination.
Updated numbers of tourists were not freely available, although Kent County Council
estimates that the number of tourism industries within the county increased by 14.6% from
2014 – 2019 (Kent County Council, 2020). This increase is likely a result of increased
numbers of tourists, and so the loading to the sewage network will be the greatest in the
summer months.
Whilst there is no recently available population data for the catchment, it is likely that the
population will have increased by a small proportion since the last sanitary survey. However,
the distribution of main population centres within the catchment has not changed, and as
such the recommendations for RMP location are still valid.

3.2 Sewage
Details of all consented discharges in the vicinity of the North Kent Coast BMPA were taken
from the most recent update to the EA’s national permit database at the time of sampling
(October 2020). The locations of these discharges are shown in Figure 3.3.
The original sanitary survey identified a total of four continuous discharges to the North
Kent Coastal Strip (p. 68, Figure VII.1; p. 66, Table VII.1). The most significant in terms of its
contribution to the bacteriological contamination of the shellfishery was the Swalecliffe
WWTW, with a Dry Weather Flow (DWF) of 7,608 m3 / day. The permitted discharge, as well
as the treatment (UV Disinfection) has not changed, meaning that when operational, the
bacterial loading emitted from this discharge should be relatively low. All of the discharges
identified in the original sanitary survey are still active and the additional discharges
identified in this survey are all located a significant distance from the BMPA (including those
on the Isle of Sheppey and around the Swale Estuary).

Page | 9
Figure 3.3 Locations of all consented discharges in the vicinity of the North Kent Coast BMPA.
Labels refer to continuous discharges, details of which can be found in Table 3.1.

Table 3.1 Details of all continuous discharges in the vicinity of the North Kent Coast BMPA.

 ID    Sewage Works           NGR               Treatment                           DWF
                                                                                  (m3/day)
       EASTCHURCH             TQ9810067400 BIOLOGICAL FILTRATION
  1                                                                                 4500
       WWTW
       FAVERSHAM ABBEY        TR0267562337      BIOLOGICAL FILTRATION
  2                                                                                 7000
       FIELD S.T.W.
       HERNE BAY STW          TR2117067521      CHEMICAL - PHOSPHATE
  3                                                                                 2867
                                                STRIPPING
       HERNE BAY STW          TR2117067521      CHEMICAL - PHOSPHATE
  4                                                                                 5903
                                                STRIPPING
       HERNE BAY STW          TR2376063190      CHEMICAL - PHOSPHATE
  5                                                                                 5903
                                                STRIPPING
       MARGATE                TR3885073460      ACTIVATED SLUDGE
  6                                                                                 29120
       HEADWORKS
       MINSTER IOT            TR3095062850      BIOLOGICAL FILTRATION
  7                                                                                 1000
       WWTW
       SITTINGBOURNE          TQ9128064740 BIOLOGICAL FILTRATION
  8    WASTEWATER                                                                   11800
       TMNT WORKS
Page | 10
ID Sewage Works NGR Treatment DWF
(m3/day)
SWALECLIFFE TR1415069530 UV DISINFECTION
9 7608
WWTW
10 TEYNHAM S.T.W. TQ9563063920 UNSPECIFIED 848
WEATHERLEES HILL TR3284062370 CHEMICAL & BIOLOGICAL
11 21435
A WWTW
In addition to the continuous discharges, the original sanitary survey identified a total of 39
intermittent discharges along the North Kent Coast coastal strip. Intermittent discharges
comprise Combined Storm Overflows (CSOs), storm tank overflows and pumping station
emergency overflows. These are distributed more ubiquitously around the catchment,
although are mostly found in the urban centres of the survey area. Only one of the
intermittent discharges identified in the original sanitary survey is no longer active
(Goodstone Pumping station) and only one discharge (Churchwood Drive SPS) has since
become active. No updated spill event monitoring for intermittent discharges in the
catchment was available to the authors of this review, although as the patterns of rainfall in
the catchment have not changed significantly (Section 5),the frequencies of spill events
would be expected to be similar. However, the secondary round of consultation with the
Environment Agency revealed that an investigation into intermittent discharges from
WWTWs and CSOs in the area found that untreated sewage was being discharged into the
BMPA. Furthermore, the EA indicated that Event Duration Monitoring at assets in the area
revealed that ‘significant’ (>50 m3) storm discharges have occurred more frequently than
planned. As such, it is assumed that bacterial loading from intermittent discharges may have
increased, although the routes of contamination are likely to have remained the same. The
EA also clarified that the Swalecliffe WWTW discharges via a long sea outfall and a short sea
outfall during certain storm conditions.
In addition to the water company owned discharges, there are still a number of privately
owned discharges throughout the survey area. However, very few of these discharge
directly to the shellfish waters, and so are not predicted to have a significant effect on the
bacterial loading experienced by the shellfishery.
During consultation with the LAG concerns were expressed that existing WWTW network is
at or near capacity and that continued increases in population will lead to direct declines in
water quality within the BMPA. It is likely therefore that contamination from sewerage
network discharges is a greater factor in the E. coli levels measured in shellfish samples than
previously thought. However, the most at risk areas to contamination from this source,
therefore, remain those CZs closest to the coastline of the catchment. Therefore, the
recommendations made in the original sanitary surveys to capture this source of pollution
remain valid.
Page | 113.3 Agricultural Sources The original sanitary survey provides livestock population data based on the 2010 agricultural census. These data were not freely available to the authors of this review, however livestock population data for the four Local Authority Districts that fall within or partially within the North Kent catchment were available for 2013 and 2016 (DEFRA, 2018). As only a small proportion of some of the districts falls within the catchment, the livestock data have been adjusted to reflect the % of each district that falls within the catchment. This assumes that livestock are distributed uniformly throughout the district and, therefore, some inaccuracies may be present. Aggregate adjusted livestock population change data are presented in Figure 3.4 and Table 3.2. Overall, the livestock population increased by 29.15% between 2013 and 2016, although this statistic is swayed by the low livestock numbers in Thanet. In 2013, the only livestock within the district were ~50 poultry, whereas in 2016 the only livestock were ~2000 sheep. This distorts the % total change across the entire catchment. If Thanet is disregarded, there is a 23% increase in livestock numbers. Only Swale (of which only 1.54% is within the catchment) showed a decrease in livestock numbers. Very little of the catchment is reserved for areas of pasture (Figure 3.4); only 17.8% of the catchment being pasture according to 2018 Land Cover data. The average livestock density in the catchment is 51.8 animals per hectare in areas of pasture. The principal route of contamination of coastal waters by livestock is surface run-off carrying faecal matter to coastal waters. However, as very little of the pasture is directly adjacent to the shoreline and there are few major freshwater sources to the BMPA (see Figure 1.1), there is limited pathway for connectivity from this source of contamination. The Graveney marshes and surrounding areas are currently used for sheep grazing, although the development of the Cleve Hill Solar Park will see the land use of this area change away from sheep grazing. The original sanitary survey reported a significant amount of arable land within the catchment. Recently available satellite imagery suggests that this arable land still exists. Application of organic fertiliser to fields may cause some contamination through runoff, though the timing and extent of this contamination is unclear. Despite the fact that livestock population has increased significantly since the publication of the original sanitary survey, livestock population remains low and there is limited pathway for connectivity. As such, the recommendations made in the original sanitary survey for RMP locations are still valid. Page | 12
Figure 3.4 Livestock population change between 2013 and 2016 for Local Authority Districts
and areas of pasture within the North Kent catchment.

Page | 13
Table 3.2 Livestock data for the North Kent Coast catchment in 2013 and 2016.

                                         Area Within Catchment (Ha)
                                                                                                                                                                    Number of livestock (Adjusted)

                                                                            % LAD within catchment
      Local Authority District

                                                                                                      % Catchment Area
                                                                                                                                     Cattle (5)                    Sheep                       Pigs                     Poultry

                                                                                                                                                  % diff                   % diff                     % diff                        % diff
                                                                                                                         2013          2016       2016/    2013   2016     2016/     2013   2016      2016/     2013    2016        2016/
                                                                                                                                                  2013                     2013                       2013                          2013

   CANTERBURY                                       10525                   34.09%                   39.79%                1537         1628       5.87%   4773   5324     11.55%     386    828      114.39%   23068   29298       27.01%

                         DOVER                                   5039       15.98%                   19.05%                1093         1104       1.03%   1989   2005      0.79%     459    266      -41.99%    1190    2662      123.62%

                           SWALE                                      576               1.54%         2.18%                     77         75     -2.39%    375    332     -11.60%     24      26       9.29%    1126    1050        -6.74%

               THANET                               10311                   99.52%                   38.98%                     0            0       N/A      0   2084        N/A       0       0         N/A      47          0   -100.00%

                                 Total              26451                                                                  2707         2807       3.68%   7137   9745     36.54%     869   1121       28.96%   25432   33010       29.80%

Page | 14
3.4 Wildlife
The North Kent Coast, Swale and Thames Estuaries contain habitats that support a variety of
important wildlife. Due to this, various areas within and the BMPA have been designated as
statutory and non-statutory sites:
• Marine Conservation Zone (MCZ)
o Thanet Coast MCZ; and
o The Swale Estuary SAC;
• Special Areas of Conservation (SAC)
o Thanet Coast SAC;
o Tankerton Slopes and Swalecliffe SAC; and
o Margate and Long Sands SAC;
• Special Protection Areas (SPA)
o Thanet Coast and Sandwich Bay SPA;
o The Swale SPA; and
o Outer Thames Estuary SPA
• Sites of Special Scientific Interest (SSSI)
o The Swale SSSI; and
o Thanet Coast SSSI
• Ramsar Sites
o The Swale Ramsar Site;
o Thanet Coast and Sandwich Bay Ramsar Site
• National Nature Reserves (NNR)
o The Swale NNR
The majority of these designations are due to the presence of, or habitats that support,
important populations of waterbirds. The original sanitary survey reported an average total
count of 75,192 individuals within the Swale Estuary in the five winters to 2008/2009
(Callbrade et al., 2010). The average count of the five years to 2018/2019 for the same area
was 58,514 (Frost et al., 2020), a decrease of 22.18%. However, as the neighbouring Thames
and Medway estuaries also support tens of thousands of waterbirds, a significant number of
birds are expected to utilise the intertidal waters within the BMPA. Species known to utilise
the intertidal waters of the BMPA for foraging include Brent Goose, Shelduck, Widgeon,
Oystercatchers and Avocets. Wading birds such as oystercatchers forage for prey (and
defecate) directly onto the shellfish beds. The precise locations of these birds will vary from
year-to-year and is driven by the distributions of their prey. As such, the spatial distribution
of this source of contamination will be variable, but is likely to be temporally constrained to
winter months when populations are highest. The area of the BMPA at highest risk from this
form of contamination is the western end, closest to the dense bird aggregations in the
Swale Estuary, but on a fine spatial scale the precise extent of contamination will be
variable.
Page | 15Harbour porpoise, grey and harbour seals are all still known to forage within the Thames Estuary and along the North Kent Coast (ZSL, 2015). These species show wide foraging ranges, and so potentially represent a source of diffuse contamination to the shellfishery. However, as this contamination is unpredictable both spatially and temporally, it remains difficult to define RMPs to capture this source and therefore does not need to be considered in any updated sampling plan. Whilst bird populations have decreased since the original sanitary survey, the area still supports a significant population. Their unpredictable spatial distribution makes it challenging to choose RMP locations that will consistently capture this source of contamination, though highest risk areas are still likely to be at the western end of the BMPA. No other wildlife species are likely to represent a significant source of contamination and as such the recommendations for RMP location made in the original sanitary survey are still valid. 3.5 Boats and Marinas The discharge of sewage from boats is a potentially significant source of bacterial contamination of shellfisheries within the North Kent Coast BMPA. Boating activities within the area have been derived through analysis of satellite imagery and various internet sources and compared to that described in the original sanitary survey. Their geographical distributions are presented in Figure 3.5. Figure 3.5 Locations of moorings, marinas and other boating activities near the North Kent Coast BMPA. Approximately 7,000 cargo vessels visit ports in and around the Thames Estuary each year (DfT, 2018), though the main shipping channels are some distance north of the BMPA. The extent of recreational boating activity, particularly larger vessels more likely to contain on- board waste facilities, is restricted by the fact that the entire coastline dries at low tide. There are three small harbours along the coast, the largest of which is at Whitstable on the Page | 16
western side of the BMPA. There are a number of sailing clubs across the coast and it is
likely highest numbers occur during summer months, but these are unlikely to make any
overboard discharges. Consultation with the LA did not indicate any further changes to the
boating activity likely to significantly impact the water quality around the shellfish beds.
There have been no changes to the legislation governing overboard discharges from vessels,
with restrictions placed on commercial vessels against overboard discharges within three
nautical miles of land and guidance given to pleasure craft users to follow the same advice
(RYA, 2020). The closest pump-out facilities are located at the Royal Ramsgate Marina,
around the headland at the eastern end of the BMPA.
The hydrographic conditions along the North Kent coast limit the access of larger vessels
likely to make overboard discharges. As such, no significant changes to the boating activity
and the potential risk of contamination to the shellfishery have occurred. Any overboard
discharges are likely to still be minor and spatially unpredictable and, as such, do not need
to be factored into any updated sampling plan.

3.6 Other Sources of Contamination
Urban fabric within the catchment remains concentrated at the western and eastern ends of
the coastline. There are some minor towns and villages throughout the catchment, such as
Reculver, Brooksend and Calcott. Settlements near to waterbodies represent a potential
source of diffuse pollution via utility misconnections and dog fouling. The geographical
extent of urban settlements within the catchment have not increased significantly since the
original sanitary survey (despite new housing developments), and therefore the risk that
these settlements pose remains broadly similar.
The beaches along the North Kent Coastline remain a popular destination for dog walkers,
particularly those closest to the main urban settlements at the western and eastern ends of
the catchment. This remains a potential source of diffuse pollution to the near-shore coastal
zone, and so would be most likely to affect those CZs closest to the coast. There is no
evidence that their use has changed significantly.
No evidence of significant changes to these sources of contamination exists. Therefore, it
can be assumed that the RMP location recommendations made in the original sanitary
survey will still capture the influence of these sources.

4    Hydrodynamics/Water Circulation
It is unlikely that the bathymetry and hydrodynamics of the BMPA have changed
significantly since the original sanitary survey. The bathymetric chart supplied in the original
sanitary survey (Figure IV.1, p62), indicates that most of the substrate within 1 km of the
coast is very shallow,
Given that the circulation of contamination within the BMPA is considered unlikely to have
changed significantly since the original sanitary survey, no changes to the RMPs are
recommended.

5 Rainfall
Rainfall data from the Sarre Penn at Calcott weather station (NGR: TR173624) from 2006 –
2011 (pre sanitary survey data) and 2012 – 2017 (post sanitary survey data) were used to
determine whether any changes in rainfall patterns had occurred since the original sanitary
survey. Figure 5.1 shows the average daily rainfall totals for each month at the Calcott
monitoring station. Whilst rainfall has increased slightly since the publication of the original
sanitary survey, two sample t-tests indicated that there was no significant difference
between the mean daily rainfall per month (p = 0.6939) between the 2006 – 2011 and 2012
– 2017 periods. Table 5.1 summarises the rainfall at the Calcott monitoring station for the
two periods.
Rainfall leads to increased faecal loading through two factors; elevated levels of surface
runoff and spill events from intermittent discharges. However, as the rainfall patterns have
remained consistent across the two time periods, significantly increased bacterial loading
due to these factors are unlikely and as such RMP recommendations made in the original
sanitary survey to capture the influence of runoff and spill events remain valid.

Figure 5.1 Mean daily rainfall (mm) per month for the Sarre Penn at Calcott monitoring
station (NGR: TR173624) for the period (A) 2006 - 2011 (pre sanitary survey) and (B) 2012 -
2017 (post-sanitary survey).

Page | 18
Table 5.1 Summary statistics for rainfall before and after the sanitary survey.

                                                      % Days               % Days
                Mean Annual
 Period                              % Dry Days       Exceeding 10         Exceeding 20
                Rainfall (mm)
                                                      mm                   mm
 2006 - 2011    671.97               51.35            23.73                14.10

 2012 - 2017    701.10               45.07            24.59                14.74

6 Microbial Monitoring Results
6.1 Summary Statistics and geographical variation
There are a total of 12 Representative Monitoring Points that have been sampled within the
North Kent Coast BMPA since the original sanitary survey. Four of these are for Pacific
oyster (Crassostrea gigas), three are for native oyster (Ostrea edulis) and mussel (Mytilus
edulis) and two are for cockles (Cerastoderma edule). Only two of these RMPs (Btwn
Leysdown & Spaniard (B17AL) & WOCO Westbeach (B17BS)) were sampled prior to the
original sanitary survey. Sampling at the majority of the remaining RMPs began in February
2013, following the recommendations of the original sanitary survey. Sampling at the two
Tankerton RMPs (B17CL & B17CM) began in 2017 following an application to harvest native
oysters (Carcinus, 2018), though the LA indicated that harvesting at this bed was unlikely to
proceed due to planning constraints for trestles, and the CZ for which the RMPs were
chosen was never awarded a full classification. Sampling at the North Margate Sands and
Pan Sand (B17CO) RMP began in March 2020, following an application to harvest wild
cockles there (Carcinus, 2020). Sampling at the Whitsable Bay (B17CE) native oyster RMP
ceased in August 2018 and was replaced by a Pacific oyster RMP (B17CN), due to a lack of
availability of suitable native oyster stock and ease of dredging for Pacific oysters. The
geometric mean results of shellfish flesh monitoring for all RMPs sampled since the original
sanitary survey are presented in Figure 6.1. Summary Statistics are presented in Table 6.1.

All but four RMPs, for which data are available, are currently sampled. As discussed above,
the Tankerton RMPs are no longer sampled due to a lack of industry interest, planning
constraints and also related to refinement of extent of prohibited area around the WTW at
Longrock Swalecliffe; classification is unlikely to go ahead. Sampling at the South Oaze
(B17CD) RMP stopped in April 2015, due to limited access to the RMP location. The South
Oaze CZ is currently classified based on samples from the Pollard (B17CG) RMP. No
monitoring results from Tapes spp exist; the only Tapes spp. CZ, Pollard is also classified
using samples from cockles (Pollard (B17CG)).

Page | 19
Figure 6.1 Geometric mean E. coli results from Official Control monitoring at bivalve RMPs within the North Kent Coast BMPA. The three RMPs that are located farthest offshore show the lowest mean E. coli levels, with the mean values all less than the lower threshold of 230 MPN/100 g. However, relative to mean values in some other BMPAs around the country, mean values are relatively low; all RMPs have a mean of
Table 6.1 Summary statistics of E. coli (MPN/100 g) from RMPs sampled from 2003 onwards (Data cut off at November 2020).

                                                                                  E. coli MPN/100 g
                                                First            Last                                       %>       %>      %>
 Site (Species)        NGR          Species No.                               Geometric Min     Max
                                                Sample           Sample                                     230      4,600   46,000
                                                                              Mean        Value Value
 Btwn Leysdown &
                                    Native
 Spaniard (O. ed) -    TR09707410             182 17/03/2003 27/10/2020 32.96             18      500       0.55     0       0
                                    Oyster
 B17AL
 WOCO Westbeach                     Pacific
                       TR10326689             126 28/04/2010 04/11/2020 348.07            18      2,400     38.89    0       0
 (C. gi) - B17BS                    Oyster
 Hampton Pier (M.
                       TR15706805 Mussel      92   13/02/2013 04/11/2020 3628.57          20      160,000 82.61      8.70    1.09
 sp) - B17CB
 Swalecliffe (M. sp)
                       TR13496766 Mussel      92   13/02/2013 04/11/2020 3992.32          45      160,000 63.04      6.52    2.17
 - B17CC
 South Oaze -
                       TR06526513 Mussel      24   16/04/2013 08/04/2015 672.08           50      2,400     75       0       0
 B17CD
 Whitstable Bay (O.               Native
                       TR07896754             43   11/02/2013 21/08/2017 1205.14          18      35,000    39.53    2.33    0
 ed) - B17CE                      Oyster
 Off Leysdown (O.                 Native
                       TR07937295             80   11/02/2013 27/10/2020 40.68            18      330       1.25     0       0
 ed) - B17CF                      Oyster
 Pollard (C. ed) -
                       TR06996561 Cockle      93   12/02/2013 04/11/2020 1569.89          20      17,000    70.97    6.45    0
 B17CG
 Tankerton East (C.               Pacific
                       TR11486744             32   24/10/2017 08/06/2020 335.13           18      3,300     28.13    0       0
 gi) - B17CL                      Oyster
 Tankerton West (C.               Pacific
                       TR10876729             23   24/10/2017 17/09/2019 479.22           18      7,900     8.70     4.35    0
 gi) - B16CM                      Oyster
 Whitstable Bay (C.               Pacific
                       TR09156743             36   27/09/2017 27/10/2020 556.19           18      4,900     30.56    2.78    0
 gi) - B17CN                      Oyster

Page | 21
N. Margate and
Pan Sand TECFO 15
TR32937761 Cockle 13 16/03/2020 14/10/2020 135.69 18 490 15.38 0 0
(modified) (C. ed) -
B17CO
Page | 22Figure 6.2 - Figure 6.5 present boxplots of E. coli monitoring results for RMPs sampled for native oyster (Figure 6.2), Pacific oyster (Figure 6.3), mussel (Figure 6.4) and cockles (Figure 6.5). One-way analysis of variance (ANOVA) tests indicated that the mean monitoring result at Whitstable (B17CE) were significantly greater than both Off Leysdown (B17CF) and Btwn Leysdown & Spaniard (B17AL) (p < 0.01). It is also apparent that there was much greater variance in the results collected from Whitstable, even though far fewer results were collected at this RMP. No significant differences were found in any of the RMPs sampled for either Pacific oyster or mussels, although the mean result at Pollard (B17CG) was significantly greater than the result at North Margate Sand & Pan Sands (B17CO), though this is perhaps to be expected given the position of Pollard (B17CG) near to the mouth of the Swale Estuary, and North Margate Sand & Pan Sand (B17CO) approximately 6.8 km offshore. Figure 6.2 Boxplots of E. coli levels at native oyster RMPs sampled within the North Kent Coast BMPA 2003-Present. Central line indicates median value, box indicates lower – upper quartile range and whisker indicates minimum/maximum value excluding outliers (points >1.5 x interquartile range). Page | 23
Figure 6.3 Boxplots of E. coli levels at Pacific oyster RMPs sampled within the North Kent
Coast BMPA 2003-Present.

Figure 6.4 Boxplots of E. coli levels at mussel RMPs sampled within the North Kent Coast
BMPA 2003-Present.

Page | 24
Figure 6.5 Boxplots of E. coli levels at cockle RMPs sampled within the North Kent Coast
BMPA 2003-Present.

6.2 Overall temporal pattern in results
The overall temporal pattern in shellfish flesh monitoring results for native & Pacific oyster,
mussel and cockle RMPs within the North Kent Coast BMPA are shown in Figure 6.6, Figure
6.7, Figure 6.8 and Figure 6.9 respectively.
The E. coli levels recorded at Off Leysdown (B17CF) and Btwn Leysdown & Spaniard (B17AL)
have remained consistently low for the duration of sampling, with the vast majority of
results falling below the lower threshold of 230 MPN/100 g (Figure 6.6). This is likely due to
the position of both RMPs 4.5 km and 6.7 km from the nearest coastline, respectively, and is
reflected in both CZs to which they apply having Class A classifications. Monitoring results at
Whitstable Bay (B17CE) were more variable for the short period of time this RMP was
sampled, with most results falling near to the lowest threshold of 230 MPN/100 g. This RMP
was replaced by an RMP harvesting Pacific oyster (B17CN, Figure 6.7) and the CZ (Whitstable
Bay) currently holds a LT-B classification, reflecting stable results over a period of at least 5
years.
The Pacific oyster RMPs are all located in the nearshore zone, and all show broadly stable
monitoring history, with most results falling around the lower threshold of 230 MPN/100 g
and very few exceeding the higher threshold of 4,600 MPN/100 g. The CZs classified based
on samples from these RMPs all hold LT-B classifications, reflecting stable results over a
period of at least five years.

Page | 25
Whilst monitoring results at mussel RMPs have also been relatively stable (Figure 6.8), E. coli
levels have generally been higher than at oyster RMPs. Whilst it was sampled, results from
South Oaze (B17CD) showed a trend of increasing monitoring results. No clear trend at the
other two RMPs is present. This is the only species sampled within this BMPA that has
returned results above 46,000 MPN/100 g.
Monitoring results at Pollard (B17CG) have been relatively stable since monitoring began in
2017, with the loess trend line consistently falling between the lower threshold of 230
MPN/100 g and middle threshold of 4,600 MPN/100 g. Only 13 samples have been collected
at the North Margate Sand & Pan Sands (B17CO) RMP, but these early results have indicated
lower E. coli levels than at the other cockle RMP.

Figure 6.6 Timeseries of E. coli levels at native oyster RMPs sampled within the North Kent
Coast BMPA 2003 – Present. Scatter plots are overlaid with loess model fitted to data.

Page | 26
Figure 6.7 Timeseries of E. coli levels at Pacific oyster RMPs sampled within the North Kent
Coast BMPA 2010 – Present (A) and following the sampling commencing at Tankerton RMPs
(B). Scatter plots are overlaid with loess model fitted to data.

Figure 6.8 Timeseries of E. coli levels at mussel RMPs sampled within the North Kent Coast
BMPA 2013 – Present. Scatter plots are overlaid with loess model fitted to data.

Page | 27
Figure 6.9 Timeseries of E. coli levels at cockle RMPs sampled within the North Kent Coast
BMPA 2013 – Present. Scatter plots are overlaid with loess model fitted to data.

6.3 Seasonal patterns of results
The seasonal patterns of E. coli levels at the various RMPs within the North Kent Coast
BMPA were investigated and are presented in Figure 6.10 - Figure 6.13. The data for each
year were averaged into the four seasons, with Winter comprising data from January –
March, Spring from April – June, Summer from July – September and Autumn from October
– December. Two-way ANOVA testing was used to look for significant differences in the
data, using both season and RMP as independent factors (i.e. pooling the database across
RMP and season respectively), as well as the interaction between them (i.e. exploring
seasonal differences within a given RMP). Significance has been taken at the 0.05 level.
Two-way ANOVA tests did not reveal any significant differences at either Off Leysdown
(B17CF) or Btwn Leysdown & Spaniard (B17AL) by season, although at Whitstable Bay
(B17CE), results in Autumn were significantly greater than those during Winter (p = 0.0044),
Summer (p = 0.001) or Spring (p = 0.005) (Figure 6.10). When RMP data were pooled, no
significant differences by season were found.
In the case of samples from Pacific oysters (Figure 6.11), those from Whitstable Bay (B17CN)
collected during Autumn were significantly greater than those collected during summer (p =
0.043). No other significant seasonal differences were found either within a single RMP or
pooling the data across RMPs.

Page | 28
You can also read