Decarbonisation of Road Transport Network Operations in Australia and New Zealand - Issues Paper AP-C110-20
←
→
Page content transcription
If your browser does not render page correctly, please read the page content below
Issues Paper
                             AP-C110-20

Decarbonisation of Road Transport Network
   Operations in Australia and New Zealand
Decarbonisation of Road Transport Network Operations in Australia and New Zealand

Prepared by                                                                    Publisher

Richard Palmer, Cassandra de Stigter                                           Austroads Ltd.
                                                                               Level 9, 287 Elizabeth Street
                                                                               Sydney NSW 2000 Australia
Project Manager                                                                Phone: +61 2 8265 3300
                                                                               austroads@austroads.com.au
Richard Delplace
                                                                               www.austroads.com.au

Abstract                                                                       About Austroads
There is a considerable focus on vehicle electrification as the primary        Austroads is the peak organisation of Australasian road
driver of reducing greenhouse gas emissions in the roads sector.               transport and traffic agencies.
Austroads has commissioned the development of this Issues Paper                Austroads’ purpose is to support our member organisations to
to assess the specific relevance of the greenhouse gas emissions               deliver an improved Australasian road transport network. To
issue from the point of view of road transport network operations, to          succeed in this task, we undertake leading-edge road and
frame the role that road network transport operations play in                  transport research which underpins our input to policy
supporting the state and national ambitions for emissions reduction,           development and published guidance on the design,
and identify network management levers for consideration by                    construction and management of the road network and its
decision makers.                                                               associated infrastructure.
The paper has been developed to help direct the Network Task                   Austroads provides a collective approach that delivers value
Force’s knowledge sharing and future research program.                         for money, encourages shared knowledge and drives
                                                                               consistency for road users.
The paper identifies the global climate trajectories and the Paris
Agreement goal to limit temperature increase to no more than 1.5°C.            Austroads is governed by a Board consisting of senior
It explores the Australia and New Zealand policy landscape and level           executive representatives from each of its eleven member
of ambition.                                                                   organisations:
It analyses the contribution of transport and the road sector to               •    Transport for NSW
greenhouse gas emissions in Australia and New Zealand and                      •    Department of Transport Victoria
reviews opportunities for contributing to net zero emissions in the            •    Queensland Department of Transport and Main Roads
context of electric vehicle take-up.
                                                                               •    Main Roads Western Australia
The paper highlights the need for a strategic rebalancing of priorities        •    Department of Planning, Transport and Infrastructure
to include greenhouse gas emissions reduction as a key                              South Australia
consideration in all road network transport operations thinking and
                                                                               •    Department of State Growth Tasmania
decision, alongside road safety and transport network efficiency and
productivity.                                                                  •    Department of Infrastructure, Planning and Logistics
                                                                                    Northern Territory
                                                                               •    Transport Canberra and City Services Directorate,
                                                                                    Australian Capital Territory
Keywords
                                                                               •    Department of Infrastructure, Transport, Regional
Greenhouse Gas Emissions, Climate Change, Decarbonisation,                          Development and Communications
Electric Vehicles, Mobility as a Service, Road Pricing, Mode Shift,            •    Australian Local Government Association
IPCC, Paris Agreement                                                          •    New Zealand Transport Agency.

ISBN 978-1-922382-01-6
                                                                               © Austroads 2020
Austroads Publication No. AP-C11-20
                                                                               This work is copyright. Apart from any use as permitted under
Publication date May 2020                                                      the Copyright Act 1968, no part may be reproduced by any
                                                                               process without the prior written permission of Austroads
Pages 34

This report has been prepared for Austroads as part of its work to promote improved Australian and New Zealand transport outcomes by
providing expert technical input on road and road transport issues.
Individual road agencies will determine their response to this report following consideration of their legislative or administrative
arrangements, available funding, as well as local circumstances and priorities.
Austroads believes this publication to be correct at the time of printing and does not accept responsibility for any consequences arising from
the use of information herein. Readers should rely on their own skill and judgement to apply information to particular issues.
Decarbonisation of Road Transport Network Operations in Australia and New Zealand

Summary
The roads sector in Australia and New Zealand has an important role to play in supporting the transition to
net zero emissions by 2050.

A policy review of the global and national climate change ambition leads to three important conclusions:
1. There is a convincing case to limit global temperature increase to less than 1.5°C above pre-industrial
   levels.
2. There is a substantial gap between current global ambition and the emissions reduction trajectory
   required to achieve global temperature increase to less than 1.5°C above pre-industrial levels.
3. The Australian Commonwealth and New Zealand national governments have identified emissions
   reduction targets under the Paris Agreement and New Zealand and each of the states and territories in
   Australia have identified the ambition to achieve net zero emissions by 2050.

There is a considerable focus on vehicle electrification as the primary driver of emissions reduction in the
roads sector. This paper presents scenarios for vehicle electrification, and allowing for a transitioning
electricity grid, how that may impact roads sector emissions in Australia. There are two important insights to
draw from the emissions scenario analysis:
1. Accelerated support for new electric vehicle sales is insufficient on its own to bring roads sector
   emissions in line with a net zero emissions outcome in 2050.
2. Incentives to accelerate the retirement of inefficient internal combustion engine vehicles are also needed
   to transition the national fleet more in line with net zero emissions by 2050.

 This paper suggests that road transport network managers have real opportunities to affect emissions
 reduction by supporting the transition to electric vehicles, but that the vehicle transition alone is insufficient
 to be achieve net zero emissions in the sector.

Beyond the adoption of low and zero emission vehicles, the business functions of road network transport
operations (e.g. integrated transport planning, road traffic management, real-time traffic and transport
operations, road network operations planning, network performance reporting) need to contribute to
decarbonisation.

A range of levers are available to policy makers and road transport network operators to support a trajectory
to lower emissions:
1. reduction in vehicle kilometres travelled
2. improvement in the emissions efficiency of road vehicles, and
3. shift of transport tasks to other modes with lower emissions intensity.

This paper highlights network management options to give effect to these levers, many of which also have
co-benefits – road pricing, mobility as a service, travel demand management, freight network innovation and
parking controls. These go alongside a range of licensing and economics incentives in support of vehicle
electrification.

 Importantly for network managers and agency leaders with many options for emissions reduction, the
 priority must be to include greenhouse gas emissions as a strategic priority for decision-making alongside
 safety and network efficiency, as each of these aspects of future mobility is addressed in policy and
 network management.

                                                                                                 Austroads 2020 | page i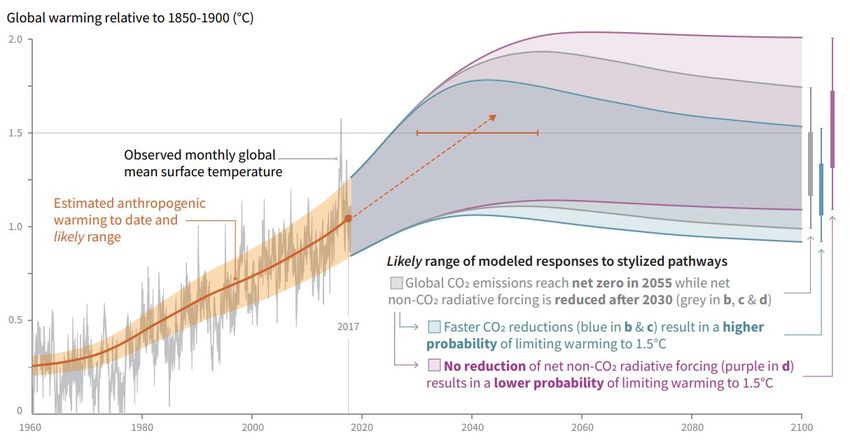
Decarbonisation of Road Transport Network Operations in Australia and New Zealand

Contents
Summary ......................................................................................................................................................... i
1.     Introduction ............................................................................................................................................ 1
       1.1 Purpose of this Report...................................................................................................................... 1
       1.2 Methodology ..................................................................................................................................... 1
       1.3 Limitations ........................................................................................................................................ 1
2.     Global Emissions Commitments and Trajectories ............................................................................. 2
       2.1 Commitments of the Paris Agreement ............................................................................................. 2
       2.2 The Case for 1.5°C........................................................................................................................... 2
       2.3 Emissions Scenarios for 1.5°C ......................................................................................................... 2
       2.4 Nationally Determined Contributions Shortfall ................................................................................. 5
       2.5 Conclusions ...................................................................................................................................... 6
3.     Australia and New Zealand Policy Review .......................................................................................... 7
       3.1 Introduction ....................................................................................................................................... 7
       3.2 New South Wales ............................................................................................................................. 8
       3.3 Victoria.............................................................................................................................................. 8
       3.4 Queensland ...................................................................................................................................... 8
       3.5 South Australia ................................................................................................................................. 9
       3.6 Australian Capital Territory ............................................................................................................... 9
       3.7 Western Australia ........................................................................................................................... 10
       3.8 Northern Territory ........................................................................................................................... 10
       3.9 Tasmania ........................................................................................................................................ 10
       3.10 Other Decarbonisation Considerations .......................................................................................... 10
       3.11 Conclusions .................................................................................................................................... 12
4.     Greenhouse Gas Emissions in Australia and New Zealand ............................................................ 13
       4.1 National Emissions ......................................................................................................................... 13
       4.2 Transport Emissions ....................................................................................................................... 14
       4.3 Road Transport Emissions ............................................................................................................. 15
       4.4 Conclusions .................................................................................................................................... 17
5.     Vehicle Electrification Emissions Considerations ........................................................................... 18
       5.1 Supporting the Electric Vehicle Transition ..................................................................................... 18
       5.2 Electric Vehicle Take-up Scenarios ............................................................................................... 18
       5.3 Electric Vehicle Greenhouse Gas Emissions ................................................................................. 21
       5.4 Road Sector Emissions Considerations ......................................................................................... 22
       5.5 Accelerating Retirement of Internal Combustion Engine Vehicles ................................................ 23
       5.6 Conclusions .................................................................................................................................... 23
6.     Levers for Decarbonisation in Road Network Transport Operations ............................................. 25
       6.1 Reducing Road Sector Emissions .................................................................................................. 25
       6.2 Network Management Priorities ..................................................................................................... 25
              6.2.1       Safety and Efficiency ......................................................................................................... 25
              6.2.2       A Third Priority ................................................................................................................... 25
       6.3 Road Pricing ................................................................................................................................... 26
       6.4 Mobility as a Service ...................................................................................................................... 26

                                                                                                                                       Austroads 2020 | page ii
Decarbonisation of Road Transport Network Operations in Australia and New Zealand

       6.5 Travel Demand Management ......................................................................................................... 27
       6.6 Freight Network Considerations ..................................................................................................... 27
       6.7 Vehicle Parking Considerations ..................................................................................................... 28
       6.8 Co-Benefits of Emissions Reduction in Transport ......................................................................... 28
7.     Conclusions.......................................................................................................................................... 30
8.     Next Steps............................................................................................................................................. 32
References ................................................................................................................................................... 33

Tables

Table 3.1:         Emissions reduction ambitions by nation and state ....................................................................... 7

Figures

Figure 2.1:        Global emissions reduction pathways to limit warming to 1.5°C ................................................... 3
Figure 2.2:        Cumulative emissions pathways to limit warming to 1.5°C ............................................................ 4
Figure 2.3:        Cumulative emissions pathways to improve the probability of limiting warming to 1.5°C ............. 4
Figure 2.4:        Nationally determined contribution shortfall compared to the 1.5°c emissions pathways ............. 6
Figure 3.1:        Members of the Network for Greening the Financial System ......................................................12
Figure 4.1:        Australian greenhouse gas emissions including and excluding LULUCF (1990-2017) ...............13
Figure 4.2:        New Zealand greenhouse gas emissions including and excluding LULUCF (1990-2016) .........14
Figure 4.3:        Australian transportation sector emissions (1990-2017) ............................................................. 14
Figure 4.4:        Transport emissions breakdown by sector (Australia, 1990-2017)..............................................15
Figure 4.5:        Breakdown of road transport emissions by vehicle type (Australia, 1990-2017) .........................16
Figure 4.6:        Projected business as usual emissions contribution of road transport by vehicle type
                   (Australia, 1990-2050) .................................................................................................................. 16
Figure 5.1:        Electric vehicle take-up scenarios for Australia (2018-2050) .......................................................18
Figure 5.2:        Electric energy source: fleet penetration over the period 2019-2030 ..........................................19
Figure 5.3:        Likelihood that a passenger car of this age is still in the fleet ......................................................20
Figure 5.4:        Likelihood that a vehicle of this age is still in the fleet.................................................................. 20
Figure 5.5:        Electric vehicles vs internal combustion engine emissions profiles in the UK, China
                   and USA ....................................................................................................................................... 21
Figure 5.6:        Passenger vehicle emissions (baseline vs current policy, Australia, 1990-2030) .......................22

                                                                                                                                      Austroads 2020 | page iii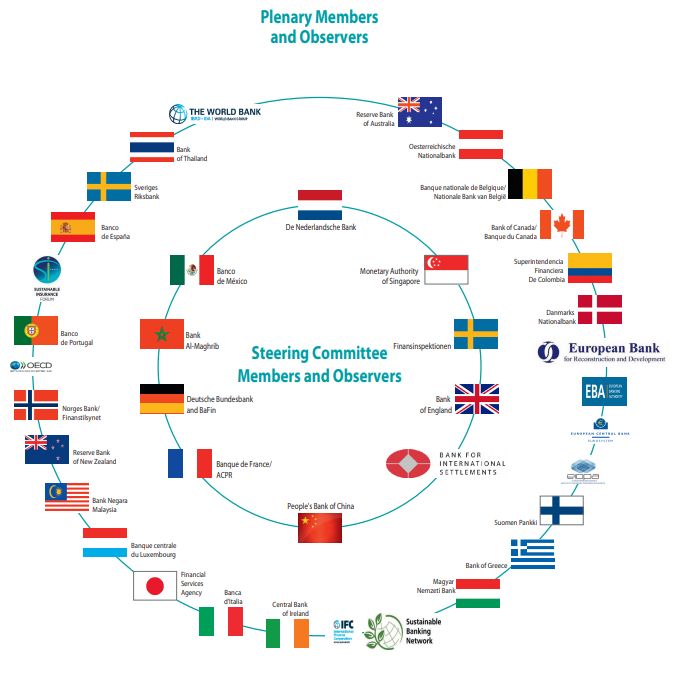
Decarbonisation of Road Transport Network Operations in Australia and New Zealand

1. Introduction

1.1     Purpose of this Report
There is a considerable focus on vehicle electrification as the primary driver of greenhouse gas emissions
reduction in the roads sector.

Austroads has commissioned the development of this Issues Paper to assess the specific relevance of the
greenhouse gas emissions issue from the point of view of the road transport network operations and to
frame the role that road network transport operations play in supporting the state and national ambitions for
emissions reduction and identify network management levers for consideration by decision makers.

This Issues Paper provides an initial problem definition with the aim to drive more targeted knowledge
sharing and research by the Network Task Force in relation to actions towards greenhouse gas emissions
reduction required alongside the expected uptake in low and zero emission vehicle.

1.2     Methodology
The key approaches within this research are to:
1. identify the Global Climate Trajectories and the Paris Agreement goal to limit temperature increase to no
   more than 1.5°C
2. explore the Australia and New Zealand policy landscape and identify our level of ambition
3. identify the role of transportation and the roads sector in driving greenhouse gas emissions in Australia
   and New Zealand
4. review decarbonisation opportunities for net zero emissions in the context of electric vehicle take-up
   scenarios
5. identify practical levers for decarbonisation in the management of the road network.

As the road transport network is a substantial contributor to greenhouse gas emissions in Australia and New
Zealand, it is important to align climate and emissions policy with the broader network management policy
and practices.

This paper considers a range of drivers, policies, technical options and risks. It is a response to a framework
of policy drivers that include the imperative to achieve global net zero emissions by 2050 and provide an
implementation pathway in the road network sector for Australia and New Zealand’s state and national
emissions reduction ambitions.

1.3     Limitations
This report is based on a high-level review of global, federal and state emissions reduction policy and
opportunities in the transportation sector.

The pathways for emissions reduction and future trajectory scenarios are necessarily simplifications and
provide insight into the likely trends rather than specific benchmarks or goals for policy makers. Further
analysis is required to support investment in any initiatives in pursuit of low-emissions outcomes in the road
network.

                                                                                               Austroads 2020 | page 1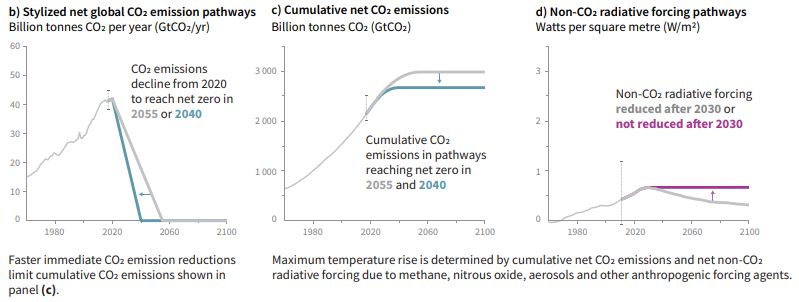
Decarbonisation of Road Transport Network Operations in Australia and New Zealand

2. Global Emissions Commitments and
   Trajectories

2.1     Commitments of the Paris Agreement
In 2015, at the United Nations (UN) Climate Change Conference, COP 21, the world’s leaders committed to
limit the global average temperature rise caused by anthropogenic climate change to less than 2°C above
pre-industrial levels in the mid 18th century, and pledged substantial efforts to achieve 1.5°C.

Each participating country committed a nationally determined contribution to support the limitation of carbon
dioxide equivalent (CO2) emissions. Australia’s commitment is a 26-28% reduction by 2030 and New
Zealand’s commitment is a 30% reduction by 2030.

2.2      The Case for 1.5°C
Further to the commitments made at COP 21, in 2018 the Intergovernmental Panel on Climate Change
(IPCC) produced a Special Report on the impacts of global warming above 1.5°C (IPCC, 2018) to inform the
Paris Agreement.

The report identifies modelled mitigation pathways consistent with limiting global warming to 1.5°C above
pre-industrial levels and assesses the quantified impact which CO2 and non-CO2 emissions have on these
pathways. The results demonstrate a higher likelihood of achieving a limitation in global average temperature
rise corresponded with more aggressive reductions in emissions over a shorter timeline and sooner rather
than later in time.

The research presented in the report shows that limiting a global average temperature increase to 1.5°C
minimises the likelihood of the most impactful consequences of climate change occurring. These include, but
are not limited to, extreme weather events such as droughts and heatwaves, exceeding a one-meter rise in
sea level by 2100, increased rainfall and hurricanes associated storm intensity, continued temperature
increase and melting of the polar ice caps.

The report concludes that there is a very strong case for implementing policy to keep global temperature rise
to no more than 1.5°C above pre-industrial levels.

2.3     Emissions Scenarios for 1.5°C
The IPPC ambition for the global climate trajectory is to limit the rise in average global surface temperature
to as close to 1.5°C as possible, aspiring to reach net zero emissions by 2050.

The International Energy Agency (IEA) in conjunction with the IPCC, produced the World Energy Outlook
(IEA 2018). This publication includes greenhouse gas emissions curve scenarios, predicted as necessary to
limit the average global temperature increase. Figure 2.1 models predicted pathways for limiting global
warming with confidence, with little or no overshoot versus high overshoot, to achieving the 1.5°C
temperature increase limit.

According to the UN’s Emissions Gap Report 2019 (UNEP 2019), the total greenhouse gas emissions in
2018 reached a record high of 55.3 GtCO2e.

                                                                                               Austroads 2020 | page 2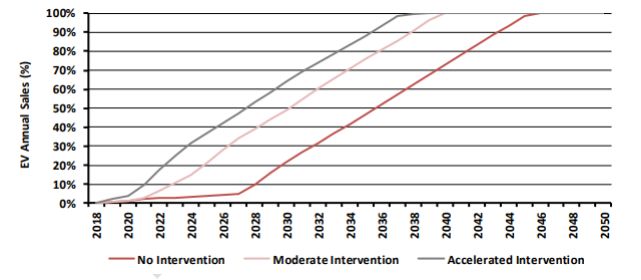
Decarbonisation of Road Transport Network Operations in Australia and New Zealand

Figure 2.1: Global emissions reduction pathways to limit warming to 1.5°C

Source: Timings of net zero for CO2 for meeting the 1.5°C limit under “no or limited overshoot” (blue) and “high
overshoot” (grey) scenarios (Figure SPM.3a: Summary for Policymakers in IPCC 2018).

The pathway to achieve a global average temperature rise of less than 1.5°C requires global emissions to be
reduced by:

 • 2030: at least 50% reduction from 2018 levels
 • 2050: 100% reduction from 2018 levels
 • 2050+: Negative emissions

Figure 2.2 below, drawn from the IPCC Special Report (IPCC 2018) which makes the case for a 1.5°C
trajectory, shows the different temperature increase pathways as predicted by reducing global CO2
emissions. The blue region represents a greater emissions reduction, corresponding to a higher probability
of limiting global warming to less than 1.5°C.

                                                                                                    Austroads 2020 | page 3
Decarbonisation of Road Transport Network Operations in Australia and New Zealand
Figure 2.2: Cumulative emissions pathways to limit warming to 1.5°C
Source: ‘Cumulative emissions of CO2 and future non-CO2 radiative forcing determine the probability of limiting warming
to 1.5°C, (Figure SPM.1: Summary for Policymakers in IPCC 2018)
The emissions reduction timelines to reach the corresponding predicted average rise in global temperature
are shown in the following figure, providing an indication of sensitivity to the rate of emissions reduction on
temperature increase. It shows how a decline in emissions over a shorter time period demonstrates a higher
likelihood of limiting the temperature increase to 1.5°C.
The pathways modelled include net zero emissions by 2040 and 2055.
Figure 2.3: Cumulative emissions pathways to improve the probability of limiting warming to 1.5°C
Source: Cumulative emissions of CO2 and future non-CO2 radiative forcing determine the probability of limiting warming
to 1.5°C (Figure SPM.1: Summary for Policymakers in IPCC 2018)
Austroads 2020 | page 4Decarbonisation of Road Transport Network Operations in Australia and New Zealand
2.4 Nationally Determined Contributions Shortfall
The global emissions requirements point to a need for deeper cuts than are currently reflected in the
nationally determined contributions.
The modelled scenarios developed for the World Energy Outlook (IEA 2018) by the IEA to achieve a 1.5-2°C
temperature increase require a 25-55% reduction in emissions globally by 2030. However, greenhouse gas
emissions have risen at a rate of 1.5% per year in the last decade and in the absence of emissions reduction
policy will likely continue to rise.
This presents a disconnect between the ambitions of the Paris Agreement and the current reality of
increasing global emissions, not only in total but in key sectors including energy, transport and agriculture.
Figure 2.4, taken from the 2019 Emissions Gap Report (UNEP 2019), shows the gap between the
unconditional nationally determined contribution scenario and the 1.5°C temperature increase to be
32 GtCO2e.
The emissions gap between the unconditional nationally determined contribution scenario and the 2°C
temperature increase is 15 GtCO2e, demonstrating that global emissions requirements point to deeper cuts
than are currently reflected in the nationally determined contributions.
Austroads 2020 | page 5Decarbonisation of Road Transport Network Operations in Australia and New Zealand
Figure 2.4: Nationally determined contribution shortfall compared to the 1.5°c emissions pathways
Source: Global greenhouse gas emissions under different scenarios and the emissions gap in 2030, (Figure ES.4 UNEP
2019)
2.5 Conclusions
The global climate negotiations under the auspices of the IPCC have described the emissions reduction
trajectories that provide the best chance of avoiding the worst impacts of climate change; a trajectory that
achieves:
• at least 50% reduction in emissions by 2030
• net zero emissions by 2050
• net negative emissions from 2050-2100.
However there remains a gap between voluntary emissions reduction commitments by individual nations
under the Paris Agreement and the trajectory to maintain temperate rise of less than 1.5°C.
This paper explores opportunities in the roads sector that align to the global emissions reduction task.
Austroads 2020 | page 6Decarbonisation of Road Transport Network Operations in Australia and New Zealand
3. Australia and New Zealand Policy Review
3.1 Introduction
The ambitions and commitments of Australia, New Zealand and the states and territories are noted below.
Table 3.1: Emissions reduction ambitions by nation and state
State/ Nation Commitment
Australia • 26-28% emissions reduction by 2030 as per nationally determined
contribution
New Zealand • 30% emission reduction from 2005 levels by 2030
• 100% renewable target by 2035
• Net zero emissions by 2050
New South Wales • Net zero emissions by 2050
Victoria • 25% renewable energy target by 2020
• 40% renewable energy target by 2025
• 15-20% emissions reduction below 2005 levels by 2020
• 30% emissions reduction from government operations from 2015 by 2020
• Net zero emissions by 2050
Queensland • 50% renewable energy target by 2030
• 30% reduction below 2005 levels by 2030
• Net zero emissions by 2050
South Australia • Achieved 20% reduction from 1990 levels
• 50% emissions reduction from 2005 levels by 2030
• Net zero emissions by 2050
Australian Capital Territory • 100% renewable energy target by 2020
• 40% emissions reduction from 1990 levels by 2020
• 50-60% emissions reduction from 1990 levels by 2025
• 65-75% emissions reduction from 1990 levels by 2030
• 90-95% emissions reduction from 1990 levels by 2040
• Net zero emissions by 2045
Western Australia • Net zero emissions by 2050
Northern Territory • 50% renewable target by 2030
• Net zero emissions by 2050
Tasmania • 100% renewable energy target by 2022
• Achieved 95% emissions reduction from 1990 levels in 2017
• Net zero emissions by 2050
Australia’s nationally determined contribution pledges a 26-28% emissions reduction by 2030 and New
Zealand’s contribution commits a 30% emissions reduction from 2005 levels by 2030. The Australian states
and territories governments have made emissions reductions targets towards net zero by 2050.
Austroads 2020 | page 7Decarbonisation of Road Transport Network Operations in Australia and New Zealand
While New Zealand’s current nationally determined contribution commits a 30% emissions reduction from
2005 levels by 2030, New Zealand has recently passed a bill to reduce carbon emissions to net zero by
2050 to better align with the motivations of the Paris Agreement and global peers such as the United
Kingdom, which passed net zero emissions legislation in June 2019. In November 2019, New Zealand
passed the Climate Change Response (Zero Carbon) Amendment Bill (NZ) (Ministry for the Environment
2019). The bill sets new greenhouse gas emissions reductions targets to align more closely with the Paris
Agreement, as follows:
• reduce all greenhouse gases (except biogenic methane) to net zero by 2050
• reduce emissions of biogenic methane within the range of 24–47 per cent below 2017 levels by 2050
including to 10 per cent below 2017 levels by 2030.
3.2 New South Wales
In 2016, New South Wales released the NSW Climate Change Policy Framework (Office of Environment and
Heritage (OEH) 2016a). This document outlines the state’s ambition and framework to meet net zero
emissions by 2050. Additionally, the OEH published the Emissions in NSW fact sheet (OEH 2016b), which
quantifies trends in greenhouse gas emissions in New South Wales by sector and includes a linear pathway
to achieving net zero emissions by 2050.
3.3 Victoria
Victoria’s Climate Change Act 2017 (Vic) sets out emissions reduction targets; with the principal target of net
zero emissions by 2050. Additionally, Victoria has identified dates to establish six interim targets – which
have not yet been defined but will be developed based on the state’s emissions reduction performance
within a predetermined period.
To support Victoria’s emissions reductions targets, the state has released its interim targets for emissions
reductions which are not currently legislated. They are as follows:
• reduce Victoria’s emissions 15 to 20 per cent below 2005 levels by 2020
• reduce emissions from Victoria’s government operations by 30 per cent below 2015 levels by 2020.
Additionally, Victoria has published Interim Emissions Reduction Targets for Victoria 2021-2030
(Independent Expert Panel on Interim Emissions Reduction Targets for Victoria2019). This document
comprehensively outlines emissions budgets, reduction opportunities and interim targets and identifies
opportunities for decarbonisation within the key sectors of electricity, land use and transport..
3.4 Queensland
Queensland has documented the ambition for emissions reductions in line with the Paris Agreement,
towards net zero emissions by 2050, although these targets are yet to be legislated. To support this
commitment, the Queensland government has made three key climate change commitments:
• powering Queensland with 50% renewable energy by 2030
• net zero emissions by 2050
• interim emissions reductions target of at least 30% below 2005 levels by 2030.
Austroads 2020 | page 8Decarbonisation of Road Transport Network Operations in Australia and New Zealand
Additionally, Queensland has released Pathways to a Clean Growth Economy – Queensland Climate
Transition Strategy (Department of Environment and Heritage Protection 2017a) and the Queensland
Climate Adaptation Strategy (Department of Environment and Heritage Protection 2017b). The strategy
presents a framework for the state’s ambitions and the trajectory planned for achieving net zero emissions
by 2050 by identifying various drivers (global, national, state-wide), pathways and interim targets. It also
identifies the need for low emission infrastructure and transport systems and the intent of developing a net-
zero transport emissions roadmap.
3.5 South Australia
South Australia passed the Climate Change and Greenhouse Emissions Reduction Act 2007 (SA). The
principal target under this act is to reduce greenhouse gas emissions by at least 60% to an amount that is
equal to or less than 40% of 1990 levels. Interim targets are provided:
• increase the proportion of renewable electricity generated so that it comprises at least 20% of electricity
generated in South Australia by 31st December 2014 – achieved
• increase the proportion of renewable electricity consumed so that it comprises at least 20% of electricity
consumed in South Australia by 31 December 2014 – achieved.
Additionally, South Australia released the Carbon Neutral Adelaide Action Plan 2016-2021 (Government of
South Australia and Adelaide City Council 2016). This document presents a framework for the state’s
ambitions and the trajectory planned for achieving net zero emissions by 2050. The pathways consider how
carbon emissions can be offset in emissions-heavy sectors such as the built environment, transport, energy
and waste.
South Australia has adopted five policy directions for a Climate Smart South Australia, a new across-agency
climate change strategy due for completion in early 2020. It will support implementation through a range of
new and expanded actions that are already in place to:
• engage business and industry to reduce emissions, manage climate risk and harness new economic
opportunities
• help grow low emissions and climate resilient jobs
• build business, community and environmental resilience
• manage climate-related risks and reduce emissions in government.
The strategy will compliment other plans which are already in place or soon to be released, including South
Australia’s Hydrogen Action Plan (Government of South Australia 2019) and Electric Vehicle Strategy.
3.6 Australian Capital Territory
In 2018, the Australian Capital Territory passed the Climate Change and Greenhouse Gas Reduction
(Principle Target) Amendment Bill 2018 (ACT). The bill brings forward the Australian Capital Territory’s net
zero emissions target date from 30 June 2050 to 30 June 2045. Additionally, it identifies additional interim
targets to set pathways towards the principal target. These interim targets are as follows:
• 50‐60% below 1990 levels by 2025
• 65‐75% below 1990 levels by 2030
• 90‐95% below 1990 levels by 2040.
Austroads 2020 | page 9Decarbonisation of Road Transport Network Operations in Australia and New Zealand
As of 1 October 2019, the Australian Capital Territory is powered 100% by renewable energy, via South
Australia’s Horndale wind farm. While the Australian Capital Territory will still run on energy generated by
coal and gas plants, for every watt of power the Australian Capital Territory consumes it generates a watt
through its renewable energy investments across Australia.
Additionally, the Australian Capital Territory has published the ACT’s Climate Strategy to a Net Zero
Emissions Territory (ACT Government 2017). This document presents a framework for the state’s ambitions
and the trajectory planned for achieving net zero emissions by 2045. It outlines key sectors and pathways for
emissions reduction within these sectors, including energy, transport, waste and land use.
3.7 Western Australia
In August 2019, Western Australia released its greenhouse gas emissions reduction aspirations to achieve
net zero emissions by 2050 (Department of Water and Environmental Regulation 2019).
3.8 Northern Territory
In October 2019, the Northern Territory Government released Northern Territory Climate Change Response
Towards 2050 (Northern Territory Government 2019) which states the ambition to achieve net zero
emissions by 2050.
While no interim emissions reductions targets have been established, there are some existing initiatives that
will assist in supporting the net zero emissions 2050 pathway:
• 50% renewable energy target by 2030
• construction of the Northern Territories first large-scale solar project, a 25 MW plant near Katherine
• successful installation 10 MW of solar energy in 25 remote communities.
3.9 Tasmania
Tasmania’s Climate Change (State Action) Act 2008 (Tas), last amended in 2017sets the emissions
reduction legislation framework for Tasmania. It identifies the state’s principal target; to reduce greenhouse
gas emissions in Tasmania to at least 60% below 1990 levels by 31 December 2050.
While Tasmania has not released any policy framework documentation, the Climate Change Office has
published the Tasmanian Greenhouse Gas Emissions Report 2019 (Tasmanian Climate Change Office
2019). This document quantifies emissions by sector, providing transparency as to where the state has
improved.
Additionally, Tasmania has committed to achieving a 100% renewable energy target by 2022 and in 2017
achieved 95% emissions reduction from 1990 levels.
3.10 Other Decarbonisation Considerations
Beyond public policy, the increasing reflection of climate change externalities in the real economy is having
an impact on both private and public sector decision-making and risk management.
Several notable interventions by regulators and business leaders are worth noting with a view to the potential
impact on transportation agencies:
Austroads 2020 | page 10Decarbonisation of Road Transport Network Operations in Australia and New Zealand
• Global financial regulators, Network for Greening the Financial System (NGFS 2019), at which the
Reserve Bank of Australia has observer status (see Figure 3.1), has forecast the role that financial
regulation may play in responding to the challenge of decarbonising the global economy and the systemic
financial risk posed by climate change.
• The Bank of England Prudential Regulation Authority (PRA) included explicit climate scenarios for their
2019 stress testing guidance for insurers, with prescribed write-downs for equity holdings in a range of
impacted sectors and regions (PRA 2019).
• In a number of speeches over 2017-2019, leaders at the Australian Prudential Regulatory Authority
(APRA) have signalled the inclusion of climate scenarios in Australian financial regulation and APRA
published an information paper in March 2019 on climate change awareness (APRA 2019).
• In March 2019 the Australian Centre for Policy Development published an update to the landmark 2016
legal opinion by Noel Huntley SC identifying how directors who do not properly manage climate risk could
be held liable for breaching their legal duty of due care and diligence (Boll 2019).
• In November 2019, Fairfax media reported on the potential inclusion of climate change progress in the
trade negotiations between Australia and the EU (.SMH 2019) to provide a foretaste of potential broader
policy impacts of progress against the Paris Agreement commitments.
These initiatives point to a growing appreciation in government and the private sector of the risks posed to
the Australian and New Zealand economies by a changing climate and the global response to climate
change. The transportation sector in Australia and New Zealand will face transitional pressure as a result of
this.
Austroads 2020 | page 11Decarbonisation of Road Transport Network Operations in Australia and New Zealand
Figure 3.1: Members of the Network for Greening the Financial System
Source: NGFS 2019.
3.11 Conclusions
Each state and territory in Australia and New Zealand at a national level has set the aspiration to achieve net
zero emissions by 2050 or sooner.
Many states supplement these aspirations with interim targets to demonstrate a pathway or trajectory
towards achieving these emissions reductions or produce policy framework documents to outline strategies
utilised.
While not all jurisdictions have detailed decarbonisation pathways and sector specific policy it is reasonable
to suppose that transportation, and roads in particular, are an important consideration in achieving these
policy ambitions.
Austroads 2020 | page 12Decarbonisation of Road Transport Network Operations in Australia and New Zealand
4. Greenhouse Gas Emissions in Australia and
New Zealand
4.1 National Emissions
Australia is an industrialised country and contributes in the order of 1% to global greenhouse gas emissions.
Australia’s greenhouse gas emissions have varied over the past 30 years, peaking in 2007 before gradually
declining until 2013 and then flattening. Emissions excluding Land Use, Land Use Change and Forestry
(LULUCF) have climbed annually since 1990.
Figure 4.1: Australian greenhouse gas emissions including and excluding LULUCF (1990-2017)
700,000
600,000
(Giga-grams CO2eq)
500,000
GHG Emissions
400,000
300,000
200,000
100,000
0
1990
1991
1992
1993
1994
1995
1996
1997
1998
1999
2000
2001
2002
2003
2004
2005
2006
2007
2008
2009
2010
2011
2012
2013
2014
2015
2016
2017
Total Total (Excl LULUCF)
Source: Data obtained from the Australian Greenhouse Emissions Information System, Department of the Environment
and Energy. Accessed 25 Oct 2019.
New Zealand emissions grew from 1990 until 2007 and have plateaued over the past decade. A notable
difference for New Zealand compared to Australia is that including LULUCF results in lower emissions and
also that emissions excluding LULUCF (i.e. the operating emissions of the economy, including
transportation) have declined since 2007.
Austroads 2020 | page 13Decarbonisation of Road Transport Network Operations in Australia and New Zealand
Figure 4.2: New Zealand greenhouse gas emissions including and excluding LULUCF (1990-2016)
90,000
80,000
70,000
(Giga-grams CO2eq)
GHG Emissions
60,000
50,000
40,000
30,000
20,000
10,000
0
1990
1991
1992
1993
1994
1995
1996
1997
1998
1999
2000
2001
2002
2003
2004
2005
2006
2007
2008
2009
2010
2011
2012
2013
2014
2015
2016
Total Total (excl LULUCF)
Source: Data obtained from the New Zealand Greenhouse Emissions Inventory, Ministry for the Environment. Accessed
10 January 2020.
4.2 Transport Emissions
Currently, the transport sector accounts for approximately 20% of Australian emissions of which road
transportation contributes the majority. In New Zealand road transportation account for over 39% of total
emissions.
The continuing increase in transport emissions and their relative contribution toward the national emissions make-
up of both Australia and New Zealand reveal a challenge in aligning transport policy and the state/national
emissions reduction ambitions. For those jurisdictions with an ambition of net zero emissions, the current
increasing emissions trajectory for the transport sector appears at odds with that ambition.
Figure 4.3: Australian transportation sector emissions (1990-2017)
120,000
100,000
(Giga-Grams CO2e)
GHG Emissions
80,000
60,000
40,000
20,000
0
1990
1991
1992
1993
1994
1995
1996
1997
1998
1999
2000
2001
2002
2003
2004
2005
2006
2007
2008
2009
2010
2011
2012
2013
2014
2015
2016
2017
Source: Data obtained from the Australian Greenhouse Emissions Information System, Department of the Environment
and Energy. Accessed 25 Oct 2019.
Austroads 2020 | page 14Decarbonisation of Road Transport Network Operations in Australia and New Zealand
4.3 Road Transport Emissions
Road transport is the dominant emissions source within the transport sector in both Australia and New
Zealand. Figure 4.4 shows the transportation emissions breakdown by sector.
Figure 4.4: Transport emissions breakdown by sector (Australia, 1990-2017)
90,000
80,000
70,000
(Giga-Grams CO2e)
60,000
GHG Emissions
50,000
40,000
30,000
20,000
10,000
0
1990
1991
1992
1993
1994
1995
1996
1997
1998
1999
2000
2001
2002
2003
2004
2005
2006
2007
2008
2009
2010
2011
2012
2013
2014
2015
2016
2017
Road Transport Domestic Aviation Railways
Domestic Navigation Other Transportation
Source: Data obtained from the Australian Greenhouse Emissions Information System, Department of the Environment
and Energy. Accessed 25 Oct 2019.
This suggests that the roads sector, dominated by vehicles with internal combustion engines, plays a
material role in contributing to greenhouse gas emissions in Australia. It also suggests that efforts to reduce
emissions across the economy consistent with a pathway to net zero emissions will require a change in
trajectory in the roads sector. Within road transportation emissions, the usage split between different vehicle
types can also provide insights for network managers seeking to reduce emissions.
Figure 4.5 indicates the contributors to road emissions, in order of emissions share are: cars, heavy duty
vehicles, light commercial vehicles and motorcycles.
Austroads 2020 | page 15Decarbonisation of Road Transport Network Operations in Australia and New Zealand
Figure 4.5: Breakdown of road transport emissions by vehicle type (Australia, 1990-2017)
50,000
45,000
40,000
(GIg-grams CO2e)
GHG Emissions
35,000
30,000
25,000
20,000
15,000
10,000
5,000
0
1990
1991
1992
1993
1994
1995
1996
1997
1998
1999
2000
2001
2002
2003
2004
2005
2006
2007
2008
2009
2010
2011
2012
2013
2014
2015
2016
2017
Cars Light Commercial Heavy Duty Motorcycles
Source: Data obtained from the Australian Greenhouse Emissions Information System, Department of the Environment
and Energy. Accessed 25 Oct 2019.
This paper has undertaken a linear emissions projection to provide a business-as-usual benchmark against
which emissions reduction scenarios can be tested.
The resulting projection of road transportation emissions forecast to 2050 is provided in the figure below.
This does not account for any electric vehicle penetration in the fleet and provides the baseline against which
to consider electric vehicle policy and other opportunities for emissions reduction through the management
of the network.
Figure 4.6: Projected business as usual emissions contribution of road transport by vehicle type (Australia,
1990-2050)
70,000
60,000
50,000
(GIg-grams CO2e)
GHG Emissions
40,000
30,000
20,000
10,000
0
1990
1992
1994
1996
1998
2000
2002
2004
2006
2008
2010
2012
2014
2016
2018
2020
2022
2024
2026
2028
2030
2032
2034
2036
2038
2040
2042
2044
2046
2048
2050
Cars Light Commercial Heavy Duty Motorcycles
Source: Integral Group Analysis of Data obtained from the Australian Greenhouse Emissions Information System,
Department of the Environment and Energy. Accessed 25 Oct 2019.
Austroads 2020 | page 16Decarbonisation of Road Transport Network Operations in Australia and New Zealand
4.4 Conclusions
The transport sector is a significant and growing source of emissions, particularly within Australia, and
transport emissions are primarily from the road network with a balance of passenger travel and freight.
Road use and the road network management are substantial contributors to emissions and a critical sector
for reform in the transition for those jurisdictions with ambitions to achieve net zero emissions.
Addressing road network levers for decarbonisation are an important consideration in efforts to achieve the
emissions reduction ambitions of the states and territories.
Roads agencies may need further policy levers for driving low carbon outcomes through network
management.
Austroads 2020 | page 17Decarbonisation of Road Transport Network Operations in Australia and New Zealand
5. Vehicle Electrification Emissions
Considerations
5.1 Supporting the Electric Vehicle Transition
The transition to electric vehicles (EVs) is an important contributor to decarbonisation of the transport sector,
and this importance is reflected in the policy direction supporting EV sales in Australia and New Zealand.
The supporting considerations and market forecasts for EVs are addressed in other Austroads reports
(Assessment of Key Road Operator Actions to Support Electric Vehicles (Austroads 2020) and Future
Vehicles 2030 (Austroads in press)).
This paper presents several factors contributing to greenhouse gas emissions reduction as a result of
electric vehicle policy and market trends in order to provide context for other emissions reduction
opportunities in networks management.
5.2 Electric Vehicle Take-up Scenarios
The two Austroads reports provide insight into the future sales and fleet penetration of EVs into the
Australian and New Zealand markets.
Assessment of Key Road Operator Actions to Support Electric Vehicles (Austroads 2020) provides several
scenarios for EV take-up in Australia and New Zealand, referencing a recent report by Energeia.
Three scenarios are presented for passenger vehicles:
• no intervention: EVs progress to 100% of new sales by 2044 (~22% by 2030)
• moderate intervention: EVs progress to 100% of new sales by 2040 (~55% by 2030)
• accelerated intervention: EVs progress to 100% of new sales by 2036 (~65% by 2030).
Figure 5.1: Electric vehicle take-up scenarios for Australia (2018-2050)
Source: Austroads 2020 and Energeia 2018
Austroads 2020 | page 18Decarbonisation of Road Transport Network Operations in Australia and New Zealand
The take-up of electric drivetrains in freight and public transit have not been addressed in Assessment of
Key Road Operator Actions to Support Electric Vehicles (Austroads 2020). This is an area that warrants
further investigation as the supporting policy environment that supports accelerated sales for different vehicle
types will vary greatly.
The EV take-up scenarios reflect new sales and the overall transformation of the fleet will lag behind new
sales as it takes time for older vehicles to be retired. A more detailed analysis of the national fleet make-up
across different vehicle types and different policy environments is recommended to provide authoritative
forecasts for emissions reduction, in concert with the grid transformation trajectory for stationary energy
generation.
Future Vehicles 2030 (Austroads in press) identifies the EV sales and fleet penetration forecasts based on
continuity of the current policy environment in Australia and New Zealand.
The sales forecasts for EV passenger vehicles are approximately 2% of new sales in 2019, increasing to
around 23% of new sales by 2030.
This provides for a fleet penetration of EV passenger vehicles of approximately 7% by 2030. Fleet transition
forecasts beyond 2030 are not currently available.
Figure 5.2: Electric energy source: fleet penetration over the period 2019-2030
100
Proportion of car and SUV fleet that are
90
80
battery eletric vehicles
70
60
50
40
30
20
10
0
2019 2020 2021 2022 2023 2024 2025 2026 2027 2028 2029 2030
Source: Austroads in press.
The fleet penetration model for different vehicle types presented in Future Vehicles 2030 (Austroads in
press) is supported by data for the likelihood that a vehicle of a certain age remains in the fleet. This model
provides an indication of how likely vehicles sold in a particular year are to remain in service into the future.
Austroads 2020 | page 19Decarbonisation of Road Transport Network Operations in Australia and New Zealand
Figure 5.3: Likelihood that a passenger car of this age is still in the fleet
25% 100%
Likelihood still in fleet
90%
Attrition within year
20% 80%
Annual attrition proportion
70%
15% 60%
Likelihood
50%
10% 40%
30%
5% 20%
10%
0% 0%
4 6 8 10 12 14 16 18 20 22 24 26 28 30 32 34 36 38 40 42 44 46 48
Years since manufacture
Source: Austroads in press
The likelihood of different vehicle types still being in service in the future has also been considered in Future
Vehicles 2030(Austroads in press), which indicates a higher likelihood that older vehicles of other types (light
rigid, heavy rigid, prime mover and bus) are more likely to be in the fleet at any one time.
This suggests that the transition of these other vehicle types to electric drive trains is unlikely to be faster
than the trajectory of change for passenger vehicles.
Figure 5.4: Likelihood that a vehicle of this age is still in the fleet
1.000
0.900
0.800
0.700
Passenger vehicle
Likelihood
0.600
Light rigid
0.500
Heavy rigid
0.400
Prime mover
0.300
Bus
0.200
0.100
0.000
4 6 8 10 12 14 16 18 20 22 24 26 28 30 32 34 36 38 40 42 44 46 48
Years since manufacture
Source: Austroads in press
Austroads 2020 | page 20Decarbonisation of Road Transport Network Operations in Australia and New Zealand
This analysis indicates several things in the electric vehicle market that will impact emissions in the roads
sector:
• Electric vehicles will continue to grow their presence in the fleet.
• The attrition rate of vehicles exiting the fleet grows rapidly at 12-14 years after manufacture and peaks
approximately 25 years after manufacture.
• The likelihood that a vehicle will remain in the fleet drops below 10% as follows:
– Passenger vehicles – 26 years
– Busses – 33 years
– Light rigid vehicles – 39 years
– Prime mover vehicles – 39 years
– Heavy rigid vehicles - >50 years.
5.3 Electric Vehicle Greenhouse Gas Emissions
Electric vehicle emissions are a factor of drive-drain efficiency and the emissions intensity of the electricity
grid. While EV drivetrains are inherently more efficient than internal combustion engine equivalents, there
remains a relatively high sensitivity to electrical grid emissions intensity from stationary generation
technology.
As shown in Figure 5.5, the projected emissions intensity of internal combustion engine and electric vehicles
in three jurisdictions was presented in An Integrated Perspective on the Future of Mobility (McKinsey&
Company and Bloomberg 2016).
Figure 5.5: Electric vehicles vs internal combustion engine emissions profiles in the UK, China and USA
Source: EV vs ICE Emissions profiles in the UK, China and USA (McKinsey& Company and Bloomberg 2016)
Austroads 2020 | page 21Decarbonisation of Road Transport Network Operations in Australia and New Zealand
The predicted emissions impact of EVs compared to internal combustion engine vehicles in Australia is not
addressed in the McKinsey & Company and Bloomberg report. However, the Australian grid transition is
likely to be closer to that of China or the USA rather than the UK, where coal has largely exited the stationary
energy generation mix in 2020.
The USA and Chinese markets show predicted EV emissions to be 50-60% of the equivalent internal
combustion engine emissions per km travelled by 2030, whereas in the UK it is closer to 75%.
This analysis identifies that electric vehicles have a material role to play in reducing emissions. However, two
important considerations will impact the rate of emissions reduction, the rate at which:
• electric vehicles grow within the fleet make-up
• the energy grid reduces its greenhouse gas emissions coefficient.
5.4 Road Sector Emissions Considerations
The analysis for this issues paper has considered how the forecast EV fleet representation to 2030 could
impact greenhouse gas emissions compared to business as usual. From 2030 to 2050, the forecast models
do not have enough certainty to make fleet penetration predictions and the fleet penetration model
assumptions cannot be extended.
Figure 5.6: Passenger vehicle emissions (baseline vs current policy, Australia, 1990-2030)
55,000
(GIg-grams CO2e)
GHG Emissions
50,000
45,000
40,000
35,000
30,000
1990
1992
1994
1996
1998
2000
2002
2004
2006
2008
2010
2012
2014
2016
2018
2020
2022
2024
2026
2028
2030
Baseline Current Policy
The emissions analysis considers a baseline trend, that represents the projection of emissions growth at
historical rates to 2050, as presented in Figure 5.6. The current policy trend is based on the projected EV
fleet penetration by 2030 and estimated energy grid emissions factor improvements to 2030.
The analysis in Figure 5.6shows that passenger vehicle emissions are projected to continue to grow above
2018 levels (an increase of 8%) to 2030, and only moderately reduce emissions compared to the business
as usual growth trajectories by 2030 (an increase of 12% compared to 2018).
The emissions reduction goals that align to the global net zero across the economy are in the order of 50%
below 2018 levels by 2030. For the roads sector to address emissions in line with this milestone, additional
initiatives in addition to the current EV policy framework will be required.
Austroads 2020 | page 22You can also read