Royal Bank of Canada Investor Presentation - RBC.com

Page created by Roy Black
 
CONTINUE READING
Royal Bank of Canada Investor Presentation - RBC.com
Royal Bank of Canada
Investor Presentation
Q1/2017

All amounts are in Canadian dollars and are based on financial statements prepared in compliance with International Accounting Standards
34 Interim Financial Reporting, unless otherwise noted. Our Q1/2017 Report to Shareholders and Supplementary Financial Information are
available on our website at rbc.com/investorrelations.

                                                                                                                                    0
Royal Bank of Canada Investor Presentation - RBC.com
Caution regarding forward-looking statements

 From time to time, we make written or oral forward-looking statements within the meaning of certain securities laws, including the “safe harbour”
 provisions of the United States Private Securities Litigation Reform Act of 1995 and any applicable Canadian securities legislation. We may make
 forward-looking statements in this RBC Investor Presentation, in filings with Canadian regulators or the United States (U.S.) Securities and Exchange
 Commission (SEC), in reports to shareholders and in other communications. Forward-looking statements in this presentation include, but are not limited
 to, statements relating to our financial performance objectives, vision and strategic goals. The forward-looking information contained in this RBC Investor
 Presentation is presented for the purpose of assisting the holders of our securities and financial analysts in understanding our financial position and
 results of operations as at and for the periods ended on the dates presented, as well as our financial performance objectives, vision and strategic goals,
 and may not be appropriate for other purposes. Forward-looking statements are typically identified by words such as “believe”, “expect”, “foresee”,
 “forecast”, “anticipate”, “intend”, “estimate”, “goal”, “plan” and “project” and similar expressions of future or conditional verbs such as “will”, “may”,
 “should”, “could” or “would”.
 By their very nature, forward-looking statements require us to make assumptions and are subject to inherent risks and uncertainties, which give rise to the
 possibility that our predictions, forecasts, projections, expectations or conclusions will not prove to be accurate, that our assumptions may not be correct
 and that our financial performance objectives, vision and strategic goals will not be achieved. We caution readers not to place undue reliance on these
 statements as a number of risk factors could cause our actual results to differ materially from the expectations expressed in such forward-looking
 statements. These factors – many of which are beyond our control and the effects of which can be difficult to predict – include: credit, market, liquidity and
 funding, insurance, operational, regulatory compliance, strategic, reputation, legal and regulatory environment, competitive and systemic risks and other
 risks discussed in the Risk management and Overview of other risks sections of our 2016 Annual Report and in the Risk management section of our Q1
 2017 Report to Shareholders, global uncertainty, the Brexit vote to have the United Kingdom leave the European Union, weak oil and gas prices, cyber
 risk, anti-money laundering, exposure to more volatile sectors, technological innovation and new Fintech entrants, increasing complexity of regulation,
 data management, litigation and administrative penalties, the business and economic conditions in the geographic regions in which we operate, the
 effects of changes in government fiscal, monetary and other policies, tax risk and transparency, and environmental risk.
 We caution that the foregoing list of risk factors is not exhaustive and other factors could also adversely affect our results. When relying on our forward-
 looking statements to make decisions with respect to us, investors and others should carefully consider the foregoing factors and other uncertainties and
 potential events. Material economic assumptions underlying the forward looking-statements contained in this RBC Investor Presentation are set out in the
 Overview and outlook section and for each business segment under the heading Outlook and priorities in our 2016 Annual Report, as updated by the
 Overview and outlook section in our Q1 2017 Report to Shareholders. Except as required by law, we do not undertake to update any forward-looking
 statement, whether written or oral, that may be made from time to time by us or on our behalf.
 Additional information about these and other factors can be found in the Risk management and Overview of other risks sections of our 2016 Annual
 Report and in the Risk management section of our Q1 2017 Report to Shareholders.
 Information contained in or otherwise accessible through the websites mentioned does not form part of this RBC Investor Presentation. All references in
 this RBC Investor Presentation to websites are inactive textual references and are for your information only.

About RBC                                                                                                                                                    1
Royal Bank of Canada Investor Presentation - RBC.com
About RBC

            2
Royal Bank of Canada Investor Presentation - RBC.com
The RBC story

                               Market leader in Canada and one of the largest financial institutions
      Market leader with a      globally(1)
      focused growth strategy  Clear strategy for continued long-term growth in Canada, the U.S. and
                                select global markets
                                                         Well-diversified across businesses, geographies and client segments
      Diversified business                               Ability to capitalize on opportunities created by changing market dynamics
      model with client                                   and economic conditions
      leading franchises                                 Wide breadth of products and capabilities allows us to meet all of our
                                                          clients’ financial needs and build deep, long-term relationships
      Financial strength     Track record of earnings and dividend growth while maintaining a
      underpinned by prudent disciplined approach to risk and cost management
      risk and cost          Credit ratings amongst the highest globally
      management             Strong capital position and a high quality liquid balance sheet
                                                         Long history of innovation and proven ability to adapt to industry trends
                                                         Investments in technology allow us to drive efficiencies and deliver an
      Innovation is in our
                                                          exceptional client experience
      DNA
                                                         Focused on simplifying, digitizing and personalizing our products to make it
                                                          easier for clients and employees to do business and lower costs
                                                         Over $100MM in donations, sponsorships and community investments in
      Leading corporate                                   2016, including the RBC Kids Pledge and RBC Blue Water Project
      citizen
                                                         Globally recognized as a financial services thought leader

About RBC                                                                                                                              3
(1) Based on market capitalization as at January 31, 2017.
Royal Bank of Canada Investor Presentation - RBC.com
Market leader with a focused strategy for growth

Largest in Canada(1)                                         Top 15 Globally                      16 Million+ Clients
A market leader across all key                               One of the 15 largest global banks   Served by over 80,000 employees
businesses                                                   by market capitalization with        worldwide
                                                             operations in 37 countries

Purpose
Help clients thrive and communities prosper

Vision
To be among the world’s most trusted and successful financial institutions
Strategic Goals

                    In Canada: To be the undisputed leader in financial services

                    In the United States: To be the preferred partner to corporate, institutional and high
                    net worth clients and their businesses

                    In Select Global Financial Centres: To be a leading financial services partner valued
                    for our expertise

About RBC                                                                                                                       4
(1) Based on market capitalization as at January 31, 2017.
Diversified business model with client leading franchises

                Earnings by Business Segment(1)                                                                     Revenue by Geography(1)
            Latest twelve months ended January 31, 2017                                                Latest twelve months ended January 31, 2017

          Investor &
           Treasury
           Services
              6%

                     Insurance
                        8%                                                                                            International
                                                                                                                           17%
                                                  Personal &
                                                  Commercial
                                                    Personal &
                                                   Banking
                                                    Commercial
              Wealth
                                                         Banking                                                 U.S.                                 Canada
            Management
                                                          50%                                                                                          61%
               15%                                                                                                U.S.                               Canada
                      Capital
                      Markets                                                                                     22%

                             Capital
                             Markets
                              21%

About RBC                                                                                                                                                                           5
(1) Amounts exclude Corporate Support. These are non-GAAP measures. For more information, refer to the Business segment results and Results by geographic segment sections of our
Q1/2017 Report to Shareholders and slide 40.
Strong financial profile

            Consistent earnings growth and solid ROE while maintaining a strong capital position with a
                                          disciplined approach to risk

  Consistent Earnings Growth                                                                                     Strong Return on Equity(2)
  Net income ($ billions)
                                                                                                                                                                                                   18.0%
                                                                                                                    19.0%           18.6%
                                      10.5
                     10.0                                                                                                                                                                                 (1)
                                                                                                                                                    16.3%                                          16.7%
      9.0
                                                                                                                                                                                    15.3%

                                                                                       3.0

                                                                                       2.8 (1)
                                                                       2.4

     2014            2015            2016                           Q1/2016         Q1/2017                          2014            2015            2016                         Q1/2016         Q1/2017

  Strong Capital Position(3)                                                                                    Strong Leverage and Liquidity Ratios(3)
                                                                                                               Leverage Ratio                                                                  4.4%

                         14.0%               14.2%               14.4%              14.7%                      Liquidity Coverage Ratio                                                        123%
      13.4%

                                             10.5%               10.8%              11.0%
       9.9%              10.3%
                                                                                                                Credit Ratings(4) Amongst the Highest Globally

                                                                                                                    Moody’s                      S&P                   DBRS                    Fitch
                                                                                                                        Aa3                       AA-                    AA                      AA

      Q1/16               Q2/16              Q3/16               Q4/16              Q1/17                            Negative                 Negative                Negative               Negative
                Total capital                Common Equity Tier 1 (CET1)

About RBC                                                                                                                                                                                                  6
(1) Excludes our share of a gain related to the sale of the U.S. operations of Moneris Solutions Corporation which was $212MM before- and after-tax. These measures are non-GAAP. For more
information see slide 40. (2) ROE does not have a standardized meaning under GAAP and may not be comparable to similar measures disclosed by other financial institutions. For more information see
slide 40. (3) Capital calculated to include all regulatory adjustments that will be required by 2019 but retaining the phase-out rules for non-qualifying capital. Refer to the Capital Management section of
our Q1/2017 Report to Shareholders for details on all ratios excluding Liquidity Coverage Ratio calculated on a “All-in” Basel III basis and Basel III requirements. (4) Based on long-term senior debt
ratings as of February 23, 2016.
Prudent risk management

                         A disciplined approach and diversification have driven stable credit trends

Loan Book Diversified by Portfolio(1)                                                             Relatively Stable PCL Ratio(2) Over the Cycle (bps)
               Credit Cards                        Small
                                                  Business                                                                 72
                   3%
                                                    1%

                                                                                                                   53
                                                                                                                                     45
                                                                                                                                                  35
                  Wholesale                                                                                33                               34
                                               Residential                                                                                                 31
                    31%                        Mortgages                                                                                                           27              29
                                                                                                                                                                          24
                                                  48%                                              23
                                                                                                                                                                                           22

                                                                                                                                                                                Historic norm:
                                                                                                                                                                                30-35 bps
                           Personal
                            Loans
                             17%                                                                   2006    2007    2008    2009     2010   2011   2012    2013   2014    2015     2016 Q1/17
                                                                                                                     Global financial crisis

Breakdown by Region of Total Loans and Acceptances(1)                                             Breakdown of Canadian Total Loans and Acceptances(1)
                                                                                                                 Atlantic
                                                                                                                    6%
       Other                   U.S.    6%                                                                 Manitoba/
   International               14%                                                                         Sask.
        6%                                                                                                  7%

                                                                                                                          Quebec
                                                                                                                           12%                           Ontario
                                                                                                                                                          43%

                                                                                                                          Alberta
                                            Canada                                                                         15%
                                             80%
                                                                                                                                       B.C. and
                                                                                                                                      Territories
                                                                                                                                         17%

About RBC                                                                                                                                                                                  7
(1) Loans and acceptances outstanding as at January 31, 2017. Does not include letters of credit or guarantees. (2) Provision for Credit Losses (PCL) ratio is PCL as a percentage of average
loans & acceptances (annualized).
History of delivering value to our shareholders

             Financial performance objectives measure our progress against our goal of maximizing
                                           total shareholder returns

 Medium-term Financial Performance Objectives
  Diluted EPS Growth                                                                                                                  7%+
  Return on Equity                                                                                                                   16%+
  Capital Ratios (CET1)                                                                                                             Strong
  Dividend Payout Ratio                                                                                                           40% - 50%

 Achieved Solid TSR(1) Performance                                                  Strong Dividend Growth(2)

                             RBC                   Peer Average
                                                                                                                                                                                $3.24
                                                                                                                                                                       $3.08
                                                                                                                                                              $2.84
  3 Year                     15%                           13%                                                                                       $2.53
                                                                                                                                            $2.28
                                                                                                        $2.00    $2.00    $2.00    $2.08
                                                                                               $1.82
  5 Year                     17%                           16%                        $1.44

  10 Year                    10%                            7%
                                                                                      2006     2007     2008     2009     2010     2011     2012     2013     2014     2015     2016

About RBC                                                                                                                                                                           8
(1) Annualized TSR is calculated based on the TSX common share price appreciation plus reinvested dividend income. Source: Bloomberg, as at January 31, 2017. RBC is compared to our
global peer group. The peer group average excludes RBC; for the list of peers, please refer to our 2016 Annual Report. (2) Dividends declared per common share. Our current quarterly
dividend is $0.83.
Business Segments

                    9
Personal & Commercial Banking
  The financial services leader in Canada                                                        Q1/17 Highlights
      #1 or #2 market share in all key product categories
                                                                                                    Clients (MM)                                                                    13.6
      Most branches and largest sales force in Canada
                                                                                                    Branches                                                                       1,342
      Superior cross-sell ability
                                                                                                    ATMs                                                                           4,829
  In 17 countries and territories in the Caribbean                                                 Active digital (Online and Mobile) users(2) (MM)                                  5.9
      2nd largest bank by assets(1) in English Caribbean                                           Employees (FTE)                                                              32,723

  Provide innovative direct banking to U.S. cross-border                                           Loans & acceptances(1) ($BN)                                                   394.6
   clients                                                                                          Deposits(1) ($BN)                                                              336.7

  Ongoing investment in digitizing our banking channels                                            AUA(3) ($BN)                                                                   245.0

 Net Income ($ millions)                                                                            Revenue by Business Line(4)
                                                                                                                                                               Business
                               5,184                                                                                                                           Financial
                 5,006                  182
  4,475                  129                                                                                                                20%                Services
                               5,002
                 4,877
   4,642

                                                                                                                                                                      Cards and
                                                                                                                                                                       Payment
                                                                                                                                                             24%      Solutions
                                                                           1,592                                        50%
                                                            1,290                  46                  Personal
                                                                     59    1,546
                                                            1,231                                      Financial
                                                                                                       Services                                         6%
   (167)                                                                                                                                                       Caribbean
                                                                                                                                                                 & U.S.
   2014          2015           2016                      Q1/2016         Q1/2017                                                                               Banking
             Canadian Banking             Caribbean & U.S. Banking

Business Segments                                                                                                                                                                      10
(1) Based on average balances. (2) This figure represents the 90-day active customers in Canadian Banking only. (3) Based on period-end spot balances. (4) For the quarter ended January
31, 2017.
Personal & Commercial Banking – Canadian Banking
Strategic Priorities                 Building A Digitally-Enabled Relationship Bank™
                   Make it easier for clients to access sales and services digitally
Transform how we
                   Create capacity and capability to focus on advice, complex servicing and sales, and problem resolution
serve our clients
                   Add value for clients through personalized offers and reward loyalty across all channels
                                  Grow commercial market share through industry-specific credit strategies
Accelerate growth                 Target high-growth retirement segment and business succession planning
in key segments                   Continue to increase client acquisitions in key segments including high net worth, newcomers and
                                   students/young adults - and build business through cross-sell
                                  Provide secure, enhanced mobile payments, investing and lending options
Rapidly deliver
                                  Create partnerships in the marketplace to innovate making it easier to bank with RBC
digital solutions
                                  Invest in research and development to understand and meet rapidly changing client expectations
Innovate to                       Accelerate investments to simplify, digitize and automate for clients and employees
become
                                  Change or eliminate products and processes that do not add economic or client value
a more agile and
efficient bank                    Invest in employees to build on digital, agile and change capabilities

 Recent Awards

                                                                                                           World’s Best Global                                  #1 bank in the
                                                             Highest in
                                                                                                      Bank for Consumer Banking(3);                      Caribbean and in Trinidad and
   Best Payment Innovation &                        Customer Satisfaction Among
                                                                                                       Best Trade Finance Bank in                             Tobago for second
   Best Use of Data Analytics(1)                     the Big Five Retail Banks(2)
                                                                                                        Canada 5 years in a row(4)                            consecutive year(5)

Business Segments                                                                                                                                                                             11
(1) Retail Banker International, 2016. (2) J.D. Power, 2016. (3) Global Finance, 2016. (4) Global Finance, 2017. (5) Based on Tier 1 capital. Tier 1 refers to the core measure of a bank’s
financial strength based on the sum of its equity capital and disclosed reserves (or retained earnings). The Banker, 2016.
Personal & Commercial Banking – Canadian Banking
 Solid Volume Growth(1)                                                                                                             Superior Cross-sell Ability
                                                                                                                                     Percent of households with transaction accounts,
                                                                                                                                     investments and borrowing products(2)

                                                                                                                                                               23%
                                                      301                                            318
                               281
        264
                                                                                                                                                                                                                     16%

        343                    359                    375                                            385

      2014                    2015                   2016                                       Q1/2017                                                        RBC                                          Peer average
                        Loans and acceptances                                  Deposits
 #1 or #2 Market Share in All Categories(3)                                                                                         Continue to Improve Our Efficiency Ratio

                                                                               Market
  Product                                                                                             Rank
                                                                               share                                                      49.9%                                                                                  Peer
  Consumer lending(4)                                                           24.0%                      1                                                        48.4%                                                      Average (8)
                                                                                                                                                                                               47.6%                     47.7%
                                                                                                                                                                                                                                    (9)
  Personal core deposits + GICs                                                 20.0%                      2                                                                                                              42.5%
                                                                                                                                          44.2%                     44.0%
  Long-Term Mutual Funds(5)                                                     14.6%                      1                                                                                   43.4%

  Business loans ($0-$25MM)(6)                                                  24.1%                      1                                                                                                             40.1%

  Business deposits(7)                                                          25.5%                      1

                                                                                                                                           2014                      2015                       2016                   Q1/2017
Business Segments                                                                                                                                                                                                                                  12
(1) Based on average balances. (2) Canadian Financial Monitor by Ipsos – 12,000 Canadian households – data based on Financial Group results for the 12-month period ending October 2016; TFSA is considered an Investment. Peers include BMO, BNS,
CIBC and TD. (3) Market share is calculated using most current data available from OSFI (M4), Investment Funds Institute of Canada (IFIC) and Canadian Bankers Association (CBA), and is at September 2016 except where noted. Market share is of total
Chartered Banks except where noted. (4) Consumer Lending market share is of 6 banks (RBC, BMO, BNS, CIBC, TD and NA). Consumer Lending comprises residential mortgages (excluding acquired portfolios), personal loans and credit cards. (5) Long-
term mutual fund market share is compared to total industry. (6) Business Loans market share is of 7 Chartered Banks (RBC, BMO, BNS, CIBC, TD, NA and CWB) on a quarterly basis and is as of June 2016. (7) Business Deposits market share excludes
Fixed Term, Government and Deposit Taking Institution balances. (8) Peers include BMO, BNS, CIBC and TD; 2014 through 2016 reflects annual results while the peer average efficiency ratio for Q1/2017 represents Q4/2016 according to the data that is
available for the peers. (9) Adjusted efficiency ratio exclude our share of a gain related to the sale of the U.S. operations of Moneris Solutions Corporation (Moneris gain on sale). This is a non-GAAP measure. For more information see slide 40.
Wealth Management
 Strategic Priorities                                                                            Recent Awards
  Extend our leadership position in Canadian retail asset                                      Top 5 Global Wealth Manager by Assets
   management and continue growing our institutional asset                                      (Scorpio, 2016)
   management business in key global markets                                                    Best Private Banking Services Overall in Canada
  Drive profitable growth in priority segments and markets,                                    (Euromoney Private Banking Survey, 2017)
   driven by a differentiated client and advisor experience that
                                                                                                Best Canadian Private Bank
   is increasingly digitally-enabled and supported by data-
                                                                                                (Family Wealth Report Awards, 2016)
   driven insights
  Continue to deepen client relationships jointly with our                                     Outstanding Global Private Bank – North America
   internal business partners                                                                   (Private Banker International Global Wealth Awards, 2016)

  Leverage the combined strengths of City National, RBC                                        Outstanding Wealth Manager – Customer Relationship
   U.S. Wealth Management and Capital Markets to                                                Service and Engagement
   accelerate growth in the U.S.                                                                (Private Banker International, 2016)

 Net Income ($ millions)                                                                         Cash Earnings ($ millions)(2)

                               1,473                                                                                           1,656
                                290                                                                                             408
                                      (1)
                              1,183                                                                                                  (1)
    1,083        1,041                                                                                                        1,248
                                                                                                    1,161        1,116

                                                                          430                                                                                          479
                                                            303                   76                                                                        352        111
                                                                      53 354(1)                                                                                     84
                                                                (1)                                                                                                    368(1)
                                                           250                                                                                             268(1)

    2014          2015          2016                     Q1 2016        Q1 2017                     2014          2015          2016                     Q1 2016       Q1 2017
                                   City National                                                                                       City National
Business Segments                                                                                                                                                                    13
(1) Financial measures excluding the impact of our acquisition of City National are non-GAAP measures. For more information see slide 40. (2) This is a non-GAAP measure. For more
information see slide 40.
Wealth Management – Global Asset Management
                                      Building a high-performing global asset management business

  Driving top-tier profitability in our largest Wealth Management business
       $389BN in client assets, generating over 42% of RBC Wealth Management earnings in Q1/2017
       Investor asset mix of 50% Retail / 50% Institutional client assets
       Top 50 global asset manager by AUM(1)

  Extending our lead in Canada
       Largest fund company in Canada with 14.8% market share(2)
       3rd largest institutional pension asset manager in Canada(3)

  Delivering strong investment capabilities to support growth
       Top performing investment firm with ~80% of AUM outperforming the benchmark on a 3-year basis(4)
       Broadened suite of investment strategies enhancing Canadian offering
       Continued growth of U.S. and international institutional clients in select U.S. and global investment capabilities

 Above Industry Average AUM Growth(5)                                                                   Diversified Asset Mix
 3-Year Organic Growth, Inclusive of FX Rate Impacts                                                    AUM by Client Segment ($ billions)(6)

                                                                                                                         17%
                                                                 24%                                                                                             Canadian Retail

                                   16%            17%                                                             11%                                            Canadian Institutional
                    15%
                                                                                                                              $389.2BN           50%
                                                                                12%
                                                                       10%                                                                                       U.S. Institutional
      8%                  7%                             8%
                                         6%                                            5%
                                                                                                                                                                 International Institutional
           0%                                                                                                          22%

    2007-2010      2008-2011 2009-2012 2010-2013 2011-2014 2012-2015

                           RBC GAM                          Industry
Business Segments                                                                                                                                                                                  14
(1) Pensions and Investments, as of December 31, 2015. (2) Investment Funds Institute of Canada (IFIC) as at December 2016. (3) Benefits Canada as at May 2016. (4) As at December 2016, gross
of fees. (5) Industry is defined as global AUM managed on behalf of third parties, based on annual figures published by the Boston Consulting Group. Growth is calculated on 3-year rolling period. AUM
of RBC GAM acquisitions is deducted in year of acquisition, and thereafter. Industry AUM is in USD. RBC GAM AUM is converted to USD using average FX rate for respective years. (6) RBC GAM,
based on period-end spot balances.
Wealth Management
                                                                Canadian Wealth Management
  Extending our #1 position                                                                                         Fee-based Assets per Advisor(3)
    Grew HNW (1) market share by ~500 bps to 20% over the last five years(2)                                                            ($ millions)
      and anticipate reaching 22% market share by 2020
  Maintaining profitable growth                                                                                                          Over 1.8x the
    Generating 26% of RBC Wealth Management earnings with strong pre-                                                                    peer average
      tax margin, highest among North American peers(4)
                                                                                                                            $81
  Driving strong advisor productivity
    Canadian leader in fee-based assets per advisor(2)
                                                                                                                                                                $44
    Consistently driving revenue per advisor of over $1.28 million per year,
      34% above Canadian industry average(2)
    Strong new asset growth complimented by favourable market conditions
    Leveraging Enterprise linkages to continue to extend market share gains                                                RBC                         Cdn Peer Average

                                               U.S. Wealth Management (including City National)
 U.S. Wealth Management
  7th largest brokerage in the U.S. as ranked by assets under administration and by number of financial advisors
  Steadily increasing advisor productivity and continuing growth of complementary distribution through successfully recruiting revenue
    producers and establishing new clearing relationships
  Improving operational efficiencies and leveraging RBC’s global capabilities to broaden our product offering
 City National
  A premier U.S. private and commercial bank that creates a platform for long-term growth in the U.S.
  Operates with a high touch, branch light client service model in selected high growth markets including Los Angeles, the San Francisco
    Bay area, Orange County, San Diego and New York
  Expanding the CNB business model to selected high growth markets; CNB is forecast to generate over US$1.0BN (pre-tax) by 2020(5)

                                                             International Wealth Management
  Focusing on key client segments, including HNW and UHNW (1) clients in select target markets where we have scale
  Enhancing our product offering, sales and relationship management process to improve client experience
  Leveraging RBC’s global capabilities (Global Asset Management and Capital Markets)
Business Segments                                                                                                                                                                  15
(1) High Net Worth (HNW) and Ultra High Net Worth (UHNW). (2) Investor Economics report on RBC’s full wealth and investment offering in Canada, December 2016. (3) Investor Economics
report, December 2016. (4) As per BCG Global Wealth Manager Benchmarking 2015. (5) Based on estimates detailed on slide 43 of our City National Investor Day presentation (June 17,
2016).
Insurance
Strategic Priorities
Improve distribution                         Delivering multi-line “insurance advice for your life” through an integrated product portfolio
efficiency                                   Strengthening profitability in all channels by increasing sales and managing expenses
                                             Providing a comprehensive suite of RBC Insurance products and services through targeted
Deepen client                                 strategies to continue to meet our clients’ unique insurance needs
relationships                                Providing a wide range of life, health, home, auto, travel and wealth accumulation solutions to
                                              individual and group clients across Canada, and offer reinsurance solutions for clients globally
Simplify. Agile.
                                             Enhancing and streamlining all processes to ensure clients find it easy to do business with us
Innovative.
Pursue select
international              Pursuing niche opportunities, diversifying risks and growing our reinsurance business to
opportunities to grow our   generate stable and diversified earnings
reinsurance business

  Net Income ($ millions)(1)                                                                             Acquisition Expense Ratio(3)
                                   900

                                   235
       781
                     706                                                                                     10.1%
                                  665 (2)
                                                                                                                                                           6.8%                   7.1%
                                                                                                                                     6.3%

                                                               131           134
      2014          2015          2016                      Q1/2016       Q1/2017                             2014                   2015                  2016                 Q1/2017
               Gain on sale of RBC General Insurance Company

Business Segments                                                                                                                                                                           16
(1) 2015 and 2016 results reflect a change in Canadian tax legislation impacting certain foreign affiliates, which became effective November 1, 2014. (2) Net income excluding an after-tax gain
of $235MM ($287MM before-tax) on the sale of RBC General Insurance Company is a non-GAAP measure. For more information see slide 40. (3) Acquisition Expense Ratio calculated as
Total Acquisition Expense/Net Premiums.
Investor & Treasury Services
  Specialist provider of asset services, custody, payments                                                                Strategic Priorities
   and treasury services for financial and other institutional
   investors worldwide                                                                            In Canada, maintain position as the #1 provider of domestic
     Rated by clients as the #1 Global Custodian for six                                         custody, asset services and cash management
      consecutive years(1)
     Named #1 Canadian Sub-custodian(2)                                                          Compete as a leading provider of asset services in the major
                                                                                                  offshore fund domicile markets of Luxembourg and Ireland
     Ranked the #1 Fund Administrator overall for four
      consecutive years(3)
                                                                                                  Continue to deliver a high-level of investment in client-
  Leading provider of Canadian dollar cash management                                            focused technology solutions
   and payment solutions to brokers, exchanges and other
   global financial institutions
                                                                                                  Enhance our client centric service offering and improve
  Short-term funding and liquidity management for RBC                                            efficiency

 Net Income ($ millions)                                                                           Efficiency Ratio

                     556            28
                                    613                28
                                                            (6)

                     528 (4)

      44131                                                                                               68%
                                                                                                                                        (4)
                                                                                                                                  65%                   64%

                                                                                                                                  64%
                                                                                    214
                                                                                                                                                                               55%
                                                                    143

     2014           2015           2016                           Q1 2016   (6)   Q1 2017                 2014                   2015                  2016                 Q1/2017
Business Segments                                                                                                                                                                        17
(1) Global Investor/ISF Global Custody Survey, 2016. (2) Global Custodian Agent Banks in Major Markets Survey, 2016. (3) R&M Fund Accounting and Administration Survey, 2016. (4)
Excludes the net impact of additional month of earnings of $42MM ($28MM after-tax) related to aligning of Investor Services reporting period to that of RBC. This is a non-GAAP measure. For
more information see slide 40.
Capital Markets
  A premier North American investment bank with select global reach
      10th largest global investment bank by fees(1)

  Full suite of integrated Corporate & Investment Banking and Global Markets services

  Strategically positioned in the largest financial centers, focused on the world’s largest and most mature capital
   markets encompassing ~75% of the global investment banking fee pool(1)

  Top talent with expertise and track record of excellence

 Net Income ($ millions)                                                              Revenue by Geography(2)
                                                                                                                                 U.K./Europe
                                                                                                                                 M&A advisory and
                                                                                      Canada                                     origination in key sectors
                                                                                      Full suite of products                     with fixed income, equity
                                                                                      and services across                        and FX sales & trading
                    2,319          2,270                                              all sectors
      2,055                                                                                                    26%         17%

                                                                                                                                         Asia Pacific &
                                                                                                                                 5%      Other
                                                                                                                                         Primarily
                                                                                                                                         distribution with
                                                                                                                                         select M&A
                                                                                       U.S.
                                                                               662                                                       advisory and
                                                                 570                   Full service
                                                                                                                                         origination
                                                                                       investment bank               52%
                                                                                       with equity and fixed
      2014           2015          2016                       Q1 2016       Q1 2017    income sales & trading

Business Segments                                                                                                                                      18
(1) Thomson Reuters, full year 2016. (2) For the quarter ended January 31, 2017.
Capital Markets
Strategic Priorities
                                                    Focus on long-term client relationships and leverage our global capabilities
Maintain our leadership
position in Canada                                  Increase focus on product and service cross-sell, and continue to improve collaborative
                                                     efforts
                                                    Build on our momentum and leverage broader relationships and client investments to
Expand and strengthen client                         expand origination, advisory, and distribution
relationships in the U.S.
                                                    Continue to strengthen client relationships to drive cross-sell
Build on core strengths and
capabilities in U.K./Europe and  Continue to grow prudently, deepen client relationships, and selectively expand geographic
optimize performance in Asia      and sector coverage
Pacific
Optimize capital use to earn                        Maintain mix between investment banking and lending revenue and trading revenue
high risk-adjusted returns on
assets and equity                                   Maintain disciplined diligence on the risks and costs of our business

 Recent Awards

 Best Investment Bank in                                                                                             #1 for Canadian Equity                 #1 for Canadian Fixed
                                       Best Bank for Markets in                   #1 for U.S. Market
         Canada                                                                                                       Research, Sales, and                Income Research, Sales,
                                           North America(1)                       Structure Team(2)
    9 years in a row(1)                                                                                                     Trading(3)                          and Trading(4)

Business Segments                                                                                                                                                             19
(1) Euromoney, 2016. (2) Institutional Investor All-America Trading Team, 2016. (3) Brendan Wood International Survey, 2016. (4) Greenwich Associates, 2016.
Capital Markets

 Diversified Global Markets Revenue(1)                                                            Solid Corporate & Investment Banking Revenue
 ($ millions)                                                                                     ($ millions)

                   4,477          4,361                                                                               3,697          3,694
   3,896                                                                                               3,437
                   1,155          1,101
    932                                                                                                               1,864          1,802
                                                                                                       1,701
                   1,435          1,147                                      1,194
   1,204                                                      1,110
                                                               307            293                                                                                                   936
                                                                                                                                                                      870
                                                               314            299                                     1,833          1,892
   1,760           1,887          2,113                                                                1,736
                                                                                                                                                                      480           411
                                                               489            602
                                                                                                                                                                      390           525
    2014           2015           2016                      Q1/2016        Q1/2017                     2014           2015            2016                        Q1/2016        Q1/2017
           FICC        Global equities         Repo and Secured financing                                           Investment Banking                     Lending and Other

 Steady Trading Securities                                                                         Geographic Diversification Across Loan Book
 ($ billions, average)                                                                             Average loans outstanding by region ($ billions)(2)

       109                                                                                                86                86
                                            105               105                                                                             81                 80                79
                           101                                                  99                        13                13
                                                                                                                                              12                 12                11

                                                                                                          46                46                42                 41                42

                                                                                                          27                27                27                 27                26

    Q1/2016           Q2/2016            Q3/2016           Q4/2016           Q1/2017                  Q1/2016     Q2/2016                Q3/2016            Q4/2016        Q1/2017
                                                                                                            Canada                    U.S.                Other International

Business Segments                                                                                                                                                                         20
(1) Global Markets segment revenue has been restated to align select portfolios previously disclosed in Repo and Secured Financing to FICC and Global Equities. (2) Average loans &
acceptances include letters of credit and guarantees for our Capital Markets portfolio on single name basis. Exclude mortgage investments, securitized mortgages and other non-core items.
Economic Backdrop

                    21
Canada’s fiscal position

  Strong rating as a result of fiscal prudence, conservative bank lending practices and solid economy
  Lowest net debt to GDP ratio among G7 peers(1)
  Canadian economy adjusting to shifting drivers of growth

                       Net Debt as % of GDP(1)                                                 Canadian GDP by Industry(2)
                                   (2016)                                                                 (November 2016)

                                                                                                                            Finance, Insurance & Real
                                                                                                                            Estate
                                                                          127.9                9%
                                                                                                                            Manufacturing
                                                                 113.8                                        20%
                                                                                         4%
                                                                                                                            Wholesale and Retail Trade
                                                       89.2                         7%
                        80.5    82.2     84.3                                                                               Scientific, Technical &
                                                                                                                            Educational Serv.
                                                                                                                            Public Administration and
                                                                                   7%
                                                                                                                     11%    Utilities
            45.4
                                                                                                                            Mining, Oil & Gas Extractions
 26.9
                                                                                    8%                                      Construction
   Canada

                         U.K.

                                 U.S.
             Germany

                                                                           Japan
                                          G7 average

                                                        France

                                                                  Italy

                                                                                                               11%          Health Care
                                                                                          9%
                                                                                                    11%                     Transportation, Warehousing

                                                                                                                            Other

Economic Backdrop                                                                                                                                       22
(1) International Monetary Fund. (2) Statistics Canada, RBC Economics Research.
Economy to post modest growth as energy headwinds subside
  The recovery in crude oil prices is expected to contribute to headline inflation gradually drifting higher,
   although is expected to remain within the Bank of Canada’s 1-3% target range through 2017

  Nationally, strengthening economic activity and expected hiring gains could drive the unemployment rate
   lower through the forecast horizon

     −     Following sizeable layoffs in 2015 and 2016 owing to the low crude oil price environment, signs of a
           recovery are expected to emerge in Alberta’s labour market with broad beneficial effects to be spread
           across industrial sectors

  As the headwinds from low oil prices subside, the economy is expected to grow at a firmer pace. An easing
   in the weight from falling business investment, ongoing consumer spending strength and fiscal stimulus are
   expected to underpin a modest pick-up in economic growth in Canada in 2017 from 2016’s lackluster pace

                   Canadian Inflation (YoY%)(1)                                                                 Canadian Labour Markets(2)

                          Headline                      BoC Target                                     Employment growth (YoY% - RHS)   Unemployment rate (% - LHS)

Economic Backdrop                                                                                                                                                     23
(1) Statistics Canada, RBC Economics Research. (2) Statistics Canada, Bureau of Labor Statistics, RBC Economics Research.
2017 Economic Outlook
                                                                                  Projected Economic Indicators for 2017(1)

                                                                                  Unemployment              Interest Rate         Current Account               Budget
                                        GDP Growth              Inflation
                                                                                     Rate (2)              (3 mth T-bills)         Balance/GDP(2)            Surplus/GDP(3)

 Canada                                      1.8%                  2.5%                  6.9%                   0.6%                    -2.6%                      -1.3%

 U.S.                                        2.3%                  2.4%                  4.7%                   1.1%                    -2.8%                      -2.9%

 Euro Area                                   1.5%                  1.7%                 10.2%                     NA                     3.4%                      -1.6%

                                     The Canadian economy is forecast to grow by 1.8% in 2017. A rise in protectionist sentiment may weigh on
                                      demand for Canadian exports; however, ongoing strength in consumer spending and a lift from fiscal
                                      stimulus are expected to support an uptick in economic growth in 2017. A drag on growth stemming from a
                                      decline in residential investment is expected to be tempered by a modest recovery in business investment
  Canada                             The Bank of Canada is expected to maintain its current policy stance as it awaits evidence that the economy
                                      is continuing to transition towards the non-resource sectors being the key drivers of growth
                                     Consumer spending is expected to remain a key source of economic growth. Housing market activity,
                                      nationally, will likely continue to be supported by still accommodative borrowing conditions, although recent
                                      policy changes and an uptick in interest rates are expected to temper the pace of resale activity

                                     Economic growth in the U.S. is expected to accelerate in 2017 from 2016’s lackluster pace as business
                                      investment recovers and fiscal stimulus supplements solid consumer spending. Net trade will likely continue
                                      to weigh on economic growth in 2017 as a strong US dollar dampens exports and import growth could be
                                      impacted by uncertainty surrounding possible tariff implementation
 U.S.
                                     The U.S. Federal Reserve is expected to monitor economic and policy developments before resuming its
                                      withdrawal of monetary policy stimulus in Q2/2017. At this time, unfolding domestic developments are likely
                                      to confirm sustained progress towards achieving the Fed’s objectives of full employment and price stability

                                     The Euro area recovery is expected to continue in 2017 driven by consumer spending and business
                                      investment, reflecting an ongoing improvement in labour markets and rising business sentiment
 Euro area                           Significant monetary stimulus by the European Central Bank is expected to persist through 2017
                                     Political risks led by the U.K’s withdrawal from the EU remain and in turn, weak trade activity is expected to
                                      result in slowing Euro area growth in 2017 relative to 2016
Economic Backdrop                                                                                                                                                               24
(1) RBC Economics Research as of February 13, 2017 and reflect forecasts for calendar 2017. (2) European Commission, RBC Economics Research. (3) FY 2017/2018 - Department of
Finance, Congressional Budget Office FY2017, European Commission (Winter 2016), RBC Economics Research.
Canadian Housing Market

                          25
Structural backdrop to the Canadian housing market
                                                              Canada(1)                                                                   U.S.(1)

                          Government influences mortgage underwriting policies                                      Agency insured only if conforming and LTV under
                           through control of insurance eligibility rules                                             80%
                          Fully insured if loan-to-value (LTV) is over 80%                                          No regulatory LTV limit – can be over 100%
                              Must meet 5-year fixed rate mortgage standards                                        Not government-backed if private insurer defaults
                              Government-backed, on homes under $1MM
                              Down-payment over 20% on non-owner occupied
 Regulation                    properties
                              CMHC announced mortgage loan insurance premiums
                               will rise by ~15% for new mortgages with LTV over 90%
                              Minimum down payment for new government-back
                               insured mortgages increased to 10% for portion of the
                               value of a home being purchased that is between
                               $500,000 – $999,000
                          Re-financing cap of 80% on non-insured

  Consumer  Mortgage interest not tax deductible                                                                    Mortgage interest is tax deductible
  Behaviour  Greater incentive to pay off mortgage                                                                  Less incentive to pay down mortgage
                          Strong underwriting discipline; extensive documentation                                   Wide range of underwriting and documentation
                                                                                                                      requirements
   Lender    Most mortgages are held on balance sheet
                                                                                                                     Most mortgages securitized
  Behaviour  Conservative lending policies have historically led to low
                             delinquency rates

                          Ability to foreclose on non-performing mortgages, with no                                 Stay period from 90 days to one year to foreclose
  Lenders                  stay periods                                                                               on non-performing mortgages
  Recourse
                          Full recourse against borrowers(2)                                                        Limited recourse against borrowers in key states

Canadian Housing Market                                                                                                                                              26
(1) Current regulation and lenders recourse. (2) Alberta and Saskatchewan have some limited restrictions on full recourse.
Legislation and policies – promoting a healthy housing market

 January 2017 – City of Vancouver
    Beginning in 2017, Vancouver has introduced a tax of 1% of the assessed value of each home which is vacant (principal
     residence is exempt)

 October 2016 – Department of Finance
    Rate used to qualify high-ratio mortgage borrowers opting for a fixed-rate mortgage with a term of five years or more is
     changed from the contract rate to the 5-year posted rate
    Effective November 30, 2016, mortgage loans that lenders insure using portfolio insurance and other discretionary low
     loan-to-value ratio mortgage insurance must meet the eligibility criteria that was previously only applied to high-ratio
     insured mortgage
    Non-residents are not eligible for the principal residence exemption on any part of a gain from the disposition of a residence

 July 2016 – OSFI & the Government of British Columbia
    OSFI issued a letter indicating it will increase scrutiny on mortgage underwriting standards and will place a greater
     emphasis on confirming internal controls and risk management practices are sound, and take into account market
     developments. It also stated it will be reviewing OSFI Guideline B-20 more broadly
    Foreign buyers registering the purchase of residential homes in Metro Vancouver, excluding treaty lands in the
     Tsawwassen First Nation, are subject to an additional property transfer tax of 15% under legislation introduced by the
     British Columbia government (announced in July 2016, effective August 2016)

 December 2015 – Department of Finance
    Minimum down payment for new government-backed insured mortgages increased from 5% to 10% for portion of the value
     of a home being purchased that is between $500,000 and $999,999 (came into effect February 2016)

Canadian Housing Market                                                                                                          27
Legislation and policies – promoting a healthy housing market

 April 2014 – CMHC
    CMHC discontinued offering mortgage insurance on 2nd homes and to self-employed individuals without 3rd party income
     validation

 July 2012 – CMHC
      Maximum amortization on government-backed insured mortgages reduced to 25 years from 30 years
      Maximum amount that can be borrowed on a mortgage refinancing lowered to 80% from 85%
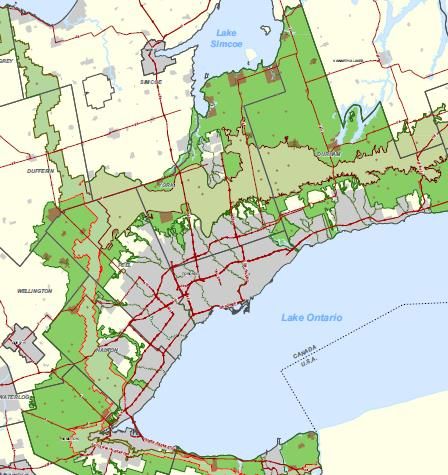
      CMHC insurance availability is limited to homes with a purchase price of
The Toronto and Vancouver downtown condo markets
  Undeveloped land around Toronto / Vancouver is limited, causing shift to centralized condo housing
      ‘Green belt’ surrounding Toronto has limited urban sprawl and increased demand for condos in the core
      Vancouver is restricted in its ability for urban sprawl due to land constraints away from the city center
  Canada has one of the highest per capita rates of permanent immigration in the world(1)
      21% of Canada’s population is foreign born (6.8 million), highest proportion among the G8 nations(1)
      63% of all new immigrants to Canada move to Toronto, Vancouver or Montreal(1)
  RBC’s exposure to condo development is limited – about 2.3% of our total commercial loan book(2)
      Condo exposure is 9.8% of our Canadian residential mortgage portfolio(2)(3)

        “Green belt” surrounding Greater Toronto area                                               Vancouver limited by mountains, sea, U.S. border

Canadian Housing Market                                                                                                                                                          29
(1) Statistics Canada, Census Program, 2011 National Household Survey. (2) As at October 31, 2016. (3) Based on $257BN in residential mortgages and HELOC in Canadian Banking.
Canadian housing market demand-supply fundamentals in balance
  Balanced demand-supply conditions continue to prevail in several markets in Canada with the exceptions being
   markets in British Columbia and those in and around the Greater Toronto region and Southwestern Ontario
  Housing affordability is being skewed at the national level by stretched conditions in Vancouver, Toronto and their
   surrounding areas. Affordability is in line with historical norms in most other markets across Canada
  Steady population growth, household income gains and low interest rates are supporting housing market activity
   nationally, although the introduction of mortgage regulation changes by the federal government is expected to
   temper the pace of home sales in most markets through the forecast horizon
  Regulatory changes at the federal level and the introduction of a foreign-buyer tax by the BC government have
   contributed to a significant slowing in home resale activity in the Vancouver area since spring 2016
  Household debt service cost ratios remain relatively stable
  Lenders maintaining strong underwriting discipline and require extensive documentation
      Most mortgages being held on balance sheet and conservative lending policies have led to low delinquency
       rates
                     Sales-to-New Listings Ratio(1)                                                          Household Debt Service Costs(2)
              (Residential unit sales to new residential listings)                                           (Mortgage & non-mortgage principal & interest
                                                                                                                       payments as a % of PDI)
   1.00
                                                                                             16
   0.90

   0.80                                               Seller's market
                                                                                             14

   0.70
                                                                                             12
   0.60

   0.50                         Balanced market                                              10

   0.40
                                                                                              8
   0.30
                                           Buyer's market
   0.20
                                                                                              6
   0.10

   0.00                                                                                       4
       1996   1998    2000   2002   2004      2006   2008   2010   2012   2014   2016          1990   1992   1994   1996   1998   2000   2002   2004   2006   2008   2010   2012   2014   2016

Canadian Housing Market                                                                                                                                                                   30
(1) Canadian Real Estate Association, RBC Economics Research. (2) Statistics Canada, RBC Economics Research. PDI: Personal Disposable Income.
Canadians have significant equity ownership in their homes
  Canadians carry a significant and stable amount of
                                                                                                                                     Equity Ownership(1)
   equity in their homes                                                                                    (Owners’ equity as a % of total value of residential real estate assets)

  The pace of residential mortgage accumulation                                                                                            Canada                        U.S.
                                                                                                       80
   slowed through 2016 and continued to trend within a
                                                                                                       75
   range well below the double-digit rates of growth                                                   70

   recorded in the mid-2000s                                                                           65

  Mortgage delinquency rates remain low in Canada                                                     60

                                                                                                       55
   and have been stable through recent credit cycles
                                                                                                       50

  RBC monitors its residential mortgage and broader                                                   45

   retail portfolios closely and performs stress tests for                                             40

   dramatic movements in house prices, GDP, interest                                                   35
                                                                                                         1990   1992   1994   1996   1998   2000   2002   2004   2006   2008   2010   2012   2014   2016

   rates and unemployment rates

   20
                   Residential Mortgage Growth(2)                                                                             Mortgage Delinquencies(3)
                                 (Year-over-year % change)                                             6         (Mortgages 90+ days in arrears as a % of total mortgages)
   18
                                                                                                                                            Canada                        U.S.
   16                                                                                                  5

   14
                                                                                                       4
   12

   10
                                                                                                       3

    8

                                                                                                       2
    6

    4
                                                                                                       1
    2

    0                                                                                                  0
     1990   1992   1994   1996   1998   2000   2002   2004   2006   2008   2010   2012   2014   2016    1990    1992   1994   1996   1998   2000   2002   2004   2006   2008   2010   2012   2014   2016

Canadian Housing Market                                                                                                                                                                               31
(1) Statistics Canada, Federal Reserve Board, RBC Economics Research. (2) Bank of Canada, RBC Economics Research. (3) Canadian Bankers Association, Mortgage Bankers Association,
RBC Economics Research.
Appendix A – Liquidity & Funding

                                   32
Strength of a high quality liquid balance sheet

                                                                                       $1,162 Billion
                                                                                    (as at January 31, 2017)

                                                       Assets                                                             Liabilities & Capital

                                           Cash and Reverse Repos                                                              Unsecured Funding
                                                                                                 137%                                                                            29%
                                                                                               coverage                                                                          Wholesale
         40% Liquid
                                                                                                                                                                                 funding
            Assets                                                                                                               Secured Funding
                                       Trading & Investment Securities

    Loan portfolio                                                                                                              Personal Deposits
   represents 45%                                                                                                                                                                57%
   of total balance                         Residential Mortgages(1)                                                                                                             Capital +
              sheet                                                                              127%
                                                                                               coverage                                                                          Retail-
         excluding                                                                                                   Business & Government Deposits                              related
   allowances and                               Other Retail Loans                                                                                                               funding
    including sold
        MBS as per                                                                                                  Securitization(1) and Covered Bonds
               IFRS                              Wholesale Loans
                                                                                                                                        Capital
Derivatives are on
    balance sheet
                                                   Other Assets(2)                                                              Other Liabilities(2)
      as per IFRS

Appendix                                                                                                                                                                                     33
(1) Securitized agency mortgaged back securities (MBS) are on balance sheet as per IFRS. (2) Other assets include $97BN of derivatives related assets, largely offset by derivatives related
liabilities in Other liabilities. Under IFRS derivative amounts with master netting agreements cannot be offset and the gross derivative assets and liabilities are reported on balance sheet.
Strong deposit growth
    Leveraging the strength of our distribution channels and successful deposit
                             initiatives to drive growth
 Gaining Canadian market share                                                                                             190                      RBC Canadian Deposits (1)
                                                                                                                                                           ($BN)
  Initiated successful strategies to grow relationship                                                                    170

                                                                                             Average Balances ($B CAD)
   deposit base                                                                                                            150
                                                                                                                                           Personal Deposits                                       4.72% CAGR
  Leveraging our Wealth Management network with                                                                           130
   targeted strategies and product development
                                                                                                                           110
  Canadian relationship deposits continue to grow
                                                                                                                            90
  Between December 2011 and November 2016,                                                                                               Business Deposits
                                                                                                                                                                  (2)
                                                                                                                                                                                              9.52% CAGR
   our share of the Canadian personal deposit                                                                               70

   market has grown from 19.4% to 19.5% (1)                                                                                 50

                                                                                                                            30
                                                                                                                                 Nov-07    Nov-08   Nov-09   Nov-10     Nov-11   Nov-12   Nov-13    Nov-14    Nov-15   Nov-16

                                                                                                                                              RBC Relationship Deposits
 Leveraging our international reach
                                                                                                                                                        ($BN)
                                                                                                                                                                                   Q1 2017                   Q1 2016
  Strong deposit growth in our International Wealth
                                                                                                                         HISA(3)                                                      $31                      $30
   Management platform
                                                                                                                         Advisory Channel Deposits(4)                                 $33                      $34

                                                                                                                         Other Personal Deposits                                     $175                     $172

                                                                                                                         Business Deposits                                           $266                     $242

                                                                                                                         Total Deposits                                              $505                     $478

Appendix                                                                                                                                                                                                                  34
(1) Sourced from Canadian deposit market share, which is based on OSFI (M4 report). The volume change in October/2016 was mainly due to a re-class of personal deposit to business
deposits. (2) Canadian Business deposits reflect Canadian Banking term deposit balances only. (3) High Interest Savings Account; Includes CAD and USD deposits. (4) Sourced largely from
RBC Wealth Management network.
Wholesale funding strategy

       Large retail deposit base complemented by well diversified wholesale funding mix

  Well diversified across products, currencies, investor segments and geographic regions

  Raise majority of funding in international markets to preserve significant domestic capacity which can be
   tapped in stressed market conditions

  Regular issuance in all major markets to promote investor engagement and secondary market liquidity

  Well balanced maturity profile that is reflective of the maturity profile of our asset base

Diversified by Geography(1)                                          Well Balanced Maturity Profile ($ billions)(1)

                                                                    30
                           Europe               Canada
                            28%                  29%
                                                                    20

                                                                    10
                                       U.S.
                                       43%
                                                                    0
                                                                         2017   2018   2019   2020   2021   2022   >2022

Appendix                                                                                                              35
(1) RBC term unsecured and covered bonds, as of January 31, 2017.
Well diversified wholesale funding platform

  Variety of programs allows for greater diversification and cost effectiveness

                      Canada                                                            U.S.                                               Europe and Asia

  Canadian Shelf                                                SEC Registered Shelf                                         European Debt Issuance
   (C$25BN)                                                       (US$40BN)                                                     Program (US$40BN)

  Securitizations                                               SEC Registered Covered Bonds                                 Covered Bond Program
   (Canadian mortgage bonds, NHA                                  (US$15BN)(2)                                                  (EUR 32BN)
   MBS(1) and credit cards)
                                                                                                                               Japanese Issuance Programs
                                                                                                                                (JPY 1 trillion)

   Well Diversified by Product(3)                                                              Recent Deals

                                                         European
                                                        Medium Term
                                                                                                 US$1.75BN 5-year unsecured at Libor+73bps
     Golden Credit                                         Note
        Cards                                               7%                                   US$1BN 2-year unsecured at Libor+45bps
          6%                                     CMB
                                                 14%
                                                                                                 £500MM 5-year covered bond at Libor+55bps

                                                                                                 C$1.25BN 7-year unsecured at Libor+82bps
                                                     Canadian
                          Covered
                                                    Deposit Note
                           Bond
                                                       19%                                       US$700MM 3-year golden credit card at Libor+50bps
                           27%

                                                                                                 C$1.75BN 5-year unsecured at Libor+68bps
                                           U.S. Medium
                                            Term Note
                                               23%
        Yankee CD &
            3a2
            4%

Appendix                                                                                                                                                                            36
(1) National Housing Act Mortgage Backed Securities. (2) Subject to the €32BN Global Covered Bond Program limit. Upon the coming into force of U.S. SEC Regulation AB II on November 23,
2016, we are not currently able to issue new series of SEC-registered covered bonds under the existing program. (3) As at January 31, 2017.
RBC Covered Bond Program

 Globally Active                                                                                  Strong Issuer

  Active program in six different currencies: EUR, CAD,                                           Largest Canadian bank by market capitalization
   USD, CHF, AUD and GBP
                                                                                                   Strong credit ratings
        C$38BN currently outstanding
                                                                                                   Well capitalized and consistent historical profitability
  Recent benchmark transactions
                                                                                                   Well diversified business mix
        £500MM 5-year

 Canadian Legislative Changes                                                                     U.S. Registration

  Canadian legislation protects claims of covered bond                                            U.S. SEC registered covered bond program(1)
   investors and overrides any other conflicting law
   related to bankruptcy and insolvency                                                                Issued US$15.5BN across seven deals since
                                                                                                        September 2012
      Extensive regulatory oversight and pool audit
       requirements                                                                                    Index eligible and Trace eligible
      Mandatory property value indexation

Appendix                                                                                                                                                                               37
(1) Upon the coming into force of U.S. SEC Regulation AB II on November 23, 2016, we are not currently able to issue new series of SEC-registered covered bonds under the existing program.
Appendix B – Oil & Gas

                         38
Exposure to the oil & gas sector within our risk appetite

         Our oil & gas portfolio benefited from an improved economic backdrop and increased capital markets activity
          underpinned by higher average oil prices

         Exposure to oil & gas sector:
             – Drawn of $6.2 billion, decreased 1% QoQ; undrawn(1) of $10.4 billion decreased 3% QoQ
                     – Drawn exposure represents 1.1% of RBC’s total drawn loans and acceptances, down from prior
                       quarters

         16% of our drawn and 57% of undrawn(1) oil & gas portfolio is to investment grade clients

          Drawn Oil & Gas Loans and Acceptances                                                            Drawn Oil & Gas Exposure by Industry
          ($ billions; % of total drawn loans and acceptances)                                             Segment and Geography

10.0
            1.6%              1.5%
 9.0                                                                                                                                                      9%
                                                1.3%                                              1.5%             23%
 8.0                                                              1.2%
              8.4                                                                   1.1%
 7.0                            8.0
                                                  7.1                                             1.0%         1%                                                   46%
 6.0                                                                                                                     $6.2BN                           $6.2BN
                                                                   6.3               6.2                                                 58%
 5.0
                                                                                                                18%                                 45%
                                                                                                  0.5%
 4.0
 3.0
 2.0                                                                                              0.0%
                                                                                                                 Exploration & Production                  Canada
 1.0
                                                                                                                 Drilling & Services
 0.0                                                                                              -0.5%
                                                                                                                                                           U.S.
                                                                                                                 Integrated
           Q1/2016           Q2/2016           Q3/2016           Q4/2016           Q1/2017                                                                 Other
                                                                                                                 Refining, Marketing & Integrated

       Appendix                                                                                                                                                           39
       (1) Undrawn commitments represent an estimate of the contractual amount that may be drawn upon at the time of default of an obligor.
Note to users
  We use a variety of financial measures to evaluate our performance. In addition to generally accepted accounting
  principles (GAAP) prescribed measures, we use certain key performance and non-GAAP measures we believe
  provide useful information to investors regarding our financial condition and result of operations. Readers are
  cautioned that key performance measures, such as ROE and non-GAAP measures such as earnings and revenue
  excluding Corporate Support, cash earnings, Q1/2017 results excluding our share of a gain related to the sale of the
  U.S. operations of Moneris Solutions Corporation (Moneris gain on sale) of $212MM (before- and after-tax), a gain
  of $235 million after-tax ($287 million before-tax) in Q3/2016 related to the sale of RBC General Insurance Company
  to Aviva Canada Inc, Wealth Management measures excluding the acquisition of City National, Investor & Treasury
  Services 2013 net income excluding a loss of $31 million after-tax ($44 million before-tax) related to the integration
  of Investor Services and 2015 net income excluding the additional month of results in Q3/2015 of $28 million after-
  tax ($42 million before-tax) related to aligning of Investor Services reporting period to that of RBC, Insurance net
  income excluding a Q4/2013 charge of $118 million after-tax ($160 million before-tax) as a result of new tax
  legislation in Canada do not have any standardized meanings prescribed by GAAP, and therefore are unlikely to be
  comparable to similar measures disclosed by other financial institutions.

  Additional information about our ROE and non-GAAP measures can be found under the “Key performance and non-
  GAAP measures” section of our Q1/2017 Report to Shareholders and 2016 Annual Report.

  Definitions can be found under the “Glossary” sections in our Q1/2017 Supplementary Financial Information and our
  2016 Annual Report.

                                              Investor Relations Contacts
                Dave Mun, SVP & Head                                                    (416) 955-7803
                Stephanie Phillips, Senior Director                                     (416) 955-7809
                Asim Imran, Senior Director                                             (416) 955-7804
                Brendon Buckler, Director                                               (416) 955-7807
                Matthew Pagano, Director                                                (416) 955-1777
                                              www.rbc.com/investorrelations
Note to users                                                                                                         40
You can also read