Royal Bank of Canada Investor Presentation - RBC.com

Page created by Nelson Moore
 
CONTINUE READING
Royal Bank of Canada Investor Presentation - RBC.com
Royal Bank of Canada
Investor Presentation
Q2/2019

All amounts are in Canadian dollars unless otherwise indicated and are based on financial statements prepared in compliance with
International Accounting Standards 34 Interim Financial Reporting, unless otherwise noted. Our Q2 2019 Report to Shareholders and
Q2 2019 Supplementary Financial Information are available on our website at rbc.com/investorrelations.

                                                                                                                                    0
Royal Bank of Canada Investor Presentation - RBC.com
Caution regarding forward-looking statements
From time to time, we make written or oral forward-looking statements within the meaning of certain securities laws, including the “safe harbour” provisions
of the United States Private Securities Litigation Reform Act of 1995 and any applicable Canadian securities legislation. We may make forward-looking
statements in this presentation, in other filings with Canadian regulators or the SEC, in reports to shareholders, and in other communications. Forward-
looking statements in this document include, but are not limited to, statements relating to our financial performance objectives, vision and strategic goals.
The forward-looking information contained in this presentation is presented for the purpose of assisting the holders of our securities and financial analysts in
understanding our financial position and results of operations as at and for the periods ended on the dates presented, as well as our financial performance
objectives, vision and strategic goals, and may not be appropriate for other purposes. Forward-looking statements are typically identified by words such as
“believe”, “expect”, “foresee”, “forecast”, “anticipate”, “intend”, “estimate”, “goal”, “plan” and “project” and similar expressions of future or conditional verbs
such as “will”, “may”, “should”, “could” or “would”.
By their very nature, forward-looking statements require us to make assumptions and are subject to inherent risks and uncertainties, which give rise to the
possibility that our predictions, forecasts, projections, expectations or conclusions will not prove to be accurate, that our assumptions may not be correct
and that our financial performance objectives, vision and strategic goals will not be achieved. We caution readers not to place undue reliance on these
statements as a number of risk factors could cause our actual results to differ materially from the expectations expressed in such forward-looking
statements. These factors – many of which are beyond our control and the effects of which can be difficult to predict – include: credit, market, liquidity and
funding, insurance, operational, regulatory compliance, strategic, reputation, legal and regulatory environment, competitive and systemic risks and other
risks discussed in the risk sections of our 2018 Annual Report and the Risk management section of our Q2 2019 Report to Shareholder; including global
uncertainty, Canadian housing and household indebtedness, information technology and cyber risk, regulatory changes, digital disruption and innovation,
data and third party related risks, climate change, the business and economic conditions in the geographic regions in which we operate, the effects of
changes in government fiscal, monetary and other policies, tax risk and transparency and environmental and social risk.
We caution that the foregoing list of risk factors is not exhaustive and other factors could also adversely affect our results. When relying on our forward-
looking statements to make decisions with respect to us, investors and others should carefully consider the foregoing factors and other uncertainties and
potential events. Material economic assumptions underlying the forward looking-statements contained in this presentation are set out in the Economic,
market and regulatory review and outlook section and for each business segment under the Strategic priorities and Outlook headings in our 2018 Annual
Report, as updated by the Economic, market and regulatory review and outlook section of our Q2 2019 Report to Shareholders. Except as required by law,
we do not undertake to update any forward-looking statement, whether written or oral, that may be made from time to time by us or on our behalf.
Additional information about these and other factors can be found in the risk sections of our 2018 Annual Report and the Risk management section of our
Q2 2019 Report to Shareholders.
Information contained in or otherwise accessible through the websites mentioned does not form part of this presentation. All references in this presentation
to websites are inactive textual references and are for your information only.

About RBC                                                                                                                                                       1
Royal Bank of Canada Investor Presentation - RBC.com
About RBC

            2
The RBC story
       Diversified                        Well-diversified across businesses, geographies and client segments
       business model                     Able to capitalize on opportunities created by changing market dynamics and economic conditions
       with leading client                Wide breadth of products and capabilities to meet our clients’ financial needs and build deep, long-
       franchises                          term relationships

       Market leader with                 Market leader in Canada and one of the largest financial institutions globally(1)
       a focused growth
                                          Clear strategy for continued long-term growth in Canada, the U.S. and select global markets
       strategy

       Financial strength                 Track record of earnings and dividend growth while maintaining a disciplined approach to risk and
       underpinned by                      cost management
       prudent risk and                   Credit ratings amongst the highest globally
       cost management                    Strong capital position and a high quality liquid balance sheet

                                          Long history of innovation and proven ability to adapt to industry trends
       Innovation is in                   Investments in technology allow us to drive efficiencies and deliver an exceptional client experience
       our DNA                            Focused on simplifying, digitizing and personalizing our products to make it easier for clients and
                                           employees to do business and lower costs

                          Announced our commitment to $100 billion in sustainable finance by 2025
                          Issued our first €500 million 5-year green bond offering and RBC CM hosted our 6th annual Green
                           Bond Conference
                          RBC and iShares expanded its ETF offering with launch of the iShares Sustainable Core ETFs
       Leading Corporate  Released our 2018 ESG Performance Report and Public Accountability Statement: the report
                                                     (2)

                           highlights RBC's commitment to ESG priorities as well as its purpose-driven, principles-led
       Citizen
                           approach to delivering leading performance
                          Through RBC Future Launch, we supported the launch of the YouthfulCities Urban Work Index: to
                           help young people prepare for the future of work
                          Hosted the “Transition Day of Learning” that saw 95 investors and ESG influencers come together
                           to discuss the low-carbon transition and the role investors can play to enable it

About RBC                                                                                                                                    3
(1) Based on market capitalization as of April 30, 2019. (2) Environmental, Social and Governance.
Market leader with a focused strategy for growth

Largest in Canada(1)                                       Top 15 Globally(1)                   16 Million+ Clients
A market leader across all key                             One of the 15 largest global banks   Served by 84,000+ employees
businesses                                                 by market capitalization with        worldwide
                                                           operations in 36 countries

 Purpose
 Help clients thrive and communities prosper

 Vision
 To be among the world’s most trusted and successful financial institutions
 Strategic Goals

                     In Canada: To be the undisputed leader in financial services

                     In the United States: To be the preferred partner to corporate, institutional and high
                     net worth clients and their businesses

                     In Select Global Financial Centres: To be a leading financial services partner
                     valued for our expertise

About RBC                                                                                                                     4
(1) Based on market capitalization as at April 30, 2019.
Diversified business model with client leading franchises

                Earnings by Business Segment(1)                                                                     Revenue by Geography(1)
             Latest twelve months ended April 30, 2019                                                    Latest twelve months ended April 30, 2019

                Investor &
                 Treasury
                 Services
                    5%

                        Insurance
                                                                                                                  International
                           6%
                                                                                                                       15%

                                                  Personal &
              Wealth                              Commercial
            Management                             Banking
               18%                                       Personal &
                                                         Commercial                                              U.S.
                                                          Banking                                                                                    Canada
                       Capital                              49%
                                                                                                       U.S.
                       Markets                                                                         23%
                                                                                                                                                               Canada
                                                                                                                                                                62%

                          Capital
                          Markets
                           22%

About RBC                                                                                                                                                               5
(1) Amounts exclude Corporate Support. These are non-GAAP measures. For more information, refer to Results by business segment section of our 2018 Annual Report.
Strong financial profile
          Consistent earnings growth and solid ROE while maintaining a strong capital position with a
                                        disciplined approach to risk

  Consistent Earnings Growth                                                                            Strong Return on Equity(1)
   Net income ($ billions)
                                   12.4
                    11.5
     10.5                                                                                                                               17.6%                        17.7%
                                                                                                                          17.0%                                                     17.1%
                                                                                                           16.3%

                                                                  6.1            6.4

     2016           2017           2018                       YTD 2018       YTD 2019                       2016          2017           2018                      YTD 2018       YTD 2019

  Strong Capital Position                                                                              Strong Leverage and Liquidity Ratios

                                                                              14.8%                    Leverage Ratio                                                           4.3%
      14.1%             14.1%             14.6%             14.5%
                                                                                                       Liquidity Coverage Ratio                                                 127%
                                          11.5%             11.4%             11.8%
      10.9%             11.1%
                                                                                                       Credit Ratings Amongst the Highest Globally
                                                                                                                                  Moody’s            S&P           DBRS            Fitch
                                                                                                       Legacy senior
                                                                                                                                      Aa2            AA-             AA              AA
                                                                                                       long-term debt(2)
                                                                                                       Senior long-term
      Q2/18             Q3/18             Q4/18             Q1/19             Q2/19                                                   A2               A         AA (low)            AA
                                                                                                       debt(3)
                 Total Capital             Common Equity Tier 1 (CET1)                                 Outlook                      Stable          Stable        Positive         Stable

About RBC                                                                                                                                                                                    6
(1) Return on Equity (ROE). This measure does not have a standardized meaning under GAAP. For further information, refer to the Key performance and non-GAAP measures section of Q2
2019 Report to Shareholders. (2) Includes senior long-term debt issued prior to September 23, 2018 and senior long-term debt issued on or after September 23, 2018 which is excluded from the
Canadian Bank Recapitalization (Bail-in) regime (ratings as of May 22, 2019). (3) Includes senior long-term debt issued on or after September 23, 2018 which is subject to conversion under the
Bail-in regime (ratings as of May 22, 2019).
Prudent risk management

                          A disciplined approach and diversification have driven stable credit trends

Loan Book Diversified by Portfolio(1)                                                                PCL Ratio on Impaired Loans(2) (bps)
                Credit Cards                         Small
                    3%                              Business                                           45
                                                      1%
                                                                                                       40                                                                    Historic Range:
                                                                                                                                                                             30-35 bps
                                                                                                       35

                                                                                                       30                                                                                      29
                                                                                                                                                                                  28
                  Wholesale                     Residential                                            25              23       23                 23     22
                                                Mortgages                                                     22
                    34%                                                                                                                                                    20
                                                   47%                                                 20                               17                         17
                                                                                                              PCL ratio on
                                                                                                       15     impaired loans

                               Personal                                                                10
                                                                                                            Q1/2017 Q2/2017 Q3/2017 Q4/2017 Q1/2018 Q2/2018 Q3/2018 Q4/2018 Q1/2019 Q2/2019
                                Loans
                                 15%

Breakdown by Region of Total Loans and Acceptances(1)                                               Breakdown of Canadian Total Loans and Acceptances(1)
                                                                                                                                                        Atlantic
                 U.S.                                                                                              Manitoba/                              5%
                 13%                    6%                                                                          Sask.
    Other                                                                                                            6%
International
     4%                                                                                                                        Quebec
                                                                                                                                12%
                                                                                                                                                           Ontario
                                                                                                                                                            47%
                                                                                                                            Alberta
                                           Canada                                                                            14%
                                            83%
                                                                                                                                      B.C. and
                                                                                                                                     Territories
                                                                                                                                        16%

About RBC                                                                                                                                                                                      7
(1) Loans and acceptances outstanding as at April 30, 2019. Does not include letters of credit or guarantees. (2) Effective November 1, 2017, we adopted IFRS 9, which introduced a three-
stage expected credit loss impairment model that differs significantly from the incurred loss model under IAS 39. Stage 3 allowances are held against impaired loans and effectively replace the
allowance for impaired loans under IAS 39. Provision for Credit Losses (PCL) ratio is PCL as a percentage of average loans & acceptances (annualized).
History of delivering value to our shareholders
              Financial performance objectives measure our progress against our goal of maximizing
                                            total shareholder returns

 Medium-Term Financial Performance Objectives
   Diluted EPS Growth                                                                                                                  7%+
   Return on Equity                                                                                                                   16%+
   Capital Ratios (CET1)                                                                                                              Strong
   Dividend Payout Ratio                                                                                                           40% - 50%

 Achieved Solid TSR(1) Performance                                                   Strong Dividend Growth(2)

                              RBC                   Peer Average
                                                                                                                                                                                  $3.77
                                                                                                                                                                         $3.48
                                                                                                                                                                $3.24
                                                                                                                                                       $3.08
  3 Year                      15%                           11%                                                                               $2.84
                                                                                                                                     $2.53
                                                                                                                           $2.28
                                                                                       $2.00    $2.00    $2.00    $2.08
  5 Year                      12%                            8%

  10 Year                     14%                           13%
                                                                                       2008     2009     2010     2011      2012     2013     2014     2015     2016     2017     2018

About RBC                                                                                                                                                                               8
(1) Annualized TSR is calculated based on the TSX common share price appreciation plus reinvested dividend income. Source: Bloomberg, as at April 30th, 2019. RBC is compared to our
global peer group. The peer group average excludes RBC; for the list of peers, please refer to our 2018 Annual Report. (2) Dividends declared per common share. Our current quarterly
dividend is $1.02.
Business Segments

                    9
Personal & Commercial Banking
   The financial services leader in Canada                                                          Q2/2019 Highlights
       #1 or #2 market share in all key product categories
                                                                                                      Clients (MM)                                                              14.0+
       Most branches and one of the largest mobile sales
                                                                                                      Branches                                                                  1,264
        networks across Canada
                                                                                                      ATMs                                                                      4,496
       Superior cross-sell ability
                                                                                                      Active Digital (Online and Mobile) Users(2) (MM)                            7.0
   In 16 countries and territories in the Caribbean
                                                                                                      Employees (FTE)                                                         35,000+
       2nd largest bank by assets(1) in English Caribbean
                                                                                                      Net Loans & Acceptances(1) ($BN)                                          441.9
   Innovative direct banking to U.S. cross-border clients                                            Deposits(1) ($BN)                                                         389.0

   Ongoing investment to digitize our banking channels                                               AUA(1) ($BN)                                                              277.9

  Net Income ($ millions)                                                                              Revenue by Business Line(3)
                                 6,028
                  5,755                                                                                       Canadian
                                          168
    5,184                 184                                                                                 Banking
            182                  5,860                                                                          95%
                  5,571
   5,002
                                                                                                                        Personal
                                                                                                                        Banking
                                                                                                                          72%                                 Business
                                                              2,980        3,120
                                                                      74            116                                                                       Banking
                                                                                                                                                                23%
                                                                            3,004

                                                              2,906

                                                                                                                                                                  Caribbean
                                                                                                                                                                    & U.S.
                                                                                                                                                                   Banking
    2016         2017      2018                        YTD 2018 YTD 2019
                                                                                                                                                                     5%
              Canadian Banking              Caribbean & U.S. Banking
Business Segments                                                                                                                                                                 10
(1) Based on average balances. (2) This figure represents the 90-day active customers in Canadian Banking only. (3) For the quarter ended April 30th, 2019.
Personal & Commercial Banking – Canadian Banking
Strategic Priorities               Building A Digitally-Enabled Relationship Bank™
                   Make it easier for clients to access products and services digitally
Transform How We
                   Create capacity and capability to focus on advice, complex servicing and sales, and problem resolution
Serve Our Clients
                   Focus on innovating our branch network

                                 Grow commercial market share through industry-specific credit strategies
Accelerate Client                Target high-growth retirement segment and business succession planning
Growth                           Continue to increase client acquisitions including key segments: high net worth, newcomers and
                                  students and young adults while deepening existing client relationships

                                 Continue to deliver leading digital capabilities and functionality through our award-winning mobile app
Rapidly Deliver
                                 Create partnerships to innovate, making it easier to bank with RBC
Digital Solutions
                                 Invest in research and development to understand and meet rapidly changing client expectations

Innovate to                      Accelerate investments to simplify, digitize and automate for clients and employees
Become
                                 Change or eliminate products and processes that do not add economic or client value
a More Agile and
Efficient Bank                   Invest in employees to enhance digital, agile and change capabilities

 Recent Awards

 North American Retail Bank of                         Highest in Customer                       Celent Model Bank 2019 Award            Financial Institution of the
      the year for the 2nd                          Satisfaction Among Mobile                     for API Strategy and in 2018,         Year for the 2nd consecutive
  consecutive year and Best                          Banking Apps for the 2nd                        RBC won the Personal                  year by Digital Finance
     Loyalty and Rewards                                consecutive year(2)                         Financial Experience and                      Institute(4)
          Strategy(1)                                                                                Employee Productivity
                                                                                                          categories(3)

Business Segments                                                                                                                                                  11
(1) Retail Banker International, 2019. (2) J.D. Power, 2018. (3) Celent Model Bank, 2018/2019. (4) 2018 Canadian FinTech & AI Awards.
Personal & Commercial Banking – Canadian Banking
  Solid Volume Growth ($ millions)(1)                                                                                                            Superior Cross-Sell Ability
                                                                                                                                                  Percent of households with transaction accounts,
                                                                                                                                                  investments and borrowing products(2)

                                                                                                                                                                               18%
                                                                                                                 370
                                                 343                                        340
                            326
       301
                                                                                                                                                                                                                                         12%

                            393                  417                                        413                  435
       375

     2016                 2017                  2018                                   Q2/2018 Q2/2019                                                                        RBC                                               Peer Average
                          Loans and Acceptances                                        Deposits
  #1 or #2 Market Share in All Key Categories(3)                                                                                                 Continue To Improve Our Efficiency Ratio(9)
                                                                                       Market
  Product                                                                                                       Rank
                                                                                       share
  Personal Lending(4)                                                                   23.6%                        1

  Personal Core Deposits + GICs                                                         19.6%                        2                                                                                                                                            Peer
                                                                                                                                                    47.6%                                                                                                       Average(10)
                                                                                                                                                                           46.6%                   46.4%
  Credit Cards(5)                                                                       28.0%                        1                                                                                                    45.7%

  Long-Term Mutual Funds(6)                                                             31.7%                        1                              44.2%
                                                                                                                                                                           43.2%
                                                                                                                                                                                                   42.5%
  Business Loans ($0-$25MM)(7)                                                          26.9%                        1                                                                                                    41.6%                  42.0%

  Business Deposits(8)                                                                  25.6%                        1                               2016                    2017                   2018                Q1/2019                Q2/2019
Business Segments                                                                                                                                                                                                                                                          12
(1) Based on average balances. (2) Canadian Financial Monitor by Ipsos – 18,000 Canadian households – data based on Financial Group results for the 12-month period ending April 2019; cross-sell calculation methodology has been updated from previous quarters; TFSA is
considered an Investment. Peers include BMO, BNS, CIBC and TD. (3) Market share is calculated using most current data available from OSFI (M4), Investment Funds Institute of Canada (IFIC) and Canadian Bankers Association (CBA), and is at November 2018 and January 2019
except where noted. Market share is of total Chartered Banks except where noted. (4) Personal Lending market share of 6 banks (RBC, BMO, BNS, CIBC, TD and NA) and includes residential mortgages (excl. acquired portfolios) and personal loans as at November 2018, excludes
Credit Cards. (5) Credit cards market share is based on 6 banks (RBC, BMO, BNS, CIBC, TD and NA) as at November 2018. (6) Long-term mutual fund market share is compared to total industry and is at January 2019. (7) Business Loans market share is of 6 Chartered Banks (RBC,
BMO, BNS, CIBC, TD and NA) on a quarterly basis and is as of September 2018. (8) Business Deposits market share excludes Fixed Term, Government and Deposit Taking Institution balances. (9) Effective Q4/2017, service fees and other costs incurred in association with certain
commissions and fees earned are presented on a gross basis in non-interest expense. Comparative amounts have been reclassified to conform with this presentation. (10) Peers include BMO, BNS, CIBC and TD.
Stable retail PCL in Canadian Banking offset by higher commercial PCL

PCL on Impaired Loans Across our Canadian Banking Business Lines

                                  250
                                                                                Q2/2019 Average balance ($ billions)

                                  200

                                  150
                                                       253
                                  100

                                    50
                                                                                    80                                                                    79
                                                                                                                                    5
                                                                                                             19
                                    -
                                           Residential Mortgages        Personal Lending                Credit Cards         Small Business          Commercial (2)

                                         Q2/18   Q1/19       Q2/19   Q2/18 Q1/19 Q2/19          Q2/18      Q1/19   Q2/19   Q2/18   Q1/19   Q2/19   Q2/18 Q1/19 Q2/19

  PCL on Impaired Loans ($MM)             $7     $10          $6     $107     $121       $116    $119      $116    $122     $7      $5      $9     $21   $41    $110
  PCL on Impaired Loans (bps)(1)          1        2          1        54      59         59      277      242     269      67      42      76      12    22     58

  90+ Days Past Due (bps)                 19      18          18      28       31        31       76        67      73      91      94      95      70    50     67

Business Segments                                                                                                                                                     13
(1) Calculated using average net of allowance on impaired loans. (2) Commercial excludes Small Business.
Strong underlying credit quality in our Canadian residential portfolio
 Canadian Residential Mortgage Portfolio(1)
 As at April 30, 2019 ($ billions)                                                             Canadian Mortgage Portfolio
                                            LTV(2)
                                                                                               Average remaining amortization on mortgages of 18
        51%           47%            62%                57%          58%               58%
                                                                                                years
    $120.2
                                      Insured        Uninsured                                 Strong underlying quality of uninsured portfolio
                                       $101.3
                                       (37%)
                                                        $170.5
                                                        (63%)
                                                                                                   ~50% of uninsured portfolio have a FICO score
                                                                                                    >800
     69%
                                                                                               Greater Toronto Area (GTA) and Greater Vancouver
                    $49.7                                                                       Area (GVA) average FICO scores are above the
                                   $37.6
                                                   $32.5                                        Canadian average
                    70%            46%
                                                   61%             $17.6            $14.2      Average LTV ratio for newly originated and acquired
     31%
                                   54%                              50%               47%       uninsured residential mortgages is
Wealth Management
 Strategic Priorities                                                                            Recent Awards
  Global Asset Management: Deliver investment performance and                                   Best Private Bank for Customer-Facing Digital Capabilities
   extend leadership position in Canada, while continuing to build and                           (Family Wealth Report Awards, 2019)
   grow in the U.S. and other key global markets
                                                                                                 RBC GAM – TopGunSM Investment Team of the Year
  Canadian Wealth Management: Continue to deepen client
                                                                                                 (Brendan Wood International’s Canadian TopGunSM Investment Minds
   relationships and deliver a differentiated client experience that is
                                                                                                 Awards for 2018/2019)
   increasingly digitally-enabled and supported by data-driven insights
  U.S. Wealth Management: Leverage the combined strengths of                                    Outstanding Global Private Bank – North America
   City National Bank, RBC Wealth Management and Capital Markets                                 (Private Banker International Global Wealth Awards, 2018)
   to accelerate growth in the U.S.
                                                                                                 Outstanding Wealth Planning and Trust Provider
  International Wealth Management: Continue to leverage the
                                                                                                 (Private Banker International Global Wealth Awards, 2018)
   strengths and capabilities of RBC to drive growth in HNW and
   UHNW client segments(1)                                                                       Best Private Bank in Canada
                                                                                                 (PWM and The Banker Global Private Banking Awards, 2018)

 Net Income ($ millions)                                                                         Cash Earnings ($ millions)(2)

                               2,265                                                                                               2,458

                 1,838                                                                                               2,017

    1,473                                                                                               1,656

                                                           1,134         1,182                                                                                 1,230         1,282

    2016          2017          2018                    YTD 2018 YTD 2019                               2016          2017          2018                    YTD 2018 YTD 2019

Business Segments                                                                                                                                                                      15
(1) High Net Worth (HNW) and Ultra High Net Worth (UHNW). (2) Cash earnings exclude the after-tax effect of amortization of intangibles. This is a non-GAAP measure. For more information
see slide 39.
Wealth Management – Global Asset Management
                                   Building a high-performing global asset management business

        Driving top-tier profitability in our largest Wealth Management business
          $454.0BN in client assets
          Investor asset mix of 52% Retail / 48% Institutional client assets

        Extending our lead in Canada
          Largest retail fund company in Canada, ranked #1 in market share capturing 31.8% amongst banks and 15.5% all-in(1)
          3rd largest institutional pension asset manager in Canada(2)

        Delivering strong investment capabilities to support growth
          Top performing investment firm with ~81% of AUM outperforming the benchmark on a 3-year basis(3)
          Continued growth of investment capabilities and innovative solutions for both institutional clients and retail investors

       Canadian Retail AUM ($ billions)                                                         Diversified Asset Mix
       14.9% 15.0% 15.1% 15.1% 15.1% 15.1% 15.4% 15.5%                                          Q2/2019 AUM by Client Segment ($ billions)(4)
 300
                                                                                    15.0%

 280

 260

                                            228.8     230.6                237.1
                213.8   222.5     223.9                          218.8
 240

        210.6                                                                       12.0%

 220
                                                                                                                18%
                                                                                                                                                     Canadian Retail
 200

 180
                                                                                    9.0%

 160

 140
                                                                                                          9%                                         Canadian Institutional
 120
                                                                                    6.0%
                                                                                                                    $454.0BN          52%
 100

 80
                                                                                                                                                     U.S. Institutional
 60                                                                                 3.0%

 40

                                                                                                             21%                                     International Institutional
 20

   0                                                                                0.0%

       Jun-17 Sep-17 Dec-17 Mar-18 Jun-18 Sep-18 Dec-18 Mar-19

            Canadian Mutual Fund Balance(1)               All-In Market Share(1)

Business Segments                                                                                                                                                                  16
(1) Investment Funds Institute of Canada (IFIC) as at March 2019 and RBC reporting. Comprised of long-term funds and money market funds. (2) Benefits Canada as at May 2019.
(3) As at March 2019, gross of fees. (4) RBC GAM, based on period-end spot balances.
Wealth Management
                                                                  Canadian Wealth Management
   Maintaining profitable growth
                                                                                                                          Fee-based Assets per Advisor(2)
                                                                                                                                              ($ millions)
     Generating 24.8% of RBC Wealth Management earnings with strong pre-
       tax margin
                                                                                                                                               1.8x the Peer
     Number 1 HNW (1) market share in Canada(2)                                                                                                 Average
   Driving strong advisor productivity
     Canadian leader in fee-based assets per advisor(2)
                                                                                                                                106
     Consistently driving revenue per advisor of over $1.53MM per year, 28%
       above Canadian industry average(2)                                                                                                                              58
     Strong asset growth complimented by favourable market conditions
     Leveraging enterprise linkages to extend market share gains
                                                                                                                                RBC                          Cdn Peer Average

                                                 U.S. Wealth Management (including City National)
  RBC Wealth Management U.S.
   7th largest full-service wealth advisory firm in the U.S. as measured by number of financial advisors and 6th largest by assets under
     administration(3)
   Enhancing the client-advisor experience through a digitally-enabled, goals-based planning approach and strengthening the range of
     advisory solutions and product offerings
   Continuing to attract and onboard new advisors and clearing relationships while improving advisory productivity and operational efficiency
  City National
   A premier U.S. private and commercial bank that creates a platform for long-term growth in the U.S.
   Operates with a high-touch, branch-light client service model in selected high growth markets, including: Los Angeles, the San Francisco
     Bay area, Orange County, San Diego, New York, and Washington DC
   Expanding the CNB business model to selected high growth markets

                                                                International Wealth Management
   Enhancing advisor and product capabilities to accelerate organic client acquisition
   Continuing to focus on high-priority client segments across HNW and UHNW (1), especially in select target markets where we have scale
   Leveraging RBC’s global capabilities to bring the best of RBC to our clients

Business Segments                                                                                                                                                                        17
(1) High Net Worth (HNW) and Ultra High Net Worth (UHNW). (2) Strategic Insight (formerly Investor Economics), January 2019. (3) Source: U.S. wealth advisory firms quarterly earnings
releases (10-Q).
Insurance
  Strategic Priorities                                                                               Highlights
   Improve Distribution Effectiveness and Efficiency: By                                          Among the largest Canadian bank-owned insurance organizations,
    enhancing our proprietary distribution channels and focusing on the                            serving more than four million clients globally
    delivery of technology and operational solutions
                                                                                                   #1 in individual disability sales with 40%(1) market share
   Deepen Client Relationships: By continuing to be an innovative,
    client-focused provider of a full suite of insurance solutions for mass                        #2 in Segregated fund net sales & continues to be one of fastest growing
    underserved, mass affluent and HNW clients                                                     segregated fund providers(2)
   Simplify. Agile. Innovate.: By accelerating our digital initiatives’                           RBC Guaranteed Investment Funds continue to be one of the fastest
    time-to-market, improving quality and cost effectiveness                                       growing segregated fund providers in Canada with a YoY growth of
                                                                                                   17.3%(2)
   Pursue Select International Opportunities: Within our risk
    appetite, with the aim of continuing to grow our core reinsurance                              #2 in sales in the Canadian group annuity market in 2018 with 18%
    business                                                                                       market share
                                                                                                   Group annuity market continues to grow rapidly with another record year
                                                                                                   of growth of 24%
                                                                                                   Access to new technology and expanded set of insurance solutions for
                                                                                                   our clients through partnership with Aviva

  Net Income ($ millions)(3)                                                                       Efficiency Ratio(4)

        900
                                   775                                                                      14.7%
                     726
                                                                                                                                  12.6%                 12.8%                 12.3%

                                                               299          320

       2016          2017         2018                     YTD 2018 YTD 2019                                 2016                  2017                 2018               YTD 2019

Business Segment                                                                                                                                                                        18
(1) LIMRA Canadian Insurance Survey, 4th Quarter, 2018. (2) Strategic Insights, Insurance Advisory Service Report, April 2019. (3) 2016 net income includes the gain on sale of RBC General
Insurance Company. (4) Efficiency Ratio calculated by dividing non-interest expense by total revenue (excludes fair value changes on investments backing policyholder liabilities for every
year/quarter, and $287MM pre-tax gain on sale of RBC General Insurance Company in 2016).
Investor & Treasury Services
 Specialist provider of asset services, a leader in                    Strategic Priorities
  Canadian cash management and transaction
  banking services, and a provider of treasury                           Grow income and market share among Canadian asset managers, investment
  services to institutional clients worldwide                            counsellors, pension funds, insurance companies and transaction banking clients
    Rated by clients as the #1 Global Custodian                         Develop long-term partnerships with sophisticated and fast-growing asset managers
     for the eighth consecutive year(1)
                                                                         Automate and scale our business to support our clients' growth ambitions
    Ranked the #1 Fund Administrator overall for
     the sixth consecutive year(2)                                       Employ sound risk management practices and commercial insights to mitigate risks
                                                                         in the pursuit of profitable growth
    Named Best Trade Finance Bank in Canada
     for the seventh consecutive year(3)                                 Design and deliver digitally-enabled products and services to transform the way we
                                                                         interact with our clients
 Short-term funding and liquidity management
  for RBC                                                                Inspire and develop a change-ready workforce

  Net Income ($ millions)                                                                         Efficiency Ratio

                    741           741
                                                                                                                                                    66%
       613                                                                                              64%
                                                                                                                                          62%
                                                                                                                                60%
                                                             431
                                                                          312

      2016          2017         2018                    YTD 2018 YTD 2019                              2016                  2017        2018   YTD 2019

Business Segments                                                                                                                                           19
(1) Global Investor/ISF Global Custody Survey, 2018. (2) R&M Fund Accounting and Administration Survey, 2018. (3) Global Finance, 2019.
Capital Markets
   A leading North American investment bank with core markets across Canada, the U.S. and the U.K./Europe
      10th largest global investment bank by fees(1)

   Strategically positioned in the largest financial centers, focused on the world’s largest and most mature capital markets encompassing
    ~80% of the global investment banking fee pool(2)

   RBC Capital Markets is recognized by the most significant corporations, institutional investors, asset managers, private equity firms, and
    governments around the globe as an innovative, trusted partner with an in-depth expertise in capital markets, banking, and finance

                                                                           Revenue by Geography ($
  Revenue by Business ($ millions)(3)                                      millions)(4)                                                Net Income ($ millions)
                                                                                                                                                        2,777
                   1,084      1,136                                                                                                            2,525
        1,147
                                                                                                                                       2,270
                   1,129      1,238
        1,101
                                                                                           28%              14%
                   1,860      2,006
        1,802
                                                                                                                                                                         1,413 1,429
                                                       525       695                                              6%
                   2,140                               639       650
        1,892                 2,107
                                                       976       1,053

                                                       985           843
        2,113      2,253          2,122
                                                    1,150       1,118                            52%

   2016         2017       2018                Q2/18         Q2/19                                                                     2016 2017 2018                    Q2/18 Q2/19
                                               YTD           YTD
                                                                           U.S.   Canada    U.K. & Europe   Australia, Asia & Other
                                                                                                                                                                         YTD YTD
      FICC                            Investment Banking
      Lending & Other                 Repo & Secured Financing
      Global Equities

Business Segments                                                                                                                                                                   20
(1) Dealogic – Fiscal 2019 Q2 YTD. (2) Thomson Reuters, Global Investment Banking Review, full year 2018. (3) Global Markets segment revenue has been restated to align select portfolios
previously disclosed in Repo and Secured Financing to FICC and Global Equities. Revenue by business only includes Corporate & Investment Banking and Global Markets, excluding CM Other.
(4) For six months ended April 30, 2019.
Capital Markets
 Strategic Priorities
                                                             Focus on long-term client relationships aligned with our global capabilities
 Create valued relationships with our
                                                             Support our clients by partnering with them to understand their strategic objectives and
 clients by being an innovative and
                                                              delivering solutions to achieve their goals
 trusted partner
                                                             Collaborate to deliver clients our full suite of global products and services

                                                             Continue to grow and strengthen our senior coverage teams in the U.S., U.K. and Europe
                                                             Drive technology innovation in our Global Markets businesses through electronification,
                                                              algorithmic trading, and other initiatives
 Continue to grow our Global Investment
 Banking and Global Markets franchises                       Focus capital and coverage to deepen relationships with clients that are the most
                                                              significant users of Capital Markets
                                                             Partner with other enterprise segments to bring clients One RBC solution, specifically, with
                                                              U.S. Wealth Management

                                                             Optimize capital use to earn high risk-adjusted returns by maintaining both a balanced
 Optimize Capital Use to Earn High Risk-
                                                              approach between investment banking and trading revenue and a disciplined approach to
 Adjusted Returns on Assets and Equity
                                                              managing the risks and costs of our business

  Recent Awards                                                         Recent Big Deals

                                                                                                                                      Sole Bookrunner &
                                                                                                       RBC Capital Markets           Structuring Agent on
                                                                          BB&T and SunTrust           Acts as M&A Advisor on          $655mm of Amazon
                                                                          Agree to $66 Billion          Brookfield Business          Lease Collateralized
                                                                        Merger of Equals – RBC         Partner's $13.2 Billion        Pass-Through Note
 Best Investment Bank in                Best Place to Work for
                                                                        Capital Markets Acted as      Acquisition of Johnson              Certificates
        Canada(1)                         LGBT Equality(2)
                                                                        Sole Financial Advisor to         Control's Power
                                                                                 BB&T                                                   (Cloud Notes™)
                                                                                                        Solutions Business

Business Segments                                                                                                                                        21
(1) Global Finance, 2019. (2) Human Rights Campaign Foundation.
Capital Markets
  Capital Markets Total Assets, Average
                                                                                                    Geographic Diversification Across Loan Book
  ($ billions)                                                                                      Average loans outstanding by region ($ billions)(1)
                                                                                                                                                                140
                                                                                                                                              32                                   25
                                                                                                          -7                 3

                                                                                                                                              80                 84                 84
                                                                                                         75                77

                                                                                                                                                                    Provision for Credit
                                                                                                        Canada          U.S.        Other International
                                                                                                                                                                    Losses
                                                                                                      Earnings Volatility vs. Peers (Standard Deviation /
  Risk-Weighted Assets, Spot ($ billions)                                                             Avg Earnings)(2)
                                                                                                                                             17.1%                         16.8%

                         207                                  208               208
       201                                 201
                                                                                                                10.6%

     Q2/18             Q3/18              Q4/18             Q1/19             Q2/19                              RBC                      CDA Peers                      US Peers
Business Segments                                                                                                                                                                           22
(1) Average loans outstanding includes wholesale loans, acceptances, and off balance sheet letters of credit and guarantees for our Capital Markets portfolio, on single name basis. Excludes
mortgage investments, securitized mortgages and other non-core items. This chart has been restated to exclude certain intergroup exposures that are not part of the corporate lending business.
This is a non-GAAP measure. For more information see slide 39. (2) Canadian peers include BMO, TD, CIBC, BNS and NBC, US peers include JPM, GS, BAC and MS.
Economic Backdrop

                    23
Canada’s fiscal position
   Strong rating as a result of fiscal prudence, conservative bank lending practices and solid economy
   Lowest net debt to GDP ratio among G7 peers(1)
   Growth in the economy has slowed in part due to transitory disruptions to activity in the energy sector, but
    also because of rising interest rates and limited remaining slack in the economy. GDP is expected to
    increase at a more moderate pace in 2019 and 2020

                    Net Debt as % of GDP(1)                                                                 Canadian GDP by Industry(2)
                                     (2018)                                                                                  (Feb 2019)

                                                                                                                                                     Finance, Insurance & Real
                                                                                                                                                     Estate
                                                                                                      13%                                            Manufacturing
                                                                          153.2                                                 20%
                                                                                                                                                     Wholesale and Retail Trade
                                                                                             5%
                                                                 120.1
                                                                                                                                                     Scientific, Technical &
                                                                                        8%                                                           Educational Services
                                             86.0      87.6                                                                                          Public Administration and
                             77.5    80.9
                                                                                                                                          11%        Utilities
                                                                                                                                                     Mining, Oil & Gas Extractions
                                                                                        7%
                  41.0
                                                                                                                                                     Construction
        27.9                                                                                 5%                                     10%
                                                                                                                                                     Health Care
                                      U.S.
         Canada

                              U.K.

                                                        France

                                                                  Italy
                   Germany

                                             Average

                                                                           Japan

                                                                                                    10%
                                               G7

                                                                                                                     12%                             Transportation, Warehousing

                                                                                                                                                     Other

Economic Backdrop                                                                                                                                                                24
(1) Net debt refers to General Government net debt. International Monetary Fund October 2018 Fiscal Monitor. (2) Statistics Canada, RBC Economics Research.
Growth in economy to slow with economy hitting capacity
   Headline inflation eased to 1.6% on average in Q1 on the back of lower energy prices. Underlying inflation
    trends continue to be around the Bank of Canada’s 2% midpoint target with limited slack in the economy
    keeping a floor under prices

   Labour markets continued to improve. The unemployment rate ticked up to 5.8% on average in Q1/2019
    from a cycle-low 5.6% in Q4/2018 but is still historically very low

      −     Alberta remains a soft spot with a 7.0% unemployment rate in Q1 still elevated

   GDP growth slowed significantly in Q4/2018 (0.4%, annualized) and looks to have been similarly soft in
    Q1/2019 (RBC economics tracking a 0.7% increase). Transitory disruptions in the oil & gas sector and bad
    weather appear to have been factors, though. We expect underlying growth trends are somewhat stronger.
    We expect GDP increases of 1.5% in 2019 and 1.8% in 2020

Economic Backdrop                                                                                                           25
(1) Statistics Canada, RBC Economics Research. (2) Statistics Canada, Bureau of Labor Statistics, RBC Economics Research.
2019 Economic Outlook
                                                                                    Projected Economic Indicators for 2019(1)

                                                                                    Unemployment              Interest Rate         Current Account               Budget
                                         GDP Growth               Inflation
                                                                                       Rate(2)               (3 mth T-bills)         Balance/GDP(2)            Surplus/GDP(3)

  Canada                                      1.5%                  2.0%                  5.9%                    1.65%                   (2.0%)                     (0.6%)

  U.S.                                        2.6%                  2.0%                  3.7%                    2.4%                    (2.3%)                     (4.6%)

  Euro Area                                   1.2%                  1.0%                  7.8%                      NA                     3.0%                      (1.0%)

                                      The Canadian economy is forecast to grow by 1.5% in 2019 following a 1.8% increase in 2018 and a 3.0%
                                       gain in 2017. This year likely got off to a slow start due to weakness in the energy sector and bad weather.
                                       Housing activity has been stabilizing at lower levels following policy changes and rising interest rates.
                                       Consumer spending has also increased at a more moderate pace, though the labour market remains
                                       healthy.
Canada
                                      The Bank of Canada is no longer signaling that short-run interest rates will be hiked any time soon. The
                                       economy still appears to be healthy on balance but there is little sign of inflation pressures emerging that
                                       would push the central bank to hike rates quickly. We do not expect any additional hikes to the overnight
                                       target rate through 2020.

                                      The U.S. economy is forecast to grow by 2.6% in 2019 following a 2.9% gain in 2018. Both are above the
                                       economy’s longer run trend. Consumer spending is likely to increase at a more moderate rate as the effects
                                       of income tax cuts continue to fade, though a strong labour market and rising wages will support spending.
                                       Business investment is expected to continue to increase but could be dampened somewhat by market
U.S.                                   volatility and concerns about trade policy and global growth.
                                      The U.S. Federal Reserve still looks firmly on hold in terms of possible further interest rate hikes. The U.S.
                                       economy continues to look healthy, but benign inflation pressures and giving the central bank the option for
                                       patience.

                                      Euro area GDP growth is expected to slow to a 1.2% pace in 2019 following a 1.8% increase in 2018. Some
                                       of the recent loss of momentum reflects political uncertainty, as well as the impact of slowing global growth
                                       on the industrial sector.
Euro Area                             Inflation remains low despite the strengthening economic backdrop, though wage growth picked up in 2018.
                                       The European Central Bank ended net asset purchases at the start of the year. Their guidance is for rates
                                       to remain on hold this year.

Economic Backdrop                                                                                                                                                                 26
(1) RBC Economics Research as of May 10, 2019 and reflect forecasts for calendar 2019. (2) RBC Economics Research. (3) IMF Fiscal Monitor (April 2019), RBC Economics Research.
Canadian Housing Market

                          27
Structural backdrop to the Canadian and U.S. housing market
                                                               Canada(1)                                                                   U.S.(1)

                          Government influences mortgage underwriting policies                                       Agency insured only if conforming and LTV under
                           primarily through control of insurance eligibility rules                                    80%
                          Fully insured if loan-to-value (LTV) is over 80%                                           No regulatory LTV limit – can be over 100%
                               Must meet 5-year fixed rate mortgage standards                                        Not government-backed if private insurer defaults
                               Government-backed, on homes under $1MM
                               Down-payment over 20% on non-owner occupied
                                properties
  Regulation
                               CMHC last increased mortgage loan insurance
                                premiums in 2017 by ~15% for new mortgages with LTV
                                over 90%
                               Minimum down payment for new government-back
                                insured mortgages is 10% for portion of the value of a
                                home being purchased that is between $500,000 –
                                $999,000, and 5% below $500,000
                          Re-financing cap of 80% on non-insured

  Consumer  Mortgage interest not tax deductible                                                                     Mortgage interest is tax deductible
  Behaviour  Greater incentive to pay off mortgage                                                                   Less incentive to pay down mortgage
                          Strong underwriting discipline; extensive documentation                                    Wide range of underwriting and documentation
                                                                                                                       requirements
   Lender    Most mortgages are held on balance sheet
  Behaviour  Conservative lending policies have historically led to low                                              Most mortgages securitized
                              delinquency rates

                          Ability to foreclose on non-performing mortgages, with no                                  Stay period from 90 days to one year to foreclose
   Lenders’                stay periods                                                                                on non-performing mortgages
   Recourse
                          Full recourse against borrowers(2)                                                         Limited recourse against borrowers in key states
Canadian Housing Market                                                                                                                                               28
(1) Current regulation and lenders recourse. (2) Alberta and Saskatchewan have some limited restrictions on full recourse.
Legislation and policies – promoting a healthy housing market

 February 2018 – Government of British Columbia

    The B.C. government’s 2018 budget included a 30-point plan to address housing affordability issues in several areas of the province.
     The most significant changes are a new speculation tax (rising from 0.5% of assessed value in 2018 to 2% in 2019) that will apply to
     homeowners who do not pay income tax in the province, as well as an increase in the foreign buyer tax to 20% from 15%

 January 2018 – OSFI

    Qualifying rate for uninsured mortgages raised to 2 percentage points above the contract rate or the five-year posted rate, whichever
     is higher

 April 2017 – Government of Ontario

    Introduced 16 measures in a ‘Fair Housing Plan’ to address mounting risks in the housing market including a 15% Non-Resident
     Speculation Tax on the purchase price of homes in the Greater Golden Horseshoe region

 January 2017 – City of Vancouver

    Vancouver introduced a tax of 1% of the assessed value of each home which is vacant (principal residence is exempt)

 October 2016 – Department of Finance

    Qualifying rate for high-ratio mortgages with a term of five years or more is changed to the 5-year posted rate
    Portfolio-insured low-ratio mortgage loans must meet the eligibility criteria of high-ratio insured mortgage
    Any sale of a principal residence must be reported in the seller’s tax return for the year of sale, even if the entire gain is fully protected
     by the principal residence exemption

 July-August 2016 – OSFI & the Government of British Columbia

    OSFI increased scrutiny on mortgage underwriting standards and indicated it will place a greater emphasis on confirming internal
     controls and risk management practices are sound, and take into account market developments
    Foreign buyers registering the purchase of residential homes in Metro Vancouver become subject to an additional property transfer
     tax of 15% under legislation introduced by the British Columbia government

Canadian Housing Market                                                                                                                          29
Legislation and policies – promoting a healthy housing market

 December 2015 – Department of Finance

    Minimum down payment for new government-backed insured mortgages increased from 5% to 10% for portion of the value of a home
     being purchased that is between $500,000 and $999,999 (came into effect February 2016)

 April 2014 – CMHC

    Discontinued offering mortgage insurance on 2nd homes and to self-employed individuals without 3rd party income validation

 July 2012 – CMHC

      Maximum amortization on government-backed insured mortgages reduced to 25 years from 30 years
      Maximum amount that can be borrowed on a mortgage refinancing lowered to 80% from 85%
      CMHC insurance availability is limited to homes with a purchase price of
The Toronto and Vancouver downtown condo markets
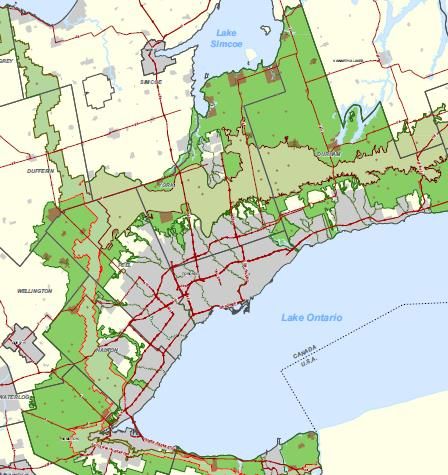
  Constraints on undeveloped land around Toronto / Vancouver, have contributed to a shift to higher-density condo
   housing
       Provincial growth plan, including ‘Green belt’ surrounding Toronto, contains urban sprawl and favours condo
        development
       Vancouver is restricted in its ability for urban sprawl due to land constraints away from the city center
  Canada has one of the highest per capita rates of permanent immigration in the world(1)
       22% of Canada’s population is foreign born (7.5 MM), highest proportion among the G8 nations(1)
       56% of all new immigrants to Canada move to Toronto, Vancouver or Montreal(1)
  RBC’s exposure to condo development is limited – about 3% of our Canadian commercial loan book(2)
       Condo exposure is about 10% of our Canadian residential mortgage portfolio(2)(3)

         “Green Belt” Surrounding Greater Toronto Area                                               Vancouver Limited by Mountains, Sea, U.S. Border

Canadian Housing Market                                                                                                                                 31
(1) Statistics Canada, 2016 Census. (2) As at April 30, 2019. (3) Based on $248BN in residential mortgages and HELOC in Canadian Banking ($39.6BN).
Canadian housing market risks remain localized
   The stress test introduced on January 1 2018 for uninsured mortgages, had a cooling impact across Canada. The
    stress test, along with increases in interest rates, caused home resales to decline for a second-straight year by 11% in
    2018. In 2017, regulatory changes at the federal and provincial levels in BC and Ontario contributed to a nearly 5%
    decline in home resales in Canada. To a large extent, this is a ‘soft landing’ engineered by policy makers
   Demand-supply conditions, however, remain balanced nationally and in most local markets including Toronto where
    prices have now stabilized after softening in 2017 on the heels of Ontario’s Fair Housing Plan. Property values are
    generally on a modest rise in Canada except in Vancouver and oil producing regions where market conditions are
    currently weak
   Solid population growth, household income gains and low unemployment rates limit the risk of a downward spiral
   Poor housing affordability is being skewed at the national level by severe conditions in Vancouver and Toronto.
    Affordability is in line with historical norms in most other markets across Canada
   Canada’s household debt service ratio showed a small uptick in 2018 — and is poised to rise further near term
   Lenders maintaining strong underwriting discipline and require extensive documentation
          Most mortgages held on balance sheet and conservative lending policies have led to low delinquency rates

                          Sales-to-New Listings Ratio(1)                                                                    Household Debt Service Costs(2)
                (Residential unit sales to new residential listings)                                                 (Mortgage & non-mortgage principal & interest
  1.00                                                                                                             payments as a % of household disposable income)
                                                                                               16
  0.90

  0.80                                                  Seller's market                        14

  0.70
                                                                                               12
  0.60

  0.50                            Balanced market                                              10

  0.40
                                                                                                8
  0.30
                                          Buyer's market
  0.20                                                                                          6

  0.10
                                                                                                4
  0.00                                                                                              91   92   93   94   95   96   97   98   99   00   01   02   03   04   05   06   07   08   09   10   11   12   13   14   15   16   17   18   19
      1996   1998   2000   2002    2004   2006   2008    2010   2012      2014   2016   2018

Canadian Housing Market                                                                                                                                                                                                                         32
(1) Canadian Real Estate Association, RBC Economics Research. (2) Statistics Canada, RBC Economics Research. PDI: Personal Disposable Income.
Canadians have significant equity ownership in their homes
  Canadians carry a significant and stable amount of                                                                                                                                     Equity Ownership(1)
   equity in their homes                                                                                                                                          (Owners’ equity as a % of total value of residential real estate assets)
                                                                                                                                                         80                                          Canada           U.S.
  The pace of residential mortgage accumulation slowed                                                                                                  75

   markedly since early-2017 to a 17-year low in 2018 and                                                                                                70
   early 2019                                                                                                                                            65

  Mortgage delinquency rates remain very low in Canada                                                                                                  60

   and have been stable through recent credit cycles                                                                                                     55

  RBC monitors its residential mortgage and broader retail                                                                                              50

   portfolios closely and performs stress tests for dramatic                                                                                             45

   movements in house prices, GDP, interest rates, and                                                                                                   40

   unemployment rates                                                                                                                                    35
                                                                                                                                                              90 91 92 93 94 95 96 97 98 99 00 01 02 03 04 05 06 07 08 09 10 11 12 13 14 15 16 17 18 19

                                                                                                                                                                                                        (3)
                                     Residential Mortgage Growth(2)                                                                                                              Mortgage Delinquencies(3)
                                                         (Year-over-year % change)                                                                                       (Mortgages 90+ days in arrears as a % of total mortgages)
                                                                                                                                                         6
  20
                                                                                                                                                                                                 Canada        U.S.
  18                                                                                                                                                     5

  16

  14                                                                                                                                                     4

  12

  10                                                                                                                                                     3

   8

                                                                                                                                                         2
   6

   4
                                                                                                                                                         1
   2

   0
       91   92   93   94   95   96   97   98   99   00    01   02   03   04   05   06   07   08   09   10   11   12   13   14   15   16   17   18   19   0
                                                                                                                                                             90 91 92 93 94 95 96 97 98 99 00 01 02 03 04 05 06 07 08 09 10 11 12 13 14 15 16 17 18 19

Canadian Housing Market                                                                                                                                                                                                                                   33
(1) Statistics Canada, Federal Reserve Board, RBC Economics Research. (2) Bank of Canada, RBC Economics Research. (3) Canadian Bankers Association, Mortgage Bankers Association,
RBC Economics Research.
Appendix A – Liquidity & Funding

                                   34
Strength of a high quality liquid balance sheet

                                                                                             $1,379 Billion
                                                                                            (as at April 30, 2019)

                                                            Assets                                                               Liabilities & Capital

                                                                                                                                      Unsecured Funding
                                                                                                         127%                                                                                    36%
                                                Cash and Reverse Repos                                 coverage
       44% Liquid                                                                                                                                                                                Wholesale
          Assets                                                                                                                                                                                 Funding
                                                                                                                                         Secured Funding

                                            Trading & Investment Securities

                                                                                                                                         Personal Deposits
    Loan Portfolio                                                                                                                                                                                53%
                                               Residential Mortgages(1)                                 123%
  Represents 44%                                                                                      coverage                                                                                    Capital +
  of Total Balance                                                                                                                                                                                Retail-
  Sheet Excluding                                                                                                                                                                                 Related
   Allowances and                                                                                                             Business & Government Deposits
                                                  Other Retail Loans                                                                                                                              Funding
    Including Sold
  MBS as per IFRS
                                                  Wholesale Loans                                                           Securitization(1) and Covered Bonds
                                                                                                                                               Capital
Derivatives are on
   Balance Sheet                                    Other Assets(2)                                                                      Other Liabilities(2)
      as per IFRS

     Appendix                                                                                                                                                                                         35
     (1) Securitized agency mortgaged back securities (MBS) are on balance sheet as per IFRS. (2) Other assets include $85BN of derivatives related assets, largely offset by derivatives related
     liabilities in Other liabilities. Under IFRS derivative amounts with master netting agreements cannot be offset and the gross derivative assets and liabilities are reported on balance sheet.
Strong deposit growth
     Leveraging the strength of our distribution channels and successful deposit
                              initiatives to drive growth

 Canadian relationship deposits
    Initiated successful strategies to grow relationship deposit base
    Canadian relationship deposits continue to grow
    RBC Canadian personal deposit market share is at 19.6% as of Jan 2019
    RBC Canadian commercial demand deposit market share is at 25.6% as of Jan 2019

                        RBC Canadian Deposits(1)                                                                    RBC Relationship Deposits
                                ($BN)                                                                                         ($BN)

                                                                                                                                                   Q2 2019                Q2 2018

                                                                                                HISA (3)                                                 $34                    $31
                                                                                                Advisory Channel Deposits (4)                            $35                    $31
                                                                                                Other Personal Deposits                                  202                  $187
                                                                                                Business Deposits                                        300                  $283
                                                                                                Total Deposits                                          $571                  $532

Appendix                                                                                                                                                                            36
(1) Sourced from Canadian deposit market share, which is based on OSFI (M4 report). (2) Canadian Business deposits reflect all platform demand deposits and Canadian Banking term
deposit balances only. (3) High Interest Savings Account; Includes CAD and USD deposits. (4) Sourced largely from RBC Wealth Management network.
Well-diversified wholesale funding platform
   Well-diversified across products, currencies, investor segments and geographic regions
   Raise majority of funding in international markets, preserving significant domestic capacity which can be
    more readily tapped in stressed market conditions
   Regular issuance in all major markets to promote investor engagement and secondary market liquidity

                       Canada                                                       U.S.                        Europe and Asia

 Canadian Shelf                                                    SEC Registered Shelf              European Debt Issuance Program
  (C$25BN)                                                           (US$40BN)                          (US$40BN)

 Securitizations                                                                                      Covered Bond Program
  (Canadian mortgage bonds, NHA                                                                         (EUR 32BN)
  MBS(1) and credit cards)
                                                                                                       Japanese Issuance Programs
                                                                                                        (JPY 1 trillion)

    Well Diversified by Product(2)                                Diversified by Geography(2)                      Recent Deals

                                                                                                       €500MM Green Bonds 5-year unsecured
                                                          European
                                                           Medium                                       (bail-in) at LIBOR+61bps
        Golden
                                                          Term Note
      Credit Card
         Trust                                CMB
                                                             7%                                        US$1.5 Billion 3-year unsecured (bail-in)
          6%                                  14%                                             Canad     at LIBOR + 47bps
                                                                                 Europe         a
                         Covered                Canadian
                                                                                  32%          28%     €100MM 20-year Covered Bonds at
                          Bond                    Deposit                                               LIBOR + 38bps
                          29%                      Note
                                                   18%
                                             U.S.                                          U.S.
                                           Medium                                          40%
                                          Term Note
                Yankee CD                    22%
                  & 3a2
                   4%
Appendix                                                                                                                                     37
(1) National Housing Act Mortgage Backed Securities. (2) As at April 30, 2019.
RBC Covered Bond Program

 Globally Active                                        Strong Issuer

  Active program in six different currencies: EUR,      Largest Canadian bank by market capitalization
   CAD, USD, CHF, AUD and GBP
                                                         Strong credit ratings
       C$38BN currently outstanding
                                                         Well capitalized and consistent historical profitability

                                                         Well diversified business mix

 Canadian Legislative Changes                           U.S. Market

  Canadian legislation protects claims of covered       Active U.S. dollar covered bond issuer
   bond investors and overrides any other conflicting
   law related to bankruptcy and insolvency              Several benchmark bonds outstanding

     Extensive regulatory oversight and pool audit      Broad U.S. investor base
      requirements
                                                           Issued US$17.2BN across eight deals since
     Mandatory property value indexation                   September 2012

                                                           Trace eligible

Appendix                                                                                                        38
Note to users
  We use a variety of financial measures to evaluate our performance. In addition to generally accepted
  accounting principles (GAAP) prescribed measures, we use certain key performance and non-GAAP
  measures we believe provide useful information to investors regarding our financial condition and result of
  operations. Readers are cautioned that key performance measures, such as ROE and non-GAAP measures,
  including amounts excluding Corporate Support, Insurance efficiency ratio, average loans and acceptances
  excluding certain items, and cash earnings excluding the after-tax effect of amortization of intangibles, do not
  have any standardized meanings prescribed by GAAP, and therefore are unlikely to be comparable to similar
  measures disclosed by other financial institutions.

  Additional information about our ROE and non-GAAP measures can be found under the “Key performance
  and non-GAAP measures” sections of our 2018 Annual Report and Q2 2019 Report to Shareholders, as well
  as in our Q2 2019 Supplementary Financial Information.

  Definitions can be found under the “Glossary” sections in our Q2 2019 Supplementary Financial Information
  and our 2018 Annual Report.

                                          Investor Relations Contacts

        Nadine Ahn, SVP Wholesale Finance and Investor Relations            (416) 974-3355
        Asim Imran, Senior Director, Investor Relations                     (416) 955-7804
        Jennifer Nugent, Senior Director, Investor Relations                (416) 955-7805
                                           www.rbc.com/investorrelations

Note to users                                                                                                   39
You can also read