LAS VEGAS CASINO AND HOTEL MARKET OUTLOOK 2021
←
→
Page content transcription
If your browser does not render page correctly, please read the page content below

Superior Results
                                         Through Unrivaled
                                  Hospitality Intelligence.
                                              Everywhere.

                                       FEBRUARY 2021

  LAS VEGAS CASINO AND HOTEL MARKET
  OUTLOOK 2021

                        Shannon S. Okada, MAI
                        Managing Director, Gaming

                        HVS Gaming
                        8545 W. Warm Springs Road, A-4 #336
                        Las Vegas, Nevada 89113

 HVS Gaming Division
HVS.com
www.hvs.com
    8445 W. Warm
    Springs Road, A-4
  #336, Las Vegas, NV
           89117 USA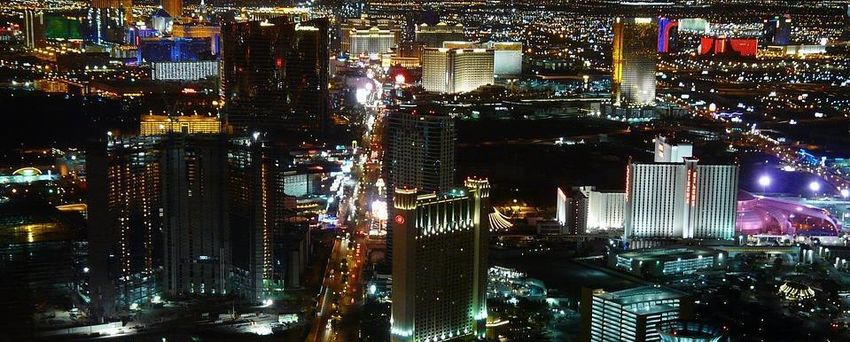
The impact of the COVID-19 pandemic on the Las Vegas economy has been extremely harsh given the market’s
reliance on visitation and conventions. Following five consecutive years of accommodating more than 42 million
visitors, Las Vegas hosted just over 19 million people in 2020 (the lowest number of visitors since 18.1 million in
1989). While vaccination rollouts have begun in Nevada, measures to curb the spread of the COVID-19 virus
remain in place. Continued weak performance is anticipated through the first half of 2021. Thereafter, the
recovery of travel and general economic performance is expected to accelerate as vaccines, medical therapies,
and public confidence support the beginning of the return to pre-pandemic levels. Fortunately, construction is
classified as an essential business in Nevada and has continued throughout the pandemic. New developments
will contribute to the eventual recovery of the market.

COVID-19 PANDEMIC
On March 17, 2020, Nevada’s Governor Steve Sisolak ordered the closure of Nevada’s nonessential
businesses and urged residents to implement social‐distancing measures to reduce spreading the COVID‐19
virus. The Las Vegas economy was devastated in April and May 2020 due to the shutdown of businesses.
Governor Sisolak authorized certain businesses, including restaurants, barbershops, hair salons, and most
retail businesses, to reopen with limitations beginning May 9, 2020, and Nevada began its emergence from
the pandemic shutdown. Nevada’s casinos were allowed to reopen on June 4, 2020, with restrictions. The
initial guidelines from the Nevada Gaming Control Board (NGCB) for the reopening of casinos included
requirements such as reducing casino capacity by 50%, physical distancing at slots and table games, using
personal protection equipment (PPE), and cleaning surfaces frequently.

On November 22, 2020, Governor Sisolak ordered stricter requirements on mask usage and a rollback on
permitted crowd sizes in both public and private settings given the surge in the number of COVID-19 cases.
Requirements effective November 24, 2020, which remained in place through February 14, 2021, included
the following:

    •   Masks usage when around someone who is not part of your immediate household, whether indoors
        or outdoors.

    •   Restaurants and bars limited to 25% capacity, with no more than four people per table; reservations
        are required, and no walk-ins are allowed.

    •   Gaming operations restricted to 25% capacity and operated pursuant to rules issued by the NGCB.
        Gyms/fitness centers, dance and martial arts studios, museums, art galleries, libraries, zoos,
        aquariums, arcades, racetracks, bowling alleys, miniature golf, and amusement/theme parks limited
        to 25% capacity.

    •   Public gatherings limited to 50 people, or to 25% of capacity, whichever number is lower.

    •   Private gatherings limited to ten people from no more than two households, whether indoors or
        outdoors.

    •   Indoor malls and retail stores allowed to operate at 50% capacity limit.

Due to declines in the number of active COVID-19 cases and the local positivity rate, changes to restrictions
aimed at limiting the spread of COVID-19 were relaxed as of February 15, 2021, and included the following:

HVS.com                                                         LAS VEGAS CASINO AND HOTEL MARKET OUTLOOK 2021 | PAGE 2
•   Restaurant capacity increased to 35%, with no reservations required.

    •   Capacity at casinos, places of worship, gyms/fitness centers, dance and martial arts studios, arcades,
        racetracks, bowling alleys, and pool halls (and other venues providing similar activities) increased to
        35%.

    •   Capacity at libraries, museums, art galleries, zoos, and aquariums increased to 50%.

    •   Public gatherings and event limits increased from 10 to 100 individuals, or 35% capacity. Venues
        eligible for large gatherings capped at 20% of total fixed seated capacity, with strict social-distancing
        requirements.

Beginning March 15, 2021, businesses operating at 35% capacity will be allowed to move back to 50%
capacity, and public gatherings and event limits are expected to be increased to 250 people, or 50% capacity.

On January 21, 2021, President Joe Biden signed an executive order that adds safeguards to international
travel and requires masks on planes, ships, and other public transportation. The executive order also
requires international travelers to show proof of a recent negative COVID-19 test before entering the U.S.
and follow Centers for Disease Control (CDC) guidelines to quarantine once they arrive. International
travelers are asked to stay home at least seven days if they get tested again, or ten days if they do not get
tested. The CDC issued an order that took effect on February 1, 2021, requiring travelers to wear a mask on
public transportation in the U.S.; specifically, passengers on airplanes, trains, buses, subways, ships, ferries,
taxis, and ride-shares must wear a mask that covers their nose and mouth from entrance to exit. Additionally,
people must wear masks on the premises of transportation hubs such as airports, train and subway stations,
bus and ferry terminals, seaports, and ports of entry. Masks must stay on while people await, board, travel,
and disembark public transportation. While the new mandates could be the beginning of the return of
international travel, the order may have only a minimal impact on Las Vegas visitation or COVID-19 infection
rates given that Nevada has enforced public mask usage since June 2020.

As of February 21, 2021, Clark County had reported 224,597 COVID-19 cases and 3,798 related deaths,
representing the majority of Nevada’s total 291,145 cases and 4,882 fatalities. The state’s two-week
positivity rate, the percentage of people tested who are confirmed to have the disease caused by COVID-19,
had decreased from a high of 21.7% on January 13, 2021, to 9.6% as of February 21, 2021. While the
importance of the lives lost and human suffering due to COVID-19 cannot be understated, the following graph
illustrates the deep impact that the virus had on the county in terms of visitors and gaming revenues in 2020.

HVS.com                                                       LAS VEGAS CASINO AND HOTEL MARKET OUTLOOK 2021 | PAGE 3
Table 1 – Historical Las Vegas Visitors and Clark County Gaming Revenues (1980–2020)

                                         Las Vegas Visitors          Clark County Gaming Revenue
           50,000,000                                                                                         $12,000,000,000
           45,000,000
                                                                                                              $10,000,000,000
           40,000,000
           35,000,000
                                                                                                              $8,000,000,000
           30,000,000

                                                                                                                                Gaming Revenue
           25,000,000                                                                                         $6,000,000,000
Visitors

           20,000,000
                                                                                                              $4,000,000,000
           15,000,000
           10,000,000
                                                                                                              $2,000,000,000
            5,000,000
                   0                                                                                          $0

                                                                 Year
                                           Source: Las Vegas Convention and Visitors Authority

As illustrated above, the number of visitors to Las Vegas in 2020 (19,031,000) was the lowest since 1989
(18,129,684), and Clark County gaming revenue in 2020 ($6.5 billion) was the lowest since 1998 ($6.3
billion).

Visitation
The entire southern Nevada economy is heavily dependent on the gaming, hotel, and convention industries,
which rely upon the volume of visitors to the market. Visitation to Las Vegas remained above 42 million each
year from 2015 through 2019 before the impact of the COVID-19 pandemic in 2020 when the total number
of Las Vegas visitors declined 55.2%. The following table illustrates the number of visitors to Las Vegas from
2005 through 2020.

HVS.com                                                                      LAS VEGAS CASINO AND HOTEL MARKET OUTLOOK 2021 | PAGE 4
Table 2 – Las Vegas Visitors (2005–2020)
                                       Year        Total Visitors       % Change
                                      2005            38,566,717           3.2 %
                                      2006            38,914,889           0.9
                                      2007            39,196,761           0.7
                                      2008            37,481,552          (4.4)
                                      2009            36,351,469          (3.0)
                                      2010            37,335,436           2.7
                                      2011            38,928,708           4.3
                                      2012            39,727,022           2.1
                                      2013            39,668,221          (0.1)
                                      2014            41,126,512           3.7
                                      2015            42,312,216           2.9
                                      2016            42,936,100           1.5
                                      2017            42,214,200          (1.7)
                                      2018            42,116,800         (0.2)
                                      2019            42,523,700          1.0
                                      2020            19,031,100        (55.2)

                                     CAGR (2005-2019):                  CAGR
                                                                          0.7 (2005-2015):
                                                                               %
                                     CAGR (2015-2019):                  CAGR
                                                                          0.1 (2010-2015):

                                     CAGR (2005-2020):                  CAGR
                                                                         (4.6)(2005-2015):
                                                                               %
                                     CAGR (2015-2020):                  CAGR
                                                                        (14.8)(2010-2015):
                                    Source: Las Vegas Convention and Visitors Authority

Visitation to the market has been affected by numerous factors, including health concerns, closures of
businesses, capacity restrictions, travel restrictions, event cancellations, and home-state quarantines related
to the COVID-19 pandemic. Declines in visitation to Las Vegas coincided with the closure of nonessential
businesses, including casinos, on March 17, 2020. The Las Vegas Convention and Visitors Authority (LVCVA)
has attributed the biggest drain to visitor volume in 2020 to the lack of convention business. In addition,
many annual events, including the National Collegiate Athletic Association (NCAA)’s men’s basketball
national championship tournament (March Madness), the ten-day National Finals Rodeo (NFR), which was
moved to Dallas and away from Las Vegas for the first time since 1985, and the citywide New Year’s Eve
celebration, were canceled in 2020. Fortunately, the NFR is expected to return to Las Vegas in 2021 and is
contracted to remain in Las Vegas through 2025.

HVS.com                                                               LAS VEGAS CASINO AND HOTEL MARKET OUTLOOK 2021 | PAGE 5
The following table sets forth a breakdown of visitors to Las Vegas by month in 2019 and 2020.

                                      Table 3 - Las Vegas Visitors by Month
                                                      2019              2020                %
                              Month
                                                    Visitors           Visitors       Change
                              January              3,412,100          3,545,100        3.9 %
                              February             3,189,900          3,333,200         4.5
                              March                3,697,100          1,531,100       (58.6)
                              April                3,542,000            106,900       (97.0)
                              May                  3,691,100            151,300       (95.9)
                              June                 3,607,400          1,065,100       (70.5)
                              July                 3,685,900          1,438,000       (61.0)
                              August               3,579,000          1,537,400       (57.0)
                              September            3,475,900          1,704,300       (51.0)
                              October              3,668,100          1,856,900       (49.4)
                              November             3,509,800          1,514,500       (56.8)
                              December             3,465,700          1,247,200       (64.0)
                              Total              42,524,000         19,031,000       (55.2) %
                                      Source: Las Vegas Convention and Visitors Authority

Between April and October 2020, the change in percentage gradually improved from a decline of 97% in
April to one of 49.4% in October. However, in November 2020, visitation was 56.8% less than in November
2019 due to increasing COVID-19 cases across the U.S. and tighter travel restrictions. Increasing COVID-
related safety restrictions in late November and the cancellation of the NFR in December contributed to a
greater decline in December 2020.

McCarran International Airport experienced a significant decrease in airport passenger traffic in 2020
because of the COVID-19 pandemic, with passenger volume plummeting 56.9% from the level reached in
2019. All international flights were canceled within weeks of the COVID-19 pandemic; as of mid-December
2020, only three flights to/from Mexico and one to/from Canada were available. With no conventions,
business travel has been nearly nonexistent. Currently, weekend leisure travelers constitute the bulk of
visitors. The following table illustrates the number of McCarran International Airport passengers from 2005
through 2020.

HVS.com                                                                 LAS VEGAS CASINO AND HOTEL MARKET OUTLOOK 2021 | PAGE 6
Table 4 – McCarran International Airport Passenger Traffic
                                         Year          Passengers      Change
                                          2005         44,267,370        6.8 %
                                          2006         46,304,376        4.6
                                          2007         47,729,527        3.1
                                          2008         44,074,642       (7.7)
                                          2009         40,469,012       (8.2)
                                          2010         39,757,359       (1.8)
                                          2011         41,479,814        4.3
                                          2012         41,667,596        0.5
                                          2013         41,857,059        0.5
                                          2014         42,885,350        2.5
                                          2015         45,389,074        5.8
                                          2016         47,435,640        4.5
                                          2017         48,500,194        2.2
                                          2018         49,646,118        2.4
                                          2019         51,537,638        3.8
                                          2020         22,201,479      (56.9)

                                       CAGR (2005-2019):                 1.1 %
                                       CAGR (2015-2019):                 3.2

                                       CAGR (2005-2020):                (4.5) %
                                       CAGR (2015-2020):               (13.3)
                                    Source: Las Vegas Convention and Visitors Authority

The Clark County Board of Commissioners has approved changing the name of the airport from McCarran
International Airport to Harry Reid International Airport, and the request is expected to be submitted to the
Federal Aviation Administration in March 2021.

Average daily traffic among the three major freeways leading to Las Vegas (Interstate 15, U.S. Highway 95,
and the 215 Beltway) was down 12.5% in 2020 compared to 2019. However, average daily traffic increased
in September, October, and November of 2020 over 2019 levels, which may be early evidence of pent-up
demand. The decline exhibited in December 2020 compared to December 2019 is likely due to the increased
COVID-related safety restrictions implemented in November 2020 and the cancellation of the NFR.

HVS.com                                                               LAS VEGAS CASINO AND HOTEL MARKET OUTLOOK 2021 | PAGE 7
Table 5 – Average Daily Auto Traffic – All Major Highways (Estimated)
                                                          2019              2020                %
                               Month
                                                        Average           Average             Change
                               January                 106,519            107,045               0.5 %
                               February                103,828            106,675               2.7
                               March                   120,402             85,194             (29.2)
                               April                   125,756             56,699             (54.9)
                               May                     124,723             84,775             (32.0)
                               June                    128,774            111,805             (13.2)
                               July                    135,889            122,299             (10.0)
                               August                  124,641            119,950              (3.8)
                               September               117,399            119,950               2.2
                               October                 120,938            125,281               3.6
                               November                115,148            116,004               0.7
                               December                118,909            106,582             (10.4)
                               Total                   120,244            105,188         (12.5) %
                                        Source: Las Vegas Convention and Visitors Authority

Continued weak performance is anticipated through the first half of 2021. Thereafter, the recovery of travel
and general economic performance is expected to accelerate, as vaccines, medical therapies, and public
confidence support the beginning of the return to pre-pandemic levels. The recovery is anticipated to
continue in 2022 and 2023. The expectation of recovery over the long term remains, as recent travel activity
demonstrates that many Americans are eager to travel (as conditions permit).

GAMING DEMAND
The gaming industry has been severely affected by the COVID-19 pandemic globally. In the U.S., the biggest
gambling market globally, all land-based casinos were closed at one point in 2020. Most states eased
restrictions over the summer, but with the rate of infection rising in the fourth quarter of 2020, some states
required land-based casinos to close again.

According to statistics from the Nevada Gaming Control Board (NGCB), gross gaming revenue from all non-
restricted1 gaming venues in Clark County totaled $6.5 million in 2020 compared to $10.36 billion in 2019,
reflecting a 36.8% decline. This is the lowest amount of gaming revenue for Clark County since 1998. While
gaming revenue in Clark County in January and February 2020 was 2.8% higher than in January and February
2019, the mandated closure of Nevada’s casinos due to the COVID-19 pandemic on March 18, 2020, resulted
in a severe contraction in the industry. While casinos were allowed to reopen at 50% capacity on June 4,
2020, the downturn in revenues remained significant. In November 2020, Governor Sisolak implemented
further restrictions to curb the surge in the COVID-19 virus, including limiting casino capacity to 25%, which
further impeded revenue growth in December 2020. The historical number of visitors, gaming revenue, and
gaming win per visitor for Clark County for 1994 through 2020 are set forth in the following table.

1“Restricted” locations are venues, such as taverns, with 15 or fewer slot machines that are incidental to the main
business of the venue.

HVS.com                                                                   LAS VEGAS CASINO AND HOTEL MARKET OUTLOOK 2021 | PAGE 8
Table 6- Clark County Visitors, Gaming Revenue, and Gaming Win per Visitor
                                                                                            Total Clark
                   Total Las                        Total Clark
                                                                                          County Gaming
         Year        Vegas        % Change        County Gaming          % Change                             % Change
                                                                                           Revenue per
                    Visitors                         Revenue
                                                                                              Visitor
         1994     28,214,362            ---  $5,430,651,000                    ---                 $192           ---
         1995     29,002,122           2.8 %  5,717,567,000                   5.3 %                 197          2.4 %
         1996     29,636,361           2.2    5,783,735,000                   1.2                   195         (1.0)
         1997     30,464,635           2.8    6,152,415,000                   6.4                   202          3.5
         1998     30,605,128           0.5    6,346,958,000                   3.2                   207          2.7
         1999     33,809,134          10.5    7,210,700,000                  13.6                   213          2.8
         2000     35,849,691           6.0    7,671,252,000                   6.4                   214          0.3
         2001     35,017,317          (2.3)   7,636,547,000                  (0.5)                  218          1.9
         2002     35,071,504           0.2    7,630,562,000                  (0.1)                  218         (0.2)
         2003     35,540,126           1.3    7,830,856,000                   2.6                   220          1.3
         2004     37,388,781           5.2    8,711,426,000                  11.2                   233          5.7
         2005     38,566,717           3.2    9,717,322,000                  11.5                   252          8.1
         2006     38,914,889           0.9   10,630,387,000                   9.4                   273          8.4
         2007     39,196,761           0.7   10,868,464,000                   2.2                   277          1.5
         2008     37,481,552          (4.4)   9,796,749,000                  (9.9)                  261         (5.7)
         2009     36,351,469          (3.0)   8,838,261,000                  (9.8)                  243         (7.0)
         2010     37,335,436           2.7    8,908,574,000                   0.8                   239         (1.9)
         2011     38,928,708           4.3    9,222,677,000                   3.5                   237         (0.7)
         2012     39,727,022           2.1    9,399,845,000                   1.9                   237         (0.1)
         2013     39,668,221          (0.1)   9,674,404,000                   2.9                   244          3.1
         2014     41,126,512           3.7    9,553,864,000                  (1.2)                  232         (4.7)
         2015     42,312,216           2.9    9,617,671,000                   0.7                   227         (2.2)
         2016     42,936,109           1.5    9,713,930,000                   1.0                   226         (0.5)
         2017     42,214,200          (1.7)   9,978,503,000                   2.7                   236          4.5
         2018     42,116,800          (0.2)  10,250,555,000                   2.7                   243          3.0
         2019     42,523,700           1.0   10,354,892,000                   1.0                   244          0.1
         2020     19,031,100         (55.2)   6,541,300,000                 (36.8)                  344         41.2

        CAGR (1994 to 2019):           1.7 %                                  2.6 %                              0.9 %
        CAGR (2010 to 2019):           1.5                                    1.7                                0.2
        CAGR (2015 to 2019):           0.1                                    1.9                                1.7

        CAGR (1994 to 2020):          (1.5) %                                 0.7 %                              2.3 %
        CAGR (2010 to 2020):          (6.5)                                  (3.0)                               3.7
        CAGR (2015 to 2020):         (14.8)                                  (7.4)                               8.6
                        Source: Nevada Gaming Control Board, Las Vegas Convention & Visitors Authority, HVS

Based on the foregoing data and reports by operators in the market, it appears that visitors have been
expending more money on gambling on a per-capita basis since the declaration of the pandemic. Despite the
significant decline in gaming revenue in 2020, the Clark County gaming win per visitor increased 41.2%,
which is not unexpected given that other options for visitors to expend money, including entertainment and
food and beverage, have been limited because of capacity restrictions; thus, most visiting Las Vegas in 2020
came to gamble.

HVS.com                                                                  LAS VEGAS CASINO AND HOTEL MARKET OUTLOOK 2021 | PAGE 9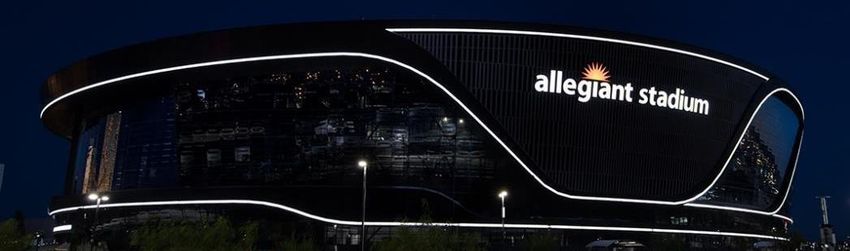
There have been previous periods over the past 25 years during which the Las Vegas gaming market
contracted. In 2001/02, the gaming market contracted because of the economic recession and the events of
September 11; gaming revenues for the Clark County market declined in 2008 and 2009 given the effects of
the Great Recession; and the Chinese government’s anti-corruption campaign, which began in 2014, affected
the market that year. However, the decline in gaming revenues exhibited by the market in 2020 because of
the closure of the state’s casinos, as well as the decline in travel and visitation, due to the COVID-19 pandemic
is unprecedented.

The NGCB segments gaming revenue by location, and Clark County’s gaming revenue can be segmented into
primarily visitor-based markets, specifically the Las Vegas Strip, Downtown, and Laughlin, with the balance
of the county generally representing areas that primarily generate gaming revenues from local residents.
Clark County gaming revenues for 2018 through 2020 have been allocated to these segments in the following
table.

                                           Table 7- Clark County Gaming Revenue by Location
                                                                                                                               Balance of County
                                                                                                                               (Clark County Less
        Clark County                Las Vegas    % of      %       Downtown    % of               Laughlin   % of                                                  %
 Year                  % Change                                                      % Change                         % Change      LV Strip,       % of Total
           ('000s)                 Strip ('000s) Total   Change     ('000s)    Total               ('000s)   Total                                               Change
                                                                                                                                Downtown, and
                                                                                                                                Laughlin) ('000s)
2018     $10,250,612         -     $6,588,499    64.3 %     -       $649,941    6.3 %       -     $509,126    5.0 %        -         $2,503,046        24.4 %          -
2019      10,355,717       1.0 %    6,587,454    63.6    (0.0) %     684,922    6.6       5.4 %    512,233    4.9        0.6 %        2,571,108        24.8          2.7 %
2020       6,540,892     (36.8)     3,733,427    57.1   (43.3)       464,201    7.1     (32.2)     366,676    5.6      (28.4)         1,976,588        30.2        (23.1)

                                                             Source: Nevada Gaming Control Board

The Las Vegas Strip segment, the largest in Clark County, is the most visitor-dependent and experienced the
largest decline in revenues in 2020 compared to 2019. The Downtown and Laughlin segments also
experienced higher declines than the balance of the county, which is expected given that the locals gaming
market is less dependent on out-of-town visitation and convention guests and is consistent with the quicker
recovery generally being exhibited by regional gaming venues relative to destination resorts nationwide.

While the NGCB does not release the identities of the properties in each segment, the wide range of casino
hotels in the Las Vegas Strip segment likely includes iconic properties on the Las Vegas Strip, such as The
Mirage, Caesars Palace, Venetian/Palazzo, Wynn Las Vegas/Encore, Bellagio, and MGM Grand; lower-tier
properties on the Las Vegas Strip, such as the Tropicana and Sahara; and properties such as the Rio Las Vegas
and Palace Station, which are not located on South Las Vegas Boulevard but in the general area. The Las Vegas
Strip 2020 gaming revenue of $3.73 billion was the lowest overall total since 1996 ($3.58 billion). The
following table sets forth composite data for properties in the Las Vegas Strip segment with annual gaming
revenue of more than $1.0 million (“Las Vegas Strip $1 Million and Over Submarket”), segmented among
gaming devices (slots), table games, and other gaming.

HVS.com                                                                                  LAS VEGAS CASINO AND HOTEL MARKET OUTLOOK 2021 | PAGE 10
Table 8- Gaming Revenue by Segment (Las Vegas Strip $1 Million and Over Submarket)
Gaming Devices Total Table Games Other Gaming % Total Win
% % of % % of % of %
Year Win ($000) Change Total Win ($000) Change Total Win ($000) Change Tot Win ($000) Change
2002 $2,436,944 - 52.4 % $2,065,438 - 44.4 % $148,206 - 3.2 % $4,650,588 -
2003 2,557,445 4.9 % 53.8 2,037,714 (1.3) % 42.8 161,884 9.2 % 3.4 4,757,043 2.3 %
2004 2,864,116 12.0 53.7 2,294,213 12.6 43.0 173,364 7.1 3.3 5,331,693 12.1
2005 3,170,703 10.7 52.6 2,653,550 15.7 44.0 206,999 19.4 3.4 6,031,252 13.1
2006 3,434,308 8.3 51.4 2,997,317 13.0 44.8 254,405 22.9 3.8 6,686,030 10.9
2007 3,501,997 2.0 51.3 3,091,195 3.1 45.3 232,020 (8.8) 3.4 6,825,212 2.1
2008 3,212,789 (8.3) 52.5 2,712,652 (12.2) 44.3 195,717 (15.6) 3.2 6,121,158 (10.3)
2009 2,807,051 (12.6) 50.6 2,560,937 (5.6) 46.2 178,908 (8.6) 3.2 5,546,896 (9.4)
2010 2,788,456 (0.7) 48.3 2,801,831 9.4 48.5 182,827 2.2 3.2 5,773,114 4.1
2011 2,886,994 3.5 47.6 3,010,648 7.5 49.6 168,104 (8.1) 2.8 6,065,746 5.1
2012 2,906,747 0.7 46.9 3,107,784 3.2 50.1 188,686 12.2 3.0 6,203,217 2.3
2013 2,911,865 0.2 44.8 3,398,204 9.3 52.3 188,291 (0.2) 2.9 6,498,360 4.8
2014 2,909,936 (0.1) 45.7 3,250,831 (4.3) 51.0 207,829 10.4 3.3 6,368,596 (2.0)
2015 3,061,695 5.2 48.2 3,076,933 (5.3) 48.5 207,431 (0.2) 3.3 6,346,059 (0.4)
2016 3,122,521 2.0 49.0 3,055,291 (0.7) 47.9 195,738 (5.6) 3.1 6,373,550 0.4
2017 3,216,232 3.0 49.8 3,027,942 (0.9) 46.9 213,924 9.3 3.3 6,458,098 1.3
2018 3,307,340 2.8 50.2 3,044,175 0.5 46.2 235,532 10.1 3.6 6,587,047 2.0
2019 3,442,304 4.1 52.3 2,881,420 (5.3) 43.8 260,775 10.7 4.0 6,584,499 (0.0)
2020 2,001,876 (41.8) 53.7 1,581,006 (45.1) 42.4 145,037 (44.4) 3.9 3,727,919 (43.4)
CAGR (2002 to 2019): 2.1 % 2.0 % 3.4 % 2.1 %
CAGR (2010 to 2019): 2.4 0.3 4.0 1.5
CAGR (2015 to 2019): 3.0 (1.6) 5.9 0.9
CAGR (2002 to 2020): (1.1) % (1.5) % (0.1) % (1.2) %
CAGR (2010 to 2020): (3.3) (5.6) (2.3) (4.3)
CAGR (2015 to 2020): (8.1) (12.5) (6.9) (10.1)
Source: Nevada Gaming Control Board
Gaming revenue for the Las Vegas Strip $1 Million and Over Submarket continues to come primarily from
slot machines (53.7%) and table games (42.4%), with additional revenue generated by keno, race books,
sportsbooks, and live card games (3.9%). The greater revenue decline exhibited in table games in 2020
relative to slots is likely due to the elimination of international visitors that, in general, play more table games
than slots. It is important to note that fluctuations in the win amount for Las Vegas Strip $1.0 Million and
Over Submarket can result because of the number of properties that fall below the $1.0 million gaming
revenue threshold during a given period.
Gaming revenue is expected to rebound in the post-vaccine period, driven primarily by pent-up demand and
gaming-customer database mining. The gaming industry is also very reliant upon the overall strength of the
economy, and pre-pandemic levels will be dependent on the rate of improvement exhibited on national and
worldwide levels.
LODGING MARKET
In 1989, the last calendar year that Las Vegas welcomed less than 19 million people, the market’s guestroom
inventory was 67,391. As of December 2020, the Las Vegas Convention and Visitors Authority (LVCVA)
reported total guestroom inventory of 143,117, with several properties, including the Palms Casino Resort
and Main Street Station, still closed. The numerous casino-resort properties that have been built since 1989
include the Bellagio, City Center, Cosmopolitan, Luxor, MGM Grand, Venetian/Palazzo, and Wynn/Encore,
among others.
HVS.com LAS VEGAS CASINO AND HOTEL MARKET OUTLOOK 2021 | PAGE 11Prior to the COVID-19 pandemic, the Las Vegas lodging market enjoyed occupancy levels well above the U.S.
average; however, occupancy has since declined significantly given the severe downturn in travel and lack
of convention business. In response to the travel restrictions and the decline in demand associated with the
COVID-19 pandemic, most casino hotels in Las Vegas initially ceased operations on March 17, 2020, while a
few properties remained open as essential businesses. While most casino hotels have since reopened, some
are waiting until demand recovers more substantially. Boyd Gaming has not opened two Las Vegas
properties, including Main Street Station, and Red Rock Resorts is keeping four Las Vegas properties closed,
including the Palms Casino Resort. Several Las Vegas Strip properties, including Encore, Mandalay Bay, The
Mirage, Park MGM, Palazzo, and Rio, are currently limiting hotel operations to the weekends due to low
demand during the week. The drop in demand is expected to be temporary, and demand levels should
recover and improve as travel restrictions are rescinded and economic activity rebounds. For example, MGM
Resorts International has announced that hotel operations at Mandalay Bay, The Mirage, and Park MGM will
reopen seven days a week effective March 3, 2021, with some entertainment shows reopening in late
February/early March 2021, in accordance with state guidelines. Performance data for all Las Vegas hotels
from 2005 through 2020 are summarized in the following table.
Table 9 – Las Vegas Guestroom Inventory, Occupied Rooms, Occupancy, ADR, and RevPAR
Total Total Overall Overall
Year Inventory % Change % Change % Change % Change
Rooms Occupied Occupancy ADR RevPAR
2005 133,186 1.3 % 43,362,698 2.0 % 89.2 % $103.12 14.9 % $91.98 15.6 %
2006 132,605 (0.4) 43,415,540 0.1 89.7 119.66 16.0 107.34 16.7
2007 132,947 0.3 43,867,192 1.0 90.4 132.09 10.4 119.41 11.2
2008 140,529 5.7 42,967,252 (2.1) 86.0 119.19 (9.8) 102.50 (14.2)
2009 148,941 6.0 41,986,134 (2.3) 81.5 92.93 (22.0) 75.74 (26.1)
2010 148,935 (0.0) 43,365,743 3.3 80.4 94.91 2.1 76.31 0.8
2011 150,161 0.8 45,654,165 5.3 83.8 105.11 10.7 88.08 15.4
2012 150,481 0.2 46,479,707 1.8 84.4 108.08 2.8 91.22 3.6
2013 150,593 0.1 46,191,449 (0.6) 84.3 110.72 2.4 93.34 2.3
2014 150,544 (0.0) 47,497,234 2.8 86.8 116.73 5.4 101.23 8.5
2015 149,213 (0.9) 47,896,317 0.8 87.7 120.67 3.4 105.84 4.6
2016 149,339 0.1 48,485,632 1.2 89.1 125.96 4.4 112.28 6.1
2017 146,993 (1.6) 47,663,200 (1.7) 88.6 127.35 1.1 112.78 0.4
2018 147,238 0.2 47,452,600 (0.4) 88.2 128.85 1.2 113.54 0.7
2019 149,422 1.5 48,300,100 1.8 88.9 132.62 2.9 117.90 3.8
2020 143,117 (4.2) 21,201,479 (56.1) 42.1 120.31 (9.3) 50.65 (57.0)
CAGR (2005-2019): 0.8 % 0.8 % 1.8 % 1.8 %
CAGR (2010-2019): 0.0 1.2 3.8 5.0
CAGR (2015-2019): 0.0 0.2 2.4 2.7
CAGR (2005-2020): 0.5 % (4.7) % 1.0 % (3.9) %
CAGR (2010-2020): (0.4) (6.9) 2.4 (4.0)
CAGR (2015-2020): (0.8) (15.0) (0.1) (13.7)
Source: Las Vegas Convention and Visitors Authority, HVS
Despite annual increases in revenue per available room (RevPAR) since 2010, RevPAR had not yet reached
the annual peak levels achieved in 2007 before the current downturn. From 2019 to 2020, occupied rooms
decreased by 56.1%, while average daily rate (ADR) decreased by 9.3%. Overall, RevPAR decreased 57.0%
in 2020 compared to 2019. In the absence of convention business, lodging demand in Las Vegas is currently
being driven primarily by leisure demand, and occupancy levels remain the highest on the weekends. In
2019, weekend occupancy registered 94.9% while midweek occupancy was 86.3%, reflecting a difference of
HVS.com LAS VEGAS CASINO AND HOTEL MARKET OUTLOOK 2021 | PAGE 128.6 percentage points; however, in 2020, weekend occupancy registered 52.8% while midweek occupancy
was 37.4%, a difference of 15.4 percentage points.
According to information from the LVCVA, projects totaling over 8,000 new guestrooms are in various stages
of development. The following table sets forth the hotels that have recently opened, are under construction,
or are in the stages of early development in the Las Vegas market.
Table 10 – Potential Las Vegas New Hotel Supply
Completed/ Estimated
Name of Property Anticipated Address Number
Completion Date of Rooms
Fairfield Inn & Suites Airport South 2020 Bermuda Road & Warm Springs 105
TownePlace Suites Airport South 2020 355 E. Warm Springs Road. 115
Hampton Inn & Suites 2020 355 E. Warm Springs Road. 150
Home2 Suites 2020 755 Sierra Vista Drive 100
Downtown Grand Hotel & Casino 2020 206 N. 3rd Street 495
Circa Resort & Casino 2020 18 E. Fremont Street 512
Hampton Inn Las Vegas Strip South 2020 7850 Giles Street 115
2020 Total 1,592
Resorts World Las Vegas 2021 3000 S. Las Vegas Boulevard 3,500
Hotel Cloe' 2021 Coolidge Avenue / Main Street 74
Skyline Hotel & Casino 2021 1741 N. Boulder Highway 41
2021 Total 3,615
TownePlace Suites 2022 Frontage Road/Nexus Way 120
Delta Hotels by Marriott 2022 3883 W. Flamingo Road 284
Element Las Vegas 2022 6605 S. Las Vegas Boulevard 119
SpringHill Suites 2022 Tropicana Avenue/Kelch Drive 170
AC Hotel by Marriott 2022 Polaris Avenue/Dewey Drive 225
AC Hotel by Marriott 2022 Grand Central Parkway/Symphony Park
322
Element Las Vegas 2022 Grand Central Parkway/Symphony Park
119
Aloft Hotel 2022 6605 S. Las Vegas Boulevard 136
Astral Las Vegas 2022 3961 S. Las Vegas Boulevard 620
2022 Total 2,115
Majestic Las Vegas 2023 305 Convention Center Drive 720
The Drew Las Vegas 2023 2755 S. Las Vegas Boulevard 3,719
Mardi Gras Hotel and Casino 2023 3500 Paradise Road 700
2023 and Beyond Total 5,139
Total Recently Opened/Planned Guestrooms 12,461
Source: Las Vegas Convention and Visitors Authority, HVS
Although significant new guestroom supply is slated to enter the market, not all announced projects are
expected to be developed. Projects are often proposed, but changes in plans or cancellations of planned
projects are common in the Las Vegas market. The two major casino-resort properties in the pipeline are the
Resorts World Las Vegas and The Drew Las Vegas. The 3,500-key Resorts World Las Vegas is expected to
open mid-year 2021 and is anticipated to benefit the market overall given that the Genting Group’s
worldwide network of gaming facilities will enable it to cross-market its brand and induce new visitation.
HVS.com LAS VEGAS CASINO AND HOTEL MARKET OUTLOOK 2021 | PAGE 13However, as of late February 2021, the status of The Drew Las Vegas is not clear due to a recent transfer of
ownership of the partially constructed property to a partnership between a Koch Industries subsidiary and
Fontainebleau Development.
Due to limited amenities, current capacity constraints, social-distancing recommendations, and other COVID-
19-related measures currently in place, hotel owners, operators, and investors anticipate continued weak
performance through the first quarter of 2021 relative to historical levels. The rollout of COVID-19
vaccinations, increased herd immunity, improved perceptions regarding travel, and the return of
conventions should help to increase hotel occupancy throughout the year while ADR remains stable. The
opening of Genting’s Resorts World Las Vegas, while adding inventory that will need to be absorbed by the
market, is expected to help the Las Vegas Strip market maintain ADR given the anticipated high-quality
improvements and positioning of the property. However, as a result of the multiple variables in play, the
near-term outlook is best described as uncertain. The hospitality sector, in general, and Las Vegas, in
particular, is expected to recover at an accelerating pace as vaccines, medical therapies, and public
confidence support a return of travel. Based on historical trends in both hotels and casino-resort properties
in the market, occupancy is projected to eventually return to relatively high levels, while ADR and RevPAR
may experience slow growth as the market recovers and absorbs the anticipated new supply.
CONVENTION MARKET
Conventions, which help to drive midweek business for the Las Vegas market, have been forced to cancel or
postpone plans because of the COVID-19 pandemic. With these cancellations, revenue is lost not only from
event fees and ticket sales, but also from gambling, hotel room nights, food and beverage, retail, and other
expected sources. Convention visitors, who often have expense accounts, tend to spend more than average
tourists. For example, the Consumer Electronics Show convention held in January 2020 brought in roughly
170,000 attendees and had an estimated total economic impact of $291.4 million in 2020. The National
Football League (NFL)’s 2020 draft was to be hosted in April 2020 at the new, 550,000-square-foot Caesars
Forum Convention Center but was canceled; the economic impact of the NFL 2019 draft held in Nashville,
Tennessee, was estimated at $224 million. In 2019, Las Vegas attracted a record 6.65 million convention
attendees. The LVCVA reported a 74.0% decline in the number of convention attendees in 2020, to 1.7
million, with no attendees since April. The following table details convention attendance in the market by
month since 2016.
Table 11 - Las Vegas Convention Attendance by Month
2016 Percent 2017 Percent 2018 Percent 2019 Percent 2020 Percent
Month Attendance Change Attendance Change Attendance Change Attendance Change Attendance Change
January 767,726 12.5 % 736,000 (4.1) % 612,900 (16.7) % 683,400 11.5 % 717,100 4.9 %
February 607,787 10.5 620,200 2.0 690,000 11.3 748,600 8.5 760,300 1.6
March 668,716 21.2 757,400 13.3 652,400 (13.9) 552,200 (15.4) 249,800 (54.8)
April 575,981 14.9 505,800 (12.2) 563,800 11.5 529,500 (6.1) 0 (100.0)
May 428,031 (1.2) 514,600 20.2 489,100 (5.0) 520,800 6.5 0 (100.0)
June 466,350 30.3 486,300 4.3 500,600 2.9 514,000 2.7 0 (100.0)
July 351,791 16.5 507,000 44.1 408,000 (19.5) 498,800 22.3 0 (100.0)
August 554,319 (5.1) 548,400 (1.1) 646,500 17.9 657,800 1.7 0 (100.0)
September 614,924 16.2 463,600 (24.6) 437,800 (5.6) 459,400 4.9 0 (100.0)
October 505,603 (16.4) 687,200 35.9 665,600 (3.1) 525,300 (21.1) 0 (100.0)
November 520,404 (7.0) 530,600 2.0 613,300 15.6 603,200 (1.6) 0 (100.0)
December 248,984 6.1 289,100 16.1 221,800 (23.3) 356,100 60.6 0 (100.0)
Total 6,310,616 7.1 % 6,646,200 5.3 % 6,501,800 (2.2) % 6,649,100 2.3 % 1,727,200 (74.0) %
Source: Las Vegas Convention & Visitors Authority
HVS.com LAS VEGAS CASINO AND HOTEL MARKET OUTLOOK 2021 | PAGE 14The LVCVA had planned to unveil its recently completed, $980-million expansion of the Las Vegas Convention Center, along with The Boring Co.’s new, $52.5-million, underground people-mover system with autonomous electric vehicles, in January 2020 with the Consumer Electronics Show, but the show was canceled because of COVID-19. In addition to the Las Vegas Convention Center’s 1.4-million-square-foot West Hall expansion, MGM Resorts International, Wynn Resorts, and Caesars Entertainment have also recently added new convention space. The aforementioned Resorts World Las Vegas is also expected to open with significant convention space. The first large-scale trade show planned for the Las Vegas Convention Center’s new West Hall is the World of Concrete 2021, which is expected to have 50,000 attendees, if it can be held as planned in June 2021. The National Association of Broadcasters (NAB)’s annual gathering was rescheduled from April to October in 2021; the show had been planned for April 2021 after the 2020 show was canceled. The 2019 NAB show, with approximately 90,000 attendees, had an estimated economic impact of $153.3 million. Convention business is crucial to Las Vegas’s recovery, and the industry is anticipated to rebound to pre-pandemic levels eventually. However, the recovery timeline will be dependent on control of the COVID-19 virus and relaxation of related restrictions. Initially, there may be hybrid conferences as the market recovers (i.e., with some attendees attending live while others attend virtually), which will help the convention industry but may not drive as much ancillary revenues for the market given that fewer people would be physically present. LAS VEGAS STRIP $1.0 MILLION AND OVER INCOME AND EXPENSES Annually, the Nevada Gaming Abstract from the NGCB provides combined financial information reported by nonrestricted Nevada gaming licensees grossing $1 million or more in gaming revenue for the fiscal years ending June 30. The Nevada Gaming Abstract for 2020 includes the 78-day time frame between March 17 and June 4, 2020, during which the casino hotels were shut down due to the COVID-19 pandemic. Although the data provide additional insight into the impact on the performance of the area properties, many operators in the Las Vegas community maintained payroll for extended periods, during which fixed expenses continued to be incurred while essentially no revenue was being generated. In fiscal 2019/20, gaming remained the biggest source of revenue for the Las Vegas Strip $1 Million and Over Submarket. Gaming revenue for the properties in this submarket increased to 35.8% in the fiscal year ending June 30, 2020, from 34.5% in fiscal 2018/19. While gaming revenue as a percentage of total revenues grew in the most recent fiscal year, the percentage of total revenue for rooms, beverage, and other revenue declined. The departmental percentages of total revenue for the Las Vegas Strip $1 Million and Over Submarket for fiscal years 1989/90 to 2019/20 are illustrated in the following graph. HVS.com LAS VEGAS CASINO AND HOTEL MARKET OUTLOOK 2021 | PAGE 15
Table 12 - Departmental Percentages of Total Revenue: Las Vegas Strip $1.0 Million and Over
                            Gaming                 Rooms                Food               Beverage                 Other
      70.0%

      60.0%

      50.0%

      40.0%

      30.0%

      20.0%

      10.0%

       0.0%
              1990

                     1992

                             1994

                                    1996

                                           1998

                                                   2000

                                                          2002

                                                                 2004

                                                                        2006

                                                                                2008

                                                                                        2010

                                                                                               2012

                                                                                                      2014

                                                                                                             2016

                                                                                                                     2018

                                                                                                                            2020
                                                  Fiscal Year Ending June 30
                                                  Source: Nevada Gaming Control Board

The following table sets forth the composite income and expense data for the Las Vegas Strip $1.0 Million
and Over Submarket for fiscal years 2018/19 and 2019/20, as provided by the NGCB (excluding depreciation
and amortization). It is noted that “Other G & A” expense decreased from $1.6 billion in 2018/19 to -$1.7
billion in 2019/20, which is likely the result of the sales of the Bellagio, Mandalay Bay, and MGM Grand during
fiscal 2019/20 from MGM Resorts International to joint ventures, with large gains recognized given the
“disposal” of those assets.

HVS.com                                                                   LAS VEGAS CASINO AND HOTEL MARKET OUTLOOK 2021 | PAGE 16
Table 13 – Composite Income and Expense Statements – Las Vegas Strip $1.0 Million and Over
Fiscal Year Ending June 30 2019/20 2018/19
Number of Licencees: 41 44
Occupancy: 79.4% 92.1%
Average Rate: $185.03 $180.19
RevPAR: $146.98 $166.02
Days Open: 365 365
Average Daily Available Rooms: 71,834 87,983
Occupied Rooms: 20,827,676 29,588,129
$ ('000s) % Gross PAR POR $ ('000s) % Gross PAR POR
REVENUE
Gaming $4,932,981 35.8 % $68,672 $236.85 $6,452,368 34.5 % $73,336 $218.07
Rooms 3,853,824 28.0 53,649 185.03 5,331,575 28.5 60,598 180.19
Food 2,275,802 16.5 31,681 109.27 3,081,996 16.5 35,029 104.16
Beverage 940,828 6.8 13,097 45.17 1,400,045 7.5 15,913 47.32
Other 1,781,168 12.9 24,795 85.52 2,448,545 13.1 27,830 82.75
Total Revenue 13,784,602 100.0 191,894 661.84 18,714,527 100.0 212,706 632.50
DEPARTMENTAL EXPENSES**
Gaming 1,836,018 37.2 25,559 88.15 2,273,933 35.2 25,845 76.85
Rooms 1,412,505 36.7 19,663 67.82 1,775,702 33.3 20,182 60.01
Food & Beverage 2,511,378 78.1 34,961 120.58 3,261,045 72.8 37,064 110.21
Other 810,688 45.5 11,286 38.92 1,087,382 44.4 12,359 36.75
Total Departmental Expense 6,570,589 47.7 91,469 315.47 8,398,063 44.9 95,451 283.83
DEPARTMENTAL INCOME 7,214,013 52.3 100,426 346.37 10,316,465 55.1 117,255 348.67
UNDISTRIBUTED EXPENSES
Unallocated Payroll 1,071,424 7.8 14,915 51.44 1,207,718 6.5 13,727 40.82
Advertising and Promotion 140,517 1.0 1,956 6.75 197,685 1.1 2,247 6.68
Music and Entertainment 183,378 1.3 2,553 8.80 282,070 1.5 3,206 9.53
Energy 218,421 1.6 3,041 10.49 243,211 1.3 2,764 8.22
Complimentary 1,657,893 12.0 23,079 79.60 2,172,636 11.6 24,694 73.43
Bad Debt Expense 160,563 1.2 2,235 7.71 60,763 0.3 691 2.05
Total 3,432,195 24.9 47,779 164.79 4,164,083 22.3 47,328 140.73
HOUSE PROFIT 3,781,818 27.4 52,646 181.58 6,152,382 32.9 69,927 207.93
Fixed Charges
Taxes - Real Estate 139,782 1.0 1,946 6.71 121,015 0.6 1,375 4.09
Taxes and Licenses - Other 76,066 0.6 1,059 3.65 96,006 0.5 1,091 3.24
Rent of Premises 76,281 0.6 1,062 3.66 84,837 0.5 964 2.87
Equipment Lease 11,986 0.1 167 0.58 13,762 0.1 156 0.47
Other G & A (1,712,729) (12.4) (23,843) (82.23) 1,591,126 8.5 18,084 53.78
Total (1,408,614) (10.2) (19,609) (67.63) 1,906,745 10.2 21,672 64.44
NET INCOME BEFORE DEPRECIATION,
AMORTIZATION, FEDERAL INCOME TAXES,
AND EXTRAORDINARY ITEMS $5,190,432 37.7 % $72,255 $249.21 $4,245,637 22.7 % $48,255 $143.49
Rooms Revenue as a % of Gaming Revenue 78.1 % 82.6 %
F & B Revenue as a % of Gaming Revenue 65.2 69.5
Other Revenue as a % of Gaming Revenue 36.1 37.9
** Departmental expenses are expressed as a percentage of departmental revenues
Source: Nevada Gaming Control Board
As expected, all departments reflected lower revenues and higher expense ratios in the most recent fiscal
year. House profit declined from $6.2 billion, or 32.9% of total revenues, in 2018/19 to $3.8 billion in 27.4%
of total revenues in 2019/20.
HVS.com LAS VEGAS CASINO AND HOTEL MARKET OUTLOOK 2021 | PAGE 17RECENT MAJOR DEVELOPMENTS
Construction was permitted to continue in Nevada throughout the pandemic because it is an essential
business for the state. In addition to the expansion of the Las Vegas Convention Center, several major
projects, including Allegiant Stadium and Circa, were completed in 2020.
LAS VEGAS MONORAIL AND THE BORING COMPANY
The LVCVA purchased the Las Vegas Monorail and its 3.9-mile elevated transit system for $24.26 million in
December 2020. The attractive component of the purchase was that the Las Vegas Monorail held a
noncompete clause on a competitor building a transportation system on the east side of the Las Vegas Strip.
The LVCVA will now be able to allow The Boring Company (TBC) to develop an estimated 15 miles of tunnels
for a new system that will use Tesla vehicles to transport customers to various Las Vegas locations. When
the spread of the coronavirus subsides, the LVCVA is expected to operate the monorail system. The monorail
is an important transportation option, as it typically moves nearly 5 million people annually, many of whom
are attendees of meetings and trade shows at the Las Vegas Convention Center. LVCVA representatives have
indicated that the trains on the monorail system will need to be replaced within the next eight to ten years
at an estimated cost of $200 million, citing that it is not likely to replace the trains and estimating that it will
cost $11 million to decommission the monorail system. The hope is to have TBC’s system or other mass
transportation mode in place at that point.
Land-use applications filed by TBC show one route that would transport riders to resorts on the Las Vegas
Strip, Allegiant Stadium, Downtown Las Vegas and, potentially, McCarran International Airport. A planned
second line would transport riders around Caesars Entertainment resorts only, including Caesars Palace,
Paris, the LINQ, Bally’s, the Cromwell, Harrah’s, and Planet Hollywood. In February 2021, Clark County
Commissioners approved Resorts World’s plans for a proposed passenger station and tunnel to be built by
TBC; similar plans have been submitted on behalf of Wynn Las Vegas and Circus Circus Hotel & Casino.
ALLEGIANT STADIUM
The $2-billion Allegiant Stadium, the new home of NFL’s Raiders, was completed in time for the 2020 NFL
season. Allegiant Stadium seats 65,000 fans for football games and is expandable to 72,000 for larger events.
Although the stadium was completed in time for the 2020 NFL season, fans were not allowed to attend games
because of the COVID-19 pandemic. Despite not being able to host fans for the entire 2020 NFL season,
Allegiant Stadium and Las Vegas were featured during national television broadcasts of Raiders games
during the 2020 season, which helped to keep the city in the minds of potential future visitors.
Source: allegiantstadium.com
HVS.com LAS VEGAS CASINO AND HOTEL MARKET OUTLOOK 2021 | PAGE 18The NFL has canceled this season’s Pro Bowl, which was scheduled for January 31, 2021, at Allegiant Stadium, and will award Allegiant Stadium the 2022 Pro Bowl instead. Allegiant Stadium is also a contender to host the Super Bowl in 2024. The University of Nevada – Las Vegas football team is expected to play at the stadium in the future. A Garth Brooks concert, the first live music show scheduled at Allegiant Stadium, which was originally rescheduled from August 22, 2020, to February 27, 2021, has been rescheduled to July 10, 2021, due to COVID-19 restrictions. A stadium district is being discussed for the area, which could include restaurant, bar, retail, hotel, and living spaces, leading to interest in vacant land in the area. Diversified Partners founder Walt Brown Jr. acquired a vacant, 1.8-acre parcel at the southeast corner of Russell Road and Polaris Avenue, just south of the stadium, for $10.8 million on December 28, 2021, with the reported intention of developing an In-N-Out Burger restaurant. The property is located in a highly visible spot with the potential for a high volume of foot traffic once fans are allowed to attend football games or other ticketed events. CIRCA Circa Las Vegas, the first new resort in Downtown Las Vegas since 1980, opened in late 2020. The 1.25- million-square-foot property features 777 guestrooms, a two-story sportsbook with seating capacity for 1,000 guests, and an amphitheater pool. As Downtown’s tallest building, Circa was built on the city block site that once included the former Las Vegas Club Hotel, several smaller casinos, and a strip club. Circa’s 982- space parking garage is located across Main Street and is connected to the resort via an above-ground pedestrian bridge. CAESARS FORUM In March 2020, Caesars Entertainment completed Caesars Forum, a 550,000-square-foot conference center with 300,000 square feet of first-class meeting space, although it has yet to open because of the COVID-19 pandemic. The venue includes two 108,000-square-foot pillarless ballrooms, with bridge connections to Harrah’s Las Vegas Casino & Hotel, the LINQ, and the LINQ Promenade. DOWNTOWN GRAND HOTEL & CASINO’S GALLERY TOWER The Downtown Grand’s all-new, 495-room Gallery Tower opened in September 2020. The tower’s seven guest floors provide a boutique hotel experience and bring the property’s total guestroom inventory to 1,124 rooms. The Gallery Tower also includes three 1,500-square-foot Presidential Suites with eighth-floor views of the city. VIRGIN LAS VEGAS The redevelopment of the former Hard Rock Las Vegas continued through the pandemic. The reopening date for the property as the Virgin Las Vegas was initially scheduled for the fall of 2020; however, in September, the opening date was reset to January 15, 2021. Subsequently, property representatives announced that the opening would be delayed until March 25, 2021, due to the market conditions because of the ongoing pandemic. The renovated property is expected to offer a rebranded casino, remodeled hotel rooms, several new restaurants, and new amenities upon opening. Mohegan Gaming & Entertainment has been approved by the Nevada Gaming Commission to operate the Virgin’s casino component, which will be known as the Mohegan Sun Casino at Virgin Hotels Las Vegas. HVS.com LAS VEGAS CASINO AND HOTEL MARKET OUTLOOK 2021 | PAGE 19
TRANSACTIONS
Following the closing of the sale and leaseback transaction involving the Bellagio in November 2019,
whereby ownership interests in the Bellagio were transferred to a joint venture entered into with
subsidiaries of The Blackstone Group for consideration totaling approximately $4.25 billion, MGM Resorts
International and The Blackstone Group entered into another joint venture pursuant to which ownership
interests in the MGM Grand and Mandalay Bay were contributed for total consideration of $4.6 billion. The
MGM Grand/Mandalay Bay sale, which was announced in January 2020, closed in February 2020. MGM
Resort’s real estate investment trust, MGM Growth Properties, owns 50.1% of the joint venture, while
Blackstone’s subsidiaries control 49.9% of the joint venture. MGM Resorts International leases back the MGM
Grand and Mandalay Bay and continues to operate the casino-resort properties, as it does with the Bellagio.

On April 16, 2020, Gaming and Leisure Properties Inc., the real estate investment trust formed in 2013 as
corporate spinoff from Penn National Gaming, purchased the real property associated with the Tropicana
Las Vegas Casino Hotel Resort from Penn National Gaming Inc. in exchange for rent credits of $307.5 million;
the sale had been announced on March 27, 2020. An affiliate of Penn National Gaming continues to operate
the casino and hotel business of the Tropicana Las Vegas pursuant to a triple-net lease for nominal rent for
the earlier of two years (subject to three one-year extensions) or until the Tropicana Las Vegas is sold. Penn
National Gaming will receive 75% of the net proceeds above $307.5 million if a sale agreement is signed
during the first twelve months following closing, and 50% of the net proceeds above $307.5 million if a sale
agreement is signed during the subsequent twelve months following closing. Penn National Gaming will not
be entitled to receive any net sale proceeds if the Tropicana Las Vegas is sold after 24 months from closing.
The Tropicana Las Vegas was purchased by Penn National Gaming in 2015 for approximately $360 million.

The casino and casino-hotel transaction market has been negatively affected by the COVID-19 pandemic
since mid-March 2020. While opportunistic equity investors continue to seek out deals, and select sources
of debt remain available, most owners are reluctant to sell under current market conditions. As such, there
have been limited casino-hotel transaction data in Las Vegas to review since the downturn in market
conditions, although the entry of special purpose acquisition companies (SPACs) into the gaming sector has
generated interest in recent months. Las Vegas-based casino operator Affinity Gaming representatives
indicated in January 2021 that the company is searching for acquisition opportunities through a SPAC.
Fertitta Entertainment Inc., the parent company of the Golden Nugget brand, and mobile gaming company
PlayStudios announced SPAC mergers in February 2021.

The historical pattern of transaction activity and pricing is generally expected to recur as the market moves
through the cycle induced by the COVID-19 pandemic. Although the outlook for casino-hotel performance is
uncertain at present, investors are accustomed to dealing with the risk of performance volatility and will
look for opportunities to buy assets well below replacement cost, with the anticipation of strong asset
appreciation and high returns once we move past the current crisis. Most sellers will sit on the sidelines and
will wait to sell when price discounts subside, but a rebound in transaction activity could occur quickly once
travel resumes. At present, most investors anticipate an accelerating recovery of performance of gaming
assets in 2021. The general industry consensus is that hotel values have declined 20% to 35% because of the
COVID-19 pandemic, and a similar range would be expected for casino hotels.

FUTURE PROJECTS
Proposed new development projects, including casino-hotel and entertainment options, and redevelopment
of existing older casinos are constantly being explored; however, changes in plans or cancellations of planned
projects are also common. The following proposed or partially constructed projects are anticipated to
provide opportunities for further growth of the Las Vegas market in the future.

HVS.com                                                     LAS VEGAS CASINO AND HOTEL MARKET OUTLOOK 2021 | PAGE 20
BRIGHTLINE WEST
Construction on the high-speed train between Las Vegas and Southern California that was to begin in 2020
has been delayed indefinitely because of financing issues. Late last year, Brightline West postponed a $2.4-
billion bond sale that would have generated the financing for the initial portion of tracks and stations for the
$8-billion project. The company blamed the delay on market instability due to the ongoing COVID-19
pandemic. Given that traffic along Interstate 15 crossing the Nevada/California border can be congested,
particularly heading toward Las Vegas on a Thursday or Friday night and entering Southern California on a
Sunday night, a high-speed luxury train between the two destinations would appear to be warranted. In
addition to the planned Las Vegas–Victorville track, Brightline has also been considering potential links to
Rancho Cucamonga and Palmdale, California, where riders could then link to Downtown Los Angeles via
Metrolink.

THE DREW LAS VEGAS
The Witkoff Group and New Valley LLC purchased the partially completed Fontainebleau in August 2017 for
$600 million from Icahn Enterprises L.P. The property had been purchased out of bankruptcy in 2010 for
$148 million. Construction of The Drew was put on hold because of the COVID-19 pandemic. In February
2021, Koch Real Estate Investments, in partnership with Fontainebleau Development, announced that it
planned to take over ownership of the partially completed casino-resort property for an undisclosed amount.
The property was previously anticipated to open in 2023 with a casino, 3,719 rooms, more than 500,000
square feet of convention and meeting space, as well as food and beverage, retail, spa, and nightlife venues.

MSG SPHERE LAS VEGAS
The Madison Square Garden Co. is partnering with Las Vegas Sands Corp. on the construction of the MSG
Sphere Las Vegas, which will be built east of the Venetian. The 17,500-seat MSG Sphere will be built for music
and entertainment performances and could host eSports competitions and possibly boxing and mixed
martial arts. A pedestrian bridge is expected to link the arena with the Venetian, Palazzo, and the Sands Expo
Center. Construction of the MSG Sphere was put on hold due to the COVID-19 pandemic but has resumed.
The project is now anticipated to be finished in 2023. About 300 workers will be on site every day, and the
project has shifted to completing all superstructure concrete and structural steel work, as well as building
the steel domed roof. Once the venue is completed, it will feature a 160,000-square-foot wraparound screen.
MSG Entertainment expects the MSG Sphere to be the busiest in its portfolio, which includes Madison Square
Garden and Radio City Music Hall in New York.

RESORTS WORLD LAS VEGAS
Construction of the $4.3-billion, 3,500-room Resorts World Las Vegas, being built by Malaysia-based Genting
Berhad, has continued through the pandemic and is still anticipated to open in the summer of 2021.
Eventually, Resorts World Las Vegas is expected to induce new demand to the Las Vegas market due the
numerous cross-marketing opportunities with its parent company’s businesses, which includes integrated
resorts in the U.S., Malaysia, Singapore, the United Kingdom, and the Bahamas. The Resorts World Las Vegas
is being built on the 87-acre site of the former Stardust/proposed Echelon, which it purchased from Boyd
Gaming for $350 million in 2013. The property is being developed with an Asian theme, and Resorts World
Las Vegas is anticipated to partner with Singapore-based entertainment company Zouk Group on a variety
of nightlife, entertainment, and dining options. The Las Vegas Review Journal reported that Resorts World
received approximately 85,000 applications for the 6,000 positions expected to be available, a testament to
the current market conditions in Las Vegas as much as the quality of the parent company’s reputation.

HVS.com                                                      LAS VEGAS CASINO AND HOTEL MARKET OUTLOOK 2021 | PAGE 21
CONCLUSION
Vaccines have been developed and inoculations have begun. Las Vegas’ recovery is dependent on the velocity
of the return of visitors and midweek meeting and group business. Continued weak performance is
anticipated through the first half of 2021 until vaccinations are rolled out and/or herd immunity reaches a
level where a relaxation of preventive measures is warranted, and people feel safer returning to normal
activities. The prevailing market outlook is that the direct impact of the pandemic on the tourism, convention,
and gaming sectors will affect demand at varying levels through the remainder of 2021. The recovery of
travel and general economic performance should accelerate as vaccines, medical therapies, and public
confidence support the beginning of the return to pre-pandemic levels. A gradual recovery in the Las Vegas
market is anticipated to occur thereafter. However, the situation is unprecedented and remains highly
uncertain, as the widespread availability of the vaccine has yet to be determined, public acceptance of
medical solutions is unclear, and a return of confidence in traveling safely are unknown.

As the world defeats and eventually recovers from the effects of COVID-19, Las Vegas will be here to welcome
the pandemic-induced fatigued masses. In addition to providing over 140,000 guestrooms, under normal
circumstances, the market provides a wide variety of leisure options including casinos, food and beverage,
entertainment, and shopping venues, along with a large amount of meeting and convention space. Forty Las
Vegas establishments have made Forbes magazine’s 2021 list of five-star, four-star, and recommended
resorts, restaurants, and spas. New, large-scale developments in the professional sports and entertainment
fields will prove to be major draws once the virus is contained and people are again allowed to gather in large
groups. New and renovated convention space awaits those that miss the face-to-face interaction of in-person
conferences. Las Vegas is expected to generate demand from local, national, and international sources at
various price points once conditions allow for the return of safe travel from around the world.

HVS.com                                                     LAS VEGAS CASINO AND HOTEL MARKET OUTLOOK 2021 | PAGE 22
You can also read