Morningstar Wide Moat Focus Index Through a Factor Lens Factor exposures have provided a modest headwind as stock selection remains the primary ...
←
→
Page content transcription
If your browser does not render page correctly, please read the page content below
?
Morningstar Wide Moat Focus Index Through a Factor Lens
Factor exposures have provided a modest headwind as
stock selection remains the primary driver of favorable returns.

Morningstar Equity Research The Morningstar Wide Moat Focus Index has delivered more than 300 basis points of annual excess
April 2021 returns versus the broader U.S. equity market since its early 2007 live inception date. We often
Contents contextualize this track record by looking at the impact of sector weightings and stock selection. In this
2 Assessing the Impact of Traditional
 Factor Exposures on Wide Moat Focus
 report, we highlight key factor exposures and analyze their impact on performance.
 Index Performance
5 Highlighting Two Factor-Related In aggregate, the index's exposures to traditional factors has proved unfavorable. Two notable exposures
 Misconceptions About the Wide Moat
 Focus Index stand out in the factor profile below. First, we note a very low exposure to the momentum factor. This
9 Stock Selection Remains the has represented a pressing headwind, with momentum having been the best-performing factor, in
 Key Performance Driver for the
 isolation, since the index's live inception date. Second, and perhaps counterintuitively, the index has
 Wide Moat Focus Index
10 Factor Profile Comparison: Wide Moat exhibited a slightly below-market exposure to the quality factor. For the most part, however, the Wide
 Focus Index vs. Wide Moat Index Moat Focus Index's factor loadings have proved dynamic over time.
12 Appendixes
Andrew Lane
Director of Equity Research, Index Strategies Morningstar Wide Moat Focus Index: Factor Profile, Trailing 5 Years
+1 312 244-7050
andrew.lane@morningstar.com
Important Disclosure
The conduct of Morningstar's analysts is governed
by Code of Ethics/Code of Conduct Policy, Personal
Security Trading Policy (or an equivalent of),
and Investment Research Policy. For information
regarding conflicts of interest, please visit:
http://global.morningstar.com/equitydisclosures
Third-Party Distribution
Morningstar has agreed to allow VanEck to
distribute this report to citizens of the United
States or its territories, Australia, and Europe, the
Middle East and Asia via email and through its
website. VanEck is not acting as an agent or
representative of the analyst, Morningstar, Inc. or
the Equity Research Group. Morningstar is not
affiliated with VanEck.
VanEck Disclosures
The information herein represents the opinion of
the author(s), but not necessarily those of VanEck.
The mention of a specific security is not a
recommendation to buy, or solicitation to sell such
security.
Index returns are not Fund returns and do not
reflect any management fees or brokerage
expenses. Certain indices may take into account
withholding taxes. Investors can not invest directly
in the Index. Returns for actual Fund investors may
differ from what is shown because of differences
in timing, the amount invested and fees and Source: Morningstar Direct. Data from March 1, 2016, to Feb. 28, 2021.
expenses. Index returns assume that dividends Benchmark: Morningstar US Market Index.
have been reinvested. Note: Factor exposures reflect percentile from 1 to 100 based on weighted constituent-level data relative to a 40,000-stock global coverage universe.
See last page for continued disclosures.
Page 2 of 23 Morningstar Wide Moat Focus Index Through a Factor Lens | 5 April 2021 | See Important Disclosures at the end of this report.

 Assessing the Impact of Traditional Factor Exposures on Wide Moat Focus Index Performance
 In this report, we analyze the positioning of the Wide Moat Focus Index across seven traditional factors:
 size, liquidity, yield, value/growth, quality, volatility, and momentum.

 Exhibit 1 Global Risk Model: Factor Descriptions

 Name Description

 Size Market capitalization of a company. Higher scores imply smaller companies.

 Liquidity Share turnover of a company. Higher scores imply more liquidity.

 Yield A measure of a firm's total yield (dividend plus buyback). High scores imply high-yielding firms.

 Value/GrowthUses the Morningstar Style Box raw style score for calculating value/growth characteristics. Higher scores imply firms
 that are more growth and less value oriented
 Quality A quality firm is one with high profitability and low financial leverage. High scores imply high-quality firms.

 Volatility Total return volatility as measured by trailing 12-month volatility of daily returns. Higher scores imply greater return
 volatility.
 Momentum Total return momentum over the horizon from negative 12 months through negative 2 months. Higher scores imply
 greater return momentum.
 Source: Morningstar.
 Global Risk Model version: Standard.

 Please see Appendix A for more detail on how these factor scores are defined and calculated.

 The Wide Moat Focus Index's Factor Exposures Have Detracted From Excess Returns
 Data from the Morningstar Global Risk Model indicates that factor exposures have provided a modest
 headwind for excess returns since the Wide Moat Focus Index's live inception date. Across the seven
 factors analyzed in this report, three have had a material impact on performance. In Exhibit 2, the active
 exposure column reflects the degree to which the index is overweight or underweight a factor loading
 relative to its benchmark. A factor premium reflects the degree to which a particular factor has
 influenced asset returns. The active contribution column indicates the impact of a given factor exposure
 on the index's annualized excess returns.
Page 3 of 23 Morningstar Wide Moat Focus Index Through a Factor Lens | 5 April 2021 | See Important Disclosures at the end of this report.

Exhibit 2 Morningstar Wide Moat Focus Index: Risk Factor Attribution

 Portfolio Benchmark Active Factor Portfolio Benchmark Active
 Exposure Exposure Exposure Premium % Contribution % Contribution % Contribution %
 Size 0.12 -0.14 0.26 22.38 0.24 -0.25 0.49
 Liquidity 0.28 0.18 0.10 10.05 0.36 0.13 0.22
 Yield 0.18 0.07 0.11 10.11 0.07 0.05 0.02
 Value-Growth -0.07 -0.01 -0.06 1.33 -0.02 0.00 -0.02
 Quality -0.10 0.00 -0.10 17.84 -0.05 -0.01 -0.04
 Volatility 0.02 -0.07 0.09 -22.71 0.06 0.13 -0.07
 Momentum -0.46 0.00 -0.46 28.76 -0.95 -0.05 -0.90

 Total: -0.29
Source: Morningstar Direct. Data from March 1, 2007, to Feb. 28, 2021.
Benchmark: Morningstar US Market Index.
Risk Model: Global Equity Model (USD), Standard.
Note: Factor exposures are calculated relative to an ~11,000-stock estimation universe. See Appendix B for more details on estimation universe construction rules.

 The Wide Moat Focus Index's positive active exposure to the size factor reflects the inclusion of smaller
 companies, on average, relative to its benchmark. To be clear, the Wide Moat Focus Index operates in
 the large-cap style band. Its holdings simply skew a bit smaller, on average, versus the benchmark's
 holdings. This positioning has proved favorable with regard to performance. High exposure to the
 liquidity factor, representing the inclusion of more-liquid, higher-turnover stocks relative to the
 benchmark, has also benefited performance. The index's active exposure (exposure relative to that of the
 benchmark) to these two factors is shown in Exhibit 3.

Exhibit 3 Wide Moat Focus Index Active Exposures: Size and Liquidity

 Size Liquidity
 1.2 1.2

 1.0 1.0

 0.8 0.8
 Smaller 0.6 More Liquid 0.6
 0.4 0.4
 0.2 0.2
 0.0 0.0
 -0.2 -0.2
 -0.4 -0.4
 Larger -0.6 Less Liquid -0.6
 -0.8 -0.8
 -1.0 -1.0
 -1.2 -1.2
 Mar-07

 Mar-08

 Mar-09

 Mar-10

 Mar-11

 Mar-12

 Mar-13

 Mar-14

 Mar-15

 Mar-16

 Mar-17

 Mar-18

 Mar-19

 Mar-20

 Mar-07

 Mar-08

 Mar-09

 Mar-10

 Mar-11

 Mar-12

 Mar-13

 Mar-14

 Mar-15

 Mar-16

 Mar-17

 Mar-18

 Mar-19

 Mar-20

Source: Morningstar Direct. Data from March 1, 2007, to Feb. 28, 2021.
Benchmark: Morningstar US Market Index.
Risk Model: Global Equity Model (USD), Standard.

 The impact of these two favorable exposures is more than offset, however, by the adverse impact of low
 exposure to the momentum factor. Momentum has exhibited the highest factor premium of the group,
 meaning that returns associated with one additional unit of momentum exposure have been higher than
 returns from incremental exposure to any of the other six factors. Accordingly, the index's consistent
 below-market momentum exposure has materially detracted from excess returns.
Page 4 of 23 Morningstar Wide Moat Focus Index Through a Factor Lens | 5 April 2021 | See Important Disclosures at the end of this report.

 Exhibit 4 Wide Moat Focus Index Active Exposure: Momentum

 Momentum
 1.2
 1.0
 0.8
 Higher 0.6
 0.4
 0.2
 0.0
 -0.2
 -0.4
 Lower -0.6
 -0.8
 -1.0
 -1.2
 Mar-07

 Mar-08

 Mar-09

 Mar-10

 Mar-11

 Mar-12

 Mar-13

 Mar-14

 Mar-15

 Mar-16

 Mar-17

 Mar-18

 Mar-19

 Mar-20
 Source: Morningstar Direct. Data from March 1, 2007, to Feb. 28, 2021.
 Benchmark: Morningstar US Market Index.
 Risk Model: Global Equity Model (USD), Standard.

 Factor Analysis Reflects the Impact of Portfolio Construction and Helps Avoid 'Unintended Bets'
 Having assessed the impact of Wide Moat Focus Index factor exposures on performance, we now
 examine how certain factor exposures came to be. For a given portfolio, factor exposures are typically
 targeted by the prevailing portfolio construction rules. Targeted factor exposures, however, can
 sometimes lead to unintended factor exposures bets as well.

 The Wide Moat Focus Index's smaller size bias relative to the benchmark is best considered an
 intentional exposure. This stems from the use of an equal-weighting approach versus the market cap-
 weighted benchmark. The use of an equal-weighted design gives each holding a roughly equivalent
 opportunity to drive returns rather than allowing performance to be largely dictated by a limited number
 of very large companies. The Wide Moat Focus Index's historical positioning in the Morningstar Style
 Box relative to that of its benchmark is included in Appendix C.

 We'd characterize the index's negative active exposure to momentum as an unintended byproduct of the
 index's valuation screen. Although this particular factor exposure has detracted from excess returns, the
 valuation screen that causes it has also paved the way for highly favorable stock selection results over
 time. One might consider it a "necessary evil." The use of a valuation screen increases portfolio turnover,
 as new, undervalued stocks replace incumbent holdings during the quarterly portfolio reconstitution
 process. When a stock performs well and its market price converges upward with our prevailing fair
 value estimate, its portfolio weighting is likely to be reduced during the upcoming quarterly
 reconstitution process if the stock is not removed from the index altogether. This process reduces
Page 5 of 23 Morningstar Wide Moat Focus Index Through a Factor Lens | 5 April 2021 | See Important Disclosures at the end of this report.

 exposure to the momentum factor but also helps ensure that constituents are, on average, trading at
 attractive valuations.

 In addition to the implications of the quarterly reconstitution process, lower momentum exposure is also
 driven by the quarterly rebalancing process that maintains an equal-weighted design. When a stock has
 performed well and establishes a higher momentum score, its portfolio weighting concurrently rises.
 However, to restore its equal weighting in the portfolio, the stock would then have its weighting
 reduced during the upcoming quarterly rebalancing process. This process likely limits overall momentum
 exposure as well.

 Factor exposure data for the Wide Moat Focus Index is particularly valuable given that we implemented
 a set of portfolio construction changes to the previously highly concentrated portfolio of just 20 holdings.
 After the second quarter of 2016, we moved to the current portfolio construction process that involves
 two subportfolios of 40 stocks each. These subportfolios are reconstituted and rebalanced quarterly but
 on a staggered basis. Given significant overlap between these two subportfolios, the full index typically
 holds 45-50 stocks. Turnover and valuation buffers were also added at that time.

 In looking at time series data, these portfolio construction changes did not have a sizable impact on the
 strategy's factor exposures. One objective was to increase the index's factor loading to momentum. On
 this front, the index seems to have moved in the desired direction, but only slightly. Regardless, we are
 pleased to see that this set of portfolio construction changes didn't lead to any unintended
 consequences as it pertains to factor exposures. Perhaps more importantly, the changes didn't impede
 favorable stock selection, which has continued to drive excess returns in recent years.

 Highlighting Two Factor-Related Misconceptions About the Wide Moat Focus Index
 Tangential to the discussion of intended factor bets, we are frequently asked about the Wide Moat
 Focus Index's exposure to the value/growth and quality factors. Most are surprised to learn that, on
 average, the index has not exhibited a style bias toward value at the expense of growth and has a
 quality factor loading below that of the broader market.

 Despite Its Current Style Bias, the Wide Moat Focus Index Can't Be Considered a 'Value' Strategy
 Given the index's use of a valuation screen, some would suspect we are targeting a style bias toward
 value at the expense of growth. We stress, however, that the equity research methodology employed by
 Morningstar equity analysts is style-agnostic when it comes to uncovering undervalued stocks. While
 the Wide Moat Focus Index utilizes a stock's valuation to determine eligibility, it is by no means a "value
 investing" strategy. This is evident when looking at the index's historical positioning, as it has oscillated
 between value and growth over the course of its more than 14-year live track record.
Page 6 of 23 Morningstar Wide Moat Focus Index Through a Factor Lens | 5 April 2021 | See Important Disclosures at the end of this report.

 Exhibit 5 Wide Moat Focus Index Active Exposure: Value/Growth

 Value-Growth
 1.2
 1.0
 0.8
 Growth
 0.6
 Bias
 0.4
 0.2
 0.0
 -0.2
 -0.4
 Value
 -0.6
 Bias
 -0.8
 -1.0
 -1.2
 Mar-07

 Mar-08

 Mar-09

 Mar-10

 Mar-11

 Mar-12

 Mar-13

 Mar-14

 Mar-15

 Mar-16

 Mar-17

 Mar-18

 Mar-19

 Mar-20
 Source: Morningstar Direct. Data from March 1, 2007, to Feb. 28, 2021.
 Benchmark: Morningstar US Market Index.
 Risk Model: Global Equity Model (USD), Standard.

 However, while the index has historically operated in the core or blend style band, a notable bias toward
 value has emerged in recent years. In fact, the portfolio currently exhibits a value bias at the expense of
 growth nearly as large as it has ever been. A similar value bias emerged in mid-2018, but the index
 returned to an even balance between value and growth by late 2019.

 The index's current positioning doesn't necessarily reflect a top-down house view that value is likely to
 outperform growth. Instead, it reflects the aggregation of valuation conclusions provided by Morningstar
 equity analysts via bottom-up fundamental analysis across numerous companies. It indicates that,
 across all U.S. wide-moat-rated stocks covered by the Morningstar equity research team, a greater
 proportion of value stocks are trading at attractive valuations relative to growth stocks. The cohort of
 U.S. wide-moat companies typically is roughly 140, a small portion of Morningstar's coverage of more
 than 1,500 stocks and a very small portion of the broader U.S. equity market.

 Based on factor attribution analysis, the underlying rotation between value and growth, in isolation, has
 had effectively no impact on excess returns. However, the turnover of individual holdings that drives
 these portfolio-level changes has meaningfully contributed to the index's impressive stock selection over
 time. Accordingly, we believe that the index's freedom to move back and forth between the two style
 orientations has helped augment returns versus other comparable strategies that are, by design,
 constrained to a specific style box.
Page 7 of 23 Morningstar Wide Moat Focus Index Through a Factor Lens | 5 April 2021 | See Important Disclosures at the end of this report.

 The Wide Moat Focus Index Exhibits a Lower Quality Factor Loading Than the Broader Market
 The concept of an economic moat is often conflated with business quality. In this vein, given that the
 Wide Moat Focus Index includes only companies with wide economic moats, most would expect to see a
 heavy loading to the quality factor. However, this is not the case, as the index has actually exhibited a
 below-market exposure to the quality factor. While the bias toward lower-quality companies has been
 modest, it has proved fairly consistent over time.

 Exhibit 6 Wide Moat Focus Index Active Exposure: Quality

 Quality
 1.2
 1.0
 0.8
 Higher
 0.6
 Quality
 0.4
 0.2
 0.0
 -0.2
 -0.4
 Lower -0.6
 Quality
 -0.8
 -1.0
 -1.2
 Mar-07

 Mar-08

 Mar-09

 Mar-10

 Mar-11

 Mar-12

 Mar-13

 Mar-14

 Mar-15

 Mar-16

 Mar-17

 Mar-18

 Mar-19

 Mar-20
 Source: Morningstar Direct. Data from March 1, 2007, to Feb. 28, 2021.
 Benchmark: Morningstar US Market Index.
 Risk Model: Global Equity Model (USD), Standard.

 In part, we believe this counterintuitive dynamic is due to the fact that our economic moat ratings are
 forward-looking while quality factor metrics are inherently backward-looking. The Morningstar Global
 Risk Model calculates the quality factor score of a stock by considering the company's trailing 12-month
 return on equity and its trailing 12-month debt/capital ratio. However, when assigning economic moats,
 Morningstar equity analysts consider economic profit forecasts many years into the future. A wide
 economic moat rating requires the belief that a company, with near certainty, will generate economic
 profits 10 years into the future and, more likely than not, will generate economic profits 20 years into the
 future. Companies that have delivered healthy economic profits in the past and have likely scored well
 on these two quality metrics along the way are by no means certain to do so into the future. In fact,
 companies that earn outsize economic profits often have the biggest targets on their backs in terms of
 inspiring new competition.
Page 8 of 23 Morningstar Wide Moat Focus Index Through a Factor Lens | 5 April 2021 | See Important Disclosures at the end of this report.

 Apple serves as a relevant case study. We assign only a narrow moat rating to Apple due to the rapid
 pace of technological change across its industry, combined with the considerable length of our 20-year
 wide moat assessment period. Apple scores quite well across just about any backward-looking quality
 metric but is ineligible for the Wide Moat Focus Index absent a wide economic moat.

 On the other side of the coin, many companies that might not score well on backward-looking quality
 metrics can still earn a wide economic moat rating, given our forward-looking judgments about their
 prospects. Amazon is one such example. Amazon has forgone higher near-term profits in the name of
 greater long-term gains via its commitment to massive reinvestment. This strategy has weighed on its
 quality factor score in recent years. However, Morningstar analysts believe it will pay off handsomely, as
 evidenced by the wide economic moat we assign to the company.

 The Wide Moat Focus Index's valuation screen also helps explain its low-quality exposure. Often, wide-
 moat-rated stocks become attractively priced when the underlying company is navigating some sort of
 headwind, whether company-specific or industrywide. If the Morningstar equity research team believes
 the challenge will materially decrease long-term cash flows, a fair value estimate reduction is likely, and
 sometimes, the economic moat rating will be downgraded to narrow from wide. However, when a
 stock's moat rating remains wide amid such a situation and the market punishes its valuation by a
 greater magnitude than that reflected by our analyst's fair value estimate reduction, an attractive entry
 point will sometimes emerge. This dynamic often leads to new additions to the Wide Moat Focus Index.
 However, these situations still typically lead to a lower quality factor score. Indeed, a company's trailing
 12-month return on equity and its debt/capital metrics can worsen when a company is fighting to
 overcome a meaningful headwind.

 When Morningstar equity analysts reiterate a company's wide moat rating amid this type of situation,
 they are typically implying that the company's quality metrics might recover, to some degree, over time.
 When a holding's quality factor score does eventually start to recover in this manner, its market price
 often recovers as well. The stock might then be replaced in the Wide Moat Focus Index by a new
 holding with a more attractive valuation that is, in its own right, experiencing a temporary decrease to
 its quality factor score.

 Overall, it is more appropriate to consider the economic moat rating an indicator of future quality than to
 conflate it with backward-looking quality metrics. This reflects how unique the Morningstar economic
 moat rating truly is and highlights its importance in determining Wide Moat Focus Index holdings.
Page 9 of 23 Morningstar Wide Moat Focus Index Through a Factor Lens | 5 April 2021 | See Important Disclosures at the end of this report.

 Stock Selection Remains the Key Performance Driver for the Wide Moat Focus Index
 Effective Stock-Picking Has Accounted for Nearly All the Index's Historical Excess Returns
 While it's important to monitor a portfolio's factor exposures and assess the performance impact they've
 had, it's also critical to track the impact of stock selection. The Wide Moat Focus Index's portfolio
 construction rules are designed to let Morningstar's best U.S. wide-moat stock ideas drive performance.
 The index is not designed to rely on recurring favorable performance for any individual factor.

 In practice, this is what we've observed. Stock selection has explained 92% of the index's cumulative
 excess returns since its live inception, with factor exposures tied to style, sector, region, and currency
 accounting for the balance.

Exhibit 7 Wide Moat Focus Index: Risk Factor Attribution, Cumulative Excess Returns vs. Benchmark %

 250

 200
 Excess Return %

 Total Return
 150
 Stock Specific
 Factor Total
 92%
 100 Style
 Sector
 Region
 50 Currency

 8%
 0

 -50
 2008 2009 2010 2011 2012 2013 2014 2015 2016 2017 2018 2019 2020

Source: Morningstar Direct. Data from Jan. 1, 2008, to Dec. 31, 2020.
Benchmark: Morningstar US Market Index.
Risk Model: Global Equity Model (USD).

 In looking at the time series, the Wide Moat Focus Index enjoyed a notable performance tailwind from
 its active factor exposures in 2009 amid the market's recovery from the financial crisis. However, the
 impact of active factor exposures on performance has been immaterial over the many years since then.
 Since 2009, stock selection has almost exclusively driven excess returns.
Page 10 of 23 Morningstar Wide Moat Focus Index Through a Factor Lens | 5 April 2021 | See Important Disclosures at the end of this report.

 Factor Profile Comparison: Wide Moat Focus Index vs. Wide Moat Index
 The Wide Moat Focus Index's Valuation Screen Has Only a Modest Impact on Factor Exposures
 In addition to the Wide Moat Focus Index, Morningstar also offers the Wide Moat Index. The Wide Moat
 Index is very similar in that it includes only U.S. wide-moat-rated stocks on an equal-weighted basis. It is
 also reconstituted and rebalanced quarterly. The primary difference is that the Wide Moat Focus Index
 employs a valuation screen—hence the word focus—and the Wide Moat Index does not. The Wide
 Moat Focus Index typically holds 45-50 stocks out of the roughly 140 U.S. wide-moat-rated stocks
 covered by Morningstar equity analysts. The Wide Moat Index simply holds all of these U.S. wide-moat-
 rated stocks.

 The existence of the Wide Moat Index allows us to analyze how the Wide Moat Focus Index's valuation
 screen has affected its factor exposures. These factor profiles are included in Exhibit 8, with the Wide
 Moat Focus Index on the left and the Wide Moat Index on the right.

Exhibit 8 Wide Moat Focus Index (Left) vs. Wide Moat Index (Right): Factor Profile Comparison

Source: Morningstar Direct. Data from Feb. 1, 2016, to Jan. 31, 2021.
Benchmark: Morningstar US Market Index.
Page 11 of 23 Morningstar Wide Moat Focus Index Through a Factor Lens | 5 April 2021 | See Important Disclosures at the end of this report.

 At first glance, there are no glaring deviations between the Wide Moat Focus Index and the Wide Moat
 Index after the valuation screen is implemented. With regard to current positioning, both indexes are
 overweight and underweight the same factors relative to the broader market.

 However, in looking at positioning of the two indexes relative to one another, there are some notable
 deviations. First, the Wide Moat Focus Index has typically exhibited greater exposure to value at the
 expense of growth from a style perspective. While we believe growth stocks and value stocks alike can
 certainly be mispriced, it does seem intuitive that the search for attractive valuations will typically lead
 to a greater proportion of value-oriented stocks. Of course, this is not always how the two indexes are
 positioned, as the historical range for each extends into both style territories.

 Their relative momentum exposure also stands out, with the Wide Moat Focus Index exhibiting a lighter
 loading to the momentum factor. This stems from the Wide Moat Focus Index's more frequent turnover
 in search of attractive valuations. However, the Wide Moat Index's below-market momentum exposure
 indicates that U.S. wide-moat stocks, in general, don't exhibit strong momentum characteristics. We'd
 also note a higher loading to the volatility factor for the Wide Moat Index. Again, this is to be expected
 due to the notion that undervalued stocks might have become more attractively priced thanks to some
 sort of headwind that has weighed on share prices.

 Finally, while the Wide Moat Index exhibits a below-market exposure to quality, the Wide Moat Focus
 Index's valuation screen further reduces this exposure.

 In conclusion, aggregated factor exposures have represented a negative impact on the relative
 performance of the Wide Moat Focus Index. Despite this impact being only modest, it is still important to
 monitor these factor exposures. Doing so helps ensure that the index is not making impactful
 unintended bets. It also helps contextualize index performance over a given period. Finally, factor
 analysis helps inform how the index might best be employed in the context of a broader portfolio. K
Page 12 of 23 Morningstar Wide Moat Focus Index Through a Factor Lens | 5 April 2021 | See Important Disclosures at the end of this report.

 Appendix A: Traditional Style Factor Definitions
 Size
 The size factor is the normalized value of the logarithm of a firm's market capitalization:

 , = − � , �

 The factor is unbounded, and higher scores indicate smaller market capitalization. A score of 0 indicates
 an average level of market capitalization.

 Liquidity
 The liquidity factor is the normalized value of the stock's raw share turnover. The raw share turnover
 score is calculated as the logarithm of the average trading volume divided by shares outstanding over
 the past 30 days. It is essentially a churn rate for a stock and represents how frequently the shares get
 traded.

 1 ,
 ℎ , = � � � , ℎ = 30
 ,
 =1

 The factor is unbounded, and higher scores indicate higher liquidity. A score of 0 indicates an average
 level of liquidity.

 Yield
 The yield factor is expressed as a total yield, which is the sum of the trailing 12-month buyback and
 dividend yield of a company. Higher values indicate larger, positive yield exposure:

 = +

 The factor is unbounded, and higher scores indicate higher yield. A score of 0 indicates an average level
 of quality.

 Value/Growth (Standard Model)
 Value/growth reflects the aggregate expectations of market participants for the future growth and
 required rate of return for a stock. For this version used in the Standard Factor model, we use the raw
 style score from the style box as the input for calculating the value/growth exposure of stocks. The raw
 style score is calculated as the difference between a stock's growth score and value score:

 = ℎ − .

 The value score is the weighted average of a stock's prospective earnings (E), book value (BV), revenue
 (R), cash flow (CF), and dividend (D), all scaled by the current price of the stock:

 = � × + × + × + × + × �.
Page 13 of 23 Morningstar Wide Moat Focus Index Through a Factor Lens | 5 April 2021 | See Important Disclosures at the end of this report.

 The growth score of a stock is the weighted average of the growth rates in a company's earnings (E),
 book value (BV), revenue (R), and cash flow (CF):

 ℎ = � × ℎ + × ℎ + × ℎ + × ℎ �.

 The factor is unbounded, and higher scores indicate higher liquidity. A score of 0 indicates an average
 level of liquidity.

 Quality
 We define a quality score of a stock as the equally weighted z-score of a company's profitability (trailing
 12-month return on equity) and the z-score of its financial leverage (trailing 12-month debt/capital). The
 z-score is with respect to all the stocks in the global universe.

 1
 = � + �1 − � �.
 2

 is the trailing 12-month return on equity and the subscript z indicates a z-score.

 The factor is unbounded, and higher scores indicate higher quality. A score of 0 indicates an average
 level of quality.

 Volatility (Standard Model)
 The volatility score for the Standard model is defined as the trailing 12-month volatility of daily returns of
 a stock.

 ∑
 =1( −
 �)
 2
 = �
 − 1

 The factor is unbounded, and higher scores indicate higher volatility. A score of 0 indicates an average
 level of volatility.

 Momentum
 The momentum factor is the normalized value of the stock price's raw momentum score. The raw
 momentum score is calculated as the cumulative return of a stock from 365 calendar days ago to 30 days
 ago. This is the classical 12-1 momentum formulation except using daily return data as opposed to
 monthly. To compute, U.S. dollar currency returns are used.
 −30

 , = � � �1 + , � − (1 + )�
 −365

 The factor is unbounded, and higher scores indicate higher returns over the past year as well as a
 propensity for higher returns in the future. A score of 0 indicates an average level of momentum.
Page 14 of 23 Morningstar Wide Moat Focus Index Through a Factor Lens | 5 April 2021 | See Important Disclosures at the end of this report.
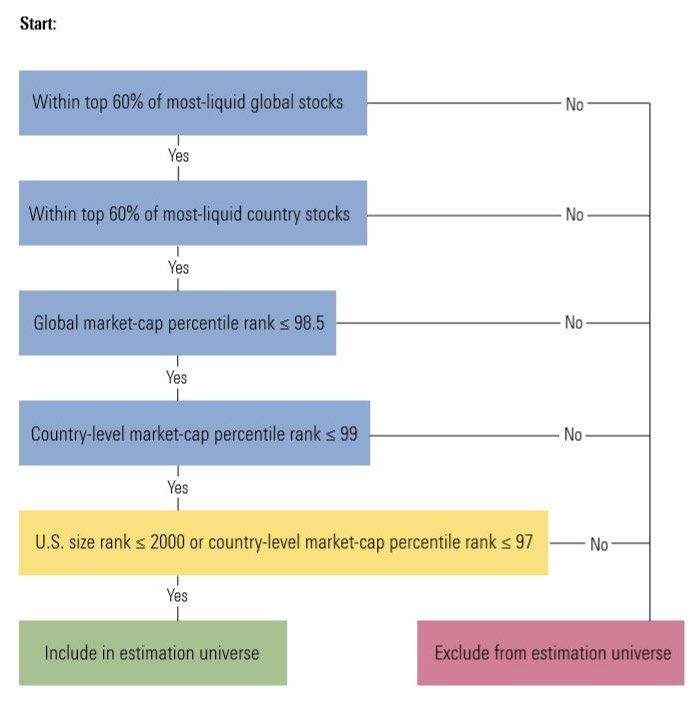
Appendix B: Global Risk Model Estimation Universe Construction
For all securities, we calculate the liquidity and percentile rank of market capitalization at world and
country levels at daily frequency. Liquidity is the median dollar trading volume over the past 91 trailing
days. We define the percentile rank of market capitalization as {total market capitalization of companies
whose market capitalization is greater than or equal to the company in question} / {market capitalization
of all companies} * 100, where the stock with the largest market capitalization gets the smallest
percentile rank.
We include the stock of a company into the estimation universe if it satisfies the following requirements:
Exhibit 1B Global Risk Model: Estimation Universe Construction Logic
Source: Morningstar.
For the U.S. stocks, if the number of stocks that satisfies the four criteria is less than 2,000, we add the
most liquid U.S. stocks back into the universe to achieve this total. These U.S. stocks must have a U.S.-
size rank ≤ 2000 and have a percentile rank of U.S. market capitalization ≤ 99. The size rank is a rank
based on the sum of a stock's market capitalization rank, where the stock with largest market
capitalization gets a rank of 1, and its liquidity rank, where the stock with highest liquidity gets a rank of
1. The stock with the lowest sum is given a size rank of 1.
We include shares having a foreign ownership limit, like China A stocks, and we do not use free float-
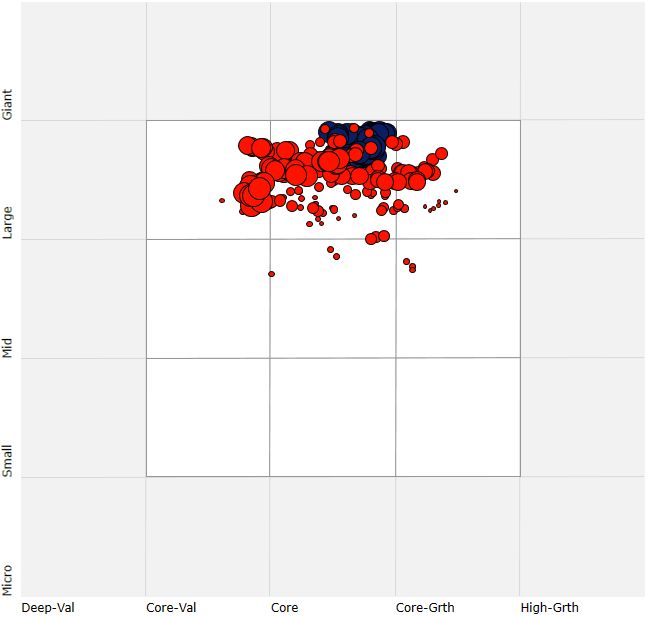
adjusted market cap.Page 15 of 23 Morningstar Wide Moat Focus Index Through a Factor Lens | 5 April 2021 | See Important Disclosures at the end of this report. Appendix C: Size/Style Positioning Exhibit 1C Wide Moat Focus Index: Size/Style Positioning Source: Morningstar Direct. Data from March 1, 2007, to Feb. 28, 2021. Benchmark: Morningstar US Market Index.
Page 16 of 23 Morningstar Wide Moat Focus Index Through a Factor Lens | 5 April 2021 | See Important Disclosures at the end of this report.

 Appendix D: Size/Style Positioning
 The risk factor premiums shown in Exhibit 1D reflect average returns for one unit of extra exposure to a
 given factor after the impact of all other risk factors has been accounted for. This data is not related to
 the Wide Moat Focus Index in any way. It reflects only the historical performance of the factors
 themselves.

Exhibit 1D Wide Moat Focus Index: Risk Factor Premiums

 40

 30

 20 Momentum
 Size
 Cumulative Return %

 10
 Quality
 0 Liquidity
 Yield
 -10
 Value-Growth
 -20 Volatility

 -30

 -40
 Feb-07

 Feb-08

 Feb-09

 Feb-10

 Feb-11

 Feb-12

 Feb-13

 Feb-14

 Feb-15

 Feb-16

 Feb-17

 Feb-18

 Feb-19

 Feb-20

 Feb-21
Source: Morningstar Direct. Data from March 1, 2007, to Feb. 28, 2021.
Benchmark: Morningstar US Market Index.
Risk Model: Global Equity Model (USD).
Page 17 of 23 Morningstar Wide Moat Focus Index Through a Factor Lens | 5 April 2021 | See Important Disclosures at the end of this report.

 Research Methodology for Valuing Companies

 Overview
 At the heart of our valuation system is a detailed projection of a company's future cash flows, resulting from our analysts' research.
 Analysts create custom industry and company assumptions to feed income statement, balance sheet, and capital investment
 assumptions into our globally standardized, proprietary discounted cash flow, or DCF, modeling templates. We use scenario
 analysis, in-depth competitive advantage analysis, and a variety of other analytical tools to augment this process. Moreover, we
 think analyzing valuation through discounted cash flows presents a better lens for viewing cyclical companies, high-growth firms,
 businesses with finite lives (for example, mines), or companies expected to generate negative earnings over the next few years.
 That said, we don't dismiss multiples altogether but rather use them as supporting cross-checks for our DCF-based fair value
 estimates. We also acknowledge that DCF models offer their own challenges (including a potential proliferation of estimated
 inputs and the possibility that the method may miss short-term market-price movements), but we believe these negatives are
 mitigated by deep analysis and our long-term approach.

 Morningstar's equity research group ("we," "our") believes that a company's intrinsic worth results from the future cash flows it
 can generate. The Morningstar Rating for stocks identifies stocks trading at a discount or premium to their intrinsic worth—or fair
 value estimate, in Morningstar terminology. Five-star stocks sell for the biggest risk-adjusted discount to their fair values, whereas
 1-star stocks trade at premiums to their intrinsic worth.

 Morningstar Research Methodology

 Source: Morningstar.

 Four key components drive the Morningstar rating: 1) our assessment of the firm's economic moat, 2) our estimate of the stock's
 fair value, 3) our uncertainty around that fair value estimate and 4) the current market price. This process ultimately culminates in
 our single-point star rating.

 Economic Moat
 The concept of an economic moat plays a vital role not only in our qualitative assessment of a firm's long-term investment
 potential, but also in the actual calculation of our fair value estimates. An economic moat is a structural feature that allows a firm
 to sustain excess profits over a long period of time. We define economic profits as returns on invested capital (or ROIC) over and
 above our estimate of a firm's cost of capital, or weighted average cost of capital (or WACC). Without a moat, profits are more
 susceptible to competition. We have identified five sources of economic moats: intangible assets, switching costs, network effect,
 cost advantage, and efficient scale.

 Companies with a narrow moat are those we believe are more likely than not to achieve normalized excess returns for at least the
 next 10 years. Wide-moat companies are those in which we have very high confidence that excess returns will remain for 10 years,
 with excess returns more likely than not to remain for at least 20 years. The longer a firm generates economic profits, the higher its
 intrinsic value. We believe low-quality, no-moat companies will see their normalized returns gravitate toward the firm's cost of
 capital more quickly than companies with moats.

 To assess the sustainability of excess profits, analysts perform ongoing assessments of the moat trend. A firm's moat trend is
 positive in cases where we think its sources of competitive advantage are growing stronger; stable where we don't anticipate
 changes to competitive advantages over the next several years; or negative when we see signs of deterioration.

 Estimated Fair Value
 Combining our analysts' financial forecasts with the firm's economic moat helps us assess how long returns on invested capital are
 likely to exceed the firm's cost of capital. Returns of firms with a wide economic moat rating are assumed to fade to the perpetuity
Page 18 of 23 Morningstar Wide Moat Focus Index Through a Factor Lens | 5 April 2021 | See Important Disclosures at the end of this report. period over a longer period of time than the returns of narrow-moat firms, and both will fade slower than no-moat firms, increasing our estimate of their intrinsic value. Our model is divided into three distinct stages: Stage I: Explicit Forecast In this stage, which can last five to 10 years, analysts make full financial statement forecasts, including items such as revenue, profit margins, tax rates, changes in working-capital accounts, and capital spending. Based on these projections, we calculate earnings before interest, after taxes, or EBI, and the net new investment, or NNI, to derive our annual free cash flow forecast. Stage II: Fade The second stage of our model is the period it will take the company's return on new invested capital—the return on capital of the next dollar invested, or RONIC—to decline (or rise) to its cost of capital. During the Stage II period, we use a formula to approximate cash flows in lieu of explicitly modeling the income statement, balance sheet, and cash flow statement as we do in Stage I. The length of the second stage depends on the strength of the company's economic moat. We forecast this period to last anywhere from one year (for companies with no economic moat) to 10–15 years or more (for wide-moat companies). During this period, cash flows are forecast using four assumptions: an average growth rate for EBI over the period, a normalized investment rate, average return on new invested capital (RONIC), and the number of years until perpetuity, when excess returns cease. The investment rate and return on new invested capital decline until a perpetuity value is calculated. In the case of firms that do not earn their cost of capital, we assume marginal ROICs rise to the firm's cost of capital (usually attributable to less reinvestment), and we may truncate the second stage. Stage III: Perpetuity Once a company's marginal ROIC hits its cost of capital, we calculate a continuing value, using a standard perpetuity formula. At perpetuity, we assume that any growth or decline or investment in the business neither creates nor destroys value and that any new investment provides a return in line with estimated WACC. Because a dollar earned today is worth more than a dollar earned tomorrow, we discount our projections of cash flows in stages I, II, and III to arrive at a total present value of expected future cash flows. Because we are modeling free cash flow to the firm— representing cash available to provide a return to all capital providers—we discount future cash flows using the WACC, which is a weighted average of the costs of equity, debt, and preferred stock (and any other funding sources), using expected future proportionate long-term market-value weights. Uncertainty Around That Fair Value Estimate Morningstar's Uncertainty Rating captures a range of likely potential intrinsic values for a company and uses it to assign the margin of safety required before investing, which in turn explicitly drives our stock star rating system. The Uncertainty Rating represents the analysts' ability to bound the estimated value of the shares in a company around the Fair Value Estimate, based on the characteristics of the business underlying the stock, including operating and financial leverage, sales sensitivity to the overall economy, product concentration, pricing power, and other company-specific factors. Analysts consider at least two scenarios in addition to their base case: a bull case and a bear case. Assumptions are chosen such that the analyst believes there is a 25% probability that the company will perform better than the bull case, and a 25% probability that the company will perform worse than the bear case. The distance between the bull and bear cases is an important indicator of the uncertainty underlying the fair value estimate. Our recommended margin of safety widens as our uncertainty of the estimated value of the equity increases. The more uncertain we are about the estimated value of the equity, the greater the discount we require relative to our estimate of the value of the firm before we would recommend the purchase of the shares. In addition, the uncertainty rating provides guidance in portfolio construction based on risk tolerance. Our uncertainty ratings for our qualitative analysis are low, medium, high, very high, and extreme. × Low–margin of safety for 5-star rating is a 20% discount and for 1-star rating is 25% premium. × Medium–margin of safety for 5-star rating is a 30% discount and for 1-star rating is 35% premium. × High–margin of safety for 5-star rating is a 40% discount and for 1-star rating is 55% premium. × Very High–margin of safety for 5-star rating is a 50% discount and for 1-star rating is 75% premium. × Extreme– margin of safety for 5-star rating is a 75% discount and for 1-star rating is 300% premium.
Page 19 of 23 Morningstar Wide Moat Focus Index Through a Factor Lens | 5 April 2021 | See Important Disclosures at the end of this report.

 Morningstar Equity Research Star Rating Methodology

 Market Price
 The market prices used in this analysis and noted in the report come from exchange on which the stock is listed which we believe
 is a reliable source.

 For more details about our methodology, please go to https://shareholders.morningstar.com.

 Morningstar Star Rating for Stocks
 Once we determine the fair value estimate of a stock, we compare it with the stock's current market price on a daily basis, and the
 star rating is automatically re-calculated at the market close on every day the market on which the stock is listed is open. Our
 analysts keep close tabs on the companies they follow, and, based on thorough and ongoing analysis, raise or lower their fair
 value estimates as warranted.

 Please note, there is no predefined distribution of stars. That is, the percentage of stocks that earn 5 stars can fluctuate daily, so
 the star ratings, in the aggregate, can serve as a gauge of the broader market's valuation. When there are many 5-star stocks, the
 stock market as a whole is more undervalued, in our opinion, than when very few companies garner our highest rating.

 We expect that if our base-case assumptions are true the market price will converge on our fair value estimate over time, generally
 within three years (although it is impossible to predict the exact time frame in which market prices may adjust).

 Our star ratings are guideposts to a broad audience and individuals must consider their own specific investment goals, risk
 tolerance, tax situation, time horizon, income needs, and complete investment portfolio, among other factors.
Page 20 of 23 Morningstar Wide Moat Focus Index Through a Factor Lens | 5 April 2021 | See Important Disclosures at the end of this report.

 The Morningstar Star Ratings for stocks are defined below:

 QQQQQ We believe appreciation beyond a fair risk-adjusted return is highly likely over a multiyear time frame. Scenario
 analysis developed by our analysts indicates that the current market price represents an excessively pessimistic outlook, limiting
 downside risk and maximizing upside potential.

 QQQQ We believe appreciation beyond a fair risk-adjusted return is likely.

 QQQ Indicates our belief that investors are likely to receive a fair risk-adjusted return (approximately cost of equity).

 QQ We believe investors are likely to receive a less than fair risk-adjusted return.

 Q Indicates a high probability of undesirable risk-adjusted returns from the current market price over a multiyear time frame,
 based on our analysis. Scenario analysis by our analysts indicates that the market is pricing in an excessively optimistic outlook,
 limiting upside potential and leaving the investor exposed to Capital loss.

 Risk Warning
 Please note that investments in securities are subject to market and other risks and there is no assurance or guarantee that the
 intended investment objectives will be achieved. Past performance of a security may or may not be sustained in future and is no
 indication of future performance. A security investment return and an investor's principal value will fluctuate so that, when
 redeemed, an investor's shares may be worth more or less than their original cost. A security's current investment performance
 may be lower or higher than the investment performance noted within the report. Morningstar's Uncertainty Rating serves as a
 useful data point with respect to sensitivity analysis of the assumptions used in our determining a fair value price.

 General Disclosure
 Unless otherwise provided in a separate agreement, recipients accessing this report may only use it in the country in which the
 Morningstar distributor is based. Unless stated otherwise, the original distributor of the report is Morningstar Research Services
 LLC, a U.S.A. domiciled financial institution.

 This report is for informational purposes only and has no regard to the specific investment objectives, financial situation, or
 particular needs of any specific recipient. This publication is intended to provide information to assist institutional investors in
 making their own investment decisions, not to provide investment advice to any specific investor. Therefore, investments discussed
 and recommendations made herein may not be suitable for all investors; recipients must exercise their own independent judgment
 as to the suitability of such investments and recommendations in the light of their own investment objectives, experience, taxation
 status, and financial position.

 The information, data, analyses, and opinions presented herein are not warranted to be accurate, correct, complete, or timely.
 Unless otherwise provided in a separate agreement, neither Morningstar, Inc. nor the Equity Research Group represents that the
 report contents meet all of the presentation and/or disclosure standards applicable in the jurisdiction the recipient is located.

 Except as otherwise required by law or provided for in a separate agreement, the analyst, Morningstar, Inc. and the Equity
 Research Group and their officers, directors and employees shall not be responsible or liable for any trading decisions, damages or
 other losses resulting from, or related to, the information, data, analyses or opinions within the report. The Equity Research Group
 encourages recipients of this report to read all relevant issue documents for example, prospectus) pertaining to the security
 concerned, including without limitation, information relevant to its investment objectives, risks, and costs before making an
 investment decision and when deemed necessary, to seek the advice of a legal, tax, and/or accounting professional.

 The Report and its contents are not directed to, or intended for distribution to or use by, any person or entity who is a citizen or
 resident of or located in any locality, state, country, or other jurisdiction where such distribution, publication, availability or use
 would be contrary to law or regulation or which would subject Morningstar, Inc. or its affiliates to any registration or licensing
 requirements in such jurisdiction.

 Where this report is made available in a language other than English and in the case of inconsistencies between the English and
 translated versions of the report, the English version will control and supersede any ambiguities associated with any part or
 section of a report that has been issued in a foreign language. Neither the analyst, Morningstar, Inc., nor the Equity Research
 Group guarantees the accuracy of the translations.
Page 21 of 23 Morningstar Wide Moat Focus Index Through a Factor Lens | 5 April 2021 | See Important Disclosures at the end of this report.

 This report may be distributed in certain localities, countries and/or jurisdictions ("Territories") by independent third parties or
 independent intermediaries and/or distributors ("Distributors"). Such Distributors are not acting as agents or representatives of the
 analyst, Morningstar, Inc. or the Equity Research Group. In Territories where a Distributor distributes our report, the Distributor is
 solely responsible for complying with all applicable regulations, laws, rules, circulars, codes, and guidelines established by local
 and/or regional regulatory bodies, including laws in connection with the distribution third-party research reports.

 Conflicts of Interest
 × No interests are held by the analyst with respect to the security subject of this investment research report.

 Morningstar, Inc. may hold a long position in the security subject of this investment research report that exceeds 0.5% of the total
 issued share capital of the security. To determine if such is the case, please click http://msi.morningstar.com and
 http://mdi.morningstar.com.

 × Analysts' compensation is derived from Morningstar, Inc.'s overall earnings and consists of salary, bonus and in some cases
 restricted stock.

 × Neither Morningstar, Inc. nor the Equity Research Group receives commissions for providing research nor do they charge
 companies to be rated.

 × Neither Morningstar, Inc. nor the Equity Research Group is a market maker or a liquidity provider of the security noted within
 this report.

 × Neither Morningstar, Inc. nor the Equity Research Group has been a lead manager or co-lead manager over the previous 12
 months of any publicly disclosed offer of financial instruments of the issuer.

 × Morningstar, Inc.'s investment management group does have arrangements with financial institutions to provide portfolio
 management/investment advice some of which an analyst may issue investment research reports on. However, analysts do not
 have authority over Morningstar's investment management group's business arrangements nor allow employees from the
 investment management group to participate or influence the analysis or opinion prepared by them.

 × Morningstar, Inc. is a publicly traded company (Ticker Symbol: MORN) and thus a financial institution the security of which is the
 subject of this report may own more than 5% of Morningstar, Inc.'s total outstanding shares. Please access Morningstar, Inc.'s
 proxy statement, "Security Ownership of Certain Beneficial Owners and Management" section
 http://investorrelations.morningstar.com/sec.cfm?doctype=Proxy&year=&x=12

 × Morningstar, Inc. may provide the product issuer or its related entities with services or products for a fee and on an arms' length
 basis including software products and licenses, research and consulting services, data services, licenses to republish our ratings
 and research in their promotional material, event sponsorship and website advertising.

 Further information on Morningstar, Inc.'s conflict of interest policies is available from
 http://global.morningstar.com/equitydisclosures. Also, please note analysts are subject to the CFA Institute's Code of Ethics and
 Standards of Professional Conduct.

 For a list of securities which the Equity Research Group currently covers and provides written analysis on please contact your local
 Morningstar office. In addition, for historical analysis of securities covered, including their fair value estimate, please contact your
 local office.

 For Recipients in Australia: This Report has been issued and distributed in Australia by Morningstar Australasia Pty. Ltd. (ABN:
 95 090 665 544; ASFL: 240892). Morningstar Australasia Pty. Ltd. is the provider of the general advice ("the Service") and takes
 responsibility for the production of this report. The Service is provided through the research of investment products. To the extent
 the Report contains general advice it has been prepared without reference to an investor's objectives, financial situation or needs.
 Investors should consider the advice in light of these matters and, if applicable, the relevant Product Disclosure Statement before
 making any decision to invest. Refer to our Financial Services Guide, or FSG, for more information at
 http://www.morningstar.com.au/fsg.pdf.

 For Recipients in Hong Kong: The Report is distributed by Morningstar Investment Management Asia Limited, which is regulated
 by the Hong Kong Securities and Futures Commission to provide services to professional investors only. Neither Morningstar
Page 22 of 23 Morningstar Wide Moat Focus Index Through a Factor Lens | 5 April 2021 | See Important Disclosures at the end of this report. Investment Management Asia Limited, nor its representatives, are acting or will be deemed to be acting as an investment advisor to any recipients of this information unless expressly agreed to by Morningstar Investment Management Asia Limited. For enquiries regarding this research, please contact a Morningstar Investment Management Asia Limited Licensed Representative at http://global.morningstar.com/equitydisclosures. For Recipients in India: This Investment Research is issued by Morningstar Investment Adviser India Private Limited. Morningstar Investment Adviser India Private Limited is registered with the Securities and Exchange Board of India (Registration number INA000001357) and provides investment advice and research. Morningstar Investment Adviser India Private Limited has not been the subject of any disciplinary action by SEBI or any other legal/regulatory body. Morningstar Investment Adviser India Private Limited is a wholly owned subsidiary of Morningstar Investment Management LLC. In India, Morningstar Investment Adviser India Private Limited has one associate, Morningstar India Private Limited, which provides data related services, financial data analysis and software development. The Research Analyst has neither served as an officer, director or employee of the fund company within the last 12 months, nor has it or its associates engaged in market making activity for the fund company. *The Conflicts of Interest disclosure above also applies to relatives and associates of Manager Research Analysts in India. The Conflicts of Interest disclosure above also applies to associates of Manager Research Analysts in India. The terms and conditions on which Morningstar Investment Adviser India Private Limited offers Investment Research to clients, varies from client to client, and are detailed in the respective client agreement. For recipients in Japan: The Report is distributed by Ibbotson Associates Japan, Inc., which is regulated by Financial Services Agency. Neither Ibbotson Associates Japan, Inc., nor its representatives, are acting or will be deemed to be acting as an investment advisor to any recipients of this information. For recipients in Singapore: For Institutional Investor audiences only. Recipients of this report should contact their financial adviser in Singapore in relation to this report. Morningstar, Inc., and its affiliates, relies on certain exemptions (Financial Advisers Regulations, Section 32B and 32C) to provide its investment research to recipients in Singapore.
Page 23 of 23 Morningstar Wide Moat Focus Index Through a Factor Lens | 5 April 2021 | See Important Disclosures at the end of this report.

 About Morningstar® Institutional Equity ResearchTM
 Morningstar Institutional Equity Research provides independent, fundamental equity research
 differentiated by a consistent focus on sustainable competitive advantages, or Economic Moats.

 For More Information
 +1 312 696-6869
 equitysupport@morningstar.com

 ?
 22 West Washington Street
 Chicago, IL 60602 USA

 ©2021 Morningstar. All Rights Reserved. Unless otherwise provided in a separate agreement, you may use this report only
 in the country in which its original distributor is based. The information, data, analyses, and opinions presented herein do not
 constitute investment advice; are provided solely for informational purposes and therefore are not an offer to buy or sell a
 security; and are not warranted to be correct, complete, or accurate. The opinions expressed are as of the date written and are
 subject to change without notice. Except as otherwise required by law, Morningstar shall not be responsible for any trading
 decisions, damages, or other losses resulting from, or related to, the information, data, analyses, or opinions or their use.
 References to "DBRS Morningstar credit ratings" refer to credit ratings issued by one of the DBRS group of companies or
 Morningstar Credit Ratings, LLC. The DBRS group of companies consists of DBRS, Inc. (Delaware, U.S.)(NRSRO, DRO affiliate);
 DBRS Limited (Ontario, Canada)(DRO, NRSRO affiliate); DBRS Ratings GmbH (Frankfurt, Germany)(CRA, NRSRO affiliate, DRO
 affiliate); and DBRS Ratings Limited (England and Wales)(CRA, NRSRO affiliate, DRO affiliate). Morningstar Credit Ratings, LLC
 is a NRSRO affiliate of DBRS, Inc. For more information on regulatory registrations, recognitions and approvals of DBRS group
 of companies and Morningstar Credit Ratings, LLC, please see: http://www.dbrsmorningstar.com/research/highlights.pdf.

 The DBRS group and Morningstar Credit Ratings, LLC are wholly-owned subsidiaries of Morningstar, Inc.

 All DBRS Morningstar credit ratings and other types of credit opinions are subject to disclaimers and certain limitations. Please
 read these disclaimers and limitations at http://www.dbrsmorningstar.com/about/disclaimer and
 https://ratingagency.morningstar.com/mcr. Additional information regarding DBRS Morningstar ratings and other types of credit
 opinions, including definitions, policies and methodologies, are available on http://www.dbrsmorningstar.com and
 https://ratingagency.morningstar.com/mcr.

 Investment research is produced and issued by subsidiaries of Morningstar, Inc. including, but not limited to, Morningstar
 Research Services LLC, registered with and governed by the U.S. Securities and Exchange Commission. The information contained
 herein is the proprietary property of Morningstar and may not be reproduced, in whole or in part, or used in any manner, without
 the prior written consent of Morningstar. To license the research, call +1 312 696-6869.
You can also read