Investing in the Future of Asia - China Small Companies Fund - Matthews Asia

Page created by Jared Ramsey
 
CONTINUE READING
Investing in the Future of Asia - China Small Companies Fund - Matthews Asia
Investing in the
                                                  Future of Asia
                                                  China Small Companies Fund

                                                  Matthews Asia I Q4 2019

The views and information discussed herein are as of the date of publication, are      Investing in international and emerging markets may involve additional risks,
subject to change and may not reflect current views. The views expressed               such as social and political instability, market illiquidity, exchange-rate
represent an assessment of market conditions at a specific point in time, are          fluctuations, a high level of volatility and limited regulation. Fixed income
opinions only and should not be relied upon as investment advice regarding a           investments are subject to additional risks, including, but not limited to, interest
particular investment or markets in general. Such information does not                 rate, credit and inflation risks. In addition, single-country and sector strategies
constitute a recommendation to buy or sell specific securities or investment           may be subject to a higher degree of market risk than diversified strategies
vehicles.                                                                              because of concentration in a specific industry, sector or geographic location.
                                                                                       Investing in small companies is more risky and more volatile than investing in
Investment involves risk. Past performance is no guarantee of future results. The      large companies.
value of an investment in the Fund can go down as well as up. The information
contained herein has been derived from sources believed to be reliable and             Matthews Asia is the brand for Matthews International Capital Management, LLC
accurate at the time of compilation, but no representation or warranty (express        and its direct and indirect subsidiaries.
or implied) is made as to the accuracy or completeness of any of this
information. Matthews Asia and its affiliates do not accept any liability for losses
either direct or consequential caused by the use of this information.
                                                                                       For institutional use only. Do not give, show or quote to any other person. Not to
                                                                                       be used with retail investors. Do not duplicate or reproduce.
                                                                                                                  © 2020 Matthews International Capital Management, LLC PT001b_4Q19
Investing in the Future of Asia - China Small Companies Fund - Matthews Asia
Asia’s Global Relevance

 For institutional use only. Do not give, show or quote to any other person. Not to be used with retail investors. Do not duplicate or reproduce.
                                                                                © 2020 Matthews International Capital Management, LLC PT001t_4Q19   2
Investing in the Future of Asia - China Small Companies Fund - Matthews Asia
Asia’s Global Relevance
More people, more wealth, more growth

                                                                         More than 4.5 billion of the 7.7 billion people
                                                                         worldwide live within the circle, but it’s not just
                                                                         India and China that make up this population:

                                                                                                                                 Indonesia: 271 million
                                                                                                                                 Pakistan: 217 million
                                                                                                                                 Bangladesh: 163 million
                                                                                                                                 Philippines: 108 million
                                                                                                                                 Vietnam: 96 million

                                                                                                                                        Average age: 27.7

                                               Sources: United Nations, Department of Economic and Social Affairs, Population Division (2019), World Population Prospects 2019

                           For institutional use only. Do not give, show or quote to any other person. Not to be used with retail investors. Do not duplicate or reproduce.
                                                                                                          © 2020 Matthews International Capital Management, LLC PT001t_4Q19   3
Investing in the Future of Asia - China Small Companies Fund - Matthews Asia
Asia Continues to Lead Global Growth

         COMPOSITION OF GROWTH*                                                         EXPECTED COMPOSITION OF GROWTH*
               2009 – 2019                                                                         2018 – 2024
                    ASIA: 56%                                                                                        ASIA: 59%

               Mid East/                                                                                   Mid East/
               Africa 11%                                                                                 Africa 10%
          Latin                                                                                      Latin
         America                                                                                    America                              China/Hong Kong
                            China/Hong Kong
           5%                                                                                         6%                                       28%
                                  28%
     Europe                                                                               Europe
      15%                                                                                  14%

                                      India 12%                                                      U.S. /
           U.S. /                                                                                                                                  India 15%
          Canada                                                                                    Canada
           13%                                                                                       11%
                                    Japan                                                                                 Rest of             Japan
                        Rest of
                                     3%                                                                                  Asia 14%              2%
                       Asia 13%

                                            *Based on GDP on Purchasing Power Parity (PPP) basis. There is no guarantee any estimates or projections will be realized
                                                                                                 Source: International Monetary Fund; World Economic Outlook Database, April 2019
                              For institutional use only. Do not give, show or quote to any other person. Not to be used with retail investors. Do not duplicate or reproduce.
                                                                                                             © 2020 Matthews International Capital Management, LLC PT001t_4Q19   4
Investing in the Future of Asia - China Small Companies Fund - Matthews Asia
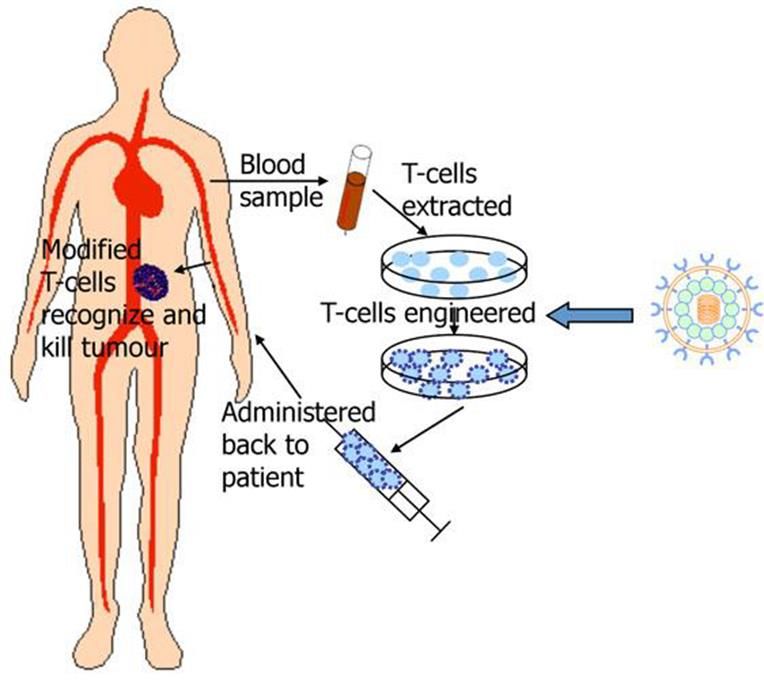
Emerging Markets Are Not Created Equal
Many Asian countries have achieved “Economic Take Off”
Nominal GDP per capita, PPP, relative to the U.S. (2017)
1.2

                                                                                                                                                  U.S.
1.0

                                 TAIWAN

0.8
                                                                                           JAPAN
                    SOUTH KOREA

0.6
                                MALAYSIA
                                                                                                                                                           Asia
0.4                                                                                                                                                        Europe
       CHINA
                       THAILAND                                                                                                                            Latin America
                                                                                                                                                           Middle East/Africa
0.2
            INDIA                                                                                                                                          North America

0.0
      0.0                 0.2                    0.4                              0.6                             0.8                              1.0                              1.2

                                          Nominal GDP per capita, PPP, relative to the U.S. (1980)

                                                                                                             Note: Data depicted shows 50 most populous countries in IMF database in 1980
                                                                                                                                                                           Sources: IMF; Matthews Asia

                                               For institutional use only. Do not give, show or quote to any other person. Not to be used with retail investors. Do not duplicate or reproduce.
                                                                                                                              © 2020 Matthews International Capital Management, LLC PT001t_4Q19   5
Investing in the Future of Asia - China Small Companies Fund - Matthews Asia
Asia’s Growth Still Has a Long Way To Go…
Asia per capita GDP in historical context to the U.S.
GDP per capita (US$)
70,000
                                                                                                                                                                                       Singapore

60,000

50,000
                                                                                                        Technology and Services                                                    Hong Kong
                                                                                                        Information Technology
                                                                                                        Financials/Insurance
40,000                                                                                                  Travel/Leisure                                                        Japan
                                                       Specialty Brands
                                                       Consumer Discretionary
                   Basic Necessities                   Materials                                                                                                         South Korea
30,000             Energy                              Infrastructure
                   Consumer Staples
                   Utilities                                                                                                                                         Taiwan
20,000

                                                                             Mongolia,                          China
10,000                                                                       Indonesia,                                                  Malaysia
                               Pakistan,                                     Sri Lanka
                               Bangladesh India                   Philippines                                           Thailand
                 Myanmar
     0                                                   Vietnam
         1   1650 1808 1821 1834 1847 1860 1873 1886 1899 1912 1925 1938 1951 1964 1977 1990 2003 2016
                                                                                                  2018
                                                                     U.S.             Asia Countries

                                                       Sources: Maddison Historic GDP through 1987, International Monetary Fund (MF), World Economic Database October 2019
                                           For institutional use only. Do not give, show or quote to any other person. Not to be used with retail investors. Do not duplicate or reproduce.
                                                                                                                          © 2020 Matthews International Capital Management, LLC PT001t_4Q19   6
Investing in the Future of Asia - China Small Companies Fund - Matthews Asia
Peeling the EM Onion—Asia Stands Out
Long-Term Performance of MSCI Emerging Market Regions as of December 31, 2019

                3 Years                                                 5 Years                                                               10 Years
     13.3%           12.9%

             11.1%

                                                                                  9.3%

                               7.1%                7.0%
                                                                                                                          6.1%
                                                                   4.5%
                                                                                                  3.6%

                                                                                                                                                          1.7%           1.6%

                                                                                                                                         -0.4%

                MSCI Emerging Markets Asia Index                                            MSCI Emerging Markets Latin America Index
                MSCI Emerging Markets Europe Index                                          MSCI Emerging Markets EMEA Index

                                   Past performance is no guarantee of future results. Indexes are unmanaged and it is not possible
                                   to invest directly in an index.
                                                                                                     Sources: MSCI, FactSet Research Systems, Inc.; data as of December 31, 2019

                                   For institutional use only. Do not give, show or quote to any other person. Not to be used with retail investors. Do not duplicate or reproduce.
                                                                                                                  © 2020 Matthews International Capital Management, LLC PT001t_4Q19   7
Investing in the Future of Asia - China Small Companies Fund - Matthews Asia
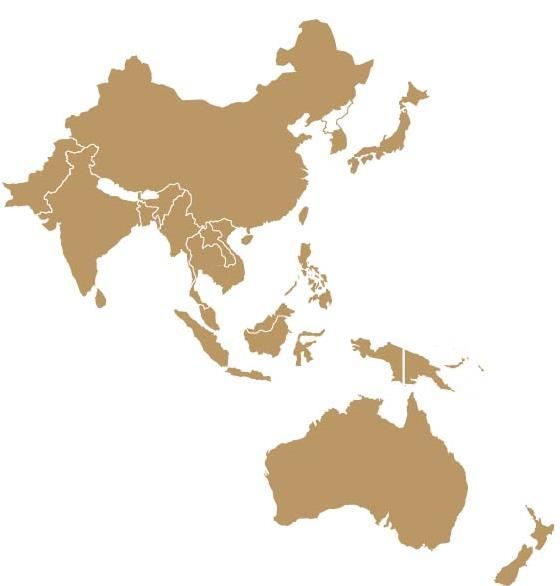
Asia Leads Innovation in EM

% WEIGHT IN INNOVATIVE SECTORS

                    28.2%

                                                                                 9.9%

                                                                                                                                                       2.9%

          MSCI AC Asia ex Japan Index                         MSCI EM Latin America Index                                      MSCI Emerging Markets EMEA Index

                                        Matthews Asia considers Innovative sectors to include Technology, Industrials and Health Care. Weights represent the cumulative
                                        % of health care, technology and industrials sectors. Indexes are unmanaged and it is not possible to invest directly in an index.
                                                                                                  Sources: MSCI, FactSet Research Systems, Inc.; data as of December 31, 2019.

                                        For institutional use only. Do not give, show or quote to any other person. Not to be used with retail investors. Do not duplicate or reproduce.
                                                                                                                       © 2020 Matthews International Capital Management, LLC PT001t_4Q19   8
Investing in the Future of Asia - China Small Companies Fund - Matthews Asia
Rising Wages and Productivity Behind Asia’s Rising Share of Consumption
An estimated 2.3 billion people will enter the middle class—88% from Asia!

SPENDING BY THE GLOBAL MIDDLE CLASS, 2015 – 2030* (PPP, Constant 2011 billion $ and shares)

100%
                                                                                                                                                        Middle East & North Africa
 90%

 80%
                                                                                                                                                        Sub-Saharan Africa
 70%

 60%                                                                                                                                                    Asia Pacific

 50%

 40%                                                                                                                                                    Central and South America

 30%

                                                                                                                                                        North America
 20%

 10%
                                                                                                                                                        Europe
  0%
    2015                           2020*                                           2025*                                               2030*

                                           *Data represented are estimates only. Matthews Asia has not independently verified any of the figures and cannot confirm their
                                           accuracy. There is no guarantee that any estimates or projections will be realized. Middle class is defined as income range of $11 to
                                           $110 per person per day in 2011 PPP terms.
                                           Source: Brookings, Global Economy and Development Working Paper, February 2017, “The Unprecedented Expansion of the Global Middle Class.”

                                           For institutional use only. Do not give, show or quote to any other person. Not to be used with retail investors. Do not duplicate or reproduce.
                                                                                                                          © 2020 Matthews International Capital Management, LLC PT001t_4Q19   9
Investing in the Future of Asia - China Small Companies Fund - Matthews Asia
Current Economic Cycle

 For institutional use only. Do not give, show or quote to any other person. Not to be used with retail investors. Do not duplicate or reproduce.
                                                                                © 2020 Matthews International Capital Management, LLC PT001t_4Q19   10
Asia Earnings Per Share and Economic Growth

US$; Indexed 12/31/2002=1
6.0

5.0

4.0

3.0

2.0

1.0

0.0
  Dec-00      Dec-02        Dec-04      Dec-06               Dec-08               Dec-10               Dec-12               Dec-14                Dec-16               Dec-18 Dec-19

                                 Asia ex Japan EPS                                                         Asia ex Japan Nominal GDP

                                                                                                                                   Note: Universe as defined by FactSet Aggregates
                                                                                                     Source: FactSet Aggregates, MSCI, Matthews Asia; data as of December 31, 2019

                                        For institutional use only. Do not give, show or quote to any other person. Not to be used with retail investors. Do not duplicate or reproduce.
                                                                                                                       © 2020 Matthews International Capital Management, LLC PT001t_4Q19   11
When to Invest in Emerging Markets—Four Pillars

       STABLE U.S. GROWTH      STABLE OR RISING                                FAIRLY VALUED                                FAIRLY VALUED
          AND INFLATION         COMMODITIES                                     CURRENCIES                                 CREDIT SPREADS

                            For institutional use only. Do not give, show or quote to any other person. Not to be used with retail investors. Do not duplicate or reproduce.
                                                                                                           © 2020 Matthews International Capital Management, LLC PT001t_4Q19   12
Things to Consider—Asia Can Outperform Late Cycle
Performance measured during the previous FED hiking cycle—6/30/2005 through 12/31/2007

CUMULATIVE PERFORMANCE IN %
145%
130%
115%
100%
85%
70%
55%
40%
25%
10%
 -5%
   Jun-05   Sep-05   Dec-05   Mar-06             Jun-06              Sep-06               Dec-06             Mar-07               Jun-07              Sep-07               Dec-07

                                MSCI Asia ex Japan Index                                  S&P 500 Index

                              Past performance is no guarantee of future results. Indexes are unmanaged and it is not possible
                              to invest directly in an index.
                                                                                                                                                                Source: Bloomberg

                              For institutional use only. Do not give, show or quote to any other person. Not to be used with retail investors. Do not duplicate or reproduce.
                                                                                                             © 2020 Matthews International Capital Management, LLC PT001t_4Q19   13
Asian Valuations
Asia ex Japan (December 2001 – December 2019)
Forward P/E Ratio                                                                                                                                                                 P/B Ratio
20                                                                                                                                                                                     4.0
18                                                                                                                                                                                            3.5
16
                                                                                                                                                                                              3.0
14
12                                                                                                                                                                                            2.5

10                                                                                                                                                                                            2.0
 8                                                                                                                                                                                            1.5
 6
                                                                                                                                                                                              1.0
 4   SARS Outbreak                           Global Financial Crisis
 2                                                                                                                                                                                            0.5

 0                                                                                                                                                                                            0.0

      Asia ex Japan Forward Price to Earnings              Asia ex Japan Price to Book                             Linear (Asia ex Japan Forward Price to Earnings)

                                                                                                  Hong                                                                               Asia ex
                                                                               China                                India           Japan             U.S.          Europe
                                                                                                  Kong                                                                               Japan
                                            Forward P/E                        15.7x             12.0x              19.0x           15.1x            19.2x           15.3x            13.1x
                                            Dividend Yield (%)                   1.9               3.1                1.5             2.3              2.0             3.4             2.5
                                                                                                                             Note: Valuations chart data as of December 31, 2019
                                            Trailing Dividend yield estimates for 2019 as of December 31, 2019 based on FactSet aggregates as defined by FactSet. The forward
                                            price per earnings ratio (“Forward P/E”) is calculated by dividing the market price per share by the expected earnings per share for
                                            2020. Forward P/E was calculated as of December, 2019 and is forward looking. There is no guarantee that Forward P/E or any
                                            estimates or projections will be realized.
                                                                                                                                                             Source: FactSet Research Systems, Inc.

                                           For institutional use only. Do not give, show or quote to any other person. Not to be used with retail investors. Do not duplicate or reproduce.
                                                                                                                          © 2020 Matthews International Capital Management, LLC PT001t_4Q19    14
Environment and Outlook
As of December 31, 2019

 U.S. / China trade relations seem to be moderating, but much to be settled

 Earnings growth looks set to outpace the U.S. over the long term as the U.S. tax-cut effects fade

 Asia’s valuations are reasonable on cyclically depressed earnings; we believe they are cheap in a
  global context

 The International Monetary Fund (IMF) projects Asia’s nominal US$ GDP growth to outpace the
  developed world—Asia’s profits could follow

 Asia continues to pursue structural reform even as monetary policy appears to be loosening

 Most of Asia is living within its means with stable inflation and high savings—current accounts are
  improving, unlike other emerging markets

 We look for companies that can grow profits and cash flows sustainably and benefit from an
  evolving middle class culture

                                  The statements above are based on the beliefs and assumptions of our portfolio management team and on the information currently
                                  available to our team at the time of such statements. Although we believe that the expectations reflected in these statements are
                                  reasonable, we can give no assurance that these expectations will prove to be correct.

                                  For institutional use only. Do not give, show or quote to any other person. Not to be used with retail investors. Do not duplicate or reproduce.
                                                                                                                 © 2020 Matthews International Capital Management, LLC PT001t_4Q19   15
Implementing Asia in Portfolios

     For institutional use only. Do not give, show or quote to any other person. Not to be used with retail investors. Do not duplicate or reproduce.
                                                                                    © 2020 Matthews International Capital Management, LLC PT001t_4Q19   16
Most Client Portfolios are Under-Allocated to Asia
Compared to Current Measures

 MSCI ALL COUNTRY WORLD INDEX                              WORLD STOCK MARKET VALUE                                                                              GDP
             ASIA: 19%                                                        ASIA: 32%                                                                     ASIA: 36%

                 Canada
                                                                                           Canada                                                               Canada
                   3% China/HK
                                                                                             3%                                                                   2%
                         5%      India
                                  1%
                                 Japan                                                                                                               U.S.               China/HK
                                                                                            China/HK                                                 24%
                                  7%                                   U.S.                                                                                               17%               India
                                                                                              14%               India
                                                                       41%                                                                                                                   3%
     U.S.              Other Asia                                                                                3%                                                                          Japan
     55%                  6%                                                                                    Japan        Mid East/                                                        6%
                                                                                                                 7%           Africa                                        Other Asia
                       Europe                                                           Other Asia                              6%                                             10%
                        20%                                                                8%
                                                                                   Europe                                                                       Europe
                                                     Mid                                                                   Latin America
                                                                                    19%                                                                          26%
                                                  East/Africa                                                                    6%
                       Latin                          3%
            Mid East/
                      America                            Latin America
             Africa
                        2%                                     2%
               1%
                                         The MSCI All Country World Index is a free float‐adjusted market capitalization weighted index that is designed to measure the equity
                                         market performance of developed and emerging markets. The MSCI ACWI consists of 46 country indexes comprising 23 developed
                                         and 23 emerging market country indexes. The developed market country indexes included are: Australia, Austria, Belgium, Canada,
                                         Denmark, Finland, France, Germany, Hong Kong, Ireland, Israel, Italy, Japan, Netherlands, New Zealand, Norway, Portugal, Singapore,
                                         Spain, Sweden, Switzerland, the United Kingdom and the United States. The emerging market country indexes included are: Brazil,
                                         Chile, China, Colombia, Czech Republic, Egypt, Greece, Hungary, India, Indonesia, Korea, Malaysia, Mexico, Peru, Philippines, Poland,
                                         Qatar, Russia, South Africa, Taiwan, Thailand, Turkey and United Arab Emirates.
                                         Sources: MSCI, International Monetary Fund and World Federation of Exchange Members, IMF GDP data as of 4/30/19; Stock Market
                                         Value data as of 04/30/19; MSCI All Country World Index as of 06/30/2019. Figures in US$

                                         For institutional use only. Do not give, show or quote to any other person. Not to be used with retail investors. Do not duplicate or reproduce.
                                                                                                                        © 2020 Matthews International Capital Management, LLC PT001t_4Q19   17
Implementation—Get the Asia Part Right

EM EQUITY REGIONAL WEIGHTS
80%
             73.6%

70%

60%

50%

40%

30%

20%
                                         11.4%
                                                                                            9.0%
10%                                                                                                                              6.0%
                                                                                                           Banker’s Acceptance Bills
0%                                                                                                                      Trust Loans
              Asia                 Latin America                                        ME/Africa                                            Europe

                                        Note: EM equity refers to the MSCI Emerging Markets Equity Index. All regional weights are shown as of December 31, 2019.
                                                                                                                      It is not possible to invest directly in an index.
                                                                                                                                       Sources: FactSet Research Systems, Inc., MSCI

                             For institutional use only. Do not give, show or quote to any other person. Not to be used with retail investors. Do not duplicate or reproduce.
                                                                                                            © 2020 Matthews International Capital Management, LLC PT001t_4Q19   18
EM Equity Index—What Are You Buying?

MSCI EM EQUITY EXPOSURES

                  Small Caps
                    3.4%

       Mid Caps
        22.4%                                                                                          Less-Cyclical
                                                                                                          37.0%

                                                                                                                                           Cyclicals
                                                                                                                                            63.0%
                       Large and Mega Caps
                              74.3%
                                                                                                  Banker’s Acceptance Bills
                                                                                                                    Trust Loans

                                  Note: EM equity refers to the MSCI EM Equity Index as of December 31, 2019. Cyclical sectors for this purpose refer to financials,
                                  materials, energy, real estate and information technology. Less-Cyclical sectors for this purpose include consumer staples, health care,
                                  consumer discretionary, telecom and utilities.
                                                                                                                             Sources: MSCI, FactSet Research Systems, Inc.
                                  For institutional use only. Do not give, show or quote to any other person. Not to be used with retail investors. Do not duplicate or reproduce.
                                                                                                                 © 2020 Matthews International Capital Management, LLC PT001t_4Q19   19
Implementation—Consumer Staples has Outperformed more Cyclical Sectors

EM SECTOR PERFORMANCE + VOLATILITY (January 2001– December 2019)

700%
                                                               610.6%                                                                595.7%
600%

500%
             427.7%
400%

300%

200%

100%
                           25.5%                                                         26.9%                                                                 16.9%
 0%
                 EM Materials                                            EM Energy                                                    EM Consumer Staples

                                                Return                               Average Volatility

                                   Past performance is no guarantee of future results. Volatility is the standard deviation of returns.
                                   Indexes are unmanaged and it is not possible to invest directly in an index.
                                   Note: Universe represented by the MSCI EM Equity Index. Volatility calculation are using average daily returns from the January 31,
                                   2001 to December 31, 2019 time period. The sector returns shown are cumulative for the dates listed above.
                                                                                                                                             Sources: MSCI, FactSet Research Systems, Inc.

                                   For institutional use only. Do not give, show or quote to any other person. Not to be used with retail investors. Do not duplicate or reproduce.
                                                                                                                  © 2020 Matthews International Capital Management, LLC PT001t_4Q19   20
Which are the Next Drivers of EM Growth?
Asia per capita GDP in historical context to the U.S.
GDP per capita (US$)
70,000
                                                                                                                                                                                    Singapore

60,000                                                                                       Traditional GEMs

50,000
                                                                                                                                                                                Hong Kong

40,000                                                                                                                                                                     Japan

                                                                                                                                                                      South Korea
30,000                         Next GEMs
                                                                                                                                                                   Taiwan
20,000

                                                                                Mongolia,                    China
10,000                                                                          Indonesia,                                             Malaysia
                           Pakistan,                                            Sri Lanka
                 Myanmar                          Vietnam Philippines                                             Thailand
                           Bangladesh India
     0
         1                                                                                        2018
             1650 1808 1821 1834 1847 1860 1873 1886 1899 1912 1925 1938 1951 1964 1977 1990 2003 2016

                                                                       U.S.                Asia Countries
                                                                                                                                                             GEM=Global Emerging Markets
                                                                    Sources: Maddison Historic GDP through 1987, International Monetary Fund (MF), World Economic Database October 2019

                                        For institutional use only. Do not give, show or quote to any other person. Not to be used with retail investors. Do not duplicate or reproduce.
                                                                                                                       © 2020 Matthews International Capital Management, LLC PT001t_4Q19   21
Implementation—Achieving Better Balance
                                            Growth

                                                                   Matthews Emerging Asia
                                                                    Matthews Asia Growth
                                                                   Matthews Asia Innovators
                                                                    Matthews Pacific Tiger
                                                                     Matthews Asia ESG

                                                                    Matthews Asia Dividend

 Cyclical                                                                                                                           Consumer
                 MSCI EM
                  INDEX
                                                           Matthews Asian Growth and Income
                                                                 Matthews Asia Value

                                             Value
                    For institutional use only. Do not give, show or quote to any other person. Not to be used with retail investors. Do not duplicate or reproduce.
                                                                                                   © 2020 Matthews International Capital Management, LLC PT001t_4Q19   22
Matthews Asia Overview

                            About Matthews Asia
KEY FACTS                    Specialist asset management firm largely focused on Asia
As of December 31, 2019

Total assets under
                             Established in 1991—managed assets through 28 years of diverse
management*                   market environments
$27.3 billion
                             Independent, privately owned firm with significant employee ownership
Regional strategies
$21.5 billion                48-person experienced investment team focused on identifying
                              opportunities in Asia
Single-country strategies
$5.8 billion
                             Clients include global institutional investors, family offices, private banks,
Investment team members†      professional and high net worth investors
48
                             Largest dedicated Asia investment specialist in the United States
Office Locations
San Francisco, London,
Hong Kong, Shanghai,
Singapore

                                                                                                                                       † Effective as of January 31, 2020.
                                                                                  *Assets   under management may rise or fall due to market conditions and other factors.
                                                                                                 Please refer to MatthewsAsia.com for most recent month-end AUM data.
                             For institutional use only. Do not give, show or quote to any other person. Not to be used with retail investors. Do not duplicate or reproduce.
                                                                                                            © 2020 Matthews International Capital Management, LLC PT001t_4Q19   23
Matthews Asia History
 Matthews Asia has chosen to launch new strategies when there are compelling investment
 opportunities

1991
G. Paul Matthews                                                                                                                                                                        2015
founds Matthews                                                                                                                   2010                                            Asia Credit
                                      1998                                                                   Matthews Asia introduces                                          Opportunities
International Capital                 China Strategy
Management                                                      2003                                       off-shore funds for non-U.S.                                    Strategy inception
                   1994               inception          Asia Growth                                                          investors
                   Matthews Asia                   Strategy inception                                                                                                 2013
                   introduces Asia                                                                                                                           Emerging Asia
                                         1998                                                                            2008                            Strategy inception
                   ex-Japan and Asian    Japan Strategy
                   Growth & Income                                                                      Asia Small Companies
                                         inception                                                          Strategy inception
                   Strategy
1991   1992   1993 1994 1995   1996   1997   1998   1999    2000     2001     2002 2003        2004      2005     2006     2007     2008     2009     2010    2011     2012     2013     2014     2015   2016

                                                                                                                                                                                        2015
                          1995                       1999                                                                                                                           Asia ESG
                                                     Asia Innovators                              2005                              2009
                          Korea Strategy                                                 India Strategy                                                                             Strategy
                                                     Strategy inception                                                   China Dividend                                           inception
                          inception                                                          inception                 Strategy inception
        1992
        Firm launches                                                                                  2006                                  2011
        an investment                                                                         Asia Dividend                           China Small                                       2015
        vehicle                                                                          Strategy inception                     Companies Strategy                        Asia Value and Asia
        for the Asia                                                                                                                    inception                          ex Japan Dividend
        ex-Japan region                                                                                                                            2011                    Strategy Inception
                                                                                                                                 Asia Total Return Bond
                                                                                                                                     Strategy* inception

                                                     *The   Strategy’s name changed from the Matthews Asia Strategic Income to the Matthews Asia Total Return Bond on January 31, 2020.
                                                     For institutional use only. Do not give, show or quote to any other person. Not to be used with retail investors. Do not duplicate or reproduce.
                                                                                                                                    © 2020 Matthews International Capital Management, LLC PT001t_4Q19    24
Investment Philosophy and Approach
The foundation of Matthews Asia’s investment philosophy is our belief in the long-term economic
growth and development of the countries in Asia

                        ACTIVE                                                 BOTTOM-UP
                      MANAGEMENT                                                RESEARCH

                                                                         RANGE OF ASIA
                      LONG-TERM
                                                                          INVESTMENT
                     FOCUS ON ASIA
                                                                           STRATEGIES

                             For institutional use only. Do not give, show or quote to any other person. Not to be used with retail investors. Do not duplicate or reproduce.
                                                                                                            © 2020 Matthews International Capital Management, LLC PT001t_4Q19   25
Three Pillars of ESG Integration
Committed to incorporating ESG considerations within the very fabric of our investment process

                                                         Long-Term Alpha Generation
       FIRM-WIDE ARCHITECTURE                                       INVESTMENT TEAM                                                    INVESTMENT STRATEGIES
   Alignment of Mission, Culture and Talent              Foundations for ESG Integration:                                        Tailored ESG Integration by Strategy:
   to Support Performance Goals:                                                                                                    Active Security Selection:
                                                           Company Engagement
                                                                                                                                      Fundamental and bottom-up
    Mission: Champion Asia investment                     Emphasis on Governance: Deep                                              investment process
     solutions that build wealth for our global             understanding of corporate governance                                    Materiality: ESG issues are
     clients over the long term                             across markets, strong focus across all                                   considered where material for
    Culture: Diverse teams create better                   strategies                                                                industry or sector
     outcomes for clients. Culture Committee,              Risk Monitoring: ESG and reputational                                    Context Matters: Each strategy
     Diversity & Inclusion Committee and                    risk monitoring via multiple ESG
     Sustainability Committee                                                                                                         draws on ESG inputs in a way that
                                                            research providers, complemented by                                       reflects:
    Commitment: UNPRI Signatory                            our proprietary research
                                                                                                                                      — Objectives and philosophy
                                                           Oversight Structures: Corporate
   COMMUNITY AND ENVIRONMENT                                                                                                          — Availability of ESG data within
                                                            Governance & Stewardship Sub-                                                the strategy’s universe
   ― Matthews Asia Charitable Giving                        Committee
   ― Annual employee volunteer day                                                                                                    — Market cap of securities the
                                                           Industry Collaboration and                                                   strategy invests in
   ― LEED certified HQ since 2014                              Memberships: Asian Corporate                                           — Region or country and stage of
   ― Carbon offsets for firm-wide travel                       Governance Association, International
      emissions                                                                                                                          development
                                                               Corporate Governance Network, CDP

                                             ESG considerations are not a specific requirement for all portfolios at Matthews Asia. ESG factors can vary over different periods and
                                             can evolve over time. They may also be difficult to apply consistently across regions, countries or sectors. There can be no guarantee
                                             that a company deemed to meet ESG standards will actually conduct its affairs in a manner that is less destructive to the environment,
                                             or promote positive social and economic developments. Parameters set by Matthews Asia are subject to change.
                                             For institutional use only. Do not give, show or quote to any other person. Not to be used with retail investors. Do not duplicate or reproduce.
                                                                                                                            © 2020 Matthews International Capital Management, LLC PT001t_4Q19   26
Matthews Asia Investment Team*
Diverse team in a highly collaborative environment
Chief Investment Officer   Research Principal, China
Robert J. Horrocks, PhD    Richard Gao                                                 Open Communication and Exchange of Ideas
Portfolio Managers         Analysts
Winnie Chwang              Siddharth Bhargava                                           Formal
Raymond Z. Deng            Kathlyn Collins                                                    — Weekly all-hands meeting to discuss macro,
Rahul Gupta                Donghoon Han                                                            stock ideas, trip debriefs and ad-hoc topics
Robert Harvey, CFA         Grace Ma
Robert J. Horrocks, PhD    Bo Ning                                                            — Bi-weekly portfolio review meeting to review
Tiffany Hsiao, CFA         Sojung Park                                                             trades, macro, risk
Taizo Ishida               Ryan Rutkowski                                                     — Monthly portfolio compliance meeting to
YuanYuan Ji                Yinyan Ibanez, CFA                                                      discuss potential compliance matters
Teresa Kong, CFA           Jeremy Sutch, CFA
John Paul Lech                                                                                — Weekly strategy-specific team meeting to
                           Haopeng Yang, PhD
Elli Lee                   Hardy Zhu
                                                                                                   discuss specific portfolio construction issues
S. Joyce Li, CFA           Julia Zhu
                                                                                                   or individual stocks
Kenneth Lowe, CFA                                                                             — Committee meetings: Trade Management
Andrew Mattock, CFA        Macro Investment Strategists                                            Oversight, Investment Risk, other
Peeyush Mittal, CFA        Andy Rothman, China
Michael J. Oh, CFA                                                                      Informal
Satya Patel
Sharat Shroff, CFA
                           Portfolio Strategists                                              — Sit together—open floor plan
Lydia So, CFA              David Dali
                           Jeremy Murden                                                      — Daily ad-hoc meetings around trip debriefs,
Inbok Song                                                                                         fixed income insights, macro strategy, team
Shuntaro Takeuchi          Nick Walker, CFA, CAIA
                           Tiffany Shi, CFA, CAIA                                                  structure and process, new product ideas, etc.
Vivek Tanneeru
Sherwood Zhang, CFA
Yu Zhang, CFA
Wei Zhang
Beini Zhou, CFA

                                                                                                                                         *Effective as of January 31, 2020.
                                                                                    Note: Traders not referenced above but are included in overall investment team count.
                              For institutional use only. Do not give, show or quote to any other person. Not to be used with retail investors. Do not duplicate or reproduce.
                                                                                                             © 2020 Matthews International Capital Management, LLC PT001t_4Q19   27
Senior Investment Team Members*—Redefining “Local”
                                                                    Years of Experience
                                                                                                                                        Asia Countries                             Asian Languages &
         Name                 Investment Focus               Asia        Industry        Firm        Home Country
                                                                                                                                           Lived In                                 Dialects Spoken
Robert Horrocks, PhD   Asia Regional                           26            26            12      U.K.                    China, Hong Kong, Taiwan, Korea                 Mandarin
Winnie Chwang          China, Asia ESG                         16            16            16      Singapore               Singapore                                       Mandarin, Cantonese
David Dali             Broad EM                                23            31            5       U.S.                    N/A                                             N/A
Raymond Deng, CFA      China                                   11            12            6       China                   China, Thailand                                 Mandarin
Richard Gao            China                                   31            31            23      China                   China                                           Mandarin, Cantonese, Shanghainese
Rahul Gupta            Asia Regional                           18            26            6       India                   India                                           Hindi
Robert Harvey, CFA     Emerging and Frontier Asia              20            26            8       South Africa            Vietnam, Hong Kong                              N/A
Tiffany Hsiao, CFA     China Small Cap                         19            19            6       Taiwan                  Hong Kong, Japan, Taiwan                        Mandarin, Taiwanese, Cantonese
Taizo Ishida           Japan, Emerging Asia, Asia Growth       30            36            14      Japan                   Japan, Bangladesh                               Japanese
YuanYuan Ji            Small Cap, China                        11            11             4      China                   China, Hong Kong                                Shanghainese, Cantonese, Mandarin
Teresa Kong, CFA       Asia Debt                               20            25            10      Hong Kong               Hong Kong, China                                Cantonese
John Paul Lech         Asia Regional                           12            16             2      U.S.                    N/A                                             N/A
Kenneth Lowe, CFA      Asia Regional                           14            14            10      U.K.                    N/A                                             N/A
S. Joyce Li, CFA       Asia Regional                           14            14             4      China                   China                                           Mandarin, Cantonese
Andrew Mattock, CFA    China                                   21            25             5      Australia               Singapore                                       N/A
Peeyush Mittal, CFA    India                                   11            11             5      India                   India                                           Hindi
Jeremy Murden          China, Asia Regional                    11            15             2      U.S.                    N/A                                             N/A
Michael Oh, CFA        Korea, Asia Regional                    20            20            20      South Korea             South Korea                                     Korean
Satya Patel            Asia Debt                                9            13             9      U.S.                    N/A                                             Gujarati
Andy Rothman           China                                   36            36             6      U.S.                    China, Indonesia                                Mandarin
Tiffany Shi, CFA       China, Asia Regional                    10            10             5      U.S.                    Hong Kong, China, Taiwan, Singapore             Shanghainese, Cantonese, Mandarin
Sharat Shroff, CFA     India, Asia Regional                    17            20            15      India                   Hong Kong, India, Taiwan                        Hindi, Bengali
Lydia So, CFA          Small Cap, Asia Regional                16            21            16      Hong Kong               Hong Kong                                       Cantonese, Mandarin
Inbok Song             Asia Regional                           15            15             9      Korea                   Korea                                           Korean
Jeremy Sutch, CFA      Small Cap, Asia Regional                25            25             5      Hong Kong               China, Hong Kong                                N/A
Shuntaro Takeuchi      Japan                                   15            19             4      Japan                   Japan                                           Japanese
Vivek Tanneeru         Asia ESG, Asia Regional                 15            15             9      India                   India                                           Telegu, Hindi
Sherwood Zhang, CFA    China, Asia Regional                    12            17             9      China                   China, Hong Kong                                Mandarin, Cantonese
Yu Zhang, CFA          China, Asia Regional                    16            16            13      China                   China, Japan                                    Mandarin
Beini Zhou, CFA        Asia Small Cap, Asia Value              15            15             7      China                   China                                           Mandarin
Julia Zhu              China                                   23            18             3      China                   China, Hong Kong                                Mandarin
                                                                                                                                                     *Note: List of team members as of January 31, 2020
                                                                                                                                                                Years of experience as of January 1, 2020

                                                       For institutional use only. Do not give, show or quote to any other person. Not to be used with retail investors. Do not duplicate or reproduce.
                                                                                                                                      © 2020 Matthews International Capital Management, LLC PT001t_4Q19   28
Matthews Asia—“Boots on-the-Ground”
Fundamental, bottom-up investment process

 3,800+ On-Site Meetings in Asia Since 2016*

                                                                                                  Identifying investment opportunities that stand to prosper
                                   Korea
                                   270+
                                                                                                  from Asia’s transformation calls for in-depth, on-the-
               China                                   Japan                                      ground, bottom-up research and active management:
               1,055+                                   520+
                                      Hong                                                                    Over 2,600 company meetings in 2019
                        Macau         Kong                                                                    Half of the meetings are on-site visits in Asia in
           Bangladesh     10                            Taiwan
   India      15+                     710+                                                                     locations ranging from Asian financial centers to
                 Myanmar Vietnam                          180
   275+               2    55+                                                                                 remote island outposts
                                  Philippines
            Thailand                  75+
   Sri Lanka 160+
     35+               Malaysia
                        35+         Indonesia
            Singapore                 165+
               180

                                           Australia
                                             40+

                                                            New Zealand
                                                                 9

                                                                                                                                                                     *From 1/1/2016 to 12/31/2018

                                                For institutional use only. Do not give, show or quote to any other person. Not to be used with retail investors. Do not duplicate or reproduce.
                                                                                                                               © 2020 Matthews International Capital Management, LLC PT001t_4Q19   29
Strategies for Investing in Asia
Matthews Asia offers a range of strategies across the risk-reward spectrum

                      ASIA FIXED INCOME

                      Asia Total Return Bond*
                      Asia Credit Opportunities

                      ASIA GROWTH AND
                                                                   ASIA GROWTH
                      INCOME

                      Asian Growth and Income                       Asia Growth                    China
                      Asia Dividend                                 Pacific Tiger                  India
                      China Dividend                                Asia ESG                       Japan
                                                                     Emerging Asia                  Korea
                                                                     Asia Innovators

                      ASIA VALUE                                   ASIA SMALL COMPANY

                      Asia Value                                 Asia Small Companies
                                                                  China Small Companies

                                       *The Fund’s name changed from Matthews Asia Strategic Income Fund to the Matthews Asia Total Return Bond Fund on January
                                                                                                                                                      31, 2020.

                                 For institutional use only. Do not give, show or quote to any other person. Not to be used with retail investors. Do not duplicate or reproduce.
                                                                                                                © 2020 Matthews International Capital Management, LLC PT001t_4Q19   30
Fund Profile | Matthews China Small Companies Fund

 FUND FACTS                           Investment Objective
 Inception Date                       Long-term capital appreciation
 Investor Class:         5/31/11
 Institutional Class:   11/30/17      Approach
                                      Invest in small companies located in China that are capable of sustainable
 Ticker                               growth based on the fundamental characteristics of those companies.
 Investor Class:         MCSMX        China includes its administrative and other districts, such as Hong Kong.
 Institutional Class:     MICHX
                                      Small Companies*
 Number of Holdings
 40 to 60
                                      Market capitalization no higher than the greater of US$5 billion or the
                                      market capitalization of the largest company included in the Fund’s
 Turnover Range                       benchmark.
 30% to 50%

 Benchmark                               Lead Manager                                                           Co-Managers*
 MSCI China Small Cap Index

                                        TIFFANY HSIAO, CFA                                  LYDIA SO, CFA                                  YUANYUAN JI

                                                                                                                                           *Effective as of January 31, 2020.
                                                                                    This presentation must be preceded or accompanied by a Matthews Asia Funds prospectus.
                                   For institutional use only. Do not give, show or quote to any other person. Not to be used with retail investors. Do not duplicate or reproduce.
                                                                                                                  © 2020 Matthews International Capital Management, LLC PT001t_4Q19   31
Matthews China Small Companies Portfolio Team*

  MATTHEWS CHINA SMALL COMPANIES TEAM

                                                                                                  Andy Rothman                           Richard Gao                         Julia Zhu
  Tiffany Hsiao, CFA         Lydia So, CFA                YuanYuan Ji                         Investment Strategist,                  Research Principal,                 Senior Analyst,
    Lead Manager             Co Manager                   Co Manager                                 China                                  China                          China Macro

         Matthews China                                  Matthews China                                             Asia Small Companies
            Strategy                                     Dividend Strategy                                                Strategy
                                                                                                                      Lydia So, CFA
      Andrew Mattock, CFA                            Sherwood Zhang, CFA                                             21 yrs. experience
       25 yrs. Experience                              17 yrs. Experience
      Winnie Chwang                                  Yu Zhang, CFA                                                  Beini Zhou, CFA
       16 yrs. experience                              15 yrs. experience                                              15 yrs. experience

      Hardy Zhu                                      S. Joyce Li, CFA                                               Tiffany Hsiao, CFA
       13 yrs. experience                              13 yrs. experience                                              19 yrs. experience
      Ryan Rutkowski                                 Yinyan Ibanez, CFA
       10 yrs. experience                              11 yrs. experience                                             YuanYuan Ji
                                                                                                                       11 yrs. experience

                                                                                                                                                             *Effective as of January 31, 2020.
                                                                                                                             Figures indicate years of industry experience as of January 2020.
                                             For institutional use only. Do not give, show or quote to any other person. Not to be used with retail investors. Do not duplicate or reproduce.
                                                                                                                            © 2020 Matthews International Capital Management, LLC PT001t_4Q19   32
Implementation—Get the Asia Part Right

EM EQUITY REGIONAL WEIGHTS
80%
             73.6%

70%

60%

50%

40%

30%

20%
                                         11.4%
                                                                                            9.0%
10%                                                                                                                              6.0%
                                                                                                           Banker’s Acceptance Bills
0%                                                                                                                      Trust Loans
              Asia                 Latin America                                        ME/Africa                                            Europe

                                        Note: EM equity refers to the MSCI Emerging Markets Equity Index. All regional weights are shown as of December 31, 2019.
                                                                                                                      It is not possible to invest directly in an index.
                                                                                                                                       Sources: FactSet Research Systems, Inc., MSCI

                             For institutional use only. Do not give, show or quote to any other person. Not to be used with retail investors. Do not duplicate or reproduce.
                                                                                                            © 2020 Matthews International Capital Management, LLC PT001t_4Q19   33
Rebalancing of the Chinese Economy Well Underway
Services & consumption bigger than manufacturing & construction for the eighth consecutive year in 2019

SHARE OF GDP BY PRODUCTION APPROACH

60%

50%

40%

30%

20%

10%

 0%
      1954     1959      1964       1969       1974           1979            1984            1989           1994            1999            2004           2009            2014           2019

                                         Primary industry                   Secondary industry                        Tertiary industry

         Primary industry refers to agriculture, forestry, animal husbandry and fishery and services in support of these industries
         Secondary industry refers to mining and quarrying, manufacturing, production and supply of electricity, water and gas, and construction
         Tertiary industry refers to all other economic activities not included in the primary or secondary industries, including real estate, finance,
         wholesale and retail, transportation and other service industries

                                                                                                                                                                                           Source: CEIC

                                              For institutional use only. Do not give, show or quote to any other person. Not to be used with retail investors. Do not duplicate or reproduce.
                                                                                                                             © 2020 Matthews International Capital Management, LLC PT001t_4Q19   34
Small Businesses Play an Important Role in China’s Economy

100%

90%                                                                                                                         20%
                                                                              25%
                                35%
80%       40%

70%

60%

50%                                                                                                                                                           Non-SMEs

40%                                                                                                                         80%                               SMEs
                                                                              75%
                                65%
30%       60%

20%

10%

 0%
        % of GDP   % of Patents and Innovation                      % of New Product                       % of Employment in Urban
                                                                      Development                                    Areas

                                                                                                                                          SME: Small and medium enterprise
                                                                                Source: Ambassador Cheng Jingye’s Speech at China SME Global Development Forum, June 2012

                         For institutional use only. Do not give, show or quote to any other person. Not to be used with retail investors. Do not duplicate or reproduce.
                                                                                                        © 2020 Matthews International Capital Management, LLC PT001t_4Q19   35
Valuation of Chinese Small Caps Remain Reasonable
Valuation re-rating has not yet happened despite improving sales and profits

PRICE EARNINGS RATIO
15x
13x

11x
 9x

 7x
 5x
  Dec-09   Dec-10      Dec-11   Dec-12             Dec-13               Dec-14              Dec-15               Dec-16               Dec-17               Dec-18              Dec-19

PRICE TO BOOK RATIO
1.5

1.3

1.1

0.9

0.7

0.5
  Dec-09   Dec-10      Dec-11   Dec-12             Dec-13               Dec-14              Dec-15               Dec-16               Dec-17              Dec-18               Dec-19

                                 Note: MSCI China Small Cap Index as of December 31, 2019. Indexes are unmanaged and it is not possible to invest directly in an index.
                                                                                                                                                        Source: FactSet Research Systems

                                 For institutional use only. Do not give, show or quote to any other person. Not to be used with retail investors. Do not duplicate or reproduce.
                                                                                                                © 2020 Matthews International Capital Management, LLC PT001t_4Q19   36
Chinese Small Caps Are Priced Attractively Against Global Small Caps
As of December 31, 2019

              GROWTH (EARNINGS)*                                                                                           VALUATION (P/E)

                                                                                                                                                       18.3x
                                 34%                                                                                   18.0x
                                                                                                                                       16.9x

                                                                                                                                                                        13.3x

              15%                                                                                       8.3x
    15%
                        12%                     11%

                  2019 EPS Growth*                                                                                        Price-to-Earnings Ratio

     MSCI China Small Cap       MSCI USA Small Cap                      MSCI Europe Small Cap                            MSCI India Small Cap                          MSCI China

                                     *EPS estimates from Bloomberg as of January 17, 2020, for companies that provided forward looking EPS. There is no guarantee that
                                      estimated EPS growth will be achieved. Indexes are unmanaged and it is not possible to invest directly in an index.
                                                                                                    Sources: Bloomberg, FactSet Research Systems; Valuations data as of December 31, 2019

                                     For institutional use only. Do not give, show or quote to any other person. Not to be used with retail investors. Do not duplicate or reproduce.
                                                                                                                    © 2020 Matthews International Capital Management, LLC PT001t_4Q19   37
Common Investor Fears When Investing in China

                    For institutional use only. Do not give, show or quote to any other person. Not to be used with retail investors. Do not duplicate or reproduce.
                                                                                                   © 2020 Matthews International Capital Management, LLC PT001t_4Q19   38
China Small Companies Do Not Depend on Leverage for Returns
As of December 31, 2019

                RETURN ON ASSETS                                                                                TOTAL DEBT TO TOTAL EQUITY

                                                                                                                                                       125%
     2.5%                                                                                                            119%             117%
                                                                                                    108%

                                                  1.9%                                                                                                                   91%
                            1.7%

               1.2%

                                     0.6%

     MSCI China Small Cap          MSCI USA Small Cap                    MSCI Europe Small Cap                           MSCI India Small Cap                        MSCI China

                                                                                                             Indexes are unmanaged and it is not possible to invest directly in an index.
                                                                      Sources: ROA data from Bloomberg; Total Debt/Equity data from FactSet Research Systems; data as of December 31, 2019

                                         For institutional use only. Do not give, show or quote to any other person. Not to be used with retail investors. Do not duplicate or reproduce.
                                                                                                                        © 2020 Matthews International Capital Management, LLC PT001t_4Q19   39
China Small Companies Fund Net Debt/Equity Profile
   We prefer asset light businesses with low leverage—79% of the portfolio companies in net cash

           400%

           300%

           200%

           100%

             0%
NET CASH

           -100%

           -200%

           -300%

                                Note: Each bar represents a holding in the Matthews China Small Companies Fund portfolio as of December 31, 2019. This information
                                is solely to illustrate Matthews Asia’s investment process. This process is subject to change. It should not be considered a
                                recommendation of any security listed, nor a representation as to whether a security is currently held by the Fund. Such information
                                should not be relied upon as investment advice regarding a particular investment, sector, industry or markets in general. Such
                                information does not constitute a recommendation to buy or sell specific securities or investment vehicles.
                                                                                                                       Source: FactSet Research Systems; data as of December 31, 2019
                                For institutional use only. Do not give, show or quote to any other person. Not to be used with retail investors. Do not duplicate or reproduce.
                                                                                                               © 2020 Matthews International Capital Management, LLC PT001t_4Q19   40
Small Caps in China Have Historically Been Less Volatile Over the Long Run
100-day historical volatility

Volatility
60%

50%

40%

30%

20%

10%

 0%
  Jan-10     Jan-11     Jan-12        Jan-13              Jan-14                Jan-15               Jan-16               Jan-17               Jan-18               Jan-19               Jan-20

                      MSCI China Index 100 Day Volatility                          MSCI China Small Cap Index 100 Day Volatility

                                                      Volatility is the standard deviation of returns. Indexes are unmanaged and it is not possible to invest directly in an index.
                                                                                                                                                    Source: Bloomberg as of January 17, 2020.
                                      For institutional use only. Do not give, show or quote to any other person. Not to be used with retail investors. Do not duplicate or reproduce.
                                                                                                                     © 2020 Matthews International Capital Management, LLC PT001t_4Q19   41
China Small Caps Volatility Similar to U.S. Small Caps
100-day historical volatility

Volatility (%)

60%

50%

40%

30%

20%

10%

 0%
  Jan-10         Jan-11   Jan-12      Jan-13             Jan-14              Jan-15               Jan-16              Jan-17               Jan-18              Jan-19              Jan-20

                           MSCI China Small Cap Index 100 Day Volatility                                 Russell 200 Index 100 Volatility

                                                                                                                                          Note: U.S. Small Cap (Russell 2000 Index)
                                                        Volatility is the standard deviation of returns. Indexes are unmanaged and it is not possible to invest directly in an index.
                                                                                                                                                      Source: Bloomberg as of January 17, 2020.
                                        For institutional use only. Do not give, show or quote to any other person. Not to be used with retail investors. Do not duplicate or reproduce.
                                                                                                                       © 2020 Matthews International Capital Management, LLC PT001t_4Q19   42
Matthews China Small Companies Fund Investment Process
                                                                                                       Approximately 300-500 companies
                                                             1. Actionable
                                                                                                       Market cap US$100 million to US$5 billion
                                                                Research
                                                                                                       Positive 3-year average revenue growth history
                                                                Universe
                                                                                                       Positive 3-year average operating income growth
                                                                                                             >10% Return on Invested Capital
Equity Selection Framework
Three pillar framework

                    GOOD BUSINESS (GB)                            APPROPRIATE VALUATION
                                                                  (AV)
                    • Industry structure
                      conducive to sustained                      • Sanity check
                      profitability                               • Less about market timing
                    • Secular growth                              • Try not to overpay
                    • Recurring demand                            • Appropriate discount for
                    • Barriers to entry                              small cap
                    • Self-financing, low
                      leverage

                                     GOOD MANAGEMENT (GM)
                                     • Transparency, integrity,
                                        professionalism
                                     • Alignment with minority
                                       shareholders
                                     • Execution track record
                                     • Deployment of capital

                                                       Parameters set by Matthews Asia are subject to change and may not reflect the fundamental policy of the Fund.
                              For institutional use only. Do not give, show or quote to any other person. Not to be used with retail investors. Do not duplicate or reproduce.
                                                                                                             © 2020 Matthews International Capital Management, LLC PT001t_4Q19   44
Resulting Portfolio has Favorable Characteristics

                                                           Sharpe Ratio                             Sharpe Ratio                                  Correlation
As of December 31, 2019
                                                             (1-Year)                                 (5-Year)                                     (5-Year)

China Small Companies Fund                                        2.29                                      0.52                                         1.00

MSCI China Small Cap Index                                        0.27                                     -0.01                                         0.88

MSCI Asia ex Japan Index                                          1.00                                      0.37                                         0.80

MSCI Emerging Markets Index                                       1.01                                      0.31                                         0.72

MSCI European Small Cap Index                                     1.80                                      0.55                                         0.59

MSCI U.S. Small Cap Index                                         1.47                                      0.55                                         0.50

                                Note: MSCI Asia ex Japan represented by iShares MSCI All Country Asia ex Japan ETF (AAXJ). MSCI MSCI Emerging Markets represented
                                by iShares MSCI Emerging Markets ETF (EEM), U.S. Small Cap represented by Russell 2000(RTY). Data as of December 31, 2019.
                                                                                                                                                        Source: FactSet Research Systems
                                For institutional use only. Do not give, show or quote to any other person. Not to be used with retail investors. Do not duplicate or reproduce.
                                                                                                               © 2020 Matthews International Capital Management, LLC PT001t_4Q19   45
China Small Companies Invests in Structural Growth Sectors
Key themes: Technology upgrade, healthy living, services upgrade and consumer goods upgrade

3-YEAR REVENUE CAGR*
  60

  50                                                                                                                        Productivity Upgrade
                           Real Estate
  40                                                                           Services Upgrade

  30                                                                                                            Technology Upgrade
                                          Supply Side Reform
  20
                                                                                                                                                 Healthy Living
  10
                                                           Logistics                               Consumer Goods
                                                                                                      Upgrade
   0

  -10

  -20
        -5    0        5                 10                 15                   20                    25                   30                   35                   40
                                                                   P/E NTM
                                                                                                                                        *CAGR=Compound Annual Growth Rate
                                                                                                     Note: The portfolio has a 10.6% weighting in Cash as of December 31, 2019
                                  Each bubble represents a portfolio theme as defined by Matthews Asia. Each bubble represents a plotting of the weighted averages
                                  for the noted data for the portfolio companies as grouped by the noted theme. The 3 year CAGR and forward P/E ratio data are for all
                                  securities held in the portfolio. Bubble sizes are in proportion to the theme weight percentage. There is no guarantee that the
                                  composition of the portfolio will remain unchanged. The forward price per earnings ratio (“Forward P/E”) is calculated by dividing the
                                  market price per share by the forecasted earnings per share for the next 12 months. There is no guarantee any estimates or
                                  projections will be realized.

                                                                                                        Sources: FactSet Research Systems, Matthews Asia; Data as of December 31, 2019
                                  For institutional use only. Do not give, show or quote to any other person. Not to be used with retail investors. Do not duplicate or reproduce.
                                                                                                                 © 2020 Matthews International Capital Management, LLC PT001t_4Q19   46
Risk Mitigation
Kissing frogs and kicking tires—no shortcuts

Risk Minimization Techniques
    Investigate management background and incentives

    Always validate the product
    Avoid related party transactions

    Avoid serial acquirers

    Check with upstream suppliers and downstream customers

    Check corporate governance activist sites
    Understand the short seller’s side of the story

                                   For institutional use only. Do not give, show or quote to any other person. Not to be used with retail investors. Do not duplicate or reproduce.
                                                                                                                  © 2020 Matthews International Capital Management, LLC PT001t_4Q19   47
China Will be the World’s Next Biotech Powerhouse by Necessity
Chinese biotech industry advanced by flood of returning talents and brave attitude towards innovation

CANCER INCIDENCE RATES DIFFERENT
BETWEEN CHINA AND THE WEST

                                                          Stomach

                                                    Liver

Prostate

           Multiple
           Myeloma

                 Less Incidence           More Incidence

                                  Source: Leukemia & Lymphoma Society, https://www.researchgate.net/figure/Estimated-cancer-incidence-2008-China-and-the-USA-
                                  male-all-ages_fig1_236925639, clinical data as of 2008

                                  For institutional use only. Do not give, show or quote to any other person. Not to be used with retail investors. Do not duplicate or reproduce.
                                                                                                                 © 2020 Matthews International Capital Management, LLC PT001t_4Q19   48
The Future of the Connected World is Built on Analog Semiconductor
China has an accelerated plan to build its own semiconductor ecosystem

                                                                                                                                                               Source: Analog Devices
                             For institutional use only. Do not give, show or quote to any other person. Not to be used with retail investors. Do not duplicate or reproduce.
                                                                                                            © 2020 Matthews International Capital Management, LLC PT001t_4Q19   49
Case Study | Silergy Corp
China’s largest analog semiconductor company

                                                               BARRIERS TO ENTRY

                  Manufacturing                                           Design                                              Long Sales Cycle

                                                            INNOVATIVE SOLUTIONS

                                                    Proprietary software design tool to
             Industry leading process
                                                               debottleneck                                      Design innovative first to market
            technology with outsource
                                                         R&D personnel shortage                                          system solutions
                 manufacturing

                                                                                                       Computers &
                                                                        RESULTS                          Storage
                                                                                                           5%

          Product flexibility with minimal            Fastest time to market with rapid
                                                         Communications                                             Rapid market share expansion
               capital investment                        addressable mkt expansion
                                                                   31%

                                       The information in this case study is presented solely to illustrate Matthews Asia’s investment process. It should not be considered a
                                       recommendation of the security discussed (the “Security”), nor a representation as to whether the Security is currently held by the
                                       Fund. The results of any possible investment in the Security are not representative of the results of other investments by the
                                       Fund. Performance of the Fund and a list of current holdings as of a recent date are available at matthewsasia.com. Past performance
                                       is no guarantee of future results. The statements above are based on the beliefs and assumptions of our portfolio management team
                                       and on the information currently available to our team at the time of such statements. Although we believe that the expectations
                                       reflected in these statements are reasonable, we can give no assurance that these expectations will prove to be correct.
                                                                                                                                                    Source: Semiconductor industry association
                                       For institutional use only. Do not give, show or quote to any other person. Not to be used with retail investors. Do not duplicate or reproduce.
                                                                                                                      © 2020 Matthews International Capital Management, LLC PT001t_4Q19   50
Software is Critical to Enhance Labor Productivity Going Forward
China has over 40 million small businesses, and employee turnover rate is 20.8%

SHARE OF GDP BY PRODUCTION APPROACH
60%

50%

40%

30%

20%

10%

0%
      1954   1959   1964        1969          1974            1979           1984            1989            1994           1999            2004            2009           2014            2019

                                       Primary industry                     Secondary industry                        Tertiary industry
                                                                                                                                                                                      Sources:
                                                                                   Small and Medium Enterprises In China, July 4th 2017 ( https://ecovis-beijing.com/investment/smes-china/);
                      Employer Turnover Rate: (http://www.newpointdeview.com/pro-en/intercultural-compentence/high-employee-turnover-in-china-not-matter-of-money/; turnover as of 2016);
                                                                                                                                                                            Share of GDP: CEIC
                                               For institutional use only. Do not give, show or quote to any other person. Not to be used with retail investors. Do not duplicate or reproduce.
                                                                                                                              © 2020 Matthews International Capital Management, LLC PT001t_4Q19   51
Investment Returns | Matthews China Small Companies Fund
As of December 31, 2019
                                                                                     AVERAGE ANNUAL TOTAL RETURNS

                                                                                                                                                             Since Inception
         3 Months                     1 Year                                   3 Years                                   5 Years                              (05/31/2011)

                                 35.41%

                                                                       19.71%

      11.16%                                                                                                      11.76%
               7.19%                         6.63%                                                                                                           6.31%
                                                                                        2.26%
                                                                                                                                  0.80%

                                                                                                                                                                            -0.19%

                       Matthews China Small Companies Fund (Investor Class)                                          MSCI China Small Cap Index

                         Assumes reinvestment of all dividends and/or distributions before taxes. All performance quoted
                         represents past performance and is no guarantee of future results. Investment return and principal value will
                         fluctuate with market conditions so that when redeemed, shares may be worth more or less than their original
                         cost. Current performance may be lower or higher than the return figures quoted. Returns would have been
                         lower if certain of the Fund’s fees and expenses had not been waived. For the Fund’s most recent month-end
                         performance visit matthewsasia.com. Indexes are unmanaged and it is not possible to invest directly in an index.
                                                                                                                                 Index since inception value calculated from 5/31/2011
                                                                                                                        Sources: BNY Mellon Investment Servicing, Bloomberg, Matthews Asia

                                      For institutional use only. Do not give, show or quote to any other person. Not to be used with retail investors. Do not duplicate or reproduce.
                                                                                                                     © 2020 Matthews International Capital Management, LLC PT001t_4Q19   52
Competitive Returns | Matthews China Small Companies Fund
As of December 31, 2019

                                                                               AVERAGE ANNUAL TOTAL RETURNS
                                                                                                                                                           Inception
                                 Year to Date         1 Year              3 Years             5 Years            10 Years         Since Inception
                                                                                                                                                             Date

 Investor Class (MCSMX)            35.41%            35.41%              19.71%              11.76%                  n.a                6.31%               5/31/11

 Institutional Class (MICHX)       35.68%            35.68%                 n.a                  n.a                 n.a                8.66%              11/30/17
                                                                                                                                                  1
 MSCI China Small Cap Index         6.63%             6.63%               2.26%               0.80%                  n.a               -0.19%

 Lipper China Region Funds                                                                                                                       1
                                   26.82%            26.82%              13.70%               7.13%                  n.a               4.59%
 Category Average

                                                                                                                                                                                  1As   of 5/31/2011
                      Assumes reinvestment of all dividends and/or distributions before taxes. All performance quoted represents past
                      performance and is no guarantee of future results. Investment return and principal value will fluctuate with market
                      conditions so that when redeemed, shares may be worth more or less than their original cost. Current performance may
                      be lower or higher than the return figures quoted. Returns would have been lower if certain of the Fund’s fees and
                      expenses had not been waived. For the Fund’s most recent month-end performance visit matthewsasia.com. Indexes
                      are unmanaged and it is not possible to invest directly in an index. Please refer to disclosures for index definition.
                                                                                                 The Lipper Category Average does not reflect sales charges and is based on total return,
                                                                                                            including reinvestment of dividends and capital gains, for the stated periods.
                                                                                                                              Sources: BNY Mellon Investment Servicing, Bloomberg, Matthews Asia
                                            For institutional use only. Do not give, show or quote to any other person. Not to be used with retail investors. Do not duplicate or reproduce.
                                                                                                                           © 2020 Matthews International Capital Management, LLC PT001t_4Q19   53
Portfolio Characteristics | Matthews China Small Companies Fund
As of December 31, 2019

SECTOR BREAKDOWN (%)
                         Fund      Benchmark                     Difference
Information Technology   18.2                 11.4                          6.8
Health Care              17.4                 11.1                          6.3
Industrials              16.7                 11.8                          4.9
Consumer Discretionary   15.0                 19.9                         -4.9
Consumer Staples         10.0                   2.9                         7.1
Real Estate               7.3                 19.1                       -11.8
Materials                 3.1                   9.4                        -6.3
Energy                    1.2                   1.9                        -0.7
Communication Services    0.5                   4.9                        -4.4
Financials                0.0                   3.9                        -3.9
Utilities                 0.0                   3.6                        -3.6
Cash and Other Assets,
                         10.6                   0.0                       10.6
Less Liabilities

                                                                                                                                         Benchmark: MSCI China Small Cap Index

                                                                        The information contained in this presentation does not, in any way, constitute investment advice.
                                                                                    Portfolio characteristics for the Fund may vary from time to time from what is shown.
                                                                                                                                Sources: FactSet Research Systems, Inc., Matthews Asia

                                For institutional use only. Do not give, show or quote to any other person. Not to be used with retail investors. Do not duplicate or reproduce.
                                                                                                               © 2020 Matthews International Capital Management, LLC PT001t_4Q19   54
Portfolio Characteristics | Matthews China Small Companies Fund
As of December 31, 2019

MARKET CAP EXPOSURE (%)
                               Fund   Benchmark             Difference
 Mega Cap (over $25B)           0.0             0.0                    0.0
 Large Cap ($10B-$25B)          0.0             0.0                    0.0
 Mid Cap ($3B-$10B)            18.9             1.6                  17.3
 Small Cap (under $3B)         70.5           98.4                  -27.9
 Cash and Other Assets, Less
                               10.6             0.0                  10.6
 Liabilities

PORTFOLIO CHARACTERISTICS
                                                                   Fund
 Assets                                                $95.8 million
 Weighted Average Market Cap                              $2.3 billion
 P/E using FY1 Estimates*                                         16.2x
                                                                                                                                                 Benchmark: MSCI China Small Cap Index
 P/E using FY2 Estimates*                                         14.2x
                                                                                              *The P/E Ratio is the share price of a stock as of the report date, divided by the
                                                                                              forecasted earnings per share for a 12-month period (FY1) and 24 month period
                                                                                              (FY2). For the Fund, this is the weighted harmonic average estimated P/E ratio of all
                                                                                              the underlying stocks in the Fund, excluding negative earners. There is no guarantee
                                                                                              that the composition of the Fund will remain unchanged, or that forecasted earnings
                                                                                              of a stock will be realized. Information provided is for illustrative purposes only.
                                                                               The information contained in this presentation does not, in any way, constitute investment advice.
                                                                                           Portfolio characteristics for the Fund may vary from time to time from what is shown.
                                                                                                                            Sources: FactSet Research Systems, Inc., Bloomberg, Matthews Asia

                                       For institutional use only. Do not give, show or quote to any other person. Not to be used with retail investors. Do not duplicate or reproduce.
                                                                                                                      © 2020 Matthews International Capital Management, LLC PT001t_4Q19   55
Top Ten Holdings | Matthews China Small Companies Fund
As of December 31, 2019

Company                                                                                                Sector                                                                     %
 Silergy Corp.                                                                                         Information Technology                                                    8.8
 SITC International Holdings Co., Ltd.                                                                 Industrials                                                               5.1
 China Meidong Auto Holdings, Ltd.                                                                     Consumer Discretionary                                                    3.8
 Asia Cement China Holdings Corp.                                                                      Materials                                                                 3.1
 China Overseas Property Holdings, Ltd.                                                                Real Estate                                                               2.7
 China Youzan, Ltd.                                                                                    Information Technology                                                    2.6
 Zai Lab, Ltd.                                                                                         Health Care                                                               2.5
 Greentown Service Group Co., Ltd.                                                                     Industrials                                                               2.4
 Alphamab Oncology                                                                                     Health Care                                                               2.3
 Venus MedTech Hangzhou, Inc.                                                                          Health Care                                                               2.1
Total for Top 10                                                                                                                                                               35.4%

                                          This information does not, in any way, constitute investment advice. Portfolio holdings may vary from time to time from what is
                                          shown. It should not be assumed that any investment in the securities listed was or will be profitable. The information does not
                                          constitute a recommendation to buy or sell any securities mentioned.
                                                                                                                                        Sources: BNY Mellon Investment Servicing, Matthews Asia

                                          For institutional use only. Do not give, show or quote to any other person. Not to be used with retail investors. Do not duplicate or reproduce.
                                                                                                                         © 2020 Matthews International Capital Management, LLC PT001t_4Q19   56
Attribution by Sector | Matthews China Small Companies Fund
Fourth Quarter 2019
Published Portfolio Return1                              11.16%                                                                                                                Selection +
                                                                                                             Average                  Average               Allocation                                 Total
                                                                                                                                                                               Interaction
Published Benchmark Return                                7.19%                                          Portfolio Wt            Benchmark Wt                   Effect                                Effect
                                                                                                                                                                                    Effect
Published Relative Return2                                3.97%
                                                                           Total                                 100.00                     100.00                  0.08                3.82            3.90
Attributable Portfolio Return                            11.08%
                                                                           Consumer
                                                                                                                   15.06                      20.01                -0.03                1.84            1.81
Attributable Relative Return                              3.90%            Discretionary
1   Published portfolio return represents that of the Investor             Health Care                             15.72                        9.80                0.47                0.55            1.02
    Share Class.
                                                                           Information
    The published relative return is calculated as the difference                                                  19.84                      10.97                 0.12                0.73            0.85
2                                                                          Technology
    of the published benchmark return from the published
    portfolio return.                                                      Industrials                             17.42                      11.86                 0.12                0.34            0.46

Benchmark: MSCI China Small Cap Index
                                                                           Utilities                                 0.00                       4.10                0.43                0.00            0.43
The attribution report shows the extent to which the portfolio             Financials                                0.00                       3.80                0.41                0.00            0.41
manager’s strategies affect a fund’s performance relative to the
performance of the fund’s benchmark index. Allocation Effect               Real Estate                               7.56                     19.66                -0.38                0.64            0.25
shows the effect on fund performance of either over- or under-
weighting a market (a sector, country or region, depending on the          Materials                                 2.82                       8.94               -0.12                0.34            0.22
type of fund) relative to its benchmark. Selection + Interaction
Effect shows how the decision to hold individual securities within         Energy                                    1.27                       1.90                0.04                0.01            0.04
the particular sector, country or region performed relative to the
benchmark.                                                                 Communication
                                                                                                                     1.59                       4.92                0.36               -0.44           -0.08
                                                                           Services
Attributed performance is calculated using FactSet Research
Systems, Inc. The methodology of calculation is different from the         Consumer Staples                        11.21                        3.49               -0.66                0.08           -0.58
published NAV and will not match performance based on the
published NAV. Performance shown is historical and no guarantee            Cash                                      7.67                       0.00               -0.61                0.00           -0.61
of future results. Current performance may be lower or higher.
Returns current to the most recent month-end are available at              Unassigned                               -0.16                       0.55               -0.06               -0.26           -0.32
matthewsasia.com. Investment returns and principal value will
fluctuate so that when redeemed, shares may be worth more or
less than their original cost. Benchmark performance is unaudited.
Please refer to the disclosures for index definition. Unassigned
may include fees, expense accruals, offsets, warrants and rights.

                                                         For institutional use only. Do not give, show or quote to any other person. Not to be used with retail investors. Do not duplicate or reproduce.
                                                                                                                                        © 2020 Matthews International Capital Management, LLC PT001t_4Q19   57
You can also read