2010 Barrie in a Changing Climate: a Focus on Adaptation - Ontario ...
←
→
Page content transcription
If your browser does not render page correctly, please read the page content below

March 30, 2010                           Barrie in a Changing Climate: a Focus on Adaptation

                                                                            2010
Barrie in a Changing Climate:
        a Focus on Adaptation

                                                                          Final Report

                                                                            Ontario Centre for Climate Impacts
                                                                                and Adaptation Resources
  Ontario Centre for Climate Impacts and Adaptation Resources - OCCIAR                   OCCIAR1
March 30, 2010                           Barrie in a Changing Climate: a Focus on Adaptation

Ontario Centre for Climate Impacts and Adaptation Resources
OCCIAR is a university‐based, resource hub for researchers and stakeholders that provides information
on climate change impacts and adaptation. The Centre communicates the latest research on climate
change impacts and adaptation, liaises with partners across Canada to encourage adaptation to climate
change and aids in the development of tools to assist with municipal adaptation. The Centre is also a
hub for climate change impacts and adaptation activities, events and resources.
 http://www.climateontario.ca

Regional Adaptation Collaborative
The Ontario Centre for Climate Impacts and Adaptation Resources (OCCIAR) is an Ontario partner in
Natural Resources Canada’s Regional Adaptation Collaboratives (RACs) Climate Change Program. It is a
three year program to help Canadians reduce the risks and maximize the opportunities posed by climate
change. The Program helps communities prepare for and adapt to local impacts posed by our changing
climate, such as: decreasing fresh water supplies; increasing droughts, floods and coastal erosion; and
changing forestry, fisheries and agricultural resources. The goal of the Program is to catalyze
coordinated and sustained adaptation planning, decision-making and action, across Canada’s diverse
regions. The RACs Program is a partnership between the federal government, provinces and territories,
working with local governments and organizations.
 http://adaptation.nrcan.gc.ca/collab/index_e.php

Acknowledgements
OCCIAR would like to thank Natural Resources Canada for their generous support of the Ontario
Regional Adaptation Collaborative. For more information please contact:

Al Douglas                                                 Jacqueline Richard
Director, OCCIAR                                           Coordinator, OCCIAR
MIRARCO/Laurentian University                              MIRARCO/Laurentian University
935 Ramsey Lake Road                                       935 Ramsey Lake Road
Sudbury, Ontario P3E 2C6                                   Sudbury, Ontario P3E 2C6
705‐675‐1151 ext 1506                                      705-675-1151 ext 2014
adouglas@mirarco.org                                       jrichard@mirarco.org

Dr. David Pearson
Professor, Department of Earth Sciences
Co‐Director, Science Communication Graduate Programme
Co‐Chair of Ontario’s Expert Panel on Climate Change Adaptation
Laurentian University
935 Ramsey Lake Road
Sudbury, Ontario P3E 2C6
705 675‐1151 x 2336
dpearson@laurentian.ca

Ontario Centre for Climate Impacts and Adaptation Resources - OCCIAR                             2
March 30, 2010                           Barrie in a Changing Climate: a Focus on Adaptation

              Barrie in a Changing Climate: A Focus on Adaptation

                                    Final Workshop Report

                                              City of Barrie

                                          March 30, 2010
                                                City of Barrie
                                    70 Collier Street, Council Chambers

                   Ontario Centre for Climate Impacts and Adaptation Resources
                                                at
                                             MIRARCO

Ontario Centre for Climate Impacts and Adaptation Resources - OCCIAR                             3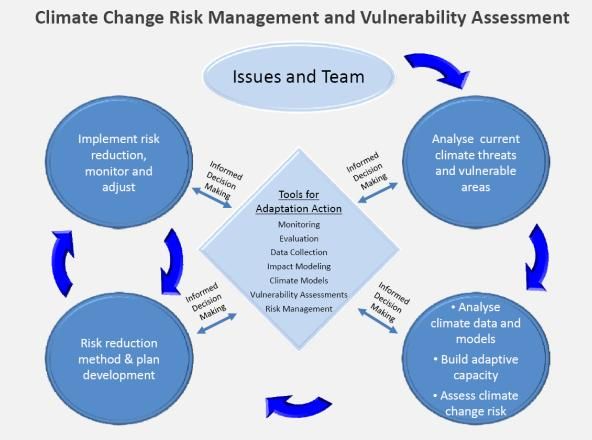
March 30, 2010                           Barrie in a Changing Climate: a Focus on Adaptation

                                    Workshop Highlights

    Knowing that the information used to provide guidance for building and design criteria is
    out of date (uses old climate data), engineers and planners stressed the importance of
    updating these standards to recognize changing climate effects.

    Conservation Authorities in the Barrie area (Nottawasaga Valley Conservation Authority and
    the Lake Simcoe Conservation Authority) are continuously seeking new information on
    climate change impacts and adaptation in order to assess their watershed risks and plan for
    the impacts of changing weather and climate.

    Environment Canada is working with the Canadian Standards Association (CSA) to improve
    rainfall intensity duration curves. The first part is to develop a guide to define what IDF
    curves are and how to use them. The second part will include more recent climate data.

    It is important to use language that will catch the attention of, and encourage stakeholders
    to participate in adaptation planning. Risk and probability language is useful as some people
    ask for one number (temperature or precipitation or frequency of extreme events) and plan
    for that. Those people need to be reminded that planning to that point in time is not
    advisable due to tuncertainty in the models. Climate projections are educated estimates
    that can help to explain the need for adaptation.

    The 49th parallel storm was a real event, in fact it was one of the largest on record for
    Ontario, but there is still no decision on whether this storm will become the new regulatory
    storm.

    Federal and provincial governments need to set reasonable standard with respect to flood
    design, but need the support of the community. Communities need to work together to
    meet these standards.

    Conservation Authorities are uniquely positioned to help municipalities plan for the impacts
    of climate change through adaptation.

Ontario Centre for Climate Impacts and Adaptation Resources - OCCIAR                             4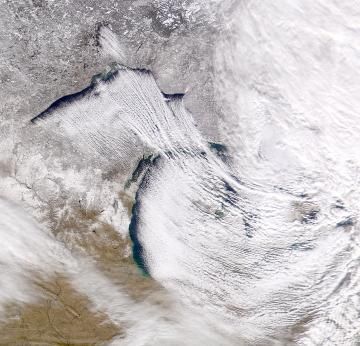
March 30, 2010                                         Barrie in a Changing Climate: a Focus on Adaptation

Table of Contents

Workshop Highlights ....................................................................................................................... 4
Table of Contents ............................................................................................................................ 5
Workshop Agenda........................................................................................................................... 6
Presentations .................................................................................................................................. 7
Resources ...................................................................................................................................... 14
Appendix A – Delegate Package ................................................................................................... 15

Ontario Centre for Climate Impacts and Adaptation Resources - OCCIAR                                                                   5
March 30, 2010                           Barrie in a Changing Climate: a Focus on Adaptation

                                        Workshop Agenda

8:30 – 8:45     Welcome/Introduction – Councillor Lynn Strachan, City of Barrie

8:45 – 9:15     The Science of Climate Change
                Dr. David Pearson, Co-chair of Ontario’s Expert Panel on Climate Change
                Adaptation

9:15 – 10:15 Roundtable Discussion

10:15 – 10:30 Break

10:30 – 11:00 Climate Change Impacts and Municipal Infrastructure
              Heather Auld, Environment Canada

11:00 – 11:30 Climate Change versus Stormwater Infrastructure
              Mike Hulley, XCG Consulting Ltd

11:30– 12:00 Climate Change and Source Water Protection Planning
             Kathy Zaletnik-Hering, Ontario Ministry of the Environment

12:00 – 1:00 Lunch

1:00 – 1:30     Community Energy Planning (TBD)

1:30 – 2:00     Towards Adaptation in Ontario: Tools and Frameworks
                Al Douglas, Ontario Centre for Climate Impacts and Adaptation Resources

2:00 – 2:30     Introduction to the Vulnerability/Risk Assessment Framework
                Al Douglas, Ontario Centre for Climate Impacts and Adaptation Resources

2:30 – 3:00     Flooding in the City of Peterborough – Lessons Learned
                Dan Ward, Flood Reduction Program Manager, City of Peterborough
3:00 – 3:15     Break

3:15 – 3:45     Climate Change from a Conservation Authority Perspective
                Don Haley, Toronto Region Conservation Authority

3:45 – 4:30     Summary Presentation: Roles and Responsibilities of the Municipality and Next
                Steps

4:30            Closing Remarks

Ontario Centre for Climate Impacts and Adaptation Resources - OCCIAR                             6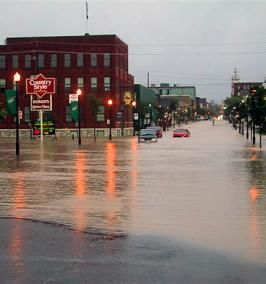
March 30, 2010                           Barrie in a Changing Climate: a Focus on Adaptation

                                            Presentations
The following are brief summaries of the presentations made at the workshop. Presentations
are available for viewing on the www.climateontario.ca website.

The Science of Climate Change
No going back… Managing the unavoidable while avoiding the unmanageable (we hope).
Dr. David Pearson, Co-chair of Ontario’s Expert Panel on Climate Change Adaptation

Dr. Pearson began his presentation with an annual temperature trend graph (1948-2008) of
Canada indicating that most of the warming has occurred in the northwest of the country. In
the Barrie area, the annual mean temperature has increased approximately 1.6°C over the past
30 years, with winter temperature increasing slightly more than summer temperatures. Dr.
Pearson stated that this has implications for winter tourism. Climate change has already
affected winter tourism in Ottawa where Winterlude has been changed to 3 weekends due to
                                    warmer winter temperatures and variability in the
                                    weather.
                                    When looking at the global temperature trend over the
                                    last 140 years, temperature begins to increase around
                                    1920 to about 1945 where it begins to decrease. This
                                    trend continues to the mid 1970’s where it begins to
                                    increase again. The cooling that occurred between 1945
                                    and 1970 was due to aerosol particles in the atmosphere
                                    acting like clouds, reducing the amount of solar radiation
                                    reaching the ground. Once abatement program began,
reducing the amount of aerosols in the atmosphere, the temperature began to increase again.
Dr. Pearson continued by talking about the geometry of the earth, the geological past and the
ocean and their connection to temperature and carbon dioxide.
Looking forward, communities need to look at the past and the climate record to see where the
critical thresholds (or coping ranges) have been exceeded (e.g. Peterborough Flood).
Vulnerability becomes evident when these thresholds have been passed. With climate change,
there may be a greater probability that the coping ranges will be exceeded. Adaptation will be
required to extend the coping range.
Impacts have already been and will continue to be seen in many sectors into the future. For
example, winter tourism is expected to be impacted because of shorter, warmer winters. Less
reliable snow conditions, more rain and less snow and a shorter lake ice cover period will have
an impact on cross country skiing and snowmobiling. Downhill skiing operations will have to
rely increasingly on snow-making.
Ontario Centre for Climate Impacts and Adaptation Resources - OCCIAR                             7
March 30, 2010 Barrie in a Changing Climate: a Focus on Adaptation
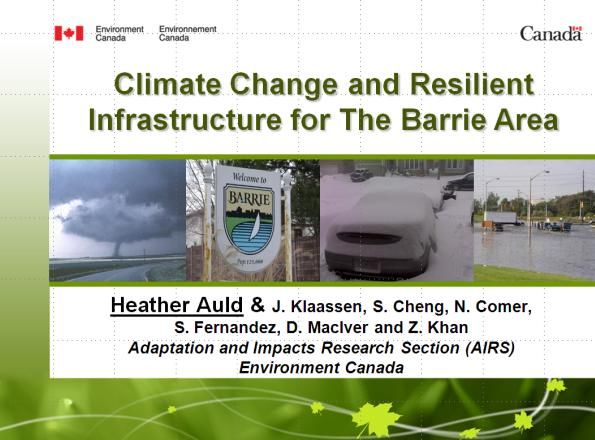
Climate Change Impacts and Municipal Infrastructure
Climate Change and Resilient Infrastructure for the Barrie Area
Heather Auld, Environment Canada
Climate change is not about mitigation or adaptation, it’s about both. We need to reduce our
greenhouse gas emissions in order to stabilize the climate while adaptation will help us deal
with the inevitable impacts that are already locked in due to past and current emissions.
Mitigation may be seen as a choice, but we will have to take adaptation actions. The changing
climate will impact our safety, security and economy for centuries (along with create some
opportunities). How well are we doing? We are tracking worse than the one of the worst case
emission scenarios developed by the Intergovernmental Panel on Climate Change.
In Canada, $300 billion of infrastructure is constructed on the assumption that the past climate
extremes will represent the future. This is important when you consider that small increases in
weather and climate extremes have the
potential to result in large increases in
damages to existing infrastructure (e.g. 25%
increase in peak gusts causing a 650%
increase in building damage-Australian
study).
Increasing climate/weather extremes will
pose risks to various types of infrastructure.
For example, extreme wind, experienced in
the US due to warm fronts, will come north
with increasing temperatures.
Adaptation measures such as tornado proofing measures for homes (anchoring mobile homes)
are sometimes easy to do and are considered ‘low hanging fruit’. Other adaptations such as
“flexible design” are needed to accommodate future changes in rainfall (e.g. TRCA is designing
flood control berms to handle an extra meter of flooding). The City of Ottawa has made
changes to their winter road and sidewalk maintenance by-laws to accommodate their
changing winters. Human health will be impacted by increase in extreme heat and the
increased risk of new diseases (e.g. Lyme disease and West Nile Virus). Toronto’s Health Heat
Alert began as a one year pilot project and has now been in effect for 9 years. Currently the
demand for energy is greater in the winter months for warming. Under climate warming, that
demand could shift to summer months for cooling.
Ontario Centre for Climate Impacts and Adaptation Resources - OCCIAR 8March 30, 2010 Barrie in a Changing Climate: a Focus on Adaptation Climate Change versus Stormwater Infrastructure Mike Hulley, XCG Consulting Ltd The consensus is that global average temperatures are increasing due to increased emissions of greenhouse gases. It is projected that southern Ontario will experience increases in precipitation and changes in the number of drought days. This has implications for stormwater design. Intensity/Duration/Frequency (IDF) curves (return periods) are the basis for stormwater infrastructure design. Recent research addressed IDF rainfall design curves and analysed the longest and strongest precipitation records across Canada. A rigorous methodology was developed and the only location with statistically significant positive rainfall trend was in Yellowknife. The Storm Sewer Era, between 1880 and 1970, was focused on collecting and moving water away. During the Stormwater Management Era, between 1970 and 1990, the focus was on controlling the flow and quality (to minimize erosion). During the Urban Stormwater BMP Era, between 1990 and 2007, the focus was on peak flow and quality control. The focus today (and tomorrow) will be on Low Intensity Development (e.g. green roofs, bio-filters) to maintain base flow with infiltration. The sensitivity to stormwater infrastructure to climate change depends on the magnitude of expected changes and the type of infrastructure. If rainfall increases, do we increase the size of the pipe or increase storage (and by how much)? If rainfall increases, existing infrastructure may be under-designed, and more frequent maintenance may be required, but retrofitting opportunities do exist. Stormwater design criteria and methodology should be examined as they have not changed in many years, may not reflect current or future risk and in many cases does not reflect advances in science or best available technology. Furthermore, climate change should be viewed as an additional uncertainty (other uncertainties include future population growth, new standards, new financing models) and design criteria should relate to this uncertainty. Finally, when considering adaptation, planning and design should be flexible. Plans should be revised as criteria and methodologies evolve. Ontario Centre for Climate Impacts and Adaptation Resources - OCCIAR 9
March 30, 2010                           Barrie in a Changing Climate: a Focus on Adaptation

Towards Adaptation in Ontario: Tools and Frameworks
Al Douglas, Ontario Centre for Climate Impacts and Adaptation Resources
The impacts of climate change are being felt in Ontario and as we continue to emit CO 2,
adaptation becomes more important. There are tools and frameworks available to enable
adaptation. The trajectory of global fossil fuel emissions are tracking worse than the ‘worst-
case-scenario’ developed by the IPCC. Historical climate trends help determine how
temperature and precipitation has changed and future climate projections can help us
understand how it will continue to change. Climate data and observations of climatic hazards
(i.e. winter roads, water levels, ice cover, flooding, etc) drive the need for adaptation.
Adaptation is happening in Ontario. For example, the Toronto Region Conservation Authority is
conducting modeling and analysis exercises to understand how the watershed will respond to
the impacts of climate change and the Credit Valley Conservation Authority has updated its
strategic plan to elevate the importance of
climate change in their operation.
How do we adapt? There are several methods
and tools that support adaptation: sensitivity
analysis, impact assessments, vulnerability
assessments, risk management, adaptive
management and others. A climate change
risk management approach has been
developed and stems from an International
Standard for risk management. Vulnerability
analyses which help identify current
vulnerabilities also ascertain how impacts have been coped with in the past and with climate
change in mind and determines the extent of additional vulnerability in the future. OCCIAR has
also seen the benefit of combining the risk management and vulnerability assessments
together.
All of these methods have a few common principals. For example: understand the risks,
thresholds and uncertainties and prioritize risks; address risks associated with today’s climate
vulnerability and extremes; use adaptive capacity to cope with uncertainty; recognize the value
of no or low regrets and win-win adaptation options; avoid actions that limit future adaptation;
and review the effectiveness of adaptation decisions.
There are many guidebooks available to assist communities with adaptation as well as
protocols for industries, such as Engineers Canada’s PIEVC protocol.

Ontario Centre for Climate Impacts and Adaptation Resources - OCCIAR                             10
March 30, 2010                           Barrie in a Changing Climate: a Focus on Adaptation

Introduction to the Vulnerability/Risk Assessment Framework
Al Douglas, Ontario Centre for Climate Impacts and Adaptation Resources

Risk management is a framework that is already understood by stakeholders and decision-
makers. It is appropriate for quick scans or large adaptation projects and deals with uncertainty
relatively well. Collaborating between multiple departments and considered along side of
multiple stressors, it helps develop feasible adaptation options.

                                                        Risk Assessment Process breakout sessions
                                                        are a component of OCCIAR workshops. The
                                                        facilitated sessions take participants through
                                                        the process, step-by-step, using a fictitious
                                                        case study. There are several steps in the risk
                                                        process, which are as follows.

                                                    In the first step climate hazards are identified,
                                                    the project team is established and a risk
                                                    library is started. Climate hazards can include
                                                    higher intensity rainfalls, higher nighttime
                                                    temperatures and/or more frequent storms.
                                                    The next step is the preliminary analysis where
                                                    risk scenarios are developed for each of the
hazards identified in the first step. In the risk estimation step, the frequency or likelihood and
the consequences of possible outcomes are estimated and risk is prioritized in the risk
evaluation step. The next step involves identification and evaluation of adaptation or risk
control options, beginning with the highest priority risks. In the last step, implementation plans
and monitoring processes are developed.

There are challenges posed by this process such as perceived linearity, dealing with critical
thresholds, the flexibility of adaptive measures, speed of responses due to changes in climate
or other factors, the perception of “economy versus ecology” and the ability to apply it to small
communities.

Adaptation is happening in Ontario. This framework and others are available to help guide
communities. The process can be tailored to fit your specific community.

Ontario Centre for Climate Impacts and Adaptation Resources - OCCIAR                             11
March 30, 2010 Barrie in a Changing Climate: a Focus on Adaptation
Flooding in the City of Peterborough – Lessons Learned
Dan Ward, Flood Reduction Program Manager, City of Peterborough
On July 14 and 15, 2004, Peterborough experienced a significant
rainfall that led to city wide flooding. Damage from the flood
affected virtually every part of the city.
Previously in 2002, the town experienced flooding to a lesser
extent but failed to develop a systematic response to the flooding
issue. The flood in 2004 was ten times worse.
Roads were washed out, roads and bridges were underwater and
downtown businesses and basements were completely flooding.
Five years after the flood, the true cost to the city taxpayers is still unknown. Damage estimates
range from 50 million to 100 million dollars (or higher). The Flood Reduction Master Plan,
which was prepared shortly after the 2004 flood, suggested that it will take 10 to 20 years to
complete all the flood reduction projects.
Picking up flood related garbage and debris was a major undertaking. Approximately 12,500
metric tonnes was placed in the landfill between July 16th and 27th (compared to a normal
period with 3000 metric tonnes) and on July 15th the sewage treatment plant recorded a peak
flow of 7 million gallons (compared to normal flow of 1.3 million gallons/day).
Unlike the lack of response following the 2002 floods, city council knew they had to take action.
The city commissioned a Flood Specialty Engineering firm to prepare the Flood Reduction
Master Plan (FRMP). The FRMP was adopted by council and is the blueprint for the City’s
present and future flood reduction projects.
The city was divided into 8 distinct watersheds and to date Environmental Assessments have
been completed on seven of them. Other studies include: a storm and sanitary system survey,
smoke and dye testing, soil and groundwater inventory, CCTV inspection of pipes, sewer flow
rate and rainfall survey and detailed sanitary sewer environmental assessment. In 2005, council
approved funds for a Backwater Valve Subsidy Program ($1 million plus). The program, which is
still available, subsidizes BWV installation to a maximum of $800 and foundation drain
disconnection from sanitary sewer system and sump pit installation to a maximum of $800
($1800 if both done together). To date, approximately $525,000 has been spent.
What did Peterborough learn from the experience? Communication can always be better,
electronic data makes everything easier, your Emergency Preparedness Plan is not as good as
you think, it is important to keep good records from the beginning, keep the media up to date
and have a funding source, hire experts where needed, do not forget that normal business must
continue, accept that recovery will take a long time, be open and truthful with the public and
keep the need in front of council well after the event starts to fade from their minds.
Ontario Centre for Climate Impacts and Adaptation Resources - OCCIAR 12March 30, 2010 Barrie in a Changing Climate: a Focus on Adaptation
Climate Change from a Conservation Authority Perspective
Don Haley, Toronto Region Conservation Authority
The TRCA has identified that meeting the challenges of climate change will be critical in
achieving a healthy, sustainable urban region into the future. They have developed “Meeting
the Challenge of Climate Change: TRCA Action Plan for the Living City”.
Natural systems are already stressed due to land use change. Climate change will add more
stress to the existing vulnerabilities. While some aspects of climate change are well
documented (e.g. anticipated change in mean annual temperature), others have increased
uncertainties. Uncertainty cannot be seen as a reason to hesitate in integrating anticipated
changes into management programs. Events like the August 2005 storm in Toronto should
serve as a reminder of what we can expect in the future.
Within the TRCA watersheds, they are
already dealing with impacts of urbanization
on the ecosystem (heat island effect, smog,
urban flooding, erosion, invasive species and
impacted water quality). Climate change will
create significant, new challenges.
The TRCA believes that Conservation
Authorities are in a unique position to be
able to deal with climate change from both
an adaptation and mitigation perspective.
CAs already manage systems and already
understand the issues of multiple stressors. CAs can provide effective direction and input
around managing watershed changes and ecosystems under the challenges that climate change
will create.
To integrate climate change into the business of the TRCA and to provide direction to their
municipal clients, their strategy will include: developing and maintaining a knowledge base of
climate change issues; creating a process that fits into their existing business framework;
creating a process to pass along this knowledge to their clients; and creating partnerships with
public and private sectors to accelerate implementation.
Other Conservation Authorities, such as the Upper Thames, Grand, Credit and Mississippi are all
involved in assessing climate impacts in their watersheds with the intent to develop
comprehensive strategies to position themselves to adapt to a changing climate.
Ontario Centre for Climate Impacts and Adaptation Resources - OCCIAR 13March 30, 2010 Barrie in a Changing Climate: a Focus on Adaptation Atmospheric Hazards – Canada www.hazards.ca Adapting to Climate Change in Ontario Report of the Expert Panel on Climate Change Adaptation http://www.ene.gov.on.ca/publications/7300e.pdf Meeting the Challenge of Climate Change: TRCA Action Plan for The Living City http://www.trca.on.ca/dotAsset/16642.pdf Adapting to Climate Change: An Introduction for Canadian Municipalities http://www.gnb.ca/0009/0369/0018/0006-e.pdf Preparing for Climate Change: A Guidebook for Local, Regional and State Governments http://cses.washington.edu/db/pdf/snoveretalgb574front.pdf Climate adaptation: Risk uncertainty and decision-making http://www.ukcip.org.uk/images/stories/Pub_pdfs/Risk.pdf Cities preparing for Climate Change: A Study of Six Urban Regions http://www.cleanairpartnership.org/pdf/cities_climate_change.pdf An Overview of the Risk Management Approach to Adaptation to Climate Change in Canada http://adaptation.nrcan.gc.ca/pdf/NobleBruceEgener2005_e.pdf Adapting to Climate Change: A Risk-based Guide for Ontario Municipalities http://adaptation.nrcan.gc.ca/projdb/pdf/176a_e.pdf City of Peterborough Flood Reduction Master Plan http://www.peterborough.ca/Assets/City+Assets/Flood+Reduction/Documents/Flood+Docume nts/Flood+Reduction+Master+Plan.pdf Ontario Centre for Climate Impacts and Adaptation Resources - OCCIAR 14
March 30, 2010                           Barrie in a Changing Climate: a Focus on Adaptation

Appendix A – Delegate Package

Ontario Centre for Climate Impacts and Adaptation Resources - OCCIAR                             15
March 30, 2010                           Barrie in a Changing Climate: a Focus on Adaptation

Climate is naturally variable and has changed significantly over the history of the Earth. Over the past
two million years, the Earth's climate has alternated between ice ages and warm interglacial periods.
There are a number of climate variability drivers, from changes in the Earth's orbit, changes in solar
output, sunspot cycles, volcanic eruptions, to fluctuations in greenhouse gases and aerosol
concentrations. When considered together, they effectively explain most of the climate variability over
the past several thousand years. These natural drivers alone, however, cannot account for the increase
in temperature and accompanying suite of climatic changes observed over the 20th century.

Climate change may manifest itself as a shift in mean conditions or as changes in the variance and
frequency of extremes of climatic variables. Eleven of the last twelve years (1995-2006) rank among the
twelve warmest years in the instrumental record of global surface temperature (since 1850) (IPCC 2007).
There is growing recognition that planning for these changes may pose challenging problems for natural
resource managers (IPCC 2001). There is confidence in the ability of climate simulation models to
provide natural resource managers with useful projections of future climate scenarios to support
planning and management across a range of space and time scales.

Globally, two broad policy responses to address climate change have been identified. The first is
mitigation, which is aimed at slowing down climate change by emitting less greenhouse gases in the
atmosphere or capturing it through various sequestration methods. The second is adaptation, which is
aimed at adjusting resource uses and economic activities in order to moderate potential impacts or to
benefit from opportunities associated with climate change. The primary focus of this workshop is on the
latter approach.

Figure 1: Adaptation and mitigation in the context of climate change (modified from Smit et al., 1999
cited in Lemmen et al., 2008).

Ontario Centre for Climate Impacts and Adaptation Resources - OCCIAR                             16
March 30, 2010                           Barrie in a Changing Climate: a Focus on Adaptation

There is consensus among scientists from around the world that climate change is occurring, that the
impacts are already being felt in regions all around the world and that they will only get worse. “Impacts
due to altered frequencies and intensities of extreme weather, climate and sea-level events are very
likely to change” (IPCC 2007).
Even after implementing measures to reduce greenhouse gas emissions, some degree of climate change
is inevitable and is already having economic, social and environmental impacts on communities.
Adaptation limits the negative impacts of climate change and takes advantage of new opportunities. It is
not an alternative to reducing greenhouse gas emissions in addressing climate change, but rather a
necessary complement. “Adaptation will be necessary to address impacts resulting from the warming
which is already unavoidable due to past emissions” (IPCC 2007). Reducing greenhouse gas emissions
decreases both the rate and overall magnitude of climate change, which increases the likelihood of
successful adaptation and decreases associated costs. Adaptation is not a new concept as many
approaches have already allowed us to deal with our extremely variable climate. The nature and rate of
future climate change, however, poses some new challenges.
Ontario is relatively well adapted to present climatic conditions; however, it may not be ready for the
impacts resulting from changes in average and extreme climatic conditions. Recently, Ontario has
experienced climatic events such as such as drought, flooding, heat waves and warmer winters. These
have resulted in a wide range of impacts including water shortages, lower Great Lakes water levels,
declines in agricultural production, power outages and outbreaks of water-borne diseases.
Developing an effective strategy for adaptation requires an understanding of our vulnerability to climate
change. “Future vulnerability depends not only on climate change but also on development pathway”
(IPCC 2007). Vulnerability is determined by three factors: the nature of climate change, the climatic
sensitivity of the system or region being considered, and our capacity to adapt to the resulting changes.
The tremendous geographic, ecological and economic diversity of Canada means that the 3 factors
mentioned above, and hence vulnerabilities, vary significantly across the country. In many cases,
adaptation will involve enhancing the resiliency and adaptive capacity of a system to increase its ability
to deal with stress.
Adaptation responses include biological, technical, institutional, and economic, behavioural and other
adjustments that reduce vulnerability to the adverse impacts, or take advantage of positive effects, from
climate change. Effective responses to climate change require an integrated portfolio of responses that
include both mitigation and adaptation.

Ontario is generally well equipped to adapt to climate change, but this adaptive capacity is not uniformly
distributed across the province. Indicators such as: economic resources; availability of, and access to,
technology, information and skills; and the degree of preparedness of its infrastructure and institutions
(Smit, et al., 2001) are all necessary in developing and acting on a climate change adaptation strategy.

Ontario Centre for Climate Impacts and Adaptation Resources - OCCIAR                             17
March 30, 2010                           Barrie in a Changing Climate: a Focus on Adaptation

It is imperative that decision-makers understand current vulnerabilities and the extent of future change
to make well-informed adaptation planning decisions. Without this, insufficient actions or actions that
inadvertently increase vulnerabilities could be made.

The Ontario Centre for Climate Impacts and Adaptation Resources is a university-based, resource hub
for researchers and stakeholders searching for information on climate change impacts and adaptation.
The centre communicates the latest research on climate change impacts and adaptation; liaises with
partners across Canada to encourage adaptation to climate change and aids in the development of tools
to assist with municipal adaptation.
The mandate of the Ontario Centre for Climate Impacts and Adaptation Resources (OCCIAR) is to:
effectively communicate the science of climate change including its current and future impacts;
encourage the development and implementation of adaptation strategies in order to reduce climate
vulnerability and increase resiliency; create and foster partnerships with stakeholder groups; and
support the work of Ontario’s Expert Panel on Climate Change Adaptation. . The Centre will also be a
hub for climate change impacts and adaptation activities, events and resources.

The objectives of today’s workshop are to:
    Present the global and local context of climate change and help increase awareness of the potential
    impacts of climate change in Ontario and the need for resilience-building in the area;
    Identify what municipalities/counties and conservation authorities can do and are doing to both
    help mitigate and adapt to climate change;
    Present different methods of adaptive planning and facilitate an interactive climate change risk
    assessment framework; and
    Introduce the Ontario Centre for Climate Impacts and Adaptation Resources and its role in
    developing resources and communicating climate change throughout the province of Ontario.

Ontario Centre for Climate Impacts and Adaptation Resources - OCCIAR                             18
March 30, 2010 Barrie in a Changing Climate: a Focus on Adaptation
Workshop Agenda
8:30 – 8:45 Welcome/Introduction – Councilor, City of Barrie
8:45 – 9:15 The Science of Climate Change
Dr. David Pearson, Co-chair of Ontario’s Expert Panel on Climate Change
Adaptation
9:15 – 10:15 Roundtable Discussion
10:15 – 10:30 Break
10:30 – 11:00 Climate Change Impacts and Municipal Infrastructure
Heather Auld, Environment Canada
11:00 – 11:30 Climate Change versus Stormwater Infrastructure
Mike Hulley, XCG Consulting Ltd
11:30– 12:00 Climate Change and Source Water Protection Planning
Kathy Zaletnik-Hering, Ontario Ministry of the Environment
12:00 – 1:00 Lunch
1:00 – 1:30 Community Energy Planning (TBD)
1:30 – 2:00 Towards Adaptation in Ontario: Tools and Frameworks
Al Douglas, Ontario Centre for Climate Impacts and Adaptation
Resources
2:00 – 2:30 Introduction to the Vulnerability/Risk Assessment Framework
Al Douglas, Ontario Centre for Climate Impacts and Adaptation
Resources
2:30 – 3:00 Flooding in the City of Peterborough – Lessons Learned
Dan Ward, Flood Reduction Program Manager, City of Peterborough
3:00 – 3:15 Break
3:15 – 3:45 Climate Change from a Conservation Authority Perspective
Don Haley, Toronto Region Conservation Authority
3:45 – 4:30 Summary Presentation: Roles and Responsibilities of the Municipality and
Next Steps
4:30 Closing Remarks
Ontario Centre for Climate Impacts and Adaptation Resources - OCCIAR 19March 30, 2010 Barrie in a Changing Climate: a Focus on Adaptation The following is a compilation and summarization of weather and climate data for Barrie, Ontario. Data were obtained from Environment Canada. Daily climate data from Barrie WCPP weather station, obtained from Environment Canada, was averaged to obtain monthly values for temperature and precipitation (Environment Canada, 2008). Seasonal climate values (winter –DJF and summer -JJA) were calculated by averaging the monthly data. In the following section, temperature and precipitation data, for the years 1956 to 2008, are displayed annually and seasonally (summer and winter) with line charts (Figures 2 to 13) and includes mean, maximum and minimum temperature and annual precipitation. Data was missing from 1980, 1987, 1988, 1994, 2005, 2006, 2007 and 2008. Annual means could not be calculated for these years. Winter means could not be calculated for 1980, 1988, 1995, 2007 and 2008. Summer means could not be calculated for 1980, 1988, 2006, 2007 and 2008. Annual mean for precipitation could not be calculated for 2005, 2006, 2007 and 2008. Mean temperature is defined as the average of temperature readings taken over a specified amount of time; for example, daily mean temperatures are calculated from the sum of the maximum and minimum temperatures for the day, divided by 2 (Environment Canada, 2008). Maximum temperature is the highest or hottest temperature observed for a specific time interval and minimum temperature is the lowest or coldest temperature for a specific time interval (Environment Canada, 2008). Precipitation includes any and all forms of water, liquid or solid, that falls from clouds and reaches the ground and is expressed in terms of the vertical depth of water that reaches the ground during a stated period (Environment Canada, 2008). Total precipitation (mm) is the sum of all rainfall and the water equivalent of the total snowfall observed during the day (Environment Canada, 2008). According to Environment Canada (2008), most ordinary stations compute water equivalent of snowfall by dividing the measured amount by ten; however, at principal stations it is usually determined by melting the snow that falls into Nipher gauges. This method normally provides a more accurate estimate of precipitation than using the "ten-to-one" rule (Environment Canada, 2008). Ontario Centre for Climate Impacts and Adaptation Resources - OCCIAR 20
March 30, 2010                   Barrie in a Changing Climate: a Focus on Adaptation

Annual

                                        Average Annual Mean Temperature - Barrie
                    9

                    8
   Temperature °C

                    7

                    6

                    5

                    4
                            1987

                            1995
                            1978
                            1979
                            1980
                            1981
                            1982
                            1983
                            1984
                            1985
                            1986

                            1988
                            1989
                            1990
                            1991
                            1992
                            1993
                            1994

                            1996
                            1997
                            1998
                            1999
                            2000
                            2001
                            2002
                            2003
                            2004
                            2005
                            2006
                            2007
                            2008
                                                             Year

Figure 2: Average annual mean temperature (°C) from 1978 to 2008. Data from Barrie WPCC
(Environment Canada, 2010) shows that the temperature at this location has increased 1.7 °C
over the 31 years of record

                                      Average Annual Maximum Temperature - Barrie
                    15
                    14
   Temperature °C

                    13
                    12
                    11
                    10
                        9
                        8
                            1978

                            1987
                            1979
                            1980
                            1981
                            1982
                            1983
                            1984
                            1985
                            1986

                            1988
                            1989
                            1990
                            1991
                            1992
                            1993
                            1994
                            1995
                            1996
                            1997
                            1998
                            1999
                            2000
                            2001
                            2002
                            2003
                            2004
                            2005
                            2006
                            2007
                            2008

                                                              Year

Figure 3: Average annual maximum temperature (°C) from 1978 to 2008. Data from Barrie WPCC
(Environment Canada, 2010) shows that the temperature at this location has increased 1.9 °C
over the 31 years of record

Ontario Centre for Climate Impacts and Adaptation Resources - OCCIAR                                   21
March 30, 2010 Barrie in a Changing Climate: a Focus on Adaptation
Average Annual Minimum Temperature - Barrie
4.0
3.5
3.0
Temperature °C
2.5
2.0
1.5
1.0
0.5
0.0
1978
1979
1980
1981
1982
1983
1984
1985
1986
1987
1988
1989
1990
1991
1992
1993
1994
1995
1996
1997
1998
1999
2000
2001
2002
2003
2004
2005
2006
2007
2008
Year
Figure 4: Average annual minimum temperature (°C) from 1978 to 2008. Data from Barrie WPCC
(Environment Canada, 2010) shows that the temperature at this location has increased 1.6 °C
over the 31 years of record
Total Annual Precipitation - Barrie
1200
1100
Precipitation (mm)
1000
900
800
700
600
1988
2007
1978
1979
1980
1981
1982
1983
1984
1985
1986
1987
1989
1990
1991
1992
1993
1994
1995
1996
1997
1998
1999
2000
2001
2002
2003
2004
2005
2006
2008
Year
Figure 5: Total annual precipitation (mm) from 1978 to 2008. Data from Barrie WPCC (Environment
Canada, 2010) shows that the precipitation at this location has decreased slightly (10 mm) over
the 31 years of record
Ontario Centre for Climate Impacts and Adaptation Resources - OCCIAR 22March 30, 2010 Barrie in a Changing Climate: a Focus on Adaptation
Winter
Average Mean Winter Temperature - Barrie
0
-1
-2
Temperature °C
-3
-4
-5
-6
-7
-8
-9
1978
1979
1980
1981
1982
1983
1984
1985
1986
1987
1988
1989
1990
1991
1992
1993
1994
1995
1996
1997
1998
1999
2000
2001
2002
2003
2004
2005
2006
2007
2008
Year
Figure 6: Average mean winter temperature (°C) from 1978 to 2008. Barrie WPCC (Environment Canada,
2010) shows that the temperature at this location has increased 2.2 °C over the 31 years of
record
Average Maximum Winter Temperature - Barrie
3
2
1
Temperature °C
0
-1
-2
-3
-4
-5
1982
1987
1978
1979
1980
1981
1983
1984
1985
1986
1988
1989
1990
1991
1992
1993
1994
1995
1996
1997
1998
1999
2000
2001
2002
2003
2004
2005
2006
2007
2008
Year
Figure 7: Average maximum winter temperature (°C) from 1978 to 2008. Barrie WPCC (Environment
Canada, 2010) shows that the temperature at this location has increased 1.9 °C over the 31
years of record
Ontario Centre for Climate Impacts and Adaptation Resources - OCCIAR 23March 30, 2010 Barrie in a Changing Climate: a Focus on Adaptation
Average Minimum Winter Temperature - Barrie
-2
-4
-6
Temperature °C
-8
-10
-12
-14
-16
-18
1995
1978
1979
1980
1981
1982
1983
1984
1985
1986
1987
1988
1989
1990
1991
1992
1993
1994
1996
1997
1998
1999
2000
2001
2002
2003
2004
2005
2006
2007
2008
Year
Figure 8: Average minimum winter temperature (°C) from 1978 to 2008. Barrie WPCC (Environment
Canada, 2010) shows that the temperature at this location has increased 2.3 °C over the 31
years of record
Total Winter Precipitation - Barrie
400
350
Precipitation (mm)
300
250
200
150
100
50
0
1989
1978
1979
1980
1981
1982
1983
1984
1985
1986
1987
1988
1990
1991
1992
1993
1994
1995
1996
1997
1998
1999
2000
2001
2002
2003
2004
2005
2006
2007
2008
Year
Figure 9: Total winter precipitation (mm) from 1978 to 2008. Data from Barrie WCPP (Environment
Canada, 2010) shows that the precipitation at this location has remained unchanged over the
31 years of record
Ontario Centre for Climate Impacts and Adaptation Resources - OCCIAR 24March 30, 2010 Barrie in a Changing Climate: a Focus on Adaptation
Summer
Average Mean Summer Temperature - Barrie
23
22
21
Temperature °C
20
19
18
17
16
15
1999
2000
1978
1979
1980
1981
1982
1983
1984
1985
1986
1987
1988
1989
1990
1991
1992
1993
1994
1995
1996
1997
1998
2001
2002
2003
2004
2005
2006
2007
2008
Year
Figure 10: Average mean summer temperature (°C) from 1978 to 2008. Barrie WPCC (Environment
Canada, 2010) shows that the temperature at this location has increased 1.8 °C over the 31
years of record
Average Maximum Summer Temperature - Barrie
29
28
27
Temperature °C
26
25
24
23
22
21
20
1982
2004
1978
1979
1980
1981
1983
1984
1985
1986
1987
1988
1989
1990
1991
1992
1993
1994
1995
1996
1997
1998
1999
2000
2001
2002
2003
2005
2006
2007
2008
Year
Figure 11: Average maximum summer temperature (°C) from 1978 to 2008. Barrie WPCC (Environment
Canada, 2010) shows that the temperature at this location has increased 1.8 °C over the 31
years of record
Ontario Centre for Climate Impacts and Adaptation Resources - OCCIAR 25March 30, 2010 Barrie in a Changing Climate: a Focus on Adaptation
Average Minimum Summer Temperature - Barrie
16
15
Temperature °C
14
13
12
11
10
1985
2003
1978
1979
1980
1981
1982
1983
1984
1986
1987
1988
1989
1990
1991
1992
1993
1994
1995
1996
1997
1998
1999
2000
2001
2002
2004
2005
2006
2007
2008
Year
Figure 12: Average minimum summer temperature (°C) from 1978 to 2008. Barrie WPCC (Environment
Canada, 2010) shows that the temperature at this location has increased 2.1 °C over the 31
years of record
Total Summer Precipitation - Barrie
450
400
Precipitation (mm)
350
300
250
200
150
100
1980
2001
2005
1978
1979
1981
1982
1983
1984
1985
1986
1987
1988
1989
1990
1991
1992
1993
1994
1995
1996
1997
1998
1999
2000
2002
2003
2004
2006
2007
2008
Year
Figure 13: Total summer precipitation (mm) from 1978 to 2008. Data from Barrie WCPP (Environment
Canada, 2010) shows that the precipitation at this location has increased by 50 mm over the 31
years of record
Ontario Centre for Climate Impacts and Adaptation Resources - OCCIAR 26March 30, 2010 Barrie in a Changing Climate: a Focus on Adaptation Future climate projections were obtained from Environment Canada’s Canadian Climate Change Scenarios Network (CCCSN) (www.ccsn.ca, accessed February 2010). The CCCSN describes climate change as a difference over a period of time with respect to a baseline or a reference point. It corresponds to a statistically significant trend persistent over a long period of time (Environment Canada, 2007). Reference periods of typically 3 decades (1971-2000) are of sufficient length to adequately represent the climate of the period, and can be used to compare fluctuations of climate between one period and another (Environment Canada, 2007). Projections from Global Climate Models (GCMs) exhibit a great deal of climate variability. Because of this, the IPCC (2001a) has recommended using at least 30 year averaging periods for GCM output (Environment Canada, 2007). Output generated by climate models is typically as follows: the 2020s (2010-2039), the 2050s (2040-2069), and the 2080s (2070-2099) (Environment Canada, 2007). The bioclimate profiles produced for Essa Hydro near Barrie, Ontario were created using the CCCma Third Generation Coupled Global Model (CGCM3), version T47). The T47 version has a surface grid whose spatial resolution is roughly 3.75 degrees lat/long and 31 levels in the vertical (Environment Canada, 2005). Data is displayed for the B1 and A2 emission scenarios and is compared to the period of 1971-2000. (http://cccsn.ca/Scenarios/BioclimateTool/Bioclimate-e.phtml, accessed February 2010. Emission scenarios (B1 and A2) are described as follows (IPCC, 2007 cited in Environment Canada, 2007). The A2 storyline and scenario family describes a very heterogeneous world. The underlying theme is self-reliance and preservation of local identities. Fertility patterns across regions converge very slowly, which results in continuously increasing population (15 billion by 2100). Economic development is primarily regionally oriented and per capita economic growth and technological change more fragmented and slower than other storylines. The B1 storyline and scenario family describes a convergent world with the same global population that peaks in mid-century and declines thereafter, as in the A1 storyline, but with rapid change in economic structures toward a service and information economy, with reductions in material intensity and the introduction of clean and resource-efficient technologies. The emphasis is on global solutions to economic, social and environmental sustainability, including improved equity, but without additional climate initiatives. Ontario Centre for Climate Impacts and Adaptation Resources - OCCIAR 27
March 30, 2010                           Barrie in a Changing Climate: a Focus on Adaptation

Temperature

Table 1: Change in mean temperature, extreme maximum temperature and extreme minimum
temperature data compared to 1971-2000 for Essa Hydro near Barrie, Ontario from www.cccsn.ca,
accessed February 2010). Projected values are obtained using AR4 (2007), CGCM3T 47 – Run 1 for each
of the emission scenarios A2, A1B and B1.

                                             AR4 (2007), CGCM3T47 - Run 1
                                          SR-B1                SR-AIB                        SR-A2
              Observed Data
                                                   Change in Mean Temperature (°C)
                1971-2000        2011-2040    2041-2070    2011-2040   2041-2070   2011-2040    2041-2070
  Winter           -6.2             0.9          2.1         1.4      3.3        0.9                  2.6
  Spring            5.3             1.3          2.8         2.1      3.3         2                   3.3
 Summer            18.9             1.6          2.3         1.6       3         1.7                   3
 Autumn             8.5             1.4          2.1         1.4      2.8        1.6                  3.1
  Annual            6.6             1.3          2.3         1.7      3.1        1.6                   3
                                              Change in Extreme Maximum Temperature (°C)
                1971-2000        2011-2040    2041-2070    2011-2040   2041-2070   2011-2040    2041-2070
  Winter            19              1.1          1.8         1.2       2.5       1.4                  2.5
  Spring            35              2.2          2.7         2.4       3.6       2.3                  3.9
 Summer             36              2.3          3.1         2.4       3.6       2.2                  3.8
 Autumn            33.9             1.8          2.4         1.3       3.5       2.3                  3.6
  Annual            36              2.3          3.1         2.4       3.6       2.2                  3.8
                                              Change in Extreme Minimum Temperature (°C)
                1971-2000        2011-2040    2041-2070    2011-2040   2041-2070   2011-2040    2041-2070
  Winter          -37.5             2.4          3.8            3          5           1.9            4.5
  Spring           -32              1.2          3.2           2.1        4.5          1.6            3.8
 Summer             -2               2           2.3           2.3        3.5          1.9            3.3
 Autumn            -22              0.8          1.6            1         2.4          1.2            2.5
  Annual          -37.5             2.4          3.8            3          5           1.9            4.5

Ontario Centre for Climate Impacts and Adaptation Resources - OCCIAR                                 28
March 30, 2010 Barrie in a Changing Climate: a Focus on Adaptation
Precipitation
Table 2: Change in precipitation, extreme maximum precipitation and water surplus and deficit data
compared to 1971-2000 for Essa Hydro near Barrie, Ontario www.cccsn.ca, accessed February 2010).
Projected values are obtained using AR4 (2007), CGCM3T 47 – Run 1 for each of the emission scenarios
A2, A1B and B1 (Environment Canada, 2010).
AR4 (2007), CGCM3T47 - Run 1
SR-B1 SR-A1B SR-A2
Observed Data
Change in Precipitation (mm)
1971-2000 2011-2040 2041-2070 2011-2040 2041-2070 2011-2040 2041-2070
Winter 204.8 14.6 30.8 15.5 46.2 22 35.5
Spring 179.9 -5.1 4.7 -9.3 3.8 8.5 0.6
Summer 240.4 -13.4 -9.8 0.2 -18.9 -14 -21
Autumn 241.2 -10.8 -3.6 1.3 -14 5.9 15.5
Annual 866.4 -14.8 21.9 7.6 16.9 22.2 30.4
Change in Extreme Maximum Precipitation (mm)
1971-2000 2011-2040 2041-2070 2011-2040 2041-2070 2011-2040 2041-2070
Winter 388.9 63.9 95.2 64.6 129.4 77.1 106.4
Spring 381.3 -69.6 -52.6 -78.6 -54 -45.9 -61.8
Summer 559.2 -20.3 -13.7 7.7 -34.7 -26.7 -44
Autumn 565.4 -31 -16.9 -2.7 -45.7 1.2 26.2
Annual 1894.8 -57.1 12 -9 -5 5.7 26.7
Change in Mean Water Surplus/Deficit (mm)
1971-2000 2011-2040 2041-2070 2011-2040 2041-2070 2011-2040 2041-2070
Surplus 379 4 14 9 4 31 15
Deficit 61 39 43 29 67 36 67
Ontario Centre for Climate Impacts and Adaptation Resources - OCCIAR 29March 30, 2010 Barrie in a Changing Climate: a Focus on Adaptation
Responses to climate change can either be mitigative – energy conservation, energy
efficiency, greenhouse gas reductions, alternative energy sources, carbon capture/storage; or
adaptive – managing stormwater/flood protection, heat alert plans, drought plans, water
budgeting, tree planting and others.
1. Is there recognition within your community and watershed that changes in climate are
affecting, and will continue to have an impact on natural and built systems?
2. Has your municipality considered developing a climate change plan (mitigation and/or
adaptation)? Has climate change been considered in any planning process?
Excess waste water and extreme weather events leading to flooding have been specifically
challenging to cities and conservation authorities across the province. Changes to the timing
and extent of peak river/stream flow challenge traditional ways of dealing with the natural
waste water.
3. Do you think that changes to temperature and precipitation over the past 20-30 years
have imposed greater challenges in managing stormwater? Has your municipality made
any changes to reflect that? What barriers are there that may impede structural
changes to those systems (budget constraints, limited human resources, lack of
technology, lack of time, other priorities, other)?
4. Are there other sectors or components of sectors that would be threatened by climate
variability/climate change, i.e. ice fishing, skiing, agricultural operations, forests (fire),
local lakes, fish populations, buildings, bridges, groundwater wells, human health and
well-being, locally valued species, invasive species or pests, etc?
Water and energy conservation are ways to combat climate change, both on the mitigation
and adaptation front. Opportunities exist for economic growth in the green energy sector
through local power generation. The Province of Ontario is committed to reductions of
greenhouse gases – 6% below 1990 levels by 2014 and 15% by 2020.
5. Has your community developed any programs or policies related to energy/water
conservation or efficiency?
6. Have any local companies expressed an interest in developing green energy (products),
i.e. wind, solar, wood pellets, fibre, biomass, etc?
Impediments and facilitators for climate change planning and action exist and can be a
function of capacity within a community setting. Although some Ontario communities tend
Ontario Centre for Climate Impacts and Adaptation Resources - OCCIAR 30March 30, 2010 Barrie in a Changing Climate: a Focus on Adaptation
to have fewer resources, they also have inherent strengths that give them an advantage
when it comes to facing weather/climate adversity.
7. Are there specific items that would enable mitigation/adaptation planning in your area
(specifically for storm water management planning) (climate/weather data, information,
tools, human resources, $$, political support)?
Additional Questions
8. Has climate change been a consideration with emergency management personnel?
9. Are you aware of any benefits that may result from a changed climate and how might
your community take advantage of such changes? E.g. extended summer tourism,
agricultural opportunities, harvesting of stormwater for irrigation, etc.
Ontario Centre for Climate Impacts and Adaptation Resources - OCCIAR 31March 30, 2010 Barrie in a Changing Climate: a Focus on Adaptation
Adaptation
Initiatives and measures to reduce the vulnerability of natural and human systems against actual or
expected climate change effects. Various types of adaptation exist, e.g. anticipatory and reactive,
private and public, and autonomous and planned. Examples are raising river or coastal dikes, the
substitution of more temperature-shock resistant plants for sensitive ones, etc.
Adaptation benefits
The avoided damage costs or the accrued benefits following the adoption and implementation of
adaptation measures.
Adaptation costs
The costs of planning, preparing for, facilitating, and implementing adaptation measures, including
transaction costs.
Adaptive capacity
The ability of a system to adjust to climate variability and change to moderate potential damages,
to take advantage of opportunities, or cope with the consequences.
Barrier
Any obstacle to reaching a goal, adaptation or mitigation potential that can be overcome or
attenuated by a policy, programme, or measure. Barrier removal includes correcting market
failures directly or reducing the transactions costs in the public and private sectors by e.g.
improving institutional capacity, reducing risk and uncertainty, facilitating market trans- actions,
and enforcing regulatory policies.
Climate scenario
A plausible and often simplified representation of the future climate, based on an internally
consistent set of climatological relationships that has been constructed for explicit use in
investigating the potential consequences of anthropogenic climate change, often serving as input
to impact models.
Climate projections often serve as the raw material for constructing climate scenarios, but climate
scenarios usually require additional information such as about the observed current climate. A
climate change scenario is the difference between a climate scenario and the current climate.
Climate variability (CV)
Climate variability refers to variations in the mean state and other statistics (such as standard
deviations, the occurrence of extremes, etc.) of the climate on all spatial and temporal scales
beyond that of individual weather events. Variability may be due to natural internal processes
within the climate system (internal variability), or to variations in natural or anthropogenic external
Ontario Centre for Climate Impacts and Adaptation Resources - OCCIAR 32March 30, 2010 Barrie in a Changing Climate: a Focus on Adaptation
forcing (external variability).
Event
An incident induced or significantly exacerbated by climate change that occurs in a particular place
during a particular interval of time, e.g. floods, very high winds, or droughts.
Hazard
A source of potential harm, or a situation with a potential for causing harm, in terms of human
injury; damage to health, property, the environment, and other things of value.
Hazard identification
The process of recognizing that a hazard exists and defining its characteristics.
(Climate change) Impacts
The effects of climate change on natural and human systems. Depending on the consideration of
adaptation, one can distinguish between potential impacts and residual impacts:
o Potential impacts: all impacts that may occur given a projected change in climate,
without considering adaptation.
o Residual impacts: the impacts of climate change that would occur after adaptation.
Projection
A potential future evolution of a quantity or set of quantities, often computed with the aid of a
model. Projections are distinguished from predictions in order to emphasize that projections
involve assumptions concerning, for example, future socio-economic and technological
developments that may or may not be realized, and are therefore subject to substantial
uncertainty.
Residual risk
The risk remaining after all risk control strategies have been applied.
Resilience
The ability of a social or ecological system to absorb disturbances while retaining the same basic
structure and ways of functioning, the capacity for self-organization, and the capacity to adapt to
stress and change.
Risk
The chance of injury or loss as defined as a measure of the probability and severity of an adverse
effect to health, property, the environment, or other things of value.
Risk communication
Ontario Centre for Climate Impacts and Adaptation Resources - OCCIAR 33You can also read