GASOLINE VERSUS DIESEL - COMPARING CO2 EMISSION LEVELS OF A MODERN MEDIUM SIZE CAR MODEL UNDER LABORATORY AND ON-ROAD TESTING CONDITIONS - EurActiv
←
→
Page content transcription
If your browser does not render page correctly, please read the page content below
WHITE PAPER                                                                  MAY 2019

GASOLINE VERSUS DIESEL
COMPARING CO2 EMISSION LEVELS OF A MODERN
MEDIUM SIZE CAR MODEL UNDER LABORATORY
AND ON-ROAD TESTING CONDITIONS

Jan Dornoff and Felipe Rodríguez

                                                                        www.theicct.org

                                                          communications@theicct.org

BE I JI N G   |   BERLIN   |   B R U SS E LS   |   SAN FRANCIS CO   |    WAS H INGTO N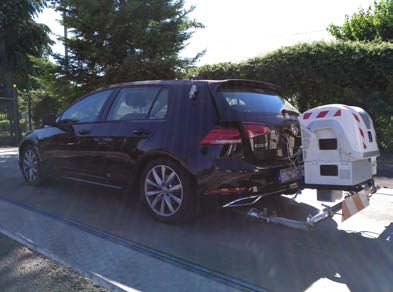
ACKNOWLEDGMENTS
The authors thank the Joint Research Centre of the European Commission for
conducting the vehicle tests, which were performed under the collaborative research
agreement No. 34216. The authors thank also all internal and external reviewers of this
report for their guidance and constructive comments, with special thanks to the Joint
Research Centre of the European Commission and Peter Mock, John German, and
Liuhanzi Yang of the International Council on Clean Transportation. Their review does not
imply an endorsement, and any errors are the authors’ own.

For additional information:
International Council on Clean Transportation Europe
Neue Promenade 6, 10178 Berlin
+49 (30) 847129-102

communications@theicct.org | www.theicct.org | @TheICCT

© 2019 International Council on Clean Transportation

Funding for this work was generously provided by the European Climate Foundation.
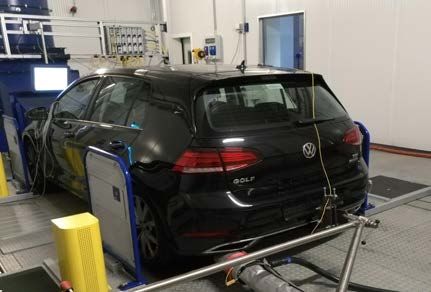
TABLE OF CONTENTS

Abbreviations.............................................................................................................................. ii

Executive Summary................................................................................................................... iii

1. Introduction.............................................................................................................................1

2. Methodology.......................................................................................................................... 3
     2.1     Vehicle Selection............................................................................................................................. 3
     2.2     Vehicle On-Board Instrumentation..........................................................................................6
     2.3     Laboratory Test Methodology....................................................................................................8
     2.4     Real-World Driving Test Methodology...................................................................................9

3. Results and Discussion........................................................................................................12
     3.1     Laboratory Test Results...............................................................................................................12
     3.2     Real-World Driving Results.......................................................................................................22

4. Conclusions and Policy Recommendations....................................................................29

References.................................................................................................................................32

Appendices...............................................................................................................................35
     Appendix A: Extended list of test vehicle characteristics.......................................................35
     Appendix B: Golf TSI technology—Working principles and their effects
         on CO2 emissions......................................................................................................................... 36

                                                                                                                                                         i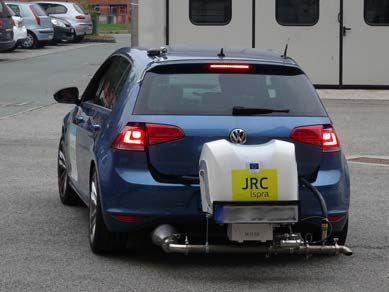
ICCT WHITE PAPER

ABBREVIATIONS
BDC       Bottom Dead Center
CA BTDC   Crank Angle Before Top Dead Center
DPF       Diesel Particulate Filter
CO2       Carbon Dioxide
CVS       Constant Volume Sampling system
DCT       Dual-clutch automated transmission
EGR       Exhaust Gas Recirculation
EFM       Exhaust Flow Meter
EUDC      Extra Urban Driving Cycle
GPF       Gasoline Particulate Filter
GPS       Global Positioning System
NEDC      New European Driving Cycle
NOx       Nitrogen Oxides
NSC       NOx Storage Catalyst
OBD       On-Board Diagnostic
PEMS      Portable Emissions Measurement System
RDE       Real Driving Emissions
TDC       Top Dead Center
THC       Total Hydrocarbons
TWC       Three Way Catalyst
VTG       Variable Turbine Geometry
VSP       Vehicle Specific Power
VW        Volkswagen
WLTC      Worldwide Harmonized Light Vehicles Test Cycle

WLTP      Worldwide Harmonized Light Vehicles Test Procedure

 ii
GASOLINE VERSUS DIESEL: COMPARING CO2 EMISSION LEVELS OF A MODERN CAR

EXECUTIVE SUMMARY
In Europe, diesel engines used to be promoted as a clean and efficient vehicle
technology that would play a key role in reducing carbon dioxide (CO2) emissions in the
transport sector. However, after the discovery of defeat devices in Volkswagen diesel
engines and the ensuing revelations that the real-world NOx emissions of many diesel
vehicles largely exceed the effective emission limits, even recently purchased diesel cars
are threatened by driving bans in a growing number of European cities.

As a consequence, the share of diesel vehicles among new car registrations in the EU
decreased from a peak of 55% in 2011 to 44% in 2017 and continued to fall in 2018.
Parts of the industry portray the diesel engine as being essential to meeting future CO2
emission targets. However, although it is true that the diesel combustion process has an
intrinsic efficiency advantage, a modern gasoline car can have the same or even lower
CO2 emission level than a comparable diesel car.

The release in late 2017 of a new generation of gasoline engines for Europe’s most
popular passenger car, the Volkswagen (VW) Golf, provided an excellent opportunity to
compare modern gasoline and diesel engines side by side, under various laboratory as
well as on-road driving conditions.

Two VW Golf vehicles were selected for testing, one diesel (Golf TDI) and one gasoline
(Golf TSI) version. The key characteristics of both vehicles are summarized in Table ES 1.

Table ES 1. Key characteristics of the two test vehicles.

                                     VW Golf TDI (diesel)                VW Golf TSI (gasoline)
 Model year                                   2016                                2018
 Emission standard                          Euro 6b                             Euro 6c
 Engine                    2.0l TDI Blue Motion Technology, 110 kW   1.5l TSI ACT Blue Motion, 96 kW
 Transmission                         Dual clutch, 6-speed                Dual clutch, 7-speed
 Trim level                               Comfortline                         Comfortline
 Mass of tested vehicle                     1,420 kg                            1,340 kg
 0 – 80 km/h                              6.2 seconds                         6.2 seconds
 0 – 100 km/h                             8.6 seconds                          9.1 seconds
 Maximum speed                             214 km/h                            210 km/h
 CO2 (in NEDC)                              117 g/km                            113 g/km
 List price in Dec 2017                   29,475 euros                        26,075 euros

Both vehicles were Euro 6 type approved prior to the introduction of the Worldwide
Harmonized Light Vehicles Test Procedure (WLTP) and Real Driving Emissions (RDE)
NOx not-to-exceed limits in the EU. The Golf TDI was tested first and is of model
year 2016; the Golf TSI is of model year 2018. It was verified, however, that the key
characteristics of the TDI, and in particular the type-approval CO2 emission level, did not
change significantly between model years 2016 and 2018, thereby allowing for a direct
comparison between vehicles.

                                                                                                 iii
ICCT WHITE PAPER
The vehicles were selected with a focus on comparability from a consumer’s point of
view, which meant similar maximum speed and acceleration power. Innovative CO2
reduction technologies applied in the Golf TSI include cylinder deactivation, active
coolant temperature control, camshaft phasing on both the inlet and outlet sides,
advanced coasting function, as well as an alternative combustion cycle type—the Miller
cycle—and a variable nozzle geometry turbocharger. Trim level and tires were chosen to
be comparable for both vehicles. The diesel vehicle weighed about 80 kg more than the
gasoline vehicle and its 2018 list price was about 3,400 euros higher.
For all tests performed under laboratory conditions, the gasoline powered Golf TSI
showed lower CO2 emissions than the comparable diesel powered Golf TDI (see Figure
ES 1, left side). This also was observed for tests at lower ambient temperatures, where
the CO2 emissions were higher for both vehicles. The CO2 emission benefit of the Golf TSI
also prevailed for warm-start tests. A comparison of cold-start tests with tests started
with a warm engine showed that the gasoline engine warms up considerably faster than
the diesel engine. However, the gasoline engine performs a fuel intensive, rapid catalyst
heat-up at the beginning of a cold-start test, which partly counteracts the CO2 benefit of
an engine that warms up more quickly.
Even though lower CO2 emissions were measured for the Golf TSI during the real-world
driving on public roads as well (see Figure ES 1, right side), the subsequent analysis of the
driving dynamicity and ambient temperature effect on the test results suggests that both
vehicles, when driven in the same manner under the same ambient conditions, have similar
real-world CO2 emissions, with a slight benefit for the Golf TSI. These findings also are
supported by the CO2 emission values reported by consumers on the independent German
website Spritmonitor, which are on average lower for the Golf TSI than for the Golf TDI.
Golf TDI Golf TSI
Type Approval Laboratory Testsa Real−World Driving Testsb Spritmonitorc
+39%
+35% +38%
+39%
+34% +26% +33%
162
150 +19% 158 163 157 +24%
151 148 150
139 +12% 140
+6%
n/a
n/a −4% 126
124
117
113
100 109
CO2 in g/km
50
n=1 n=2 n=2 n=2 n=4 n=1 n=2 n=1 n=2 n=1 n=113 n=25
0
NEDC NEDC WLTC Route 1 Route 2 Route 3 Consumer
Average
Figure ES 1. CO2 emission levels of the Golf TDI and Golf TSI. Comparison of test results with
declared type-approval values and consumer reported numbers (Spritmonitor). The error bars
show the minimum to maximum range of results if multiple tests were performed. No error bar is
shown if only one test was performed. The number of tests is shown at the bottom of each bar. The
relationship of the CO2 emission level to the type-approval value is shown above each bar.
a
The tests shown were performed at 23 °C with cold engine at test start. bThe graph shows the real-
world CO2 emissions as measured, not corrected for effects of driving style or ambient temperature.
When taking these effects into account, similar real-world CO2 emissions are expected. cThe bar
reflects the average reported CO2 emissions for n different vehicles.
ivGASOLINE VERSUS DIESEL: COMPARING CO2 EMISSION LEVELS OF A MODERN CAR
Summarized, the results of this vehicle testing project show that at least for the popular
C-segment,1 a modern gasoline vehicle can have the same or even lower CO2 emissions
than a comparable diesel version at a considerably lower price. This finding holds true
not only for laboratory testing but also for on-road measurements under real-world
driving conditions.
1 C-segment refers to the medium family car size class in Europe and is comparable to the U.S. compact car class.
vICCT WHITE PAPER
1. INTRODUCTION
Following the discovery of defeat devices in Volkswagen diesel engines and the
subsequent revelations that the real-world NOx emissions of most Euro 5 and Euro 6
diesel vehicles largely exceed the effective emission limits, consumers in Europe have
been turning their backs on diesel vehicles. The average diesel share of newly registered
passenger cars in the European Union (EU) declined from its 55% peak in 2011/2012 to
44% in 2017 (Mock, 2018).
Criticizing the EU’s CO2 regulation and similar measures for cars as too ambitious,
industry representatives such as Bernhard Mattes, president of the German Association
of the Automotive Industry (VDA), portray the diesel engine as being essential for
further CO2 emission reductions and the recent drop in diesel car sales as an excuse to
delay further regulatory steps (Zeit Online, 2018; VDA, 2018). It is true that the diesel
combustion process has an intrinsic efficiency advantage compared to conventional
gasoline combustion. However, a modern gasoline car can have the same or even lower
real-world CO2 emission level than a comparable diesel car, for the following reasons:2
»» A lower level of fuel consumption does not necessarily correspond to a lower
level of CO2 emissions. For the fuel types used in this vehicle testing project,3 a
diesel vehicle emits about 13% more CO2 by mass per liter of fuel burned than a
vehicle fueled with gasoline. Consequently, the fuel consumption, in liters per 100
kilometers (l/100 km), of a gasoline vehicle is higher than it is for a diesel vehicle to
emit the same amount of CO2.
»» Diesel engines are heavier than their gasoline counterparts. In the case of the
vehicles tested as part of this project, the diesel configuration is 80 kg heavier.
»» Diesel engines historically possessed efficiency advantages over gasoline engines,
but gasoline engines are gaining ground as a result of advanced technologies such
as direct injection; turbocharging and downsizing; and variable valve timing.
»» Diesel engines require more complex technologies to meet the regulatory air
pollutant emission limits, therefore making them more expensive and often more
fuel-intensive. This reduces the potential for deploying CO2 reduction technologies
on a diesel vehicle compared to a gasoline vehicle of the same price.
»» The gap between type-approval and real-world CO2 emissions is, on average,
greater for diesel than for gasoline vehicles (Tietge et al., 2019).
»» Diesel engines show their largest CO2 benefits in heavier and more powerful
vehicles, thereby contributing to a rebound effect as more SUVs and other high-
powered vehicles, with correspondingly higher CO2 emission levels, are pushed on
the market (Mock & Tietge, 2018).
The release in late 2017 of a new generation of gasoline engines for Europe’s most
popular passenger car, the VW Golf, provided an excellent opportunity to compare
modern gasoline and diesel engines side by side, and to determine whether the diesel
version would still have a CO2 benefit, as was the case in the past. The official CO2
emission levels of the VW Golf model equipped with these new gasoline engines,
according to the manufacturer, are lower than those of the comparable diesel version
(VW AG, 2017). To understand if this CO2 benefit also prevails for conditions deviating
from those considered during type approval, two VW Golf vehicles were tested—one
powered by the new gasoline engine, the other powered by a diesel engine—also
2 For more details, see Mock & Tietge, 2018
3 Market fuel E5 gasoline with maximum 5% ethanol content and B7 diesel with maximum 7% fatty acid
methyl ester (FAME) were used in this project.
1GASOLINE VERSUS DIESEL: COMPARING CO2 EMISSION LEVELS OF A MODERN CAR
under real-world driving conditions. The vehicles were tested in two drive cycles in the
laboratory at different ambient temperatures and coolant temperatures at test start.
To assess the CO2 emissions during real-world driving, tests were performed on three
different routes on public roads.
The first section of this paper describes which vehicles were selected for the testing
and why they were considered as suitable for a comparison of CO2 emissions. Following
that is an explanation of how the laboratory and real-world tests were conducted, and
which measurements were performed. The test results are presented and discussed in
the second section. The laboratory results are first compared with the type-approval
CO2 emissions and the effect of the ambient temperature on the CO2 emissions is
investigated. Next, the effect of a cold-start engine on the CO2 emissions is discussed
in detail. The CO2 results of the tests performed on public roads are analyzed for
comparability. In the third section, conclusions drawn from the test results are presented
and derived policy recommendations are provided.
2ICCT WHITE PAPER
2. METHODOLOGY
2.1 VEHICLE SELECTION
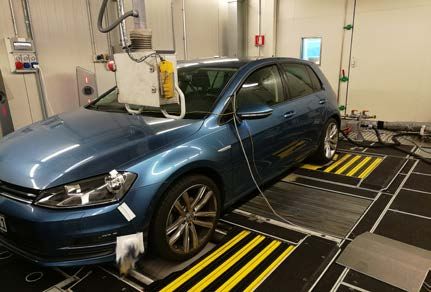
Two C-segment vehicles were tested. Vehicle 1, shown in Figure 1, was a diesel powered
Volkswagen Golf 2.0 TDI BlueMotion, referred to as the Golf TDI. Vehicle 2 was a gasoline
powered Volkswagen Golf 1.5 TSI ACT BlueMotion, referred to as the Golf TSI and shown
in Figure 2.
Figure 1. Golf TDI test vehicle, on chassis dynamometer and on the road with portable emissions
measurement system (PEMS) installed.
Figure 2. Golf TSI test vehicle, on chassis dynamometer and on the road with portable emissions
measurement system (PEMS) installed.
The characteristics of the tested Golf TDI and Golf TSI are shown in Table 1, with
additional details in Appendix A. Both vehicles were rented for the testing periods. At
the start of the test, the odometers showed approximately 24,000 km for the Golf TDI
and 11,000 km for the Golf TSI. Considering the minimum run-in mileage for road load
parameter determination of 3,000 km, defined in the WLTP regulation (EU) 2017/1151
(European Commission, 2017), no further power train run-in effects4 on the road load
were therefore expected.
4 The power train of a new vehicle usually has an elevated driving resistance caused by friction in the bearings
and gearbox. During the run-in phase, the friction lessens and finally stabilizes. That is when the run-in phase
is considered completed.
3GASOLINE VERSUS DIESEL: COMPARING CO2 EMISSION LEVELS OF A MODERN CAR
Table 1. Golf TDI and Golf TSI test vehicle characteristics
Parameter Unit Golf TDI Golf TSI
Manufacturer - Volkswagen Volkswagen
Trade name - Golf Golf
Variant trade name - 2.0 TDI BlueMotion Technology 1.5 TSI ACT BlueMotion
Manufacturer type - Golf VII (VW type code: AU) Golf VII (VW type code: AU)
Trim level - Comfortline Comfortline
Date of first registration - May 2015 September 2017
Mileage at test start km ~ 24,000 ~11,000
Transmission type - Dual clutch transmission Dual clutch transmission
Number of speeds - 6 7
Powered axle(s) - Front Front
Chassis type - Hatchback Hatchback
Vehicle segment - C (Medium) C (Medium)
Type-approval cycle - NEDC NEDC
Emission standard - Euro 6b (W) Euro 6c (ZD)
OBD standard - Euro 6-1 Euro 6-2
Mass in running order kg 1,394 1,344
Mass of test vehicle (fuel tank
kg Approx. 1,420 Approx. 1,340
full, excl. driver, excl. PEMS)
Mass of test vehicle
(fuel tank full, incl. driver, kg 1,660–1,680 1,600–1,620
co-driver, and PEMS)
Rated vehicle speed km/h 214 210
Tire dimensions 225/40 R18 225/45 R17
Tire rolling resistance class - B C
Fuel type - Diesel (mono-fuel) Gasoline (mono-fuel)
Number of cylinders - 4 4
Engine displacement cm 3
1,968 1,498
Rated power at speed kW 110 at 3,500–4,000 rpm 96 at 5,000–6,000 rpm
Rated torque at speed Nm 340 at 1,750–3,000 rpm 200 at 1,400–4,000 rpm
Data sources: Certificates of conformity; Registration certificates; Demmelbauer-Ebner, Persigehl, Görke, & Werstat, 2017;
VW AG, 2014, 2015, 2017, 2018)
The Golf TDI test vehicle was of model year 2016, whereas the Golf TSI was of model
year 2018, requiring a comparison of the tested 2016 Golf TDI with its 2018 model
year equivalent. The engine power and torque characteristics as well as the vehicle
performance remained the same. The main difference identified was the dual clutch
transmission (DCT) type, where the number of speeds changed from six to seven for the
2018 model. The declared CO2 emissions of the 2018 Golf TDI model are 114–117 g/km
compared to 117–119 g/km for the 2016 model year. The Golf TDI test vehicle had declared
CO2 emissions of 117 g/km, which is at the upper end of the range of the 2018 model. The
certificate of conformity of the Golf TSI stated CO2 emissions of 113 g/km, which is also
the highest value declared for the 2018 model, ranging from 110–113 g/km (VW AG, 2015,
2017). A comparison of the 2016 model year Golf TDI and the 2018 model year Golf TSI is
therefore reasonable.
Both vehicles had the same body type, were front wheel driven, and had similar
transmissions and optional equipment. Tires of the same width were installed on both
4ICCT WHITE PAPER
vehicles. The rolling resistance of the Golf TDI tires was one efficiency class better than
for the Golf TSI, whereas the rims of the Golf TDI were 1 inch larger.
The Golf TDI was tested first, in summer 2017, and was therefore the reference for the
selection of the gasoline version, which was tested one year later in summer 2018. The
new 1.5-liter gasoline engine is offered in a 96 kW and a 110 kW version. Table 2 shows
the performance parameters of the tested Golf TDI and the two versions of the Golf TSI.
Table 2. Performance parameters of the tested model year 2016 Golf TDI and the two versions of
the Golf 1.5 TSI, model year 2018
Tested vehicle models For comparison
Golf TDI Golf TSI 96kW Golf TSI 110kW
Engine capacity (cm ) 3
1,968 c
1,498 c
1,498b
Number of cylinders 4c 4c 4b
Power (kW at rpm) 110 at 3,500–4,000c 96 at 5,000–6,000c 110 at 5,000–6,000b
Torque (Nm at rpm) 340 at 1,750–3,000c 200 at 1,400–4,000c 250 at 1,500–3,500b
Transmission type DCTa DCTb DCTb
Number of speeds 6a 7b 7b
Maximum speed (km/h) 214 c
210 c
216b
0–80 km/h (s) 6.2a 6.2b 5.9b
0–100 km/h (s) 8.6a 9.1b 8.3b
Fuel urban (l/100km) 5.2c 6.2c 6.1–6.2b
Fuel extra urban (l/100km) 4.0c 4.2c 4.2–4.3b
Fuel combined (l/100km) 4.4c 4.9c 4.9–5.0b
CO2 urban (g/km) 140c 142c n/a
CO2 extra urban (g/km) 106 c
96 c
n/a
CO2 combined (g/km) 117 c
113 c
112–114b
List price in Dec. 2017
29,475 eurosb, d 26,075 eurosb 26,700 eurosb
(Comfortline edition)
a
VW AG, 2015. bVW AG, 2017. cCertificate of conformity of the tested vehicle. dFor comparability, the price of the
equivalent Golf TDI model in December 2017 is shown.
Although the peak power of the Golf TDI matches the 110 kW version of the Golf TSI, the
performance of the Golf TDI in terms of acceleration and top speed falls between the 96
and 110 kW gasoline versions. Both Golf TSI versions have similar declared CO2 emissions
(113 vs. 112–114 g/km) but the 96 kW version deploys more advanced technologies with
CO2 saving potential, which are of particular interest for this research project, so that is
the version that was tested.
The engine installed in the Golf TDI is a modern four-cylinder diesel engine with high-
pressure common-rail fuel injection, variable turbine geometry (VTG) turbocharger,
switchable coolant pump, cylinder pressure controlled combustion, and camshaft
phasing (VW AG, 2014). The lean diesel combustion requires a complex and relatively
expensive technology package to reduce NOx emissions, on the one hand, while
minimizing the detrimental effect of these measures on fuel consumption, soot
formation, and drivability on the other. For that purpose, the engine also is equipped
with an uncooled high-pressure and a cooled low-pressure exhaust gas recirculation
(EGR) system for in-cylinder NOx reduction, and an exhaust aftertreatment system
consisting of a close coupled NOx storage catalyst (NSC) and catalytically coated diesel
particulate filter (DPF). The NSC requires frequent regeneration with rich exhaust gas to
maintain its NOx reduction efficiency. This regeneration occurred on the Golf TDI under
5GASOLINE VERSUS DIESEL: COMPARING CO2 EMISSION LEVELS OF A MODERN CAR
most conditions every 2 to 8 minutes. For the generation of the rich exhaust gas, the
engine needs to be operated at very low efficiency, which increases the average fuel
consumption. In addition, desulfurization of the NSC at a minimum exhaust temperature
of 620°C with rich exhaust is performed at least every 1,000 km, usually in combination
with a DPF regeneration, to restore the catalyst’s NOx storage capacity, further
deteriorating the fuel economy (Neusser, Kahrstedt, Dorenkamp, & Jelden, 2013).
The gasoline engine uses direct fuel injection, cylinder deactivation, active coolant
temperature control, and camshaft phasing on both the inlet and outlet side. The
tested 96 kW version applies in addition an advanced coasting function as well as an
alternative combustion cycle type—the Miller cycle—and a VTG turbocharger. The latter
is a technology that is commonplace in modern diesel engines but a novelty on a mass
production gasoline engine (VW AG, 2018). The working principles of the different
technologies deployed in the Golf TSI and their effects on the CO2 emissions are
explained in Appendix B.
To reduce the gaseous pollutant emissions of the Golf TSI engine, an exhaust
aftertreatment system consisting of a close-coupled three-way catalyst (TWC) and a
second TWC in underfloor position is sufficient. The lower cost of this emission reduction
system of the gasoline Golf allows a greater deployment of efficiency improving
technologies while maintaining a considerable sales price advantage. Despite the
extensive CO2 reduction technology package in the Golf TSI, its list price is 3,400 euros
lower than of the Golf TDI.
2.2 VEHICLE ON-BOARD INSTRUMENTATION
Prior to the testing program, the vehicles were equipped with on-board measurement
instruments as shown in Figure 3. A data logger for automatic data acquisition was
installed to record the engine signals available at the OBD interface, high speed GPS
data, and the signals of installed probes. Due to the availability of measurement
equipment, more signals were measured by probes on the Golf TSI than on the Golf TDI.
6ICCT WHITE PAPER
VW Golf TDI
GPS
CAC
Air
Throttle
Cooler & Valve
LP-EGR
HP-EGR
Valve
VTG T/C
cDPF
NSC
Exhaust
throttle
T us NSC T ds cDPF
• NOx us NSC • NOx ds cDPF
• Lambda us NSC • Lambda ds cDPF
OBD Parameters
• Vehicle speed • Rail pressure • HP-EGR valve position • Intake manifold temperature
• Engine speed • Lambda upstream NSC • LP-EGR valve position • Ambient air temperature
• Air mass flow • Lambda downstream cDPF • Intake manifold pressure
VW Golf TSI
Throttle position
• T us throttle • AFM Air mass flow GPS
• P us throttle • T at AFM
• T intake manifold
• P ambient
• P intake manifold
• T ambient
Throttle
CAC
VTG T/C
TWC 2
TWC 1
Injection signal Cyl 2 T/C VTG position
T us TWC 1 T us TWC 2 T ds TWC 2
• Coolant valve position
• Alternator current
• Alternator voltage • NOx us TWC 1 • NOx ds TWC 2
• A/C compressor valve • Lambda us TWC 1 • Lambda ds TWC 2
OBD Parameters:
• Vehicle speed • Lambda upstream TWC1 • Coolant temperature
• Engine speed • Accelerator pedal position • Ignition timing advance
Abbreviations
• us: upstream • Cyl: Cylinder • LP-EGR: Low-Pressure • AFM: Air Flow Meter
• ds: downstream • CAC: Charge Air Cooler Exhaust Gas Recirculation • A/C: Air Conditioning
• P: Pressure • NSC: NOx Storage Catalyst • VTG T/C: Variable Turbine
• T: Temperature • HP-EGR: High-Pressure Geometry turbo charger
• cDPF: coated DPF Exhaust Gas Recirculation • TWC: Three-Way-Catalyst
Figure 3: Schematic of Golf TDI and Golf TSI test vehicle instrumentation. Boxed parameters show
the recorded signals.
7GASOLINE VERSUS DIESEL: COMPARING CO2 EMISSION LEVELS OF A MODERN CAR
2.3 LABORATORY TEST METHODOLOGY
All chassis dynamometer tests were performed at the Vehicle Emissions Laboratory
(VELA) of the European Commission Joint Research Centre (JRC) in Ispra, Italy.
The vehicle emission test cell was equipped with a four-wheel-drive single-roller test
bench, air conditioning from -10°C to +35°C, a Horiba constant volume sampling (CVS)
system, and Horiba MEXA 7100 and 7400 exhaust gas analyzers.
The on-board measurement equipment was active during the chassis dynamometer tests
and recorded additional engine, ambient, and exhaust parameters.
Road load parameters
The road load parameters for the test vehicles were not available from the manufacturer
and a determination by coastdown could not be performed in this project. The road load
parameters for the New European Driving Cycle (NEDC) and Worldwide Harmonized
Light Vehicles Test Procedure (WLTP) were therefore calculated based on the vehicle
characteristics using the methodology described in Tsiakmakis, Fontaras, Cubito, et al.
(2017). To account for the higher driving resistance at -7°C, the respective road load
parameters were increased by 10% for this test.
For verification, the calculated WLTP road load parameters were compared with values
provided by Volkswagen in the documentation of Real Driving Emissions (RDE) type-
approval tests of similar vehicles. The Golf TDI parameters were compared to those
of a Volkswagen Golf VII 2.0 TDI hatchback with a 110 kW engine, a 7-speed DCT, and
225/45 R17 tires. For the Golf TSI comparison, parameters were available for a VW
Golf VII 1.5 TSI station wagon with a 110 kW engine, a 7-speed DCT, and 205/50 R17
tires. The comparison revealed that for both test vehicles, the parameters stated by
the manufacturer are a bit lower than those used for the WLTP chassis dynamometer
tests. However, the effect on the positive cycle energy demand, as defined in the WLTP
regulation (EU) 2017/1151 (European Commission, 2017), is similar for both vehicles with
a 3.8% higher energy demand for the Golf TDI and a 4.0% higher value for the Golf TSI
(see Figure 4). Because the relative energy demand increase is relatively small and
almost identical for both vehicles, the effect on the CO2 emissions is assumed to be
similar as well. A direct comparison of the WLTC test results is therefore justified.
150 5%
Golf TSI - Cycle Energy Deviation
Golf TDI - Cycle Energy Deviation
Vehicle speed
Deviation in Cycle Energy Demand
120 4%
Vehicle Speed (km/h)
90 3%
60 2%
30 1%
0 0%
0 450 900 1350 1800
Time (s)
Figure 4. Relative deviation in positive cycle energy demand comparing the road load parameters
used for testing with those stated by the manufacturer for comparable vehicles. The deviation is at
a similar level for the Golf TDI and Golf TSI.
8ICCT WHITE PAPER
Test cycles
The Golf TDI and Golf TSI in NEDC5 and WLTC were tested with variations in the test
parameters as shown in Table 3. The cold-start NEDC tests were performed according
to the procedure defined in the UNECE Regulation 83 (UNECE, 2015) with the vehicle
preconditioned in an EUDC6 cycle and the battery fully charged during the subsequent
soak phase. For the cold-start WLTC test, the respective procedure defined in the WLTP
regulation (European Commission, 2017) was followed. The battery was fully charged
prior to the WLTC preconditioning cycle followed by a soak phase at test temperature
with no additional battery charge. The warm-start tests were carried out 20 to 30
minutes after the respective cold-start tests. Due to budget constraints the -7ºC WLTC
and +30ºC NEDC tests were performed only on the Golf TDI.
Conventional B7 diesel and E5 gasoline were used for all laboratory tests.
Table 3. Chassis dynamometer test types and number of tests performed with the Golf TDI and Golf
TSI test vehicles
Coolant at
Cycle Type Road loads Ambient temp. (°C) test start Golf TDI Golf TSI
NEDC NEDC 23 Cold 1 2
NEDC NEDC 23 Warm 2 2
NEDC NEDC 30 Cold 2 -
NEDC NEDC 10 Cold 2 2
WLTC WLTP 23 Cold 2 2
WLTC WLTP 23 Warm 4 2
WLTC WLTP 14 Cold 2 1
WLTC WLTP + 10% -7 Cold 1 -
2.4 REAL-WORLD DRIVING TEST METHODOLOGY
Because the focus of this paper is the comparison of the CO2 emissions of the Golf
TDI and Golf TSI, based on comparable tests for both vehicles, it is of less importance
whether or not the real-world tests performed on public roads are compliant with the
requirements of the RDE regulation. To avoid the need to distinguish between RDE and
non-RDE compliant PEMS tests, and for better readability, the real-world tests from
hereon are referred to as real-world driving tests.
Vehicle test equipment
For the emission measurement during the real-world driving tests, a portable emissions
measurement system (PEMS) and an exhaust flow meter (EFM) were installed on
the trailer hook of the vehicles. At the time the Golf TDI was tested, an AVL M.O.V.E
GAS PEMS iS was available, which measures carbon monoxide, nitrogen monoxide,
nitrogen dioxide, and carbon dioxide (CO2) concentrations. The exhaust mass flow was
determined by an AVL M.O.V.E EFM, which is based on the differential pressure flow
metering method. The PEMS installation was complemented by a weather station that
records ambient temperature, pressure, and humidity and a GPS sensor for geographical
position, altitude, and vehicle speed determination. The complete measurement
equipment added about 100 kg to the mass of the Golf TDI.
5 The New European Drive Cycle—NEDC—was used in the European Union for emission type approval until
August 31, 2017. From that time the Worldwide Harmonized Light Vehicles Test Procedure—WLTP—is used
for type approval. The Worldwide Harmonized Light Vehicles Test Cycle—WLTC—is the associated test cycle.
6 The NEDC consists of two phases. The Urban Driving Cycle was considered to represent urban driving and
the second phase, the Extra Urban Driving Cycle—EUDC—to represent rural and motorway driving. The
EUDC is used for preconditioning of the test vehicles in the NEDC test procedure.
9GASOLINE VERSUS DIESEL: COMPARING CO2 EMISSION LEVELS OF A MODERN CAR
In addition to the gas PEMS installed on the Golf TDI, a system to measure particulate
number (PN) emissions of type AVL M.O.V.E PN PEMS iS was available when testing the
Golf TSI. The total mass of the test equipment was therefore approximately 20 kg more
than on the Golf TDI. The lower mass benefit of the Golf TSI was thereby reduced from
80 to 60 kg. Because the Golf TSI was tested second, this mass penalty could not be
compensated for in the Golf TDI testing. The Golf TSI will therefore have a slight CO2
penalty, compared to the Golf TDI in real-world driving tests. A co-driver accompanied
the test driver in all tests performed with both vehicles. The approximate total vehicle
test mass including measurement equipment and passengers was 1600–1620 kg for the
Golf TSI and 1660–1680 kg for the Golf TDI.
The accuracy of the PEMS installation was verified on the chassis dynamometer
according to the RDE regulation (EU) 2017/1151 through validation against standard
laboratory equipment (European Commission, 2017).
As for the laboratory tests, B7 diesel and E5 gasoline were used for the real-world
driving tests.
Routes
The real-world driving tests were performed on three different routes. The characteristics
of those routes are listed in Table 4. Figure 5 shows the respective altitude profiles.
Whereas Routes 1 and 2 comply with the route composition requirements of the RDE
regulation (European Commission, 2017), Route 3 was designed with a focus on highway
driving and is therefore not compliant with these requirements, both for the duration
and the trip composition.
Table 4. Route characteristics of real-world driving routes
Characteristic Requirement Route 1 Route 2 Route 3
Duration (min) 90–120 approx. 100 approx. 110 approx. 135
Distance (km) n/a 79 94 141
Urban share (%) 29–44 38 37 30
Rural share (%) 23–43 28 26 14
Motorway share (%) 23–43 34 37 56
Cumulative altitude gain (m/100 km) < 1200 813 860 470
Altitude range (m) < 1300 190–300 190–420 110–300
Route 1 Route 2 Route 3
400
Alitude (m)
300
200
100
0 20 40 60 80 0 20 40 60 80 100 0 25 50 75 100 125 150
Distance (km)
Figure 5: Real-world driving routes—altitude profiles
10ICCT WHITE PAPER
Test matrix
The real-world driving test program on Routes 1–3 is shown in Table 5. During all tests
with both vehicles, the automatic transmission was set to the predominant gearshift
mode D and the automatic air-conditioning mode was used. The Golf TDI was tested
multiple times on each route whereas the Golf TSI project timeline allowed for only one
test for each test type.
Table 5. Real-world driving—test matrix
Route Golf TDI Golf TSI
Route 1 4 tests at 28°C–32°C 1 test at ~25°C
1 test at 25°C–30°C
Route 2 1 test at ~30°C
1 test at 30°C–35°C
1 test at 30°C–35°C
Route 3 1 test at 20°C–25°C
1 test at 25°C–30°C
11GASOLINE VERSUS DIESEL: COMPARING CO2 EMISSION LEVELS OF A MODERN CAR
3. RESULTS AND DISCUSSION
3.1 LABORATORY TEST RESULTS
All chassis dynamometer results discussed in this chapter are based on the analysis results
of the exhaust gas collected by the CVS system in a bag for each test cycle phase. The
results have not been corrected for any influence of ambient temperature, change in
battery charge level, or particulate filter regeneration. Laboratory tests, where a particulate
filter regeneration occurred, were considered void and removed from the analysis.
Comparison to type-approval values
Both vehicles are type approved under the NEDC test procedure, for which the Golf
TDI has a declared CO2 emission value of 117 g/km and the Golf TSI of 113 g/km. NEDC
measurement results are shown in the left-hand graph of Figure 6. Measurement of CO2
emissions in the NEDC at 23ºC resulted in 124 g/km for the Golf TDI test and 109 g/km in
both tests performed with the Golf TSI. The difference between measured and declared
CO2 value of 7 g/km (+6.0 %) for the Golf TDI is at the lower end of the deviation that
the European Commission expects from the exploitation of test flexibilities by the
manufacturers (Tsiakmakis, Fontaras, Ciuffo, & Samaras, 2017). The results of the Golf TSI
being 4 g/km (-3.5 %) below the manufacturer declared value could therefore indicate
that the applied NEDC road load parameters are somewhat lower than the values used
by the manufacturer for type approval.
In the WLTC tests performed at 23ºC, the Golf TDI emitted 139 ± 2 g CO2/km and the
corresponding Golf TSI CO2 emissions were 126 ± 1 g/km. This results in a WLTC to NEDC
type-approval CO2 emission ratio of 1.19 for the Golf TDI and 1.12 for the Golf TSI, which is
in the range expected in Tsiakmakis, Fontaras, Ciuffo, et al. (2017).
Effect of ambient temperature
Additional NEDC and WLTC tests at 10ºC and 14ºC respectively were performed with
both vehicles, which is to say at ambient temperatures deviating from type-approval
conditions. NEDC tests at 30ºC and a WLTC test at -7ºC were performed only with the
Golf TDI. The comparison of the cycle CO2 emissions at different ambient temperatures
is shown in Figure 6 as well.
The CO2 emissions of the diesel vehicle are for all temperatures and in both test cycles
higher than for the corresponding gasoline vehicle tests and decrease for both vehicles
with increasing ambient temperature. This is expected, as lower ambient temperatures
negatively affect the vehicle fuel efficiency, especially for cold-start tests. In cold-start
tests, the friction in the power train increases and the engine coolant takes longer to
warm up, hence at lower ambient temperatures the negative cold-start effects prevail
longer. The increased air density at lower ambient temperatures also results in a higher
air drag. The latter effect is taken into account only for the test at -7ºC, where the
respective road load parameter is increased by 10%.
12ICCT WHITE PAPER
Golf TDI Golf TSI Type Approval Value
NEDC WLTC
150 160
144
139
134 133
126
122
116 124
100 109
CO2 in g/km
50
0
10˚C 23˚C 30˚C −7˚C 14˚C 23˚C
Ambient Temperature
Figure 6: Effect of ambient temperature on cold-start WLTC- and NEDC-specific cycle CO2
emissions. The error bars show the minimum to maximum range of results if multiple tests were
performed. No error bar is shown if only one test was performed. The NEDC type-approval
emissions are shown with red dots.
Effect of coolant temperature at test start
Lower coolant temperatures negatively affect the CO2 emissions. This means a cold-
started vehicle generates more CO2 in the same test than a warm-started one. To
investigate this effect for the tested vehicles, NEDC and WLTC tests were performed with
both cold and warm engine coolant at test start. The results of these tests at 23ºC are
shown in Figure 7. The comparison shows that the CO2 advantage of the Golf TSI remains
also for the warm-start tests. The CO2 penalty for a cold-start test in the NEDC is about 10
g/km for both vehicles. The penalty in the WLTC is approximately half of the respective
NEDC value, which is mainly the consequence of the longer WLTC test duration7 and
thereby the relatively lower impact of the cold start on the cycle average emissions.
NEDC WLTC Golf TDI Golf TSI
139
133
124 126
122
114
100 109
99
CO2 in g/km
50
0
Cold Warm Cold Warm
Coolant temperature at test start
Figure 7. Effect of engine coolant temperature at test start on CO2 emissions—Comparison of Golf TDI
and Golf TSI in NEDC and WLTC tests at 23ºC. The error bar shows the minimum to maximum range
of results if multiple tests were performed. No error bar is shown if only one test was performed.
7 The WLTC takes 30 minutes, whereas the NEDC duration is only 20 minutes.
13GASOLINE VERSUS DIESEL: COMPARING CO2 EMISSION LEVELS OF A MODERN CAR
For a more detailed analysis, the CO2 emissions of the different test cycle phases of cold-
and warm-start NEDC and WLTC are shown in Figure 8. The CO2 emission increasing
effect of a cold start is clearly visible for the urban phase of the NEDC for both vehicles.
In the extra urban phase, however, only the Golf TDI emissions are still notably higher for
the cold-start test whereas the Golf TSI CO2 emissions are almost at the same level as
for a test with a warm-started engine. The WLTC test results show a similar trend. The
Golf TDI CO2 emissions during the low and medium phases are considerably increased
for the cold-start test and reach the values of the warm-start test only in phase high and
extra high. The cold start CO2 emissions of the Golf TSI, on the other hand, already have
almost stabilized at the level of the warm-start test after the low phase with only a small
effect observed in the medium phase.
NEDC WLTC Cold-start Warm-start
200
188
150 160
153
Golf TDI
137 144 144
134 127
100 108 115 113
103
50
0
CO2 in g/km
200
150 158
Golf TSI
131 134 129 130
124 121
100 108 109 108
96 94
50
0
Urban Extra Urban Low Medium High Extra High
Figure 8. Comparison of phase CO2 emission levels—Cold- versus warm-start NEDC and WLTC
at 23ºC. The error bar shows the minimum to maximum range of results if multiple tests were
performed. No error bar is shown if only one test was performed.
Engine warm-up behavior. These observations can be explained by comparing the
second-by-second coolant temperature profiles of the warm- and cold-start tests as
shown in Figure 9 for the NEDC and Figure 10 for the WLTC. The figures also show the
recorded vehicle speed signal and, for the Golf TSI only, the position of the rotary valve
for coolant temperature control. This signal was recorded only on the Golf TSI. For the
analysis, a coolant temperature of 80ºC was assumed to be the threshold for the end of
the cold start.
For the NEDC, shown in Figure 9, the Golf TDI coolant temperature reaches 80ºC just
before the end of the test after approximately 1,100 seconds but never reaches the
level of the warm-start test. The gasoline engine of the Golf TSI, however, requires only
about half the time to complete the warm-up and reaches the temperature profile of the
warm-start test at the end of the urban phase.
14ICCT WHITE PAPER
Golf TDI - Cold Start Golf TSI - Cold Start
Golf TDI - Warm Start Golf TSI - Warm Start
150 Urban Extra Urban
Vehicle Speed (km/h)
120
90
60
30
0
80
State III
valve position (%)
Coolant control
60
State III
Coolant control valve position
data available only for Golf TSI 40
State II
20
State I State II
0
Coolant Temperature (°C)
120
100
80
60
40
20
0 200 400 600 800 1,000 1,200
Time (s)
Figure 9. Coolant temperature of cold- versus warm-start NEDC at 23ºC. The Golf TSI completes the
engine warm-up within the urban phase whereas the Golf TDI requires approximately twice as long to
reach the 80ºC temperature threshold. The vertical bars in the bottom graph indicate the time needed
to reach 80ºC coolant temperature (horizontal line) for a cold-started Golf TDI and Golf TSI test
respectively. The coolant control valve position information is available only for the Golf TSI.
The WLTC coolant temperature records in Figure 10 show that the Golf TSI engine
reaches 80ºC well within the low phase of the WLTC and the coolant temperature level
of the warm-start test is reached early in the medium phase. The diesel engine coolant,
however, reaches the warm-up threshold only toward the end of the medium phase and
the level of the warm-start test not before well into the high phase.
15GASOLINE VERSUS DIESEL: COMPARING CO2 EMISSION LEVELS OF A MODERN CAR
Golf TDI - Cold Start Golf TSI - Cold Start
Golf TDI - Warm Start Golf TSI - Warm Start
160
Low Medium High Extra High
Vehicle Speed (km/h)
120
80
40
0
100
valve position (%)
80
Coolant control
State III
60
State III
Coolant control valve position
data available only for Golf TSI 40
20
State I State II
0
120
Coolant Temperature (°C)
100
80
60
40
20
0 200 400 600 800 1,000 1,200 1,400 1,600 1,800
Time (s)
Figure 10: Coolant temperature of cold- versus warm-start WLTC at 23ºC. The Golf TSI completes
the engine warm-up within the low phase whereas the Golf TDI coolant temperature does not
reach the warm-up threshold before the end of the medium phase. Coolant control valve data exist
only for the Golf TSI. The vertical bars in the bottom graph indicate the time needed to reach 80ºC
coolant temperature (horizontal line) for a cold-started Golf TDI and Golf TSI test, respectively.
This large difference in engine coolant warm-up rate was anticipated to be primarily
attributable to the higher heat capacity, better thermal efficiency, and lower combustion
temperature of the larger displacement diesel engine, but also to the active coolant
temperature control and the cylinder head integrated exhaust manifold of the Golf TSI.
The coolant control valve position was recorded on the Golf TSI and is shown for the
NEDC and WLTC in the middle graph of Figure 9 and Figure 10, respectively. With this
information, the applied strategy can be analyzed. At cold start, the coolant temperature
control is in State I. In this state, the coolant inside the engine is not circulated and
consequently warms up very quickly. At a coolant temperature of approximately 50ºC
to 60ºC, the system switches to State II, at which point the coolant is circulated through
the engine, engine oil heat exchanger, and vehicle interior heater. When a temperature
of 85ºC to 95ºC has been reached, the valve is used to actively control the coolant
temperature relative to a setpoint by regulating the flow through the radiator (State III)
(VW AG, 2018).
Golf TSI rapid catalyst warm-up strategy. Despite the faster engine warm-up of the Golf
TSI, the relative CO2 emission increase in the first phase of the NEDC between the cold-
and warm-start tests at 23 ºC is higher for the gasoline vehicle (21.3 % increase) than for
16ICCT WHITE PAPER the diesel vehicle (14.2 % increase), as illustrated in Figure 8. This is likely attributable to the rapid catalyst heat up strategy applied by the Golf TSI engine, as shown in Figure 11. The graphs show a comparison of the first 100 seconds of the cold- and warm-start WTLC and NEDC, respectively, performed with the Golf TSI at 23ºC. Even though the first seconds of engine data were not recorded, the rapid catalyst heat up strategy is still clearly discernible. For both test types, the ignition timing is significantly delayed for the cold-start tests, resulting in a retarded and thereby less efficient combustion. This raises the exhaust temperature at the inlet of the close-coupled TWC to 335ºC but comes at the cost of considerably increased CO2 emissions. The heat up is accompanied by an elevated engine idle speed of about 1,000 rpm and suspension of the engine start-stop system, as the NEDC test data show. The data indicate that the catalyst heat up strategy is active only for approximately 40 seconds in the cold-start WLTC. During that period, the engine emits 43 g more CO2 than during a warm-start test. In the case of NEDC testing, the observed heat up duration is approximately 60 seconds and the related CO2 penalty is 67 g. At the end of the rapid heat up, the exhaust aftertreatment system has reached hydrocarbons light-off temperature. No heat up strategy could be identified on the Golf TDI, but noting that fewer engine signals were measured for this vehicle, only a less detailed investigation was practical. 17
GASOLINE VERSUS DIESEL: COMPARING CO2 EMISSION LEVELS OF A MODERN CAR
Cold-start test Warm-start test
WTLC NEDC
Vehicle Speed (km/h)
75
50
25
0
2500
Engine Speed (rpm)
2000
1500
1000
500
0
30
Ign. timing (°CA BTDC)
Late ignition
15
0
-15
-30
500
Exhaust temperature (°C)
Average temperature upstream TWC 1 and 2
Upstream TWC 1
400
Upstream TWC 2
300
200
100
0
CO2 mass flow rate
5 250
Accumulated CO2 mass
CO2 flow rate (g/s)
4 400
CO2 mass (g)
3 300
2 200
1 100
0 0
4000
conc. (ppmC1)
3000
THC tailpipe
2000
1000
0
0 20 40 60 80 100 0 20 40 60 80 100
Time (s) Time (s)
Figure 11. Golf TSI rapid catalyst heat up strategies in WLTC and NEDC at 23ºC.
18ICCT WHITE PAPER
Alternator power demand. The CO2 penalty due to the rapid catalyst heat up strategy
as discussed above was observed only during the engine warm-up phase of the cold-
start tests, but not for a warm-start test. Even without catalyst heat up, CO2 emissions
during a cold start are higher than for a warm engine because of increased friction and
thermal losses. The total CO2 emissions of cold-start tests were therefore expected to be
higher by at least the CO2 amount emitted during the catalyst heat up, compared to the
respective warm-start test.
However, as shown for two WLTC tests in the second graph of Figure 12, the delta in CO2
mass between the cold- and warm-start test at the end of the entire test is only 29 g,
which is considerably lower than the 43 g at the end of the warm-up phase, i.e., after 40
seconds (see Figure 11).
The explanation for this unexpected observation can be found in the different alternator
power demand for cold- and warm-start tests. The third graph of Figure 12 shows for
two WLTC tests that during the cold-start test, the alternator is mainly actuated in the
overrun8 phases, generating power with as little impact on fuel consumption as possible.
In contrast, during the warm-start test, the alternator is activated continuously when the
engine is running. The accumulated alternator energy output shown in the fourth graph
of Figure 12 is thereby almost twice as high during a warm-start test than for a cold-
start test. This behavior is repeatable and was also observed in NEDC tests. Reducing
the engine load by not actuating the alternator results in lower cycle CO2 emissions.
However, the electric energy not produced by the alternator must be provided by the
battery instead, which needs to be recharged in subsequent drive cycles, producing
higher CO2 emissions. The NEDC test procedure, which was used for the type approval
of the Golf TSI, does not contain any mechanism to correct the type-approval CO2
emissions for changes in the battery state of charge (Pavlovic, Ciuffo, Fontaras, Valverde,
& Marotta, 2018). This loophole was closed in the WLTP by introducing a correction
procedure, which contains a formula to calculate the battery energy change equivalent
CO2 mass (European Commission, 2017). This formula was used to approximate how
much less CO2 is emitted in a cold-start WLTC due to this difference in alternator
actuation. For the WLTC tests compared in Figure 12, the difference in the measured
alternator power is equivalent to a total of 82 g less CO2 during the cold-start test than
during the warm-start test, which is equivalent to 3.5 gCO2/km. As the smaller CO2
difference at the end of the entire test compared to the end of the catalyst heat up
reveals, cold-start effects that increase fuel consumption—such as higher friction and
heat losses, and even part of the CO2 emission increase due to the rapid catalyst heat
up—are compensated for by exploiting this loophole.
Further analysis must be performed to better understand the potential effects of such
alternator operating strategy on the upcoming post-2020 CO2 standards (European
Union, 2019). For 2021, each manufacturer’s CO2 targets will be determined based on
the ratio of its WLTP and NEDC fleet emissions in 2020 (Dornoff, Miller, Mock, & Tietge,
2018). Whereas the WLTP CO2 emissions are corrected for changes in the battery charge
level, the equivalent NEDC values are not. Depleting the battery more during the WLTP
type-approval test will therefore increase the WLTP to NEDC CO2 ratio and eventually
inflate the manufacturer’s CO2 target for 2021 onward.
Because no alternator power measurements were performed for the Golf TDI, a similar
analysis could not be performed. However, the exploitation of the battery discharge
loophole is considered common practice for NEDC type approval (Pavlovic et al.,
2016). Taking into account that both vehicles are from the same manufacturer, it was
8 Overrun is the state where the engine crankshaft is propelled during deceleration or downhill driving when it
is connected through the driveshaft with the driven wheels.
19GASOLINE VERSUS DIESEL: COMPARING CO2 EMISSION LEVELS OF A MODERN CAR
considered likely that the Golf TDI engine shows a similar alternator operating strategy
and therefore the decision was made not to correct the CO2 emissions of the cold-start
Golf TSI measurements by the procedure defined in the WLTP regulation.
Cold-start test Warm-start test
Vehicle Speed (km/h)
150
100
50
0
80
Delta CO2 mass (g)
60
40
Delta [Cold-start test CO2 mass] - [Warm-start test CO2 mass]
20
0
2000
Alternator Electric Power (W)
1600
1200
800
400
0
Electric Energy Output (Wh)
Accumulated Alternator
200
160
120
80
40
0
Equivalent CO2 Mass (g)
Delta Alternator Energy
100
Delta [Alternator energy CO2,eq of warm-start test] -
75
[Alternator energy CO2,eq of cold-start test]
50
25
0
0 200 400 600 800 1,000 1,200 1,400 1,600 1,800
Time (s)
Figure 12. Golf TSI alternator power generation in cold- and warm-start WLTC at 23 ºC.
Alternator energy equivalent CO2 mass is approximately 82 g higher for the warm-start than for
the cold-start test.
Effect of trip composition and duration. For short trips, the elevated CO2 emissions of
an engine cold start have a larger impact on the cycle CO2 emissions whereas they are
more leveled out in longer distance trips. A study by the Technical University Dresden on
mobility in German cities reveals that many real-world vehicle trips are much shorter and
driven at a significantly lower average speed than the WLTC (Ahrens, 2014). Therefore,
20ICCT WHITE PAPER
CO2 emissions of the two test vehicles for a representative trip performed by urban
citizens in Germany were estimated on the basis of the WLTC phase results. On average,
such a trip has a length of 10–11 km, driven at an average speed of 28–33 km/h. A trip with
these characteristics can be synthesized by concatenating the low phase and 1.5 times the
medium WLTC phase. This results in a trip with a total distance of 10.2 km at an average
speed of 29.7 km/h. For simplification, this trip from here on is called the city trip.
To determine which phase CO2 emissions to consider for the calculation of the city trip
emissions, the coolant temperature profiles shown in Figure 10 were taken in to account.
The Golf TDI reaches 80ºC at the end of the medium phase. Hence, the CO2 emissions
for the cold-start city trip were calculated with the WLTC cold start results of the low
phase and 1.5 times the warm-start emissions of the medium phase. Considering that
the Golf TDI does not reach the coolant temperature level of the warm-start test in the
medium phase, the calculated CO2 emissions are a bit lower than the values expected
for a measurement in such a test on the chassis dynamometer. To account for this
simplification, and recognizing that the Golf TSI reaches the coolant temperature level
of the warm-start test very early in the medium phase, the Golf TSI CO2 emissions of
the cold-start city trip are calculated with the WLTC cold-start emissions of the low
phase and 0.5 times of the medium phase plus the warm-start emissions of the medium
phase. The CO2 emissions of both vehicles for the equivalent warm-start city trip were
calculated using the CO2 emissions of the low phase and 1.5 times the medium phase of
the warm-start WLTC.
The result of this analysis is shown in Figure 13. For a warm-start WLTC, the Golf TDI CO2
emissions are on average 9.0% higher than for the Golf TSI. The difference between the
two vehicles would be 9.6% in case of the city trip due to the shorter total distance and
the different trip composition. Due to the longer warm-up of the Golf TDI, the difference
in CO2 emissions of the cold-start tests increases disproportionately from 10.3% for the
WLTC to 13.0% for the city trip. This means that the CO2 benefit of the gasoline powered
vehicle would be even more pronounced on a shorter, cold-start trip, as for example this
exemplarily analyzed WLTC-based city trip.
WLTC City Trip
Difference in CO2 emissions − Golf TDI vs TSI
10%
5%
0%
Warm Cold
Coolant temperature at test start
Figure 13. Comparison of the relative difference in cycle CO2 emissions of the Golf TDI and Golf
TSI for both a cold- and warm-start WLTC at 23 ºC and a test with a representative duration and
distance for trips performed by the German urban population.
21You can also read