CO2 emissions target for passenger cars for 2025: delivering value to consumers - Long version
←
→
Page content transcription
If your browser does not render page correctly, please read the page content below
The Consumer Voice in Europe

CO2 emissions target for
passenger cars for 2025:
delivering value to
consumers

Long version

Contact: Stefanie Heinzle – environment@beuc.eu

Ref.: X/2013/019 – 22/03/2013

Executive summary
In July 2012, the European Commission proposed a mandatory CO2 emissions target
of 95 g CO2 for new passenger cars to be achieved by the year 2020. The legislative
proposal confirming this target is currently going through the ordinary legislative
procedure in order to become binding. In a recent BEUC position paper1 we welcomed
the 2020 emission target as we expect this target to reduce CO2 emissions of the
transport sector, reduce the dependence on foreign oil imports, protect consumers
from steady increases in fuel prices and prevent further air quality pollution.

There is, however, a clear lack of a post 2020 vision in the Commission proposal. In
order to protect consumers from further increases in fuel prices, and in order to
ensure that manufacturers have sufficient lead time, we see value in introducing an
indicative 2025 target of 70 g CO2/km in the revision of Regulation 443/2009, which
must be subject to confirmation of its feasibility on the basis of an updated impact
assessment at a later stage. Fuel prices are a major worry for EU consumers and we
support ambitious targets to reduce CO2 emissions that would deliver fuel price
benefits where these outweigh the additional costs linked to more expensive car
technology incurred by consumers.

The target should be confirmed unless an alteration of the target is duly justified in
the light of the results of the impact assessment and the modalities to reach the
target should be proposed by the European Commission in the legislative proposal at
a later stage. We consider that this must include a full assessment of the financial
costs and benefits for consumers, which takes advantage of a transparent and reliable
cost-benefit analysis preferably based on a combination of sophisticated vehicle
computer simulations and tear-down cost assessments. In addition, any proposal
must be prepared on the basis of an effective analysis of the social impact on
different consumer segments, as well as a thorough empirical evaluation of the public
acceptability of setting such targets. BEUC calls for a robust assessment based on
these factors. To inform this debate, in this paper we have conducted an initial
analysis on the evidence available at this stage.

Studies suggest that emissions could be lowered to 75 g CO2/km without the need to
sell ultra-low carbon vehicles. However, for a 2025 target of 70 g CO2/km we believe
a share of ultra-low carbon vehicles in new car sales of up to 10% would be required,
on top of the emissions reductions from the remaining 90% of conventional
powertrains down to 75 g CO2/km. This level of market penetration is at the low end
of numerous market share projections. We suggest the level of 70 g CO2/km as an
indicative target to therefore ensure that at least a small percentage of new car sales
in 2025 would need to be covered by ultra-low carbon vehicles.

Our analysis, based primarily on recent work by the International Council for Clean
Transportation (ICCT), suggests that, relative to the baseline of 130 g CO2/km that
manufacturers must achieve as an average CO2 emission target by 2015, lowering
emissions of cars powered by an internal combustion engine (ICE) down to 75 g
would lead to average fuel savings of up to 643 Euros per year for consumers. The
payback period for the additional increase in retail price of cars powered by an ICE
would be approximately 3.6 years, ranging from 1.9 to 5.2 years, depending on the
vehicle segment. However, the payback period for the share of the increase in
purchase price that the first owner has to bear would be on average around 2.3
years, with a range of 1.2 to 3.2 years.

1
    BEUC (2012): Good for the environment and good for your pocket: Consumer benefits of CO2 emissions
    target, short version:
    http://docshare.beuc.org/Common/GetFile.asp?ID=43390&mfd=off&LogonName=GuestEN, long version:
    http://docshare.beuc.org/Common/GetFile.asp?ID=43385&mfd=off&LogonName=GuestEN
Despite the higher initial purchase price of ultra-low carbon vehicles, several studies suggest that by 2025, their total cost of ownership equation could become even favourable over conventional cars. Up to 2025, demand will be driven mostly by “early adopter segments”, particularly those which have a clear perspective on the vehicle’s total cost of ownership such as purchasers of governmental and company fleets, taxis, car-sharing schemes, etc. The initial market pull from these market segments could provide the scale economies to make the new technologies more cost-effective also for the general consumer group in the long run. Finally, it will be fundamental to make use of footprint as the parameter for determining the limit values in 2025, in order to encourage manufacturers to invest into light weighting, which will make the necessary CO2 reductions achievable in a more economical way.
1.       The need to set a long-term CO2 emissions target for 2025

With large increases in fuel costs, studies show that high fuel prices and car running
costs are now a significant issue to European consumers.2 In addition, research
shows that the level of fuel consumption of a car has become a highly relevant
criterion in consumers’ purchasing decisions.3 However, even though consumers
more and more take the level of fuel consumption of a car into account, research
still shows that consumers substantially undervalue future fuel costs at the time of
car purchase and often do not take account of rising fuel costs.4

There are several market failures discussed in literature, on both the supply and the
demand side, which prevents that fuel economy improvements are valued to that
extent that would easily pay for themselves through future fuel savings (see Annex
2). A package of different policies will be necessary in order to tackle such kind of
market imperfections: we consider particularly CO2 emissions standards, fiscal and
information programs to be complementary measures. Taxes at the point of vehicle
purchase can provide a strong signal to car buyers to opt for more fuel efficient
cars. In addition, disclosing information about fuel consumption and CO2 emissions
information should help consumers to make a more informed purchase decision.
However, the current implementation of Directive 1999/94/EC, which requires that
buyers of new cars must be provided with information about the fuel consumption
and CO2 emissions of cars at the point of sales and through marketing materials,
has not guaranteed that all European consumers are given clear and comparable
information.5 Unfortunately, any plans to improve information for car buyers by
revising Directive 1999/94/EC were notably absent in the European Commission
work programme for 2013.

Even though better designed information and taxation instruments should help
overcome some market failures, fuel efficiency will not be driven by consumer
choice alone. We therefore consider government intervention in form of CO2
emission standards as essential in order to drive the uptake of more fuel efficient
vehicles.

2
    A survey by Which? (February 2013), for instance showed that 86% of UK consumers are worried about
    the increase in fuel prices, making it their number one financial concern. See Annex 1 for more
    information.
3
    According to a UK study, fuel economy/running costs, size/practicality and vehicle price were the three
    most important factors considered among UK consumers, see LowCVP Car Buyer Survey (2010):
    Improved environmental information for consumers, Research conducted by Ecolane & Sustain on
    behalf of the Low Carbon Vehicle Partnership – June 2010.
    http://www.lowcvp.org.uk/assets/reports/LowCVP-Car-Buyer-Survey-2010-Final-Report-03-06-10-
    vFINAL.pdf). Another study by the German Energy Agency (DENA) also claims that fuel consumption is
    a main criterion for German car buyers, see German Energy Agency (2012):
    http://www.dena.de/presse-medien/pressemitteilungen/dena-umfrage-autohaendler-unterschaetzen-
    potenzial-des-pkw-labels.html.
4
    Research shows that consumers strive to recover any extra expenditure on fuel economy through
    lower fuel expenditures within three years, much shorter than the expected lifetime (or usage time
    plus resale value) of a car. For instance, a study by Potogloe, D and Kanaroglou, P.S. (2007)
    measured Canadian consumer’s willingness to pay for a cleaner vehicle. This showed that
    consumers were willing to pay 2200-5300 dollars extra to save 1000 dollar per year on fuel. This
    would indicate that a payback (on fuel savings) of 2.2 – 5.3 years would be acceptable for
    consumers. The Consumer Federation of America has done a poll in September 2010 which showed
    that a majority of consumers (62%) say they would pay more for a new fuel-efficient car if they
    recouped the added expense within a five-year payback period. A study by Alcott and Wozny
    (2009) suggests that consumers consider fuel savings from efficiency improvements over
    approximately three years and the Energy Information Administration´s National Energy Modeling
    System assumes that new auto buyers use payback periods of three to five years. Finally, Greene
    et al. (2005 a,b) examine feebate policies using base assumptions in which consumers consider the
    fuel savings for just three years.
5
    See Annex 2 for more information.
In this respect, important regulatory measures have been adopted including the
obligation for car manufacturers to reduce CO2 emissions from cars in a step wise
approach.6 The EU Regulation No. 443/2009 on passenger cars sets a target of 95 g
CO2/km for the new car fleet for the year 2020. However, up to date, this target is
only provisional. A review has been carried out by the European Commission in
order to define the modalities of reaching this target. The legislative proposal
confirming this target has been presented in 2012 and is currently going through
the ordinary legislative procedure in order to become binding.
In order to achieve the goal to dramatically reduce emissions from passenger car
transport by 60% by the year 2050
compared to a 1990 baseline as suggested A long-term target would:
by the new White Paper on Transport7, it is
fundamental however not only to set Provide considerable financial
intermediate goals for 2020 but also for gains to consumers
2025 as early as possible in order to give Provide considerable health
industry enough time to prepare for the benefits to consumers
necessary changes.8 The target of 95 g Protect consumers against the
CO2/km was already discussed and set in very likely increase in fuel
2008, therefore clarified 12 years before prices
making this limit mandatory. Technological Guarantee that manufacturers
progress in recent years has made the and suppliers would be
target of 95 g achievable with considerable provided with planning and
financial gains for consumers. Setting a investment certainty
target now for 2025 would therefore follow Incentivize the development of
the same logic and guarantee that ultra-low carbon vehicles
manufacturers and suppliers would be
provided with planning and investment certainty while consumers would be
protected against the very likely increase in fuel prices. High and ever increasing
fuel prices are a real threat to consumers and spikes in fuel prices cause immediate
and financial pain for many consumers; a target for 2025 would therefore make
consumers less vulnerable towards significant increases in fuel prices9, if set at the
appropriate level and appropriately designed.
6
Regulation (EC) No 443/2009 of the European Parliament and of the Council of 23 April 2009 setting
emission performance standards for new passenger cars as part of the Community's integrated
approach to reduce CO2 emissions from light-duty vehicles (23 April 2009).
7
http://ec.europa.eu/transport/themes/strategies/2011_white_paper_en.htm
8
According to the impact assessment by the European Commission, “the automotive industry works to
planning cycles that suggest to need to know approximately 10 years in advance the broad framework
within which vehicles need to be designed, and a shorter period of around five years to more precise
decisions on variants that will actually be produced”, see Impact assessment accompanying the
Commission proposal SWD/2012/213:
http://eur-lex.europa.eu/LexUriServ/LexUriServ.do?uri=CELEX:52012SC0213:EN:NOT.
9
See Annex 3 for the development of fuel prices between 2005 and 2013.This is of vital importance since many consumers highly depend on car transport:
Passenger cars accounted for 83.3% of inland passenger transport in 2008 as
measured by the number of inland passenger-kilometres travelled.10 In countries
such as Germany and the UK, more than 82% and 75%, respectively, of all
households own at least one car.11 Car dependency in rural areas, where there is a
lack of public transportation infrastructure, is even higher.12 As consumers
predominantly rely on their cars for transport purposes, they see their purchasing
power eroding by having to spend more and more of their income on fuel because
of increases in fuel prices. This is of major concern as an increasing number of
drivers are on risk to become socially excluded.13
2. A portfolio of technologies necessary to achieve a long-term
target in 2025
Potential efficiency gains until 2025 can be brought about by:
- Further improvements of cars powered by an internal combustion engine;
- New technologies allowing extremely low emissions (“ultra-low carbon
vehicles”), including plug-in hybrid electric vehicles (PHEVs)14, battery
electric vehicles (BEVs)15, range extender electric vehicles (REEX)16 and fuel
cell electric vehicles (FCEVs).
In order to evaluate the potential for efficiency gains both approaches should be
analysed in combination.
10
Furthermore, in 2009, there were 473 passenger cars for 1000 inhabitants in the EU corresponding to
a vehicle stock of 236.1 million passenger cars; see Eurostat (2012) :
http://epp.eurostat.ec.europa.eu/tgm/table.do?tab?table&init=1&plugin=1&language=en&pcode=tsd
pc340.
11
RAC Foundation (2013):
http://www.racfoundation.org/assets/rac_foundation/content/downloadables/factsheet_on_fuel_cars_
and_drivers.pdf; ADAC (2010):
http://www.adac.de/_mmm/pdf/statistik_mobilitaet_in_deutschland_0111_46603.pdf.
12
In the UK for instance, 91% of rural households own at least one car, compared to 57% of households
in London and 68% in other metropolitan areas. See RAC Foundation (2013) for more information.
For many people living in rural areas, mobility is just not possible without a car due to a lack of
sufficient infrastructure to guarantee independent travel.
13
See RAC report on motoring (2012): 9% of drivers in the UK have already restricted their social life
due to rising costs and 29% of drivers would consider doing this in case motoring costs increase in the
future.
14
A plug-in hybrid electric vehicle (PHEV) is a hybrid vehicle with batteries that can be recharged by
connecting the car to the grid and an ICE that can be used when batteries need recharging. A PHEV
can essentially be operated as an electric vehicle with an internal combustion engine as a backup.
15
A pure electric vehicle is a car equipped with a bigger sized battery and is solely operated in electric
mode, i.e. run solely on an on-board rechargeable battery system. A battery-only electric vehicle
therefore does not have any ICE as it only derives all its power from its battery packs, which can be
recharged on the electricity grid.
16
Range extended electric vehicles are similar to plug-in hybrid electric vehicles as they also have an
ICE and at least one electric motor. In the range extended electric vehicle, the ICE is used for a
stabilisation of the charge of the battery.2.1. Further improvement of cars powered by an internal combustion
engine
A recent study by Cambridge
Econometrics and Ricardo- Emissions could be brought to an average
AEA 17
showed that further fleet level of at least 75 g CO2/km without
improvements of combustion the necessity of a market penetration of
engines including hybridisation ultra-low emitting cars.
can lower CO2 emissions down
to 75 g CO2/km by 2025 (i.e. A further decarbonisation below 75 g
no ultra-low carbon vehicles CO2/km might require the development of
will be necessary). The analysis a range of new technologies.
showed that the average cost
of lowering CO2 emissions to 75 g CO2/km in 2025 would amount to €1494 in 2025
relative to the 2010 level of 140 g CO2/km.
This is comparable to the results of a recent study authored by the International
Council on Clean Transportation (2013)18 which showed that when the CO2 emission
reduction benefit of mass reduction technology is fully credited, a target of 75 g
CO2/km could be achieved by applying existing technology (conventional
powertrains including hybridisation) at a limited additional cost of €1600 relative to
the 2010 baseline of 140 g CO2/km.
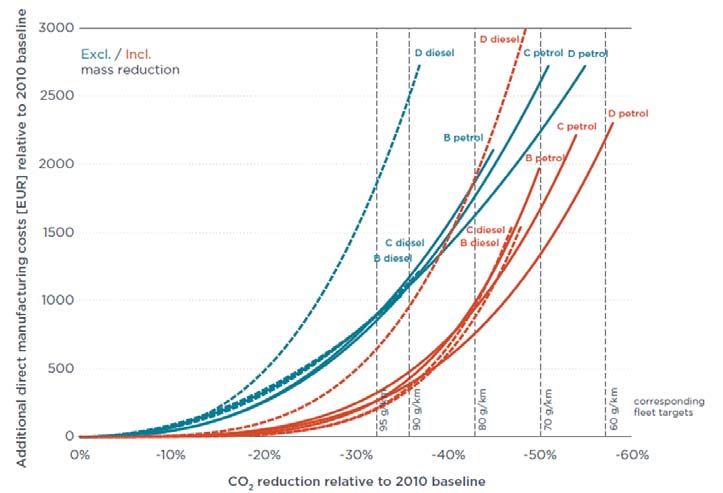
Figure 1 shows that cost curves differ across the different vehicle segments
included in the simulation model by the ICCT, which constitute distinct product
markets. The maximum CO2 reduction potential for the different segments is
subject to the technologies included in the cost curve19, leading to different
endpoints. The maximum CO2 reduction potential that all segments can
simultaneously achieve is about 47% relative to the 2010 baseline.
Figure 1: Additional direct manufacturing costs (ICCT study)
17
Cambridge Econometrics and Ricardo-AEA (2013): An economic assessment of low carbon vehicles.
18
ICCT (2013): CO2 reduction technologies for the European car and van fleet, a 2020-2025 assessment
– summary of mass reduction impacts on EU cost curves. Working paper 2013-1
(http://www.theicct.org/mass-reduction-impacts-eu-cost-curves).
19
For instance, for C class petrol vehicles, P2 hybrid technology was included in the cost curve
estimation as this technology proved to be a cost effective measure whereas for C class diesel
vehicles, P2 hybrid technology was not included in the cost curve construction, see
http://www.theicct.org/mass-reduction-impacts-eu-cost-curves.To sum up, when assuming no market shifts, emissions could be brought to an
average fleet level of at least 75 g CO2/km without the necessity of a market
penetration of ultra-low emitting cars. When assuming market shifts, such as from
diesel to petrol vehicles, higher CO2 reductions could even be possible and costs
might be even lower. Assuming no market shifts, a further decarbonisation below
75 g CO2/km however might require the development of a range of new
technologies.
2.2. Forecast of the future market penetration of ultra-low carbon vehicles
The forecast of the future growth and market penetration of ultra-low carbon
vehicles involves great uncertainties and is depending on a great number of
different influencing factors, including the development of fuel and electricity prices,
costs of battery technology, etc. The range of market shares of ultra-low carbon
vehicles in the 2025 time period diverges extensively among the reviewed studies
(i.e. ranging from 7.7% in the Oliver Wyman study20 to 54% in the EV breakthrough
scenario of the CE Delft study21), depending on the assumption regarding the
development of battery prices, government support, etc. Annex 4 lists the annual
sales projections of different studies, which include both market forecasts and
scenarios.
3. The potential consumer benefits of a market penetration of
ultra-low carbon vehicles
We suggest that an indicative target of long-term CO2 emissions targets for new
passenger cars for 2025 is included in the revision of EU Regulation No 443/2009,
subject to a review clause that this target needs to be reconfirmed at a later stage.
It should be subject to an impact assessment based on the most transparent,
reliable, sophisticated and up-to-date evidence to assess cost implications and
payback periods for consumers, as well as an thorough empirical evaluation of the
public acceptability of setting such targets.
As shown above, studies by the ICCT and Cambridge Econometrics and Ricardo-
AEA have shown that a target of 75 g CO2/km could be achieved without the need
to sell ultra-low carbon vehicles.22 In this paper, we make use of the recent ICCT
study to explore the cost impacts and payback periods of consumers of lowering
emissions powered by conventional powertrains. When assuming no market shifts,
a target of 70 g CO2/km or below should ensure that at least a small part of the
market must be covered by ultralow carbon vehicles, to spur their development.
Developing ultra-low carbon vehicles, coupled with a decarbonisation of the
electricity mix, will help achieve the EU target of significantly reducing CO2
emissions from transport by 2050. In addition, reduction in harmful substances
from combustion engines would lead to significant health benefits for consumers.23
The reason for that is that ultra-low carbon vehicles will lead to immense
20
Oliver Wyman (2011): E-mobility 2025 – power play with electric cars.
http://www.oliverwyman.com/media/ManSum_E-Mobility_2025_e.pdf.
21
CE Delft 2011: http://www.cedelft.eu/publicatie/impact_of_electric_vehicles/1153.
22
However, even though manufacturers will be able to meet the standards without the need to sell
ultra-low carbon vehicles, they still could decide to produce more advanced powertrains depending on
the internal company strategy.
23
Electrical vehicles do not emit any harmful particles from the tailpipe as the electricity used is usually
generated further from population centres. Conventional fuel combustion on the other hand produces
gases and particles that have a significant impact on consumers’ health. For instance, emissions from
diesel burning engines significantly increase the risk of allergic and asthmatic reactions. It was
recently announced by the World Health Organisation that exhausts from diesel engines even can
cause cancer, see: http://www.euro.who.int/_data/assets/pdf_file/0003/87573/E72015.pdf.improvements in the quality of air particularly in city areas as there are no localised
emissions. According to the World Health Organisation (WHO), over 80% of
Europeans are exposed to particulate matter (PM) levels above the 2005 WHO Air
Quality Guidelines (AQGs).24 On average, this deprives each European citizen of 8.6
months of life. A recent study (2010 Global Burden of Disease assessment) has
shown that air quality has been recognized as one of the most important risk
factors for public health (ranked 11th for countries of Western Europe). According to
this study, exposure to fine particulate matter leads to over 430,000 premature
deaths and 7 million years of healthy life lost in Western, Central and Eastern
Europe (including Russia).25 However, depending on the type of power generation
supplying the electricity for such kind of vehicles, air pollution from power plants
can still occur, but are usually located outside of the urban agglomeration. Still, a
decarbonisation of the electricity mix must go hand in hand with the market
penetration of electric vehicles in order to achieve the full health benefits for
consumers. It would also help reducing noise pollution from traffic, which is also a
significant driver of health problems.
To sum up, vehicle electrification offers many advantages over conventional
combustion engines, such as lower running costs and improved local air quality.
Nevertheless, there is still a high number of barriers hindering a fast market
expansion of ultra-low carbon vehicles. Limitations include a limited all-electric
drive range, long recharging times of the battery, high initial costs of the battery
and the development of charging infrastructure, as well as a lack of sufficient
recharging infrastructure and the cost of any additional electricity generation. In
addition, it must be taken into account that ultra-low carbon vehicles do no emit
any or only few emissions at the tailpipe, but significant CO2 emissions could arise
from the production of electricity. It is therefore important that a parallel
decarbonisation of the electricity mix takes place. In addition, for the period after
2025 it is thus necessary that the European Commission should take into
consideration metrics that take into account also upstream greenhouse emissions.
In order to incentivize the development of ultra-low carbon vehicles, we would
propose, at this stage and based on existing analysis, an indicative 2025 target of
70 g CO2/km to be included in the revision of Regulation 443/2009. The target
should be confirmed and the modalities to reach the target should be proposed by
the European Commission in a legislative proposal at a later stage, subject to a
thorough impact assessment, including a detailed analysis of the cost-benefit
impact on consumers, as well as a thorough empirical evaluation of the public
acceptability of setting such targets.
24
According to the World Health Organization (WHO), long-term exposure to fine particles (PM2.5) can
trigger atherosclerosis, adverse birth outcomes and childhood respiratory diseases. In addition, the
review by the WHO also points towards a potential relationship of air pollution to neurodevelopment,
cognitive function and diabetes, and strengthens the causal link between PM2.5 and cardiovascular
and respiratory deaths (http://www.euro.who.int/en/what-we-publish/information-for-the-
edia/sections/latest-press-releases/newly-found-health-effects-of-air-pollution-call-for-stronger-
european-union-air-policies#.UQprNBLW6yA.twitter).
25
Global burden of disease study (2010): http://www.thelancet.com/themed/global-burden-of-disease.
Health and environment alliance (2012: http://www.env-health.org/resources/press-
releases/article/air-pollution-ranked-as-top-health.We assume that conventional powertrains
(including hybridisation) will need to reduce BEUC proposes an indicative
emissions down to an average emissions 2025 target of 70 g CO2/km
level of 75 g CO2/km whereas the share of
10% of ultra-low carbon vehicles will deliver The precise target should be
the remaining emission reduction of 5 g.26 proposed by the European
The share of ultra-low carbon vehicles Commission in a legislative
(including plug-in hybrids, range extender proposal at a later stage,
and battery electric vehicles) which are subject to a thorough impact
necessary to meet this indicative target assessment
therefore easily fall within the scope of the
market projections as outlined above.
4. Cost-benefit analysis for cars powered by an internal
combustion engine
The following analysis shows that lowering emissions of cars powered by
conventional powertrains down to 75 g CO2/km relative to the baseline of 130 g
CO2/km in 201527 would lead to significant fuel savings for consumers: The average
private European motorist driving a diesel or petrol car would benefit from fuel
savings of approximately 643 Euros a year. The payback period for the additional
increase in retail price would be approximately 3.6 years.
However, a typical European private motorist sells the car after a holding period of
five years. Approximately a third of the higher purchase price can be passed on to
the used car buyer and only two thirds of the higher price needs to be paid by the
new car owner. We therefore assume that the share of the potential higher
purchase price that the typical new car buyer has to bear is below 2.3 years. The
average payback period for the share of the potential higher purchase price that the
typical used car buyer has to bear is approximately only 1.4 years.
4.1. Additional average manufacturing costs for cars powered by an
internal combustion engine
In order to calculate the additional average manufacturing costs for cars powered
by an internal combustion engine (ICE) for bringing down average fleet emissions
to a level of 75 g CO2/km, we base our analysis on the data by the International
Council on Clean Transportation (ICCT)28 where in a recent published study the
possibility of mass reduction was integrated into the EU cost curve analysis.29 The
cost of CO2 standard compliance is lower when assuming that mass reduction
technology is fully creditable.
The study by the ICCT for the European vehicle market is based on most recent
data and assessment methodologies originally developed for the US Environmental
Protection Agency (EPA). The study is based on existing technology studies that
were performed in preparation for the United States 2017-2025 light duty vehicle
26
In line with the Oliver Wyman study and the study by AEA (2013) we assume the ratio between PHEV
and BEV to be in the range of 2:1 to 4:1. We therefore assume that by 2025, 4% of all vehicles sold
would need to be electric vehicles whereas 6% of all vehicles sold would need to be plug-in hybrid
electric vehicles. Electric vehicles do not emit any CO2 emissions at the tailpipe whereas plug-in
hybrids are expected to emit on average 40 g CO2/km in 2025.
27
Manufacturers must achieve an average CO2 emission target of 130 g CO2/km by 2015.
28
Mezler, D., German, J., Mock, P., Bandivadekar, A. (2013): CO2 reduction technologies for the
European car and van fleet, a 2020-2025 assessment – summary of mass reduction impacts on EU
cost curves. Working paper 2013-1.
29
In the U.S., the project was carried out jointly by three major agencies (EPA, NTHSA, CARB) with a
total budget for technical studies of around 15 million US$.regulation. This study makes use of extensive vehicle simulations and a so called
tear-down cost assessment, both of which are very detailed and generally seen as a
ground-breaking best-practice example that closely follows the industry-internal
approach of vehicle development. The study by the ICCT adapts the existing data
from the U.S. to the conditions of the European market in order to arrive at the CO2
reduction cost curves. For instance, the study considers additional driving cycles,
vehicle segments and technologies commonly available in the EU, and adapts
underlying assumptions. For the production cost assessment, it is assumed by the
study that all parts are produced in Western Europe, taking German labour costs as
the basis for all calculations.
We are aware of other studies that conclude that the cost of technology of lowering
CO2 emissions are much higher, including a recent published study by the German
based institute “Institut für Kraftfahrzeuge” (IKA), which has been commissioned by
the German Ministry of Economy. The cost estimates for this study are much higher
than projected by the ICCT (e.g., for meeting the 95 g/km target in 2020, the IKA
study estimates additional cost of €2000 or more on average compared to the 2010
baseline). These cost estimates, however, are based only on expert interviews with
car manufacturers and suppliers. We consider this approach as being less reliable
compared to the “tear down” approached followed by the ICCT.
We base our analysis on the work conducted by ICCT, as their approach is the most
detailed and transparent approach available and most closely follows the car
industry’s own methodology to estimate future technology cost. For our analysis, as
we assume that for 2025, footprint is used as the parameter for determining the
limit value curve, we use the ICCT cost curve that fully credits mass reduction
potential. In comparison to the 2015 baseline, an average fleet value of 75 g
CO2/km for the conventional car fleet in 2025 would equal a 42% improvement. For
our analysis, it is assumed that all vehicle segments cut CO2 emissions by an
identical percentage (i.e. 42%) and no market shift occurs (see table 1).
Table 1: Increase in retail price of cars powered by an ICE
Average Average Additional direct Retail price incl. tax
emissions in emissions in manufacturing
2015 2025 costs
B petrol 126 g 73 g 1350 € 1944€
C petrol 145 g 84 g 1200 € 1728 €
D petrol 165 g 96 g 1000 € 1440 €
B diesel 105 g 61 g 1350 € 1944 €
C diesel 122 g 71 g 1250 € 1800 €
D diesel 138 g 80 g 2450 € 3528 €
The cost of reaching an average fleet emissions value of 75 g CO2/km of new
vehicles powered by an internal combustion engine (incl. hybridisation) will,
according to the ICCT study, involve additional manufacturing costs of
approximately €1000 to €2450 per car compared to the 2015 baseline of 130 g
CO2/km. This translates into an additional retail price of €1440 to €3528 per car
compared to the 2015 baseline (we follow the assumption by Smokers (2006) and
translate direct manufacturing costs into additional retail price using the factor
1.4430) (see table 1).
However, we emphasise that in ex-ante estimates, production costs are often
largely overestimated. One reason for that, as shown by a study by the Institute for
Applied Environmental Economics, is that for ex-ante estimates of unit costs for the
future, often no attention is given to “normal innovation” such as economies of
30
Smokers et al. (2006): Review and analysis of the reduction potential and costs of technological and
other measures to reduce CO2 emissions from passenger cars - Final report.
http://ec.europa.eu/enterprise/sectors/automotive/files/projects/report_co2_reduction_en.pdfscale or unforeseen developments resulting in cost benefits.31 The catalytic
converter technology provides a good example that the automotive industry has
been significantly overestimating the costs for the new technology in the past.32
Another study conducted by the German based institute “Institut für
Kraftfahrzeuge” (IKA) and commissioned by the German Ministry of Economy
showed also is a good example that ex-ante estimates of additional technology cost
are often extremely overestimated. Their study on light-commercial vehicles
(“vans”) claimed that the cost of achieving a target of 148 g CO2/km by 2030 would
amount to €9000.33 The European Commission however expects, based on a recent
study by TNO (2012)34 that the average additional manufacturing cost is estimated
at around €450 per van in order to achieve a target of 147 g CO2/km in 2020.35
In addition, estimated higher costs due to the emission targets are often not passed
on to consumers via higher vehicle prices. Obviously, the development of retail
prices are influenced by many other factors, including the recent financial crises,
competition from outside Europe and changing consumer demands. Nevertheless,
there are good reasons to assume that price increases in the future might also be
lower than the current estimations as described above predict. For instance, a
report by the Netherlands Organisation for Applied Scientific Research (TNO)36
compiled in 2006 projected that the costs of reaching the goal of an average of 140
g/km in comparison to the 2002 baseline would lead to an increase in retail prices
of €1200 per vehicle. However, the opposite development took place: car prices
actually declined by 2.5% in 2010, by 0.6% in 2009 and by 3.1% in 2008.
31
See http://ec.europa.eu/environment/enveco/ex_post/pdf/transport.pdf.
32
http://awsassets.panda.org/downloads/crywolf0404b.pdf
33
For a critical analysis of this study see a briefing by Transport & Environment (2013):
http://www.transportenvironment.org/publications/critical-assessment-aachen-study-co2-reduction-
potential-light-commercial-vehicles2.
34
http://ec.europa.eu/clima/policies/transport/vehicles/vans/docs/report_co2_lcv_en.pdf.
35
http://ec.europa.eu/clima/policies/transport/vehicles/vans/faq_en.htm.
36
Review and analysis of the reduction potential and costs of technological and other measures to
reduce CO2 emisions from passenger cars. Smokers, R. et al., Delft (2006):
http://ec.europa.eu/enterprise/sectors/automotive/files/projects/report_CO2_reduction_en.pdf.4.2. Calculation of fuel savings and payback time for cars powered by an
internal combustion engine
To compute the fuel savings per year, we need to take several assumptions,
particularly regarding the time-evolution of fuel prices37 and the average distance
travelled per vehicle segment.38 Reducing average fleet emissions of cars powered
by an ICE down to 75 CO2/km implies a
reduction in annual fuel consumption of The average private European
about 42% in comparison to the target of motorist driving a diesel or
130 g CO2/km that manufacturers need to petrol car would benefit from
achieve in 2015. fuel savings of approximately
643 Euros a year.
The private motorist buying a new petrol car
in 2025 would benefit from fuel savings of The payback period for the
approximately 512-778€ in the first year of additional increase in retail
ownership, compared to the 2015 baseline. price would be approximately
The private motorist buying a new diesel car 3.6 years.
would benefit from fuel savings of
approximately 544-818€ in the first year of ownership, compared to the 2015
baseline. Taking into account the market share of the different segments as used
by the ICCT in calculating the cost curve for the average market39, and assuming
no shift in market shares, the average savings in the first year across all segments
would be approximately 643€ (see table 2).
Table 2: Savings in the first year for a private buyer of a new conventionally driven
car compared to 130 g CO2/km baseline
Average Average Difference Savings Mileage in Savings in €
emissions emissions in in litres km/ year in the first
in 2015 in 2025 emissions year
B petrol 126 g 73 g 53 g 2.3 l 10.829 km € 512
C petrol 145 g 84 g 61 g 2.7 l 12.579 km € 685
D petrol 165 g 96 g 69 g 3.0 l 12.629 km € 778
B diesel 105 g 61 g 44 g 1.7 l 17.281 km € 544
C diesel 122 g 71 g 51 g 1.9 l 18.431 km € 672
D diesel 138 g 80 g 58 g 2.2 l 19.739 km € 818
Average € 643
37
It is obviously very difficult to predict future fuel prices as they depend on a high number of factors.
There is also a considerable disagreement between academic and industry experts about how to best
predict future prices. Nevertheless, the past has shown that most predictions of future fuel prices tend
to be highly underestimated. Many assumptions for fuel prices are over optimistic and quickly
overtaken by time. For instance, the study by CE Delft (published in March 2011) assumed a petrol
price of €1.52 in 2015, of €1.70 in 2020 and of €1.87 in 2025. The price per one litre of petrol has
already reached the €1.52 mark at the beginning of 2012 and hit a record price of €1.70 already in
August 2012. We therefore decided to follow the route of Plötz et al. (2012) (http://tu-
dresden.de/die_tu_dresden/fakultaeten/fakultaet_wirtschaftswissenschaften/bwl/ee2/lehrstuhlseiten/
ordner_veranstaltungen/ordner_enerday/Enerday%202012/ed2012download/Ploetz_Paper.pdf).
Based on this study, we assume an annual increase in fuel price of 2% annually for the future fuel
prices. We assume a price of one litre of petrol of €2.05 in 2025 and of one litre of diesel of €1.89 in
2025.
38
We make use of the assumptions by the FLEETS study that provides the distance travelled for new
vehicles in the first year (split by vehicle size and fuel price). The FLEETS study reports on the
average distance travelled of all cars, i.e. the values presented in the FLEETS study represents the
data for all car drivers, including drivers of company cars. As approximately 50% of all new vehicles
sold in the European Union are registered as company cars, we therefore adapt the FLEETS study
accordingly. We assume that company cars on average drive nearly twice as much per year than
private cars (see Annex 5). See Annex 6 for the precise figures of the average mileage travelled per
car segment.
39
B petrol 24%, B diesel 16%, C petrol 16%, C diesel 24%, D petrol 4%, D diesel 16%.We make use of a discounted pay-back analysis in order to calculate the period it
takes to recover the amount invested in
fuel-efficiency technology.40 The analysis After a holding period of five
shows that the total payback period for years, the average vehicle is
the increase in retail price incl. VAT is commonly sold at around a third
assumed to be in the range of 1.9 to 5.2 of its original value.
years, depending on the car segment
(see table 3). The analysis shows that The payback period for the
car buyers see a net saving from the additional increase in retail price
new standards within an acceptable time that the first owner has to pay
range. Assuming no shift in market would be approximately 2.3
shares, the average total payback period years.
across all segments would be
approximately 3.6 years.
Table 3: Total number of years required for the fuel savings to equal the increase in
retail price
Increase in retail price incl. Total payback period
VAT
B petrol 1944 € 4.0 years
C petrol 1728 € 2.5 years
D petrol 1440 € 1.9 years
B diesel 1944 € 3.9 years
C diesel 1800 € 2.9 years
D diesel 3528 € 5.2 years
Average 3.6 years
Finally, it is important to take into account that those consumers who buy a new
vehicle with a typical five-year loan will benefit also from average monthly cash flow
savings during the loan period as the monthly fuel savings more than offset the
higher monthly payment due to the higher incremental vehicle cost.
40
We assume an increase in fuel price of 2% annually and a discount rate of 5%. In addition, we take
account of the decrease in annual kilometres travelled per year as indicated in the TREMOD
(Transport Emission Model) 4.17 model.
The discount rate is used to determine the present value of future benefits. The discount rate
represents the opportunity costs of what else the consumer could accomplish with the same fund:
- For vehicle buyers who buy the car through a loan or lease, the opportunity cost of paying more to
purchase a vehicle in the present is the borrowing rate (i.e. when money is borrowed from the bank,
interest is typically paid as percentage of the amount owed to the consumer). We take the MFI
interest rates on euro-denominated loans to euro area residents for consumer credit by initial rate
fixation of over 1 and up to 5 years which amounts to 6.11% by 2013 January 2013
(http://sdw.ecb.europa.eu/reports.do?node=100000173).
- For consumers who pay the car from their savings (i.e. “in cash”), the opportunity cost is the return
(i.e. lending rate) that could be realized on savings. We take the interest rates on deposits with an
agreed maturity of over 2 years, amounting to 2.42% (as of 2013 January) (see
http://sdw.ecb.europa.eu/reports.do?node=100000173).
- A study by the German based Leasetrend AG with 500 German private car buyers showed that 68%
of all private car buyers paid their recent car in cash and did not make use of borrowed capital
(http://www.automobilwoche.de/article/20111006/NACHRICHTEN/111009956/1330#.UTcZAdXc6-U).
Another study by Aral with German private car buyers however showed that only 35% of car buyers
are planning to buy their next car with cash
(http://www.aral.de/liveassets/bp_internet/aral/aral_de/STAGING/local_assets/downloads_pdfs/t/bro
schuere_aral_studie_trends_beim_autokauf_2011.pdf). In addition, in the UK, data by the Finance
and leasing association in October 2012 with 1158 private car buyers showed that 70% of new cars
bought in the UK dealerships by private car buyers were partly or wholly funded through car credits
(http://www.financeacar.co.uk/blog/2013/01/02/70-of-new-cars-are-bought-with-finance-are-you-
prepared). To be on the more conservative side, we assume that 30% of private vehicle buyers pay in
cash whereas 70% of car buyers partly or fully fund their purchase through loans. By weighting the
lending and borrowing rate by the percentage of cash/loan car buyers, we arrive at a discount rate of
5%.4.4. Calculation of pay-back period for first owners of cars powered by
an internal combustion engine
As most consumers do not own a car over its entire lifetime but sell it after few
years, we feel that for this specific exercise it is much more suitable to calculate the
payback period on the basis of the share of the higher purchase price that the first
car owner has to bear. After a holding period of five years, the average vehicle is
commonly sold at around a third of its original value.41 Therefore, it is expected
that approximately two thirds of the higher initial purchase price has to be paid by
the first owner of a new car. The remaining part of the higher costs for meeting the
CO2/km standard can thus be passed on to the used car buyer. The payback period
for the share that the buyer of a new car has to pay for the initial higher purchase
price is assumed to be in the range of 1.2 to 3.2 years, with significant fuel savings
over the remaining holding period.42
Assuming no shift in market shares, the average payback period for the additional
increase in retail price that the first car owner has to bear across all segments
would be approximately 2.3 years. This analysis shows that car buyers see a net
saving from the new standards relatively quickly and well before they typically sell
the car (see table 4).
Table 4: Number of years required for the fuel savings to equal the increase in
retail price the first owner has to pay
Increase in retail price incl. VAT Payback period for first owner
born by first owner
B petrol € 1296 2.7 years
C petrol € 1152 1.7 years
D petrol € 960 1.2 years
B diesel € 1296 2.6 years
C diesel € 1200 1.9 years
D diesel € 2352 3.2 years
Average 2.3 years
4.5. Calculation of pay-back period for second-hand owners of cars
powered by an internal combustion engine
A big share of new passenger cars is not purchased by private motorists but by
firms. More specifically, 42% of all new passenger cars sold in European Union are
purchased by companies43, who later sell the used cars mostly to private motorists.
In many countries of the European Union the used car volumes exceed the sales of
new cars.
As described above, approximately one third of the higher costs for meeting the
CO2/km standard needs to be paid by the driver who buys a 5-year old second-
hand vehicle. The payback period for the share that the used car buyer has to pay
41
According to Kelley Blue Book research in 2010, an average vehicle in the United States retains
32.6% of its original value after five years of ownership. We assume similar values for the European
market.
42
When the car is purchased at a time when fuel costs are even higher, consumers would be able to
recoup their investment even within a shorter period of time. In addition, this analysis is based on the
assumption that the consumer holds the car for 5 years. For consumers who sell their cars sooner, the
payback period is still likely to be shorter than the buyers’ holding period of the car. Although those
owners will see lower fuel savings in total, they will be able to pass on a higher amount of resale
value to the second hand buyer. Finally, those consumers who buy a new vehicle with a typical five-
year loan will benefit also from average monthly cash flow savings during the loan period as the
monthly fuel savings more than offset the higher monthly payment due to the higher incremental
vehicle cost.
43
Gutiérrez Puigarnau, E. and Van Ommeren, J. (2008) Welfare Effects of Distortionary Company Car
Taxation. TI 2007-060/3, Tinbergen Institute Discussion Paper.for the potential higher purchase price of a car purchased five years later for
meeting the CO2/km standard in 2025 is assumed to range between approximately
0.7 to 1.9 years (see table 5), with significant fuel savings over the remaining
holding period. Assuming no shift in market shares, the average payback period for
the second hand car owner across all segments would be approximately 1.3 years.
This analysis shows that used car buyers see a net saving from the new standards
extremely quickly.
Table 5: Number of years required for the fuel savings to equal the increase in
retail price the second owner has to pay
Increase in retail price incl. VAT Payback period for second owner
born by second owner
B petrol € 648 1.3 years
C petrol € 576 0.7 years
D petrol € 480 0.7 years
B diesel € 648 1.5 years
C diesel € 600 1.1 years
D diesel € 1176 1.9 years
Average 1.3 years
Low-income households pay a disproportionally large portion of their income on fuel
and are therefore most vulnerable to fuel price spikes. We therefore consider
setting a standard for 2025 as an especially effective tool to combat vulnerability to
fuel price increases. The reason is that particularly those households with a very
low income who wish to own a car are often not in the new car market but they buy
very often used cars. Improving the fuel efficiency of cars is therefore likely to have
only a modest price impact on the second hand car vehicle. A big part of the
possible higher initial purchase price is anyway paid by the first car owner, while
the savings will be significant and the payback period will be relatively short.
5. Cost-benefit analysis for purchasers of ultra-low carbon
vehicles
As described above, we expect that in order to reach the indicative target of 70 g
CO2/km by 2025, the share of ultra-low carbon vehicles in 2025 will amount to
approximately 10%. For those 10% vehicles on the market the payback analysis of
the higher costs is much more difficult to perform as there is a considerable number
of variables involved in these calculations. Even though the key determinants are
the purchase price and fuel costs, other costs for maintenance, motor vehicle taxes,
insurance costs, and others need to be considered.
As many of these parameters are still relatively uncertain, it is difficult to provide
an accurate prediction of development. There are a couple of research studies who
have taken on this exercise, which will be shortly discussed below.
Due to the higher initial purchase price and the significant lower running cost of
vehicles of electric vehicle, any comparison with a conventional car requires a total
cost of ownership (TCO) perspective. All studies we looked at expect capital cost
differentials to substantially narrow by 2025, with the new technology becoming
cost-competitive if fuel savings are included. The reason for this is that ultra-low
carbon vehicles are expected to have much lower refuelling costs and a clear
benefit of savings in yearly running costs.A recent report by Pike Research (2012)44
Several selected studies show
compared the TCO of different powertrains
that a sustainable TCO
of small and mid-sized passenger cars and
benefit for ultra-low carbon
found that by 2025 compact BEV models
vehicles can be achieved in
could have lower TCOs for fleet operators
2025.
than the small gasoline models. In
addition, the PHEV could have lower TCO
There will be several “early
than the mid-sized gasoline sedan. Another
adopter segments” for ultra-
study by Cambridge Econometrics and
45 low carbon vehicles in the
Ricardo-AEA (2013) showed that the TCO
short run, including fleets,
is expected to converge within the next
car-sharing schemes and
decade for the different powertrain
technological interested
technologies. By 2025, for instance, BEV
individuals, to help to drive
and PHEVs could become more cost-
initial ramp-up scaling to
effective on a TCO basis than the average
make EVs more cost-efficient.
ICE or HEV. This is also confirmed by a
46
study by McKinsey (2010) which shows
With the accumulated market
that the TCO of the different powertrains
which will develop over the
(ICE, PHEV, EV, FCEV) is expected to
next 12 years, the capacity is
converge after 2025 (or even earlier in
provided to drive initial ramp-
case tax exemptions are in place of
up scaling so that ultra-low
government incentives are offered).
47 carbon vehicles become more
Finally, a study by Oliver Wyman (2010)
cost efficient also for the
also expects that the TCO of a battery
general consumer group.
electric vehicle will be lower by 2025 than
a car powered by an ICE. The reasons for a
convergence of TCO of the different powertrains include an improvement in battery
technology, learning curves, increased economies of scale and increase in fuel
prices.
To sum up, the selected studies suggest that a sustainable TCO benefit for ultra-low
carbon vehicles can be achieved in 2025. If the benefits of using cheaper electricity
as the automotive fuel are combined with lower anticipated maintenance costs, the
TCO equation could be favourable to ultra-low carbon vehicles over conventional
cars, particularly when taking into account that the cost of petrol and diesel fuels
will increase as expected, but many uncertainties remain.
There are likely to be several “early adopter segments” for ultra-low carbon
vehicles in the short run to help to drive initial ramp-up scaling to make EVs more
cost-efficient. Generally speaking, those segments who are most sensitive to total
cost of ownership considerations will be most likely to opt for the new technologies,
particularly when the economic rationale for those cars is solid. For instance,
governmental fleets48 and company fleets49 represent an attractive means of
44
Pike Research (2012): Total cost of ownership of alternative fuel vehicles for fleet operators – TCO
comparison of alternative fuel light-duty and medium-duty vehicles in fleet operations:
http://www.pikeresearch.com/research/total-cost-of-ownership-of-alternative-fuel-vehicles-for-fleet-
operators.
45
CE Cambridge Econometrics and Ricardo-AEA (2013): An economic assessment of low carbon
vehicles.
46
McKinsey (2010): A portfolio of power-trains for Europe: a fact-based analysis – the role of battery
electric vehicles, plug-in hybrids and fuel cell electric vehicles.
http://ec.europa.eu/research/fch/pdf/a_portfolio_of_power_trains_for_europe_a_fact_based__analysi
s.pdf.
47
Oliver Wyman (2010):
http://www.oliverwyman.com/media/OliverWyman_automotivemanager1_2010_E-Mobility.pdf
48
Governments can make use of their purchasing power to buy electric vehicles. For instance, “La
Poste”, the French postal service, currently owns the largest electric vehicle fleet in France. In
addition, the Greater London Authority aims to introduce 1,000 EVs to its fleet by 2015.
49
Leading firms with a large number of company cars have already started to include low-emission
vehicles in their fleet. Fleet customers represent a crucial opportunity to let the electric vehicle marketincreasing EV adoption. In addition, car sharing schemes, taxis50, car rental
companies51, wealthy and technologically interested individuals52 and households
who aim to purchase a second vehicle53 will be additional attractive markets for
ultra-low carbon vehicles. The growth of the market share of ultra-low carbon
vehicles in such kind of markets will provide the scale economies to make the new
technologies more cost-effective. In addition, public charging infrastructure will be
developed, which also will help to reduce the potential EV customers’ range anxiety
over time. With the accumulated market which will develop over the next 12 years,
the capacity is provided to drive initial ramp-up scaling so that ultra-low carbon
vehicles become more cost efficient also for the general consumer group.
6. The need to move towards a “footprint”-based standard
By making use of mass as the parameter for determining the limit values, less
incentive is provided to manufacturers to invest in light-weighting which is seen as
a very efficient technical option for reducing
CO2 emissions from passenger cars. Research We support implementing a
has also shown that reduced mass has the footprint-based system
biggest potential for fuel consumption which encourages
reductions.54 There are many technologies manufacturers to invest in
nowadays available55 that can reduce vehicle mass reductions.
mass without any compromise in vehicle size
or function56.
The recent report by the ICCT showed that by making use of footprint as the
parameter for determining the limit values, the necessary CO2 reductions can be
achieved in a more economical way. Therefore, costs passed on to car buyers are
lower than if mass is used as the parameter for determining the limit values. We
therefore suggest implementing a footprint-based system which encourages
manufacturers to invest in mass reductions.
grow. One reason for that is that business drivers tend to drive significantly more kilometres per year
so that vehicles with low running costs will help to limit the operating costs and reduce the payback
period. In addition, business tend to apply more rational decision making criteria by making use of
total lifecycle cost thinking when making purchasing decisions.
50
Europe-wide there are approximately 600.000 taxis in use. The average taxi vehicle drives many
more kilometres per year than the average private driver. This distance is often travelled in cities
where fuel efficiency of conventionally driven car is low due to the stop-and-go nature of city driving.
51
There are several companies, including Hertz Corp., which have publically stated that they intend to
include electric vehicles into its European fleet.
52
The consultancy BCG for instance sees a relatively strong uptake for electric vehicles from specific
consumer segments. Their study showed that there is evidence of a “green” consumer group
(approximately 9% in Europe) that shows a willingness to pay for an electric vehicle even if the total
cost of ownership is higher than for a conventionally driven car. CE Delft (2011) also expects that
there will be a small segment in the market of so-called “innovators” which will be interested in
switching to EVs even if the TCO will be not competitive with conventionally driven cars. The study
expects that this group will represent 5% of the car buyers in Europe.
53
Another market for electric vehicles would be consumers who purchase their electric vehicle as their
second car, in addition to purchasing a regular conventionally driven car. Many households in the
European Union own two cars or even more. In Germany for instance, more than 82.2% of all
households own at least one car. Of those households, who own a car, almost a third of all households
own two cars and almost 6% own three cars or more (see ADAC:
http://www.adac.de/_mmm/pdf/statistik_mobilitaet_in_deutschland_0111_46603.pdf.)
54
Assessment of technologies for improving light-duty vehicle fuel economy (2011, p. 116):
http://www.nap.edu/openbook.php?record_id=12924&page=116
55
Including component-level lightweight material substitution (high-strength steel, aluminium, and
composites) and using more comprehensive mass-optimized vehicle structural designs that integrate
parts and employ more advanced lightweight bonding and forming techniques.
56
German, J. and N. Lutsey (2010). "Size or Mass?: The Technical Rationale for Selecting Size as an
Attribute for Vehicle Efficiency Standards." International Council on Clean Transportation.You can also read