How do Peer-to-Peer Platforms Affect Durable Asset Prices? Theory and Evidence from a Natural Experiment - University Blog Service
←
→
Page content transcription
If your browser does not render page correctly, please read the page content below
How do Peer-to-Peer Platforms Affect Durable Asset Prices?
 Theory and Evidence from a Natural Experiment

 Andreas Kraft

 Raghunath Singh Rao

 Garrett Sonnier1

 (This Version: 03/22/2021)

1
 Kraft (Andreas.Kraft@McCombs.utexas.edu) is a PhD candidate, and Rao
(Raghunath.Rao@McCombs.utexas.edu) and Sonnier (Garrett.Sonnier@McCombs.utexas.edu) are Associate
Professors, all in the Department of Marketing at University of Texas at Austin. Authors are listed in alphabetical
order.
How do Peer-to-Peer Platforms Affect Durable Asset Prices?
 Theory and Evidence from a Natural Experiment

 Abstract
Peer-to-Peer (P2P) platforms enable the sharing of durable assets, especially in short-term
housing and transportation. Since owning an asset can bring owners potential income through the
utilization of slack capacity, P2P platforms may enhance overall asset value and increase prices.
However, another force works in the opposite direction. Platform services may obviate the need
to own the asset in the first place, depressing values. Due to these countervailing forces, when an
asset is both utilized and displaced by a platform, the effect on its price is ambiguous. The
empirical analysis is complicated due to the likelihood that platform entry is affected by
unobserved factors. We use the 2016 regulatory induced exit of Uber and Lyft from Austin, TX
as a natural experiment to study the impact of P2P platforms on vehicle prices. Utilizing data on
over 5 million transactions, we construct vehicle price series within hundreds of TX zip codes.
Classifying zip codes as treatment and control units, we estimate the change in the asset prices
estimating the causal impact of P2P platforms. Our estimates suggest that platforms decrease
new vehicle prices across sedans, utility vehicles, and pickups. Conversely, the price of used
sedans, highly utilized on the platform, experience a significant increase. Our estimates are
economically meaningful in size and are consistent with a theoretical model of a durable good
seller with an active decentralized used-good market and a P2P platform.

Keywords: P2P Platforms, Durable Goods, Pricing, Generalized Synthetic Control, Natural
Experiments, Sharing Economy

 2
INTRODUCTION

 Peer-to-peer (P2P) platforms utilize state-of-art web technologies and matching

algorithms to seamlessly connect parties on the opposite sides of two-sided markets. These

platforms also provide information about buyers and sellers to overcome transaction costs and

information asymmetries typically addressed by traditional intermediaries. P2P platforms form

the foundational basis of the so-called "sharing economy," including home-sharing platforms

such as Airbnb, ridesharing platforms such as Uber and Lyft, and freelance labor sharing

platforms like TaskRabbit. Sharing platforms facilitate transactions between owners of an asset,

such as a home, an automobile, or a tool, with users seeking to utilize the asset temporarily. The

benefits are straightforward. Owners receive the monetary benefit of utilizing slack capacity in

the services provided by the asset (i.e., lodging or transportation). Users receive the benefit of

services for a rental fee. In some cases (e.g., ridesharing vs. car ownership and labor sharing vs.

tools ownership), this obviates the capital expenditure required to purchase the asset. In others

(i.e., home-sharing vs. hotel rental or ridesharing vs. taxi services) it provides a similar or better

service at a lower or equal cost. Airbnb currently lists 5.6 million residences on its platform,

nearly a quarter of the number of available hotel rooms worldwide (Airbnb 2020). Between

2017 and 2019, Uber reported that the annual number of trips booked on the platform grew from

3.7 billion to 6.9 billion (Uber 2020).

 As P2P platforms enter and diffuse through markets, a natural line of inquiry considered

in the literature is these platforms’ effects on marketplace outcomes. The effects studied in the

literature include firm revenue or consumer welfare impact from platform entry (Zervas et al.

2017; Farranto and Fradkin 2018), the value or quality of legacy firms displaced by the platform

(Hu 2017; Ahmed et al. 2018), and transportation mode choices (Lee et al. 2019). In this paper,

 3
we consider P2P transportation service platforms' impact on the durable assets potentially

affected by the platform. Specifically, we consider how these platforms affect the prices of new

and used vehicles. We conjecture that a P2P transportation platform has two key countervailing

effects on prices for new and used passenger vehicles. The first and the most straightforward

effect is that the presence of the platform allows vehicle owners to utilize slack capacity to

generate revenues from providing transportation services. This income-generating effect renders

the asset more valuable and exerts upward pressure on vehicle prices. In contrast, precisely

because the platform facilitates the consumption of transportation services for a rental fee, it

obviates the need to own the asset. This outside option effect exerts downward pressure on

vehicle prices. Intuitively, these countervailing forces imbue the question of the ultimate effect

of P2P platforms on vehicle prices with ambiguity.

 Our intended contribution to the literature is twofold. First, from a theory perspective,

we develop a framework that lays out when and how P2P platforms affect the prices of new and

used vehicles. Our stylized infinite horizon model of demand and supply for new and used

vehicles formalizes the notion that the overall effect of the P2P platform on the price of

passenger vehicles ex-ante is ambiguous. Vehicle owners may utilize the platform to earn a

rental fee but face a cost to supply the platform. We allow the quality of the P2P supply to vary,

reflecting the notion that consumers might have heterogeneous preferences for the consumption

of the P2P goods. We derive the conditions under which the presence of a P2P platform

increases or decreases the equilibrium prices of both new and used goods. The overall effect

depends on the interplay of the rental rate, the cost to supply new and used cars, and the quality

of the P2P good.

 4
Our theoretical analysis shows that at the upper bounds of the supply costs for new and

used vehicles, the outside option effect is dominant as the income-generating effects for a fixed

rental rate are low. In this case, the prices for both new and used goods fall. All else constant,

the outside option effect becomes more dominant as the quality of the P2P good increases. For a

given rental rate and P2P quality, as supply costs for both new and used vehicles fall, our model

derives equilibrium price effects from the increasingly attractive income-generating effect and

the competitive interactions between new and used goods. We define the conditions under

which only the new prices rise, only the used prices rise, and when both the new and the used

prices rise. We also consider the effect of rental rates on new and used prices. Intuitively, low

rental rates increase the outside option attractiveness of the P2P good and decrease the income-

generating effect. This exerts downward pressure on prices. High rental rates imply the

opposite. For an intermediate range of rental rates, used prices increase while new prices

decline.

 The second element of our contribution is a large-scale empirical analysis of the causal

effect of P2P platforms on durable asset prices. In May 2016, due to a change in regulatory

policy, Uber and Lyft suspended services in the Austin, TX market indefinitely. This plausibly

exogenous shock constitutes a rare natural experiment to study the causal impact of P2P

transportation platforms on the supply and demand of new and used vehicles and the resulting

impact on equilibrium prices. Using data on all the vehicle transactions in Texas between

September 2014 and May 2017, we link the predictions from our theoretical model to a large-

scale empirical data set on new and used vehicle prices. To analyze the impact of rideshare

platform exit, we define a set of treatment and control zip codes and use the generalized

synthetic control method (GSCM) to estimate the effects. We separately examine the effect for

 5
sedans, utility vehicles, and pickup trucks. Sedans are the most highly utilized vehicle type on

the platform, while most pickup trucks are, almost by definition, not allowed on the platform as a

vehicle must have four doors to qualify for usage.

 Our empirical results are broadly consistent with our theoretical predictions. For sedans,

we find a positive impact on new prices and a negative impact on used prices. Our theory model

predicts this effect when the cost to supply new vehicles to the platform is higher than the cost to

supply used vehicles, which seems to be a reasonable assumption for new versus used sedans.

For utility vehicles and pickups, the costs to supply the platform are arguably high in general and

higher for new utility vehicles and pickups. Purchase prices and insurance costs are generally

higher for new as well as used utility vehicles and pickups. For pickups that do not have an

extended cab with four doors, the cost to supply the platform is infinite (these are not allowed on

Uber and Lyft). Our model predicts that platform exit would increase the price as the outside

option effect should be dominant in this case. We indeed find a positive and significant effect of

platform exit on the price of new utility and pickup trucks.2 We find no significant effect of

platform exit on the prices of used pickups and utility vehicles. Overall, our results are notable

since vehicle purchases are the second most economically significant purchase made by U.S.

consumers (second only to buying a house). As such, any change in the prices of vehicles arising

from the P2P markets has significant marketplace and welfare implications.

 The remainder of the paper proceeds as follows. First, we briefly review the burgeoning

literature on P2P platforms to highlight our contribution to the literature. We then present a

stylized theoretical model illuminating the effects of a P2P platform on durable asset prices.

2
 Survey research suggests the Austin TX ban resulted in many users switching to use of a personal vehicle and
nearly 10% of users stating the disruption resulted in the purchase of a vehicle (Hampshire et al. 2017).

 6
This is followed by a description of the institutional setting for our empirical analysis, including

our data and empirical strategy to identify the effect of the platform on existing assets. We

present the results of our empirical work and conclude the paper with a general discussion.

 RELATED WORK

 Several studies utilize survey approaches to assess demand-side impacts of carsharing

and ridesharing platforms. Martin et al. (2010) survey U.S. and Canadian users of carsharing

services and find that car sharing results in a substantial reduction in vehicle holdings. Cervero

et al. (2007) examine the San Francisco Bay Area car share program's long-run effects with a set

of five surveys conducted over 2001-2005. They find the fraction of zero car households

increases by 21% between the 9-month and 48-month anniversaries of the program. Similarly,

using survey data from the Federal Highway Administration, Lee et al. (2019) examine the

impact of Uber's entry on transportation mode choices showing that walkers, transit users, and

drivers all substitute some of their trips into Uber when available. Hampshire et al. (2017)

survey Austin rideshare users on their intended behaviors in the wake of the Uber/Lyft exit.

Most respondents intended to switch to personal vehicle usage, with 9% indicating intent to

purchase a vehicle. As a whole, these self-reported studies strongly suggest rideshare platforms

have the potential to create demand-side effects on the new and used vehicle markets. Our work

extends this stream of the literature by using quasi-experimental data to assess rideshare

platforms' impact on new and used vehicle prices.

 A second stream of the literature on P2P platforms studies the effects of platforms on

competition, incumbent products and services, related products and services, and even labor

markets. Einav et al. (2016) use a game-theoretic approach to analyze the effect of P2P

 7
competition on incumbent firms and show that price volatility declines as the P2P market is

scaling supply up or down to meet demand shocks. Ahmed et al. (2020) study how P2P

transportation networks impact the quality of taxi service in NYC. They find increased

competition from the platforms results in fewer complaints related to denial of service but more

complaints related to unsafe driving. Shin et al. (2020) show that the entry of rideshare

platforms results in a degradation of restaurant service quality due to wait staff substituting labor

services from restaurants, especially low-priced restaurants, to the P2P platforms. Also related to

labor market effects, Hall at al. (2020) show that Uber drivers initially earn more money per trip

after a fare increase. However, the fare increases also increase total supply and reduces demand

resulting in an hourly earnings rate roughly equal to that before the rise.

 A number of recent papers examine the effects of P2P housing networks on existing hotel

and housing markets. Zervas et al. (2017) analyze the effect of Airbnb entry on hotel revenue in

Texas, finding that Airbnb causes an 8-10% drop in hotel revenues, with lower-priced hotels and

hotels catering to leisure absorbing a disproportionate share of the decline. Similarly, Farranto

and Fradkin (2018) also find Airbnb decreased hotels' profitability by 3.7%. Barron et al.

(2021) study the effect of Airbnb on housing prices by collecting all the Airbnb listings in the

U.S. and find that that it had a median impact of $9 in monthly rent and $1800 in house prices.

Their analysis suggests that the reallocation of housing supply from long-term rentals into short-

term rentals was the primary driver of these effects instead of the total supply of housing.

 A unique aspect of our analysis compared with those of P2P housing networks is that we

study an incumbent durable asset both utilized and displaced by the platform. This differs from

existing empirical analyses of home-sharing platforms on hotels displaced by platform entry. In

this setting, the ex-ante effects of platform entry are straightforward to ascertain. Home-sharing

 8
platforms essentially lower the entry barriers for suppliers of niche inventory, increasing

competition. Theory predicts the increased competitive intensity will negatively affect

incumbent firms' performance and increase consumer welfare, which is confirmed by the

empirical literature (Zervas et al. 2017; Farranto and Fradkin, 2018). Similarly, the income-

generating effect of these platforms should positively affect the existing housing inventory, as

confirmed by Barron et al. (2021). The competitive effects of P2P rideshare platforms are far

more ambiguous, ex-ante. Jiang and Tian (2018) use an analytical model to show that, in the

absence of a secondary market, the effect of a P2P platform on the durable goods producer’s

profits is ambiguous and depends on the marginal cost. Similar to the effect of home share

platforms on hotels, rideshare platforms offer an outside option to consumers, reducing the

demand for new and used vehicles. However, the income-generating effect of home share

platforms accrues mostly to homeowners with slack capacity, not hotels.

 A STYLIZED THEORETICAL MODEL

 We build and analyze a simple stylized model where a unit mass of utility maximizing-

consumers demand at most one unit of a passenger vehicle every period. Consumers are

heterogeneous in their willingness to pay for the vehicle. For tractability, we assume a uniform

distribution over the valuation of quality over the set , and normalize 0 and, 1.

Consumers face uncertainty about their vehicle usage, which we model in a straightforward

manner. We assume that a consumer either uses the vehicle completely meaning that they have

no slack period that could allow usage on a P2P platform or the product usage is minimal,

meaning that it is available for use on the P2P platform exclusively. In terms of notation, we

denote the product usage by ∈ 0,1 and 1 represents the probability of usage,

which is common for all consumers. With probability 1 , the consumer does not use the

 9
product in the period ( 0 , and her ex-post willingness to pay is thus 0. With probability ,

the consumer uses the product ( 1 , and ex-post willingness to pay (WTP) is given by .3

 A profit-maximizing durable good monopoly producer sells a new vehicle at a price .

For simplicity, we normalize the production cost to be zero. The vehicle life is two periods, and

we denote the vehicle as “new” in the first period and "used" in the second period (Hendel and

Lizzeri 1999). Without loss of generality, we normalize the quality of a new vehicle to 1 and the

quality of a used vehicle to , and we assume that the vehicle deteriorates so that 1, and it is

useless is after the end of period 2. To facilitate matching vehicle owners to consumers without

a vehicle, we incorporate a P2P platform into the model. Specifically, the supply to the platform

comes from vehicle owners with 0 earning them a rental price . However, supply is

costly. We let and denote the cost of supplying a new or used vehicle, respectively.4 To

ensure supply of the P2P market, we assume and . Consumers that use the

product pay and consume the P2P product, which has a quality of . Finally, we assume

 1, capturing the fact that the P2P product's quality is generally lower than owning a vehicle

because of less flexibility, higher inconvenience costs, and lower horizontal fit with vehicle or

the driver5, and other factors.

 The timeline of this simple game proceeds as follows. First, consumers make a purchase

decision. Second, as outlined above, each consumer realizes her usage shock after her

3
 Needless to say, that this is an extreme simplification of the uncertainty facing the buyers of durable goods.
However, it allows us to model in a tractable way: (1) ex-ante uncertainty of usage and (2) a simple source of supply
of durable goods for P2P markets. Alternatively, can be viewed as the average usage intensity of consumers.
4
 This value captures elements common across vehicle vintage, such as opportunity cost of the time spent driving
and fees the platform charges. It also captures elements that can differ by vintage, such as higher insurance costs or
higher wear-and-tear which requires costly repairs.
5
 For example, a consumer who has a strong preference for German vehicles can purchase a vehicle that fits her
preference in the new or used goods market, but in the P2P market has no control over these elements of a vehicle.

 10
purchase. Finally, the P2P platform supplies the demand for the vehicles for the period from

owners. Vehicle owners either use the vehicle or supply it to the P2P market. The consumers

who do not own a vehicle consume either the P2P product or the outside option. In any period,

the consumers can either (i) purchase a new good, (ii) purchase a used good, or (iii) not purchase.

In the P2P market, each vehicle owner can (i) supply the product or (ii) not supply to the P2P

market. The non-owners can either (i) rent the product in the P2P market or (ii) use the outside

option (e.g., take a bus). We abstract away from other market frictions (like informational

asymmetries) and focus on a steady-state stationary equilibrium (Rao et al. 2009).

Benchmark: No P2P platform present: The (expected) discounted utility from purchasing the

new vehicle in any period given by:

 , (1)

and the (expected) discounted utility for a used vehicle purchase is given by:

 . (2)

Not owning a vehicle gives a zero utility6. The marginal consumer ( at the boundary between

owning a new and used vehicle is found by equating (1) and (2). This gives .

The marginal consumer ( at the boundary between the used good and the outside good is

found by setting (2) to zero: .

6
 Note that a new good vehicle buyer will never hold onto it in the next period because of our assumptions of no
market frictions, and stationary equilibrium.

 11
To derive equilibrium prices, we assume that the markets clear at the end of each period.

The new vehicle owners sell their used vehicles to used vehicle owners (and update back to new

vehicles via purchase). The used owners costlessly dispose of their worthless vehicles. Thus, the

segment of new and used vehicle owners are of the same size: 1 and solving this

allows us to get the equilibrium price for used vehicles . Plugging the used price value in the

firm's pricing problem gives: max 1 . (3)

The equilibrium (interior) solution is given by and , and the vehicle

owning segments are of the size 1 .

P2P platform present: The expected utilities from purchasing new, used, or no purchase are:

 1 , (4)

 1 , (5)

 , (6)

 0. (7)

Note that the utility for a vehicle owner has changed relative to benchmark because now when

she realizes a no-usage shock, she can potentially rent it out in the P2P market and realize a

rental price. Similarly, the non-owner can rent in the P2P market if she realizes a positive usage

shock for consumption.

 Equating and , we find the consumer indifferent between purchasing the new

and used product: . Equating and , the consumer who is

 12
indifferent between purchasing the used and P2P product is given by . Finally, equating and gives the consumer indifferent between the P2P option and the outside option: . For the rest of this analysis, we focus on equilibria in which there exists a non- empty set of P2P consumers. In a stationary equilibrium with market clearing, the stock of new and used goods needs to be equal. 1 Thus, the firm problem is given by: max 1 . . . (8) Next, we characterize the solution of prices. The solution is given by ∗ p 1 1 , and ∗ . Note that the optimal prices now depend upon both the rental rate p as well as the quality of the P2P offering ( ). We can estimate the price differences relative to the benchmark: Δ ∗ p 1 1 , (9) Δ ∗ . (10) 13
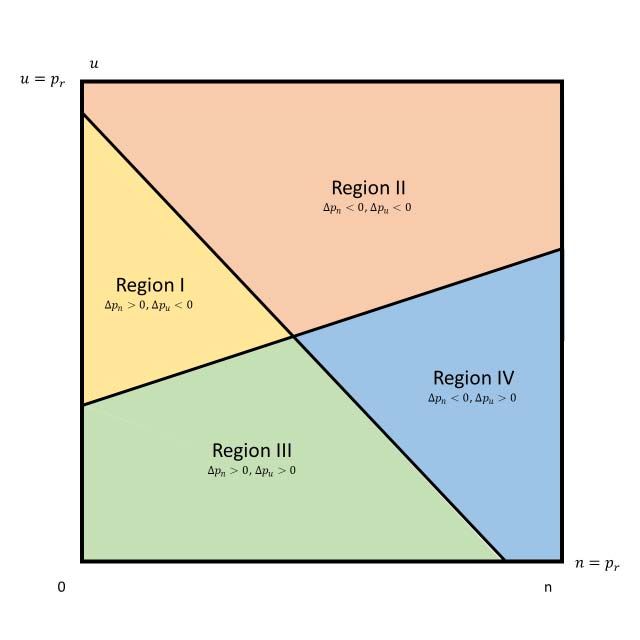
Equations (9) and (10) provide the algebraic expressions that use the primitives of the model to

reveal the pricing impact of a P2P platform. We present the technical conclusions derived from

these expressions as a series of observations in the appendix. Below, we offer the essence of the

main conclusions relevant to our ensuing empirical work.

 Our stylized model formalizes that the overall effect of the P2P platform on the price of

passenger vehicles ex-ante is ambiguous. As described earlier, the net effect on price emanates

from two opposing effects: The income-generating effect and the outside option effect. These

effects can be visualized using Figures 1 and 2, created from the model (please see the technical

appendix for the algebra). We construct Figures 1 and 2 where all the parameters are the same

except for the quality of the P2P good (w). Specifically, for constructing Figure 1 and Figure 2,

we use w=3/20 and w=3/16, respectively. Consequently, relative to Figure 1, Figure 2 has a

larger outside option effect (P2P is a closer substitute of the existing vehicles). As such, we

expect an outcome where the vehicle prices should decrease overall. Indeed, Region (ii), wherein

both the new and used vehicle prices go down, expands in Figure 2 while the share of the other

three regions (i, iii, and iv), where one or more asset price increases, shrinks. Note that this effect

arises while keeping the income effect constant as is the same across the two figures.

 ---INSERT FIGURES 1-2 ABOUT HERE---

 To visualize the income-generating effect, consider a point close to origin in both Figures

1 and 2. At this point, the costs of supplying both the new and used vehicles are low (i.e., and

 are close to zero). Holding constant the rental rate, , there is a greater incentive to supply to

the P2P market since the relative income-generating effects and are high. This

should result in higher prices. Indeed, in both Figures 1 and 2, the points close to origin fall in

Region (iii), where new and used prices go up. At the other extreme, on the northeast corners of

 14
the figures (where the income-generating effect is low), there is a smaller payoff to supplying to

the P2P platform. As such, both the new and used vehicle prices fall. In contrast, when the costs

of providing used vehicles are low while supplying new vehicles are high, the used prices rise

while the new prices fall (as seen in Region (iv)). The converse holds true in Region (i).

 Our analysis thus far formalizes the notion that the presence of a P2P platform exerts two

countervailing effects on prices. The first effect enhances the income-generating aspect of the

asset and puts upward pressure on prices. The second effect enhances the outside option's value

and puts downward pressure on prices. While the two extreme cases delineated above in Figures

1 and 2 might apply for some categories7, we present the formal conditions that specify the

prevalence of one effect over the other in the technical appendix. In particular, observation 4

shows that the prevalence of income-generating effect over the outside-option effect, and vice-

versa, depends upon the interplay of the cost of supplying the products to the P2P platform and

the P2P rental rate. We find that at the upper bound of the cost of providing the product, the P2P

market affects pricing by offering an improved outside option. As the new good supply cost

decreases, a new vehicle provider can generate a higher income level from providing the good in

the P2P market; the vehicle seller captures some of this surplus by increasing prices.

 Similarly, as the used good supply cost decreases, used vehicles allow owners to

generate a higher income level from the P2P market, and prices rise. New vehicle prices

incorporate the effect of through the resale price, which directly increases the new good's value

and increases the price. Finally, the used vehicle's price decreases as the cost of providing the

7
 For example, pickup trucks have low fuel economy which, in the context of the model would be high
values of and , leading to a negative effect of the P2P market on prices.

 15
new vehicle to the platform decreases, which follows from that, in equilibrium, the stock of used

goods and new goods are equal. Thus, because a decrease in makes the new good more

attractive relative to the used good, the resale market price needs to decrease, or else there would

be an excess supply of new goods.

 Within our context, it is reasonable to assume that because the used vehicle owner

typically has lower opportunity costs (vis-à-vis a new buyer) and is likely to spend less on

insurance and interest charges. Observation 1 in the appendix shows that the rental rate threshold

above which a vehicle price goes up is higher for new vehicles than for used vehicles8. Also,

quite intuitively, when the rental rates are low, both the new and the used prices are likely to

decrease because of the presence of a P2P platform - a direct consequence of the low income-

generating effect. Simultaneously, the P2P good is more attractive to consumers due to the low

rental rates (hence consumers are less likely to buy vehicles). Both these forces put downward

pressure on vehicle prices. The opposite holds for the higher rental prices. For the intermediate

range of rental prices, the prices of used vehicles go up while new vehicles' prices decrease. We

now turn our attention towards an empirical analysis of the effect of P2P platforms on new and

used vehicle prices.

 EMPIRICAL CONTEXT
 Uber and Lyft, the two major U.S. P2P transportation platforms, presently treat drivers as

independent contractors. Classifying drivers as employees would require tax withholding,

healthcare, retirement, workers' compensation, and unemployment insurance obligations. In

8
 An indirect corollary of this observation is that a new vehicle is less likely to be supplied in the P2P market, and in
aggregate, we should see fewer newer vehicles on platforms like Uber and Lyft- consistent with empirical
observations.

 16
Fall2019, California passed a landmark law, Assembly Bill 5, requiring businesses to hire

workers as employees rather than independent contractors. In response, Uber and Lyft

threatened to shut down their services in California. In Fall 2020, a ballot initiative (Proposition

22) ultimately granted app-based transportation companies an exception from the law. Preceding

California's legal arguments, the city of Austin, Texas, introduced a set of regulations requiring

fingerprinting of Uber and Lyft drivers for public safety reasons. In May 2016, Austin citizens

voted to require fingerprint-based background checks. On May 10, 2016, Uber and Lyft simply

turned their respective apps off and exited the Austin market rather than comply with the new

regulations.

 Both drivers and passengers responded to the exit. Utilizing Facebook, some drivers

created an ad hoc ride-hailing system. More legitimate, albeit smaller players, including Fasten

and RideAustin, entered the market (Hampshire et al., 2017). Survey evidence suggests about

half of the Austin residents previously using Uber and Lyft responded to the exit by switching to

a personal vehicle (45%) or one of the new rideshare app entrants (41%). Few respondents

reported switching to public transit. Almost 9% of survey respondents indicated they had bought

a vehicle or were considering buying a vehicle to account for the disruption in ridesharing

services. In May of 2017, the state of Texas signed a new state ride-hailing law establishing

licensing at the state level, including background checks that did not require fingerprinting. On

May 29, 2017, Uber and Lyft resumed operations in the Austin market.

 The period during which ridesharing companies left the city of Austin provides a natural

experiment to study their impact the passenger vehicles. Note that our stylized theoretical model,

by construction, analyzes the effect of the presence of a P2P firm upon passenger vehicle prices.

In our empirical setting, the P2P firms exit a large market; the price effects of this exit should be

 17
the opposite of those of the model. It is also worth noting that our analytical model is highly

stylized. The real-world counterpart of this set-up has many important features for asset prices,

including the long-lives of passenger vehicles and vehicle eligibility requirements of the

platforms, among others. We will refer to these features as we relate our empirical results to the

model.

 DATA AND EMPIRICAL STRATEGY
Data
 To assess the impact of Uber and Lyft's exit on the Austin, TX market for new and used

vehicles, we assemble a unique data set on new and used vehicle transaction prices in Austin and

other Texas cities from the Texas Department of Motor Vehicles. Our observation window

begins on September 1, 2014, and concludes when Uber and Lyft re-entered the Austin market

on May 29, 2017. We restrict our attention to the top 25 cities in the state of Texas for the

number of vehicle transactions. We then compute the average transaction price for new and used

vehicles at the zip code level over four-week intervals starting September 1, 2014. We exclude

any zip code with no transactions in one or more four-week windows from the analysis. This

procedure results in a total of approximately 400 zip codes observed over 36 four-week

windows. Overall, we observe about 10.6 million transactions, of which about 5.14 million

occurred within the 25 largest cities and nearly 370,000 occurred in the city of Austin.

 Approximately 40 of the zip codes are in Austin, which experienced the Uber and Lyft

exit. We assign these zip codes within the city of Austin to the treatment condition. The

approximately 360 zip codes outside of Austin correspond to potential control cities that did not

ban the platforms. Figure 3a shows the location of the treatment and control zip codes within the

Texas map, while Figure 3b shows the number of transactions within each Texas zip code.

 18
Cursory visual inspection of these two figures together confirms that the bulk of transactions

within the study period occurred within the control and zip codes used in our study.

 ---INSERT FIGURE 3 ABOUT HERE---

 Of the 36 four-week periods, we observe 21 periods prior to the treatment and 15 periods

after the treatment. To conduct our empirical analysis, we separate sedans and hatchbacks,

utility vehicles and minivans, and pickup trucks and full-size vans into distinct categories for

analysis. For ease of exposition, we refer to these as sedan, utility, and pickup segments,

respectively. Table 1 contains a list of the 25 highest selling makes and models in each category

across all transaction types (i.e., new and used) and the total sales by segment. The sedan

segment constitutes the most popular category in total transactions, followed by the utility and

pickup segments. The pickup segment is much more concentrated, with the top three

make/models accounting for 52% of the transactions compared with 18% for the sedan and 11%

for the utility vehicles.

 ---INSERT TABLE 1 ABOUT HERE---

Empirical Strategy
 Random assignment of the exit treatment across cities would greatly facilitate identifying

the effect of the Uber and Lyft exit on the transaction prices of new and used vehicles. However,

in this and many other marketing contexts, such random assignment is unlikely or infeasible.

For quasi-experimental data, the difference-in-differences (DID) method is a commonly

deployed empirical approach in marketing and the applied social sciences in general (Card and

Krueger 1994; Bell, Galliano, and Mareno, 2018). The identifying assumption for the DID

estimator is the notion of "parallel trends," which posits that absent the treatment, the average

outcomes of treated and control units would have followed parallel paths. Researchers typically

rely on evaluating the trend in average outcomes of the treated and control units in the

 19
pretreatment periods to assess the parallel trends assumption. Figure 4 depicts the trend line of

average new and used transaction prices for the different vehicle types in Austin, TX and three

potential control cities (Houston, Dallas, and San Antonio). We see some trends common across

all four cities (e.g., the prices of new pickup trucks increase significantly over time) and city-

specific differences over time. For example, among the four cities, new pickup trucks are both

the most and least expensive in Austin at different points in the pretreatment period.

 ---INSERT FIGURE 4 ABOUT HERE---

 Due to unobserved time-varying effects, the parallel trends assumption is unlikely to hold

in many empirical applications. In recognition of this, researchers have developed a set of

alternative approaches to address the estimation of causal effects from quasi-experimental data.

Among the most widespread of these techniques is the Synthetic Control Method (SCM) (Abadie

and Gardeazabal 2003). The synthetic control method (SCM) matches pretreatment outcomes

and, when available, covariates between a treated unit and a weighted average of control units.

The resulting synthetic control unit serves as the counterfactual for the treated unit, with the

estimated weights on the control unit driven by minimizing a loss function (Abadie et al. 2010).

This matching presumably helps balance the influence of time-varying confounds between the

treatment and control units. One issue is how the method deals with the dimensionality of the

number of control units relative to the number of pretreatment periods, the former of which is

often large relative to the latter. SCM imposes the constraint that the weights are non-negative

and sum to one. Furthermore, it applies to only one treated unit and does not provide readily

interpretable estimates of the uncertainty in the treatment effect.

 A second approach to dealing with unobserved time-varying heterogeneity is to model

the effects explicitly. Adding unit-specific linear or nonlinear time trends to the models may

 20
explicitly capture time-varying effects. However, this consumes a large number of degrees of freedom and may not solve the problem if the effects are not in the distributional form of the specified trends. An alternative is to model the unobserved time-varying effects semi- parametrically with an integrated fixed effects model (Bai 2009). Xu (2017) unifies the IFE and SCM approaches into a generalized synthetic control (GSC) method. The latent factor approach of the GSC method addresses causal inference in quasi-experimental data with multiple treated units and provides readily interpretable estimates of uncertainty in treatment effects. The number of factors of the IFE model is selected via an automated cross-validation scheme that makes the method easy to implement. The GSC approach has recently been used in marketing to assess the impact of newspaper paywalls (Pattabhiramaih et al., 2019) and disclosure of industry payment disclosures on physician prescription behavior (Guo et al., 2020). As our data are repeated cross-sections of zip codes observed over time with multiple treated units, the GSC method is well suited to our problem. To set the notation for our empirical strategy, denote zip codes by z 1,..., Z . The total number of zip codes is Z Ztr Zco where Z tr and Z co are the numbers of treated and control zip codes, respectively. All units are observed for time periods t 1,..., T . For zip codes in the treated city of Austin, we let T0,z denote the number of pretreatment periods. Austin zip codes are all first exposed to the exit treatment at the time T0 z 1 and subsequently observed for T T0 z periods. We represent Pzt as the average transaction price for the zip code z at the time t . Following the GSC method, we assume Pzt is given by a latent factor model as follows Pzt zt Dzt xzt z ft zt . (11) 21
The variable Dzt is the treatment indicator, which equals 1 for all treated zip codes following the exit. The parameter z is the treatment effect on average transaction price in the zip code z that experiences the treatment. The vector xzt is a k vector of observed covariates that may differ for new and used vehicles. The vector is a k vector of unknown parameters. The vector ft [ f1t ,..., f rt ] is an r vector of unobserved common factors, while the vector z [z1 ,..., zr ] is an r vector of unknown factor loadings. The factor model approach covers a wide range of unobserved heterogeneities and contains two-way fixed effects for cross-sectional and time-varying heterogeneity as special cases. The factor model approach also incorporates unit-specific linear or quadratic time trends or auto-regressive components as special cases. So long as an unobserved random component can be decomposed into the multiplicative form, it can be absorbed by z f t (Xu 2017). We want to estimate the average treatment effect on the treated units (ATT) at the time t when t T0 . The ATT at the time t when t T0 is given by the following , ∑ ∈ℤ ∑ ∈ℤ 1 0 , (12) Where, ℤ is the set of zip codes in the treatment condition (i.e., zip codes in Austin). Since Pzt Dzt 1 is observed for treated zip codes in the post-treatment periods following the exit, our estimation problem is to construct the counterfactual for each treated unit after the Uber and Lyft exit. Let the control zip codes be subscripted from 1 to Z co . Switching to matrix notation, we can re-write equation for the control units only as , (13) 22
where Pco and co are T Zco matrices, X co is a T Zco k matrix of covariates, F f1 , f 2 ,..., fT is a T r matrix of factor scores and co 1 , 2 ,..., Z co is a Z co r matrix of factor loadings. Following Xu (2017), we estimate ˆzt Pzt ( Dzt 1) Pˆzt ( Dzt 0) via a three-step imputation process for Pˆzt ( Dzt 0) . First, using equation (13) estimate a latent factor model with only the control observations to obtain ˆ , Fˆ , ˆ . Second, use ˆ , Fˆ 0 to estimate the factor co loadings ˆz for each treated zip code in the pretreatment period (where the superscript 0 denotes the pretreatment period). Lastly, compute the treated counterfactual as follows 0 ′ ′ ∀ ∈ ℤ, . The estimator for ATTt is therefore , ∑ ∈ℤ 1 0 . (14) In our empirical setting, we impose zip code level fixed effects and accommodate time- varying heterogeneity via the factor structure. We use the leave-one-out-cross-validation procedure (Xu 2017) to choose the number of factors automatically. The procedure iteratively repeats the second step from above using the pretreatment data for the treated units. On each iteration, it holds out one period's data for all the treated units. It then estimates the loadings, predicts the holdout sample outcomes, and computes the holdout prediction error for each treated unit for over each iteration. Repeat the procedure for a given set of possible values for r and choose r * that minimizes the mean square prediction error (MSPE). RESULTS We analyze the three categories of sedans, utility vehicles, and pickup trucks separately as these vehicles differ along many dimensions. Sedans are the most widely used vehicle type 23
on rideshare platforms, while utility vehicles and pickup trucks, especially, are the least used.

We argue that within each class, it is reasonable to conjecture that the cost to supply new versus

used vehicles is higher across all three categories. In this case, the theoretical model predicts that

introducing a P2P platform will decrease new vehicle prices (i.e., Reg. II and Reg. IV in Figure

2). Hence, we expect platform exit to result in higher prices for new vehicles. Along the same

line of reasoning, we would expect used vehicle prices among all vehicle types to likely increase

(i.e., Reg. III or Reg. IV in Figure 2) due to the introduction of a P2P platform and hence

decrease due to exit. For used vehicles, some evidence suggests that used sedans have the lowest

cost of providing services on rideshare platforms (Campbell 2017). As is often the case, our

empirical setting is more nuanced than the simple analytical model. For example, as utility

vehicles and pickups have lower utilization rates on the platform, it seems that the income-

generating effects of the platform are not as strong (or perhaps nonexistent) for these vehicles as

for sedans. Nonetheless, the outside option effects seem viable for all three categories. We next

present the results for new and used vehicles. Subsequently, we present evidence of

geographical heterogeneity of the effects, and conclude by linking the empirical results back to

the theoretical model.

 New Vehicle Prices

 We begin by showing the results of our GSC estimates of the effect of the Uber-Lyft exit

on new vehicle prices in the three segments. Figures 5a-5c show the observed average new

vehicle prices for the treated zip codes across all periods, as well as estimated average prices for

the counterfactual constructed via the GSC approach. For each segment, the observed and

estimated average new price track closely in the pretreatment periods prior to the exit of Uber

 24
and Lyft from the Austin market. After the exit, we see what appears to be a rise in the price of

new sedans, utility vehicles, and pickups.

 ---INSERT FIGURE 5 ABOUT HERE---

 The survey of Austin Uber and Lyft users regarding their post-exit behaviors suggests

approximately 10% of respondents stated a behavioral response of new vehicle purchase due to

the ban. Assuming new vehicle buyers are less likely to use their new vehicles to generate

revenue on ridesharing platforms, we would expect a positive demand shock that causes an

increase in price to overwhelm any negative shock to price from the nullified revenue-generating

effect due to exit. Table 2 reports , averaged over the treatment periods, along with the

effect of trade-in allowance and displacement (which is a proxy for size, power, and fuel

efficiency) on the price of a new vehicle. We see that the platform exit had a positive and

significant impact on the price of new sedans, utility vehicles, and pickups. We note that this

result translates into our key research question on rideshare platforms’ effect. Specifically, the

presence of P2P platforms overall negatively affects new passenger vehicle prices. Evaluated at

the mean sales price in Austin, this represents a 4.1% drop in the price for new sedans, 2.4%

drop in the price of utility vehicles, and 1.4% drop in the price of pick trucks9. With respect to

new vehicles, our results suggest the dominance of the outside option effect.

Results: Used Vehicle Prices

 Figures 5d-5f show the observed average used vehicle prices for the treated zip codes

across all periods, as well as estimated average prices for the counterfactual constructed via the

GSC approach. For each segment, the observed and estimated average used price track very

9
 It is reasonable to assume that consumers assigned non-zero probabilities to their belief about Uber and Lyft re-
entering the Austin market in the future. If this is the case, consumers may have a purchase in anticipation of future
entry. This reduces our effects to intention to treat effects, indicating that the full effects of the P2P platform are
perhaps even larger.

 25
closely in the pretreatment periods prior to the exit of Uber and Lyft from the Austin market.

After the exit, we see no discernable change in the prices of used utility vehicles and pickups

while we see what appears to be a fall in the price of used sedans. Table 3 reports

 , averaged over the treatment periods, along with the effect of trade-in allowance,

displacement, and mileage on the average price of used vehicles. We see that the exit had a

negative impact on used sedan prices. These vehicles are the most highly utilized on the Uber

and Lyft platforms. Consistent with the theory model, we hypothesize that this decrease is the

result of the income effect dominating within the used sedan category. This is consistent with the

assumption that sedans have the lowest cost for product owners to supply the product to the P2P

platform among the three vehicle types. This loss of the revenue-generating function caused by

platform exit causes a drop in used sedan equilibrium prices. Thus, P2P platforms have a positive

and significant effect on used sedan prices. Evaluated at the mean sales price in Austin, this

implies a 3.0% increase in prices due to the presence of a ridesharing platform. As seen in Table

3, the exit had no discernable effect on used prices for the utility or pickup segments.

 ---INSERT TABLE 3 ABOUT HERE---

 While the overall results in Tables 2 and 3 and Figure 5 provide the average effects, they

mask considerable heterogeneity in the effect of platform exit within the treated zip codes. As

noted earlier, GSC allows for unit-level (zip code in our case) level factor loadings and, thus, the

zip code specific treatment effects. To visualize the heterogeneity in effects, we present these

individual ATTs laid over a zip code level map of Austin in Figure 6. The results show that

ATTs are almost universally positive for new sedans and new utility vehicles (labeled as MPV).

Simultaneously, they are majority positive but do contain some negative effects within the truck

segment. This means that P2P platform has a consistent negative effect upon new sedans and

 26
utility vehicles with a somewhat less consistent effect for trucks across the treated zip codes.

Turning to the used vehicles, new sedan ATTs are largely negative across the zip codes

translating into a positive and significant effect attributable to P2P platforms. The used utility

vehicle ATTs consist of an almost equal mix of null, positive, and negative effects, resulting in

overall non-significant ATTs for these vehicle categories.

 Overall, our empirical findings suggest the effect of rideshare platform exit on used

passenger sedan prices is negative, while the exit results in a positive increase in new prices for

all the vehicle types. The prices of used light-duty pickup trucks and utility vehicles on average

were largely unaffected. Turning back to our theory model, it seems that Sedans most likely fall

into Region IV of Figure 1 (high cost of new supply and lower costs for used supply). In

contrast, utility and pickup segments likely fall into the area near the boundary of Regions II and

IV where the new vehicle supply costs are high and used cost supply are moderate10. This seems

entirely consistent with the fuel and other costs of this class of vehicles. It appears that when a

ridesharing platform enters a market, it substitutes for new utility vehicles and trucks but keeps

used versions of these vehicles unaffected.

 CONCLUDING REMARKS

 With the ease of use, the potential to lower expenditures to obtain services, and the

opportunity to earn money flexibly from extant assets, the sharing economy has captured

consumer attention and experienced a rapid rise. P2P platforms that match buyers and sellers on

the opposite side of the market have played a significant role in the growth of this sector.

Additionally, a platform like Uber allows a consumer not only to hail a ride with the tap of a

smartphone button but also to become a paid driver with little hassle. While providing such

10
 Note that on the precise boundary of Regions II and IV, we have the knife-edge case of null effect on used prices.

 27
apparent benefits, the rise of these platforms has raised a host of questions about the future of

employment relationships, wages, impact upon the legacy firms, and the overall impact on

consumer welfare. In this paper, we estimate the impact of ridesharing platforms on the prices of

new and used passenger vehicles. Rideshare platforms allow vehicle owners to monetize slack

capacity but also obviate the need to own a vehicle in the first place. These countervailing forces

hold the potential to exert upward and downward pressure on asset prices. These opposing

forces result in ambiguous ex ante predictions of the price effect of P2P platforms.

 Using a stylized theory model, we show that the overall effect on prices depends on the

interplay of the rental rate, the cost to supply new and used cars, and the quality of the P2P good.

We derive empirical estimates of platform effects from an analysis of a natural experiment in the

city of Austin, TX. Due to rising political tensions over how the platforms screen drivers, Uber

and Lyft abruptly suspended services in Austin for approximately 12 months between May 2016-

2017. Using a generalized synthetic control approach, we leverage this plausibly exogenous

shock to estimate the causal impact of platform exit on the price of new and used vehicles. An

obvious limitation to our empirical analysis is the temporary nature of the exit. Market

participants perhaps had an expectation about the re-entry of the platforms. As such, the

resulting estimates may not be correctly quantified. We accept this limitation and consider our

estimates to be a lower bound on the effects of Uber and Lyft within our setting. Another

limitation comes from the fact that we cannot eliminate the possibility that our study design also

captures other non-rideshare related shocks that affected vehicle prices in Austin during the

sample period. However, we are not aware of any particular shocks during this time period.

 Our novel contribution comes from studying the impact of P2P platforms on the prices of

a durable good simultaneously displaced and utilized by the P2P economy. The displacement

 28
gives rise to the outside option effect represented by rideshare platforms that obviate the need to

own a vehicle. At the same time, utilization gives rise to the income-generating effect of

rideshare platforms that allow asset owners to monetize slack capacity. The net effect on durable

asset prices depends on which of these effects are dominant. Our theoretical model formalizes

the notion that price effects are ex-ante ambiguous and defines the conditions under which we

predict the prices of new and used vehicles to rise or fall together or move in opposite directions.

Our empirical results show that for new vehicles, the outside option effect dominates with

platform exit causing an increase in new vehicle prices across new vehicle types, even utility

vehicles, and pickups. Conversely, the income-generating effect is the dominant effect on used

sedan prices, the predominant vehicle type utilized by the platforms. We find no effect of

platform exit on the prices of used utility vehicles or pickups.

 Our results speak to the ongoing public policy debate on the impact of the entry of P2P

platforms. Previous empirical research has looked at welfare gains and losses of different players

affected by P2P platforms. Cohen et al. (2016) use discrete in Uber's "surge pricing" to identify

price elasticities along several points of the demand curve. They estimate large welfare gains to

consumers with a surplus of approximately $7.0 billion in the United States. These estimates

arise from all UberX trips during 2015 and are attributed to lower prices relative to the

willingness to pay. Hall and Krueger (2018) examine the opposite side of the platform, the labor

supply. They find that overall, Uber drivers make more money per hour than taxi drivers.

However, they are also the primary bearer of the costs associated with driving. Chen et al. (2019)

use data from millions of Uber trips to estimate the surplus attributable to the flexibility of Uber's

work arrangements and find that the average surplus generated due to this flexibility is as large

as 40% of total pay. Finally, most pertinent to our paper, some recent work has examined the

 29
effects of P2P entry on legacy firm revenues in conjunction with surplus generated for

consumers (Zervas et al., 2017; Farranto and Fradkin, 2018). The joint consideration of these

multiple effects- consumer surplus, labor surplus, the impact upon existing legacy players, and

the value of assets that supply these markets- provides a more nuanced picture of equilibrium

effects of P2P platforms providing helpful policy prescriptions.

 30
Table 1. List of Top 25 Make/Model by Transaction Count by Segment
 Sedans and Hatchbacks Utility Vehicles and Minivans Pickup Trucks and Vans
 Toyota Camry 133,496 Chevrolet Tahoe 62,477 Ford F150 223,036
 Honda Accord 121,163 Ford Explorer 62,143 Chevrolet Silverado 180,491
 Nissan Altima 111,454 Honda CR-V 57,779 Ram 1500 121,608
 Toyota Corolla 104,516 Jeep Wrangler 51,379 GMC Sierra 71,323
 Honda Civic 87,483 Jeep Grand Cherokee 48,008 Ford F250 56,927
 Nissan Sentra 64,420 Toyota RAV4 47,198 Toyota Tundra 55,993
 Ford Focus 52,191 Nissan Rogue 45,983 Toyota Tacoma 45,642
Chevrolet Malibu 51,163 Ford Escape 44,959 Ford Ranger 26,501
Chevrolet Impala 44,509 Ford Expedition 37,327 Chevrolet GMT-400 24,854
 Ford Fusion 44,249 Toyota 4-Runner 36,509 Nissan Frontier 24,666
 Hyundai Elantra 41,214 Chevrolet Suburban 36,506 Ford F350 19,958
 VW Jetta 40,612 Honda Odyssey 34,807 Chevrolet Colorado 13,476
 Hyundai Sonata 37,842 Chevrolet Equinox 32,565 Ram 2500 12,314
 Dodge Charger 37,247 Lexus RX 31,916 Nissan Titan 12,124
 Chevrolet Cruze 31,918 Toyota Highlander 29,955 Chevrolet Express 12,110
 Nissan Maxima 31,538 Honda Pilot 28,016 Chevrolet S-10 10,366
 Mazda 3 31,513 GMC Yukon 25,418 Dodge Dakota 9,066
 Nissan Versa 27,597 Nissan Pathfinder 25,358 Ford E250 6,121
 Kia Optima 25,826 Toyota Sienna 24,974 Ram 3500 6,088
 Lexus ES 25,050 Jeep Cherokee 24,909 Nissan Pickup 5,022
 Ford Taurus 24,992 Kia Soul 24,626 Chevrolet Canyon 4,598
Mercedes C-Class 24,930 Nissan Murano 22,761 Ford Transit Connect 4,393
 Chrysler 200 22,664 Dodge Durango 22,094 Dodge B-Series 4,040
 Chrysler 300 22,291 Dodge Journey 20,814 Ford Transit 3,666
 VW Passat 21,305 Ford Edge 20,331 Ford E150 3,638
 Total 1,989,168 Total 1,685,880 Total 1,001,548

 31
Table 2. Effect of Rideshare Ban on New Vehicle Prices
 Sedan Utility Pickup
 Rideshare Ban 1,040.40*** 862.49*** 524.48 **
 (300.39) (358.91) (284.67)
 Trade in Allowance 0.304 *** 0.253 *** 0.223 ***
 (0.016) (0.008) (0.007)
 Displacement 7,496.86 *** 8,476.58 *** 3,748.41 ***
 (154.50) (174.83) (69.06)
 Zip Code Fixed Effects yes yes Yes

 Unobserved Factors 3 1 1

 Treated Zip Codes 39 41 35

 Control Zip Codes 362 361 337

 Observations 14,436 14,472 13,392
 NOTE: Displacement in liters,
 *denotes p
Figure 1: Price Changes for New and Used Assets Arising from Platform Entry

 (δ → 15/16, λ → 55/256, w → 3/20, v → 9/10, p → 1/20)

 33
Figure 2: Price Changes for New and Used Assets Arising from Platform Entry

 (δ → 15/16, λ → 55/256, w → 3/16, v → 9/10, p → 1/20)

 34
Figure 3a: Control and Treatment Zip Codes for Empirical Analysis

Figure 3b: The Number of Transactions across all the Zip Codes in Texas

 35
Figure 4: Raw Average Prices for New and Used Vehicles in 4 Major Texas Cities

 Note: The darker area denotes the period in which Uber and Lyft were not active in Austin.

 36
You can also read