2021

    First Quarter
    Management
Discussion & Analysis
←
→
Page content transcription
If your browser does not render page correctly, please read the page content below
2021
First Quarter
Management
Discussion & Analysis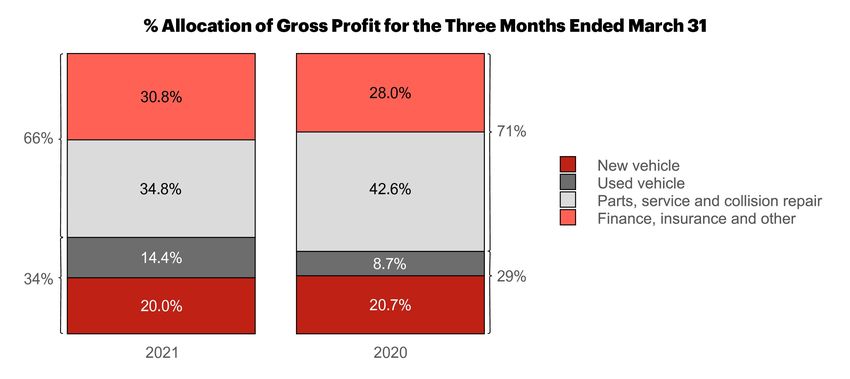
MANAGEMENT’S DISCUSSION AND ANALYSIS
OF FINANCIAL CONDITION AND RESULTS OF
OPERATIONS
For the three-month period ended March 31, 2021
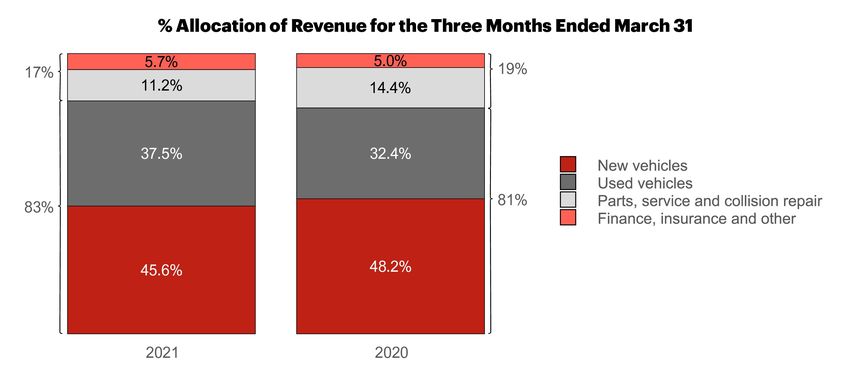
Table of Contents

MANAGEMENT'S DISCUSSION AND ANALYSIS

 1.    Reader Advisories                                                     3

 2.    Executive Summary                                                    4

 3.    Market and Outlook                                                   13

 4.    Results of Operations                                                15

 5.    Acquisitions, Divestitures, Relocations and Real Estate              25

 6.    Liquidity and Capital Resources                                      26

 7.    Related Party Transactions                                           32

 8.    Outstanding Shares                                                   32

 9.    Dividends                                                            32

 10.   Free Cash Flow                                                       33

 11.   Critical Accounting Estimates and Accounting Policy Developments     33

 12.   Disclosure Controls and Internal Controls Over Financial Reporting   34

 13.   Risk Factors                                                         34

 14.   Forward-Looking Statements                                           34

 15.   Non-GAAP Measures                                                    35

 16.   Non-GAAP Measure Reconciliations                                     36

 17.   Selected Quarterly Financial Information                             38

 18.   Segmented Operating Results Data                                     40

 19.   Same Stores Results Data                                             42

 20.   IFRS 16 Impacts for the Period                                       44

 21.   List of Dealerships                                                  45

1.      READER ADVISORIES
This Management’s Discussion & Analysis (“MD&A”) was prepared as of May 5, 2021, to assist readers in
understanding AutoCanada Inc.’s (the “Company” or “AutoCanada”) consolidated financial performance for the
three-month period ended March 31, 2021, and significant trends that may affect AutoCanada’s future performance.
The following discussion and analysis should be read in conjunction with the unaudited condensed interim
consolidated financial statements and accompanying notes (the “Interim Consolidated Financial Statements”) of
AutoCanada as at and for the three-month period ended March 31, 2021, the audited annual consolidated financial
statements and accompanying notes (the “Consolidated Financial Statements”) of AutoCanada as at and for the year
ended December 31, 2020, and the MD&A for the year ended December 31, 2020. Results are reported in Canadian
dollars and have been rounded to the nearest thousand dollars, unless otherwise stated.

To provide more meaningful information, this MD&A typically refers to the operating results for the three-month
period ended March 31, 2021 of the Company, and compares these to the operating results of the Company for the
three-month period ended March 31, 2020.

This MD&A contains forward-looking statements. Please see the section “FORWARD-LOOKING STATEMENTS” for a
discussion of the risks, uncertainties and assumptions used to develop our forward-looking information. This MD&A
also makes reference to certain non-GAAP measures to assist users in assessing AutoCanada’s performance. Non-
GAAP measures do not have any standard meaning prescribed by GAAP and are therefore unlikely to be comparable
to similar measures presented by other issuers. These measures are identified and described under the section
“NON-GAAP MEASURES”.

Additional information regarding our Company, including our 2020 Annual Information Form, dated March 2, 2021, is
available on SEDAR at www.sedar.com and our website www.autocan.ca. Such additional information is not
incorporated by reference herein, unless otherwise specified, and should not be deemed to be made part of this
MD&A.

                                                               AutoCanada • 2021 First Quarter Report • Page 3
2. EXECUTIVE SUMMARY Business Overview Canadian Operations AutoCanada's Canadian Operations segment currently operates 49 franchised dealerships in Canada, comprised of 21 brands, in 8 provinces. AutoCanada currently sells Chrysler, Dodge, Jeep, Ram, FIAT, Alfa Romeo, Chevrolet, GMC, Buick, Cadillac, Infiniti, Nissan, Hyundai, Subaru, Audi, Volkswagen, Mazda, Mercedes-Benz, BMW, MINI and Ford branded vehicles. In addition, AutoCanada's Canadian Operations segment currently operates 1 used vehicle dealership supporting the Used Digital Retail Division, and 2 stand-alone collision centres (within our group of 17 collision centres). In 2020, our Canadian dealerships sold approximately 58,000 new and used vehicles and processed approximately 654,000 service and collision repair orders in our 902 service bays. U.S. Operations AutoCanada's U.S. Operations segment, operating as Leader Automotive Group, currently operates 17 franchises comprised of 12 brands, in Illinois, USA. Leader Automotive Group currently sells Chevrolet, Hyundai, Kia, Subaru, Audi, Volkswagen, Mercedes-Benz, Toyota, Honda, Lincoln, Volvo and Porsche branded vehicles. In 2020, our U.S. dealerships sold approximately 7,800 new and used vehicles and processed 102,000 service and collision repair orders in our 196 service bays. Page 4 • AutoCanada • 2021 First Quarter Report
2021 First Quarter Key Highlights and Recent
Developments
All comparisons presented below are between the three-month period ended March 31, 2021 and the three-month
period ended March 31, 2020, unless otherwise indicated.
AutoCanada Key Highlights
   AUTOCANADA REPORTS RECORD 2021 FIRST QUARTER RESULTS - ADJUSTED EBITDA OF $47.2 MILLION
   OUTPACES PRIOR YEAR BY 723% AND CANADIAN MARKET OUTPERFORMANCE IS EXTENDED TO NINTH
                                    CONSECUTIVE QUARTER
    ●   Revenue was $969.8 million as compared to $708.8 million in the prior year, an increase of 36.8% and the
        highest first quarter revenue reported in the Company's history
    ●   Net income (loss) for the period was $21.3 million versus $(46.9) million in 2020, which included impairment
        of non-financial assets of $(31.5) million that was driven by the impact of COVID-19 at the time
    ●   Adjusted EBITDA was $47.2 million versus $5.7 million in the prior year, an increase of 723%; Adjusted
        EBITDA Pre-IFRS 16 was $36.1 million versus $(4.4) million, an increase of 913%; on a trailing twelve month
        basis, pre-IFRS 16 Adjusted EBITDA was $111.5 million
    ●   Basic earnings per share was $0.77, an increase of $2.47 from $(1.70) in the prior year
    ●   Outperformed the Canadian new retail vehicle market for the ninth consecutive quarter with same store new
        retail unit sales increasing 29.8% compared to the Canadian market increase of 15.2% as reported by
        DesRosiers Automotive Consultants
    ●   Canadian used to new retail unit ratio increased to 1.29 from 1.08 last year and the trailing twelve month
        ratio improved to 1.01 at Q1 2021 as compared to 0.81 at Q1 2020
    ●   Net indebtedness of $72.6 million at the end of Q1 2021 compares to $89.5 million at the end of Q4 2020,
        trailing twelve month free cash flow of $144.6 million compares to $105.0 million in the prior year and net
        debt leverage on a pre-IFRS 16 basis improves to 0.7x from 1.3x at the end of the prior year
Executive Overview
The Company reported record-setting performance as revenue for the first quarter of 2021 reached $969.8 million as
compared to $708.8 million in Q1 2020, an increase of 36.8%. For the ninth consecutive quarter, we outperformed
the Canadian new vehicle retail market as our same store new retail unit sales increased by 29.8% as compared to
the Canadian market increase of 15.2% as reported by DesRosiers Automotive Consultants.
Adjusted EBITDA was $47.2 million in Q1 2021 as compared to $5.7 million reported in Q1 2020, an improvement of
723%. Captured within first quarter Adjusted EBITDA of $47.2 million is CEWS income of $2.9 million, rent subsidy of
$0.2 million and the forgiveness of $5.4 million of Paycheck Protection Program ("PPP") loans received at U.S.
dealerships in Q2 2020. Excluding these typically non-recurring income items, normalized Adjusted EBITDA was
$38.7 million for the quarter. On a normalized basis, Adjusted EBITDA margin was 4.0% as compared to 0.8% in the
prior year, an increase of 3.2 percentage points ("ppts").
Used retail unit sales increased by 51.9% over the prior year, contributing to the consolidated used to new retail unit
ratio improving to 1.18 from 1.02, and to 1.01 on a trailing twelve month ("TTM") basis, while gross profit margin on
used vehicles also increased to 6.6% as compared to 4.4% in Q1 2020. For the first time since the inception of
Project 50, the average trailing twelve month ("TTM") Canadian used retail unit sales per dealership per month,
excluding Haldimand Motors, reached 50, as compared to 41 in the prior year.
Finance and insurance ("F&I") gross profit per retail unit increased by 10.8% or $279 per unit to $2,869 per retail unit
compared to the prior year and F&I gross margins improved to 93.6% from 92.8% in the prior year.
Proactive inventory management for both new and used vehicles was a key driver to the Company’s success in
delivering both strong revenue and margin growth across all our business operations in this first quarter.
Consolidated gross profit margin increased by 0.8 ppts to 17.3% as compared to the prior year.
Normalized operating expenses as a percent of gross profit was 81.4% (normalized for CEWS income of $2.9 million,
rent subsidy of $0.2 million and the previously noted PPP loan forgiveness of $5.4 million). This contrasts with the
99.5% reported in Q1 2020, and is well below the five-year first quarter historical average of 92.2%. The Company's

                                                                   AutoCanada • 2021 First Quarter Report • Page 5
ability to control and rationalize costs underscores the effectiveness of the actions taken during 2020 to streamline the Company’s cost structure while optimizing operating leverage. Net indebtedness improved by $(16.9) million from December 31, 2020 to $72.6 million. Free cash flow on a TTM basis was $144.6 million at Q1 2021 as compared to $105.0 million in Q1 2020. Additionally, our net indebtedness leverage ratio improved to 0.7x at the end of Q1 2021, as compared to 1.3x in the prior year. Subsequent to the quarter-ended March 31, 2021, the Company successfully completed an add-on offering of $125.0 million senior notes to its existing 8.75% senior unsecured notes due 2025 and also amended and extended its existing credit facility for three years to 2024. The add-on offering was completed at a premium to par, resulting in a yield of 5.595%. The amended credit facility increases the revolving credit facility by $50 million to $225 million and includes a $1,060 million wholesale floorplan financing facility and a $15 million wholesale leasing facility for total aggregate bank facilities of $1.3 billion. On April 14, 2021, S&P Global Ratings (“S&P”) issued a research update whereby it revised the Company’s outlook to stable, raised the issuer credit rating to 'B' from ‘B-‘, and raised the rating of the Company's senior unsecured notes to 'B' from 'CCC+'. Coupled with the strength of our operating performance and resiliency of our business model, the refinancing actions have further solidified our balance sheet and added financial flexibility which will allow us to move forward on acquisitions in a strategic manner. Looking ahead, while we are confident that the measures we have taken over the past year in response to COVID-19 have strengthened and streamlined the Company’s business model, we remain aware that uncertainty continues to exist in the macroeconomic environment given the ongoing challenges associated with the global pandemic. Uncertainties may include potential economic recessions or downturns, continued disruptions to the global automotive manufacturing supply chain and other general economic conditions resulting in reduced demand for vehicle sales and service. We will continue to remain proactive and vigilant in assessing how COVID-19 may impact our organization and remain committed to optimizing and building stability and resiliency into our business model to ensure we are able to drive industry-leading performance regardless of changing market conditions. Page 6 • AutoCanada • 2021 First Quarter Report
Consolidated AutoCanada Highlights
                                         RECORD SETTING FIRST QUARTER
As a result of the continued execution of our complete business model, along with the improvement in market
outlook and demand during Q1 2021, AutoCanada delivered a record setting first quarter.
For the three-month period ended March 31, 2021:
    ●   Revenue was $969.8 million, an increase of $261.0 million or 36.8%
    ●   Total vehicles sold were 18,707, an increase of 4,972 units or 36.2%
            ●   Used retail vehicles sold increased by 3,325 or 51.9%
    ●   Net income (loss) for the period was $21.3 million (or $0.77 per basic share) versus $(46.9) million (or $(1.70)
        per basic share) in 2020, which included impairment of non-financial assets of $(31.5) million that was driven
        by the impact of COVID-19 at the time
    ●   Adjusted EBITDA increased by 723% to $47.2 million, an increase of $41.5 million
            ●   COVID-19 related normalizing items in the quarter: CEWS of $2.9 million, rent subsidy of $0.2 million
                and forgiveness of $5.4 million of PPP loans received in Q2 2020 for U.S. dealerships. Adjusting for
                these typically non-recurring income items, normalized Adjusted EBITDA was $38.7 million, ahead of
                prior year by $33.0 million; normalized pre-IFRS 16 Adjusted EBITDA was $27.6 million, as compared
                to $(4.4) million
    ●   Ending net indebtedness of $72.6 million reflected a decrease of $(16.9) million from Q4 2020

Canadian Operations Highlights
           OUTPERFORMED CANADIAN NEW RETAIL MARKET FOR NINTH CONSECUTIVE QUARTER
For the ninth consecutive quarter, we outperformed the Canadian market, as same store new retail unit sales
increased by 29.8% as compared to the market increase of 15.2%, for brands represented by AutoCanada as reported
by DesRosiers Automotive Consultants ("DesRosiers"), an outperformance of 14.6 percentage points ("ppts").
Our used vehicle and F&I segments were key drivers of improved earnings in Q1 2021. Same store used vehicle gross
profit percentage increased to 6.8% as compared to 5.5% in the prior year and same store F&I gross profit
percentage increased to 93.3% as compared to 92.4% in the prior year.
Current period results include the acquisitions of Auto Bugatti collision centre and Haldimand Motors which
occurred in Q4 2020. Unless stated otherwise, all Canadian references include Haldimand Motors.
For the three-month period ended March 31, 2021:
    ●   Revenue was $863.8 million, an increase of 37.9%
    ●   Total retail vehicles sold were 15,685, an increase of 4,730 units or 43.2%
            ●   Used retail unit sales increased by 3,156 or 55.6%
            ●   For the first time since the inception of Project 50, the average trailing twelve month Canadian used
                retail unit sales per dealership per month, excluding Haldimand Motors, reached 50, as compared
                to 41 in the prior year
    ●   Used to new retail units ratio increased to 1.29 from 1.08
            ●   Trailing twelve month ratio improved to 1.01 at Q1 2021 as compared to 0.81 at Q1 2020
    ●   Finance and insurance gross profit per retail unit average increased to $2,989, up 11.5% or $309 per unit
    ●   Net income for the period was $21.0 million, up $53.7 million from a net loss of $(32.6) million in 2020,
        which included impairment of non-financial assets of $(22.7) million
    ●   Adjusted EBITDA increased 394.9% to $43.2 million, an increase of $34.5 million
            ●   Adjusting for COVID-19 related CEWS of $2.9 million, rent subsidy of $0.2 million, normalized
                Adjusted EBITDA decreases to $40.1 million, ahead of prior year by $31.4 million; normalized pre-
                IFRS 16 Adjusted EBITDA was $30.1 million, as compared to $(0.5) million

                                                                     AutoCanada • 2021 First Quarter Report • Page 7
U.S. Operations Highlights
RETAIL UNIT SALES GROWTH OF 30.9%
Despite facing market headwinds, including inventory shortages and stringent pandemic related restrictions in the
City of Chicago, U.S. operations were buoyed by strong market demand and posted improved results, as compared
to Q1 2020. Current period results include the acquisition of Autohaus of Peoria which occurred on October 29,
2020.
● Revenue was $106.0 million, an increase of 29.0%
● Retail unit sales increased to 2,282 units, up 539 units or 30.9%
● Net income (loss) for the period increased by $14.5 million to $0.3 million from $(14.2) million in 2020, which
included impairment of non-financial assets of $(8.9) million
● Adjusted EBITDA was $4.0 million, an increase of $7.0 million from 2020
● Adjusting for the forgiveness of $5.4 million of PPP loans received in Q2 2020, normalized Adjusted
EBITDA decreases to $(1.4) million, an increase of $1.6 million from prior year Adjusted EBITDA of
$(3.0) million
Same Store Metrics - Canadian Operations
SAME STORE USED RETAIL UNIT SALES GROWTH OF 43.7%
Same store new and used retail unit sales increased by 37.0% to 15,010 units; new retail units increased by 29.8% and
used retail units increased by 43.7%. The increase of new retail units by 29.8% outperformed the market increase of
15.2% in the Canadian new vehicle market for the brands represented by AutoCanada, as reported by DesRosiers.
The continued optimization of the Company's complete business model is highlighted by the year-over-year
improvement in gross profit across every business segment which collectively totaled $37.8 million, or 35.0%.
Same store metrics include only Canadian dealerships which have been owned for at least two full years since
acquisition.
● Revenue increased to $790.8 million, an increase of 27.8%
● Gross profit increased by $37.8 million or 35.0%
● Used to new retail units ratio increased to 1.19 from 1.08
● New and used retail unit sales increased by 37.0% to 15,010 units
● Used retail unit sales increased by 43.7%, an increase of 2,481 units
● Finance and insurance gross profit per retail unit average increased to $3,085, up 15.5% or $413 per unit;
gross profit increased to $46.3 million as compared to $29.3 million in the prior year, an increase of $17.0
million or 58.2%
● Parts, service and collision repair gross profit increased to $50.4 million, an increase of 15.0%
● Parts, service and collision repair gross profit percentage increased to 54.6% as compared to 48.4%
in the prior year, an increase of 6.2 ppts, driven by a combination of a change in product mix and
various initiatives to improve margin retention
Financing and Investing Activities and Other Recent Developments
S&P UPGRADES SUPPORT SUCCESSFUL ADD-ON DEBENTURE OFFERING OF $125 MILLION
CREDIT FACILITY AMENDED AND EXTENDED
Our focus has been and continues to be on preserving cash and managing liquidity. In the quarter, net indebtedness
decreased by $(16.9) million to $72.6 million, resulting in a net debt leverage of 0.7x.
Subsequent to quarter-end, the Company completed the following transactions on April 14, 2021:
● Amended and extended our existing credit facility for total aggregate bank facilities of $1.3 billion, with a
maturity date of April 14, 2024, maintaining a three-year tenor to our facility
● Issued an additional $125 million add-on to our existing 8.75% senior unsecured notes, due February 11, 2025
● S&P issued a research update whereby it revised the Company’s outlook to stable, raised the issuer credit
rating to 'B' from ‘B-‘, and raised the rating of the Company's senior unsecured notes to 'B' from 'CCC+'
Page 8 • AutoCanada • 2021 First Quarter ReportBusiness Objectives and Strategy
Progress Update on Business Objectives and Strategy
Below is an update of the Company's progress to date on management's Go Forward Plan (July 2018). For a complete
description of the strategic plan and objectives, please see our Q4 2019 MD&A.
Strategic Initiative Q1 2021 Progress Update
Balance Sheet
• Net debt leverage of 0.7x at the end of Q1 2021.
We have established a target net debt leverage range of
between 2.5x and 3.0x. On a lease adjusted net debt • Lease adjusted net debt leverage ratio of 3.0x at the end of
Q1 2021.
leverage basis, we have set a target range of between 4.0x
and 4.5x. • Net indebtedness reduced from $90 million at December
31, 2020 to $73 million at the end of Q1 2021.
Finance and Insurance ("F&I")
• Same store F&I gross profit per retail unit increased to
A dedicated F&I team with an in-house F&I training program $3,085, up 15.5%; tenth consecutive quarter of year-over-
to educate our dealership network on a standardized year growth.
product portfolio and sales process. • Same store F&I gross profit increased by 58.2% to $46.3
million as compared to $29.3 million in the prior year.
Service Bay Occupancy and Business Development Centre ("BDC")
A call centre dedicated to handle all service work
• Despite the impacts of the current challenging market, our
appointment booking for all Canadian dealership locations.
Canadian service bay occupancy has increased by
BDC is based in Saint John, New Brunswick with specifically
approximately 4 ppts when compared to the prior year.
trained personnel.
Project 50 (Used Retail Cars)
• Average TTM Canadian used retail unit sales per dealership
An initiative dedicated to increasing our used to new retail
per month, excluding Haldimand Motors, reached 50, as
unit ratio to an annual industry-leading ratio of 1.0 in compared to 41 in the prior year.
Canada by establishing disciplined protocols around used
• TTM Canadian used to new retail units ratio increased to 1.01
retail sale.
at Q1 2021 as compared to 0.81 at Q1 2020.
Special Finance (RightRide)
An extension of Project 50 with an emphasis on selling • Operating as an extension of existing dealership locations,
used vehicles. RightRide is a division dedicated to reaching have increased presence to 7 operating locations as at Q1
more credit-challenged customers by partnering with 2021.
existing third party financing providers. The Company • Developing comprehensive training and operating manual
retains no credit risk. to support scalability.
Collision Centres
• 17 collision centres (including 2 stand-alone collision
A division to monitor and optimize our collision centre centers) under one leadership team.
operations across Canada, by focusing on stand-alone • Acquisition of PG Klassic AutoBody, a collision centre
collision centers in areas where we have multiple located in Prince George, British Columbia in Q2 2021.
dealerships, to create a "hub and spoke" model. • Acquisition of Auto Bugatti, a BMW MINI certified collision
centre located in Montreal, Quebec in Q4 2020.
Cross-border Wholesale
A division allowing us to capture higher profit selling price
and margin opportunities by moving used vehicles from • We continue to action cross-border margin opportunities.
our Canadian dealership network cross-border to the U.S.
U.S. Operations
Focus from Q1 2019 through end of 2020 on addressing
cost structure and moving to breakeven; Beginning in 2021, • Normalized Adjusted EBITDA increased to $(1.4) million for
emphasis has shifted to driving sustainable profitability Q1 2021, an increase of $1.6 million from $(3.0) million in Q1
through further emphasis on the used retail vehicle 2020.
business.
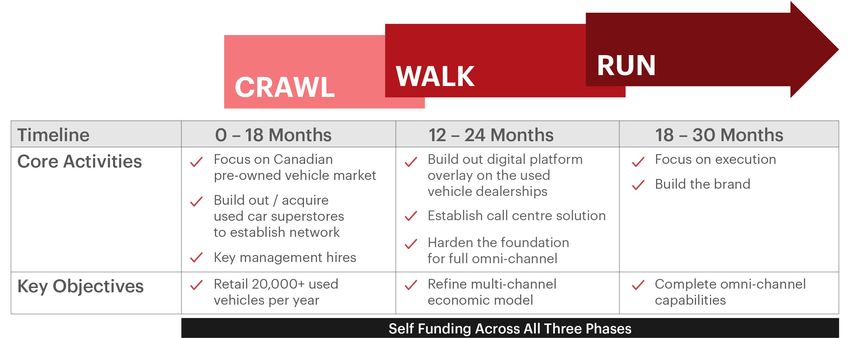
AutoCanada • 2021 First Quarter Report • Page 9Used Digital Retail Division
Overview
Our Used Digital Retail Division ("the Division") is expected to drive Canadian used vehicle sales across all channels,
including both standalone brick and mortar used dealerships as well as completely online, by creating a seamless
omni-channel buying experience for customers that supports their in-store and online requirements for used
vehicles. This includes the development of a national network of used vehicle dealerships through both organic
development and acquisitions such as Haldimand Motors, as well as an online platform, and will represent Canada’s
first national used vehicle platform.
The Used Digital Retail Division strategy is complementary to our existing complete business model and will:
● Allow for an attractive market entry with low capital intensity
● Drive meaningful improvement beyond the Company's existing 1.0 used to new retail unit ratio target in
Canada
● Drive incremental revenues in existing high margin business segments, including finance, insurance and
other and parts, service and collision repair
● Attract consumers earlier in the car buying lifecycle and serve them across all channels as a preferred
provider
● Leverage AutoCanada’s scale, domain expertise, and existing industry relationships across Canada
Our expected activities and capital investments to establish the Division in the short, medium, and long-term are as
follows:
For a complete description of the Division, please see our Q4 2020 MD&A for further details.
M&A Strategy
Our near-term business strategy is to continue to optimize our platform to produce strong and stable results in any
economic environment through our various units. We intend to utilize our platform to create tangible value through
an acquisition roll-up strategy.
The current industry is largely comprised of fragmented independently owned dealerships. According to DesRosiers,
there were approximately 3,300 franchised dealerships across Canada in 2018, and approximately 49% of these
franchised dealerships are owned by either individuals/families or groups that own fewer than five locations.
Independently owned dealerships often have underdeveloped business units, providing us with synergy
opportunities. Therefore, we continue to see a large opportunity for the Company to acquire dealerships.
Leveraging the benefits of our success in building out a ‘complete’ business model, management is taking a
disciplined approach in moving forward with an acquisition strategy. We will continue to seek to optimize brand and
geographic diversification through acquisitions.
Acquisition opportunities are evaluated using an internal rate of return construct by comparing returns of potential
projects and acquisitions against internal hurdle rates. The internal hurdle rate is calculated as internal cost of capital
plus transaction-specific risk premiums and is impacted by a number of factors including the brand, size of
Page 10 • AutoCanada • 2021 First Quarter Reportdealership, and geography. This internal framework provides the guideposts for the management team to consider,
evaluate, and compare various opportunities.
Further, our M&A strategy will be supported by a strong and liquid balance sheet. As strong stewards of capital, we
will continue to be disciplined with our capital allocation and target a net debt leverage ratio range of between 2.5x
and 3.0x post-acquisition.
AutoCanada • 2021 First Quarter Report • Page 11First Quarter Financial Information
The following table summarizes the Company’s operations for the quarter:
Three Months Ended March 31
Consolidated Operational Data 2021 2020 % Change
Revenue 969,824 708,826 36.8%
Gross profit 167,636 117,298 42.9%
Gross profit % 17.3% 16.5% 0.8%
Operating expenses 127,948 116,700 9.6%
Operating profit (loss) 41,664 (28,948) 243.9%
Net income (loss) for the period 21,334 (46,853) 145.5%
Basic net income (loss) per share attributable to AutoCanada shareholders 0.77 (1.70) 145.3%
Diluted net income (loss) per share attributable to AutoCanada shareholders 0.71 (1.70) 142.0%
Adjusted EBITDA 1 47,234 5,739 723.0%
New retail vehicles sold (units) 8,233 6,289 30.9%
New fleet vehicles sold (units) 740 1,037 (28.6)%
Total new vehicles sold (units) 8,973 7,326 22.5%
Used retail vehicles sold (units) 9,734 6,409 51.9%
Total vehicles sold 18,707 13,735 36.2%
Same store new retail vehicles sold (units) 6,848 5,274 29.8%
Same store new fleet vehicles sold (units) 739 1,037 (28.7)%
Same store used retail vehicles sold (units) 8,162 5,681 43.7%
Same store total vehicles sold 15,749 11,992 31.3%
Same store revenue 790,798 618,859 27.8%
Same store gross profit 145,799 108,019 35.0%
Same store gross profit % 18.4% 17.5% 0.9%
1 This financial measure has been calculated as described under Section 15, Non-GAAP Measures and should not be considered
a substitute or alternative for GAAP measures. This is not a defined term under IFRS and does not have a standard meaning, so
may not be a reliable way to compare us to other companies.
Page 12 • AutoCanada • 2021 First Quarter Report3. MARKET AND OUTLOOK
The Canadian Vehicle Market
Total Canadian Vehicle Sales (Millions of Units)
28.2
5.0 5.1 5.1 4.9
17.1 4.4 4.5 4.5 4.5 4.5 4.6 4.8 4.5
4.3 4.3 4.3
3.8 3.8 3.9 3.9 4.0
3.6 3.6
00 01 02 03 04 05 06 07 08 09 10 11 12 13 14 15 16 17 18 19 20 21F
New Sales Used Sales Units in Operation
Source: DesRosiers Automotive Consultants
Based on market data provided by DesRosiers, a 2% Compound Annual Growth Rate ("CAGR") is noted for the period
from 2000 to 2019. Due to the impact of COVID-19, the overall Canadian market for vehicle sales has noted a CAGR
of 1% for the period from 2000 to 2020. In line with continued population growth, there is an anticipated continued
long-term growth in year-over-year vehicle sales. The above market data provided by DesRosiers further confirms
that consumers continue to buy more vehicles every year and supports our continued growth.
With the overall trend of increases in total vehicle sales, the Company's strategy to focus on increasing our used to
new retail unit ratio, and strengthen and stabilize our business model as a result, is very much tied to the broader
market outlook that Canadians continue to buy more vehicles, new or used, each and every year.
According to DesRosiers, Seasonally Adjusted Annual Rate ("SAAR") for March 2021 increased by 87% to 1.9 million
units as compared to 1.0 million units in March 2020. SAAR creates a base sales figure to allow for more meaningful
comparison between months converting the current monthly sales to take into account seasonality of the past ten
years. In addition, according to DesRosiers, the market forecast for Canadian light vehicles sales in 2021 is expected
to increase by 19.7% to 1.9 million light vehicles, as compared to the 1.6 million light vehicles sold in 2020. However,
actual sales may differ materially as there continues to be a high level of uncertainty regarding the near-term and
long-term impacts of COVID-19. In addition to the direct impacts of COVID-19 on our operations, there may be
disruptions to the global automotive manufacturing supply chain, resulting in limited access to inventory or other
impacts on general economic conditions resulting in reduced demand for vehicle sales and service. This includes
the current microchip inventory shortage that is impacting new vehicle inventory production. While AutoCanada
currently has ample levels of new vehicle inventory, prolonged shortages could result in lower new vehicle sales
volumes.
Regardless of the current market uncertainties, with our successful strategy to build up new and used inventory and
our comprehensive and complete business model, we are well situated to continue to manage and operate through
these uncertain times.
AutoCanada • 2021 First Quarter Report • Page 13Performance vs. the Canadian Vehicle Market
Based on market data provided by DesRosiers, the overall Canadian automotive new retail vehicle sector for the
three-month period ended March 31, 2021 increased by 15.1% compared to the prior year.
Outperformance of Canadian New Vehicle Market by 14.6 ppts
For the quarter, same store new retail units increased by 29.8% and compares with an increase of 15.2% in the
Canadian new vehicle market for the brands represented by AutoCanada, as reported by DesRosiers.
New Retail Units YoY % Growth - Market vs AutoCanada Same Store Sales
29.8%
15.1% 15.2%
Total Market Market: Brand AutoCanada
Representation
by AutoCanada
Three Months Ended March 31
Source: DesRosiers Automotive Consultants
We have continued to outperform the market, both prior to and during this pandemic crisis, for the ninth
consecutive quarter. Key contributing factors to our continued outperformance include the following:
● Dealerships remained open for business, where possible and within government guidelines
● Proactive inventory management of new and used vehicles to support sales
● By turning new vehicle sales volume and thereby earning increased OEM volume allocations, we
were able to "turn and earn" OEM allocations through ongoing market outperformance
● Ability and willingness to take on incremental allocations declined by competitor dealerships
● Time in position for the management team to drive operational excellence in all elements of our complete
business model
● Alignment of compensation structures with our OEM partners' balanced scorecard metrics
● Ability to retain and attract top sales talent driven by our sales outperformance and strong inventory
position across both new and used vehicle inventory
Page 14 • AutoCanada • 2021 First Quarter Report4. RESULTS OF OPERATIONS
First Quarter Operating Results
Same store metrics include only Canadian dealerships which have been owned for at least two full years since
acquisition.
Revenues
The following table summarizes revenue for the quarters ended March 31:
Three Months Ended March 31
2021 2020 Change Change
$ $ $ %
New vehicles 442,448 341,582 100,866 29.5%
Used vehicles 364,072 229,355 134,717 58.7%
Parts, service and collision repair 108,223 102,453 5,770 5.6%
Finance, insurance and other 55,081 35,436 19,645 55.4%
Total revenue 969,824 708,826 260,998 36.8%
Gross Profit
The following table summarizes gross profit for the quarters ended March 31:
Three Months Ended March 31
2021 2020 Change Change
$ $ $ %
New vehicles 33,588 24,267 9,321 38.4%
Used vehicles 24,176 10,173 14,003 137.6%
Parts, service and collision repair 58,327 49,969 8,358 16.7%
Finance, insurance and other 51,545 32,889 18,656 56.7%
Total gross profit 167,636 117,298 50,338 42.9%
AutoCanada • 2021 First Quarter Report • Page 15Gross Profit Percentages
The following table summarizes gross profit percentages for the quarters ended March 31:
Three Months Ended March 31
Change
2021 2020 ppts
New vehicles 7.6% 7.1% 0.5
Used vehicles 6.6% 4.4% 2.2
Parts, service and collision repair 53.9% 48.8% 5.1
Finance, insurance and other 93.6% 92.8% 0.8
Total gross profit % 17.3% 16.5% 0.8
For the three-months ended March 31, 2021, 16.9% of the Company's revenue generated from finance, insurance and
other ("F&I") and parts, service and collision repair ("PS&CR") contributed 65.5% of the Company's total gross profit
and is due to the higher gross profit percentages of 93.6% and 53.9%, respectively, for F&I and PS&CR when
compared to the lower gross profit percentages for new and used vehicles. This relationship is key to continue
building a stable and robust business model and supports management's key initiatives to further develop our higher
profit margin generating divisions.
New vehicles
For the three-month period ended March 31, 2021
Consolidated Operations
New vehicle revenue increased by 29.5% with new vehicle gross profit increasing by 38.4%. New vehicle gross
profit percentage increased to 7.6% as compared to 7.1% in the prior year.
Canadian Operations and Same Stores Results
New vehicle revenue increased by 29.1% and new vehicle gross profit percentage increased to 8.1% as compared
to 8.0% in the prior year.
Same store new vehicle revenue increase of 29.1% was largely driven by the increase in same store new vehicle
retail units to 6,848, an increase of 1,574 units or 29.8% compared to the prior year. Same store new vehicle gross
profit percentage increased to 8.1% as compared to 8.0% in the prior year.
We continue to prioritize our OEM relationships, which includes achieving sales unit targets, customer
satisfaction targets, and several other key measures as reflected within the various OEM balanced scorecards.
With our strong OEM relationships and our continued outperformance of market, we have sufficient new vehicle
inventory to meet expected sales demand.
Page 16 • AutoCanada • 2021 First Quarter ReportAlong with other strategies borne out to drive stability in the Company's complete business model, the Company
continues to outperform the Canadian market.
U.S. Operations
New vehicle revenue increased by 33.0% and new vehicle gross profit increased by $2.2 million. New vehicle
gross profit percentage increased to 4.3% as compared to 0.4% in the prior year.
These increases are attributable to a fundamental shift in culture to ensure we are meeting market demand.
Market demand factors were more pronounced within our U.S. Operations given the constrained availability of
new inventory resulting from the closure of vehicle assembly plants at the onset of the pandemic as well as the
more stringent lockdown restrictions imposed by the State of Illinois and the City of Chicago. In the latter half of
March 2021, additional sales team members were hired to prioritize growth and contributed to the improvement
in gross profit percentage noted.
Comparisons to the prior year are impacted by the acquisition of Autohaus of Peoria on October 29, 2020.
Used vehicles
For the three-month period ended March 31, 2021
Consolidated Operations
Used vehicle revenue increased by 58.7%. Used vehicle gross profit increased by 137.6% and gross profit per used
vehicle sold increased by $896 per unit.
Canadian Operations and Same Stores Results
Used vehicle revenue increased by 61.8% and used vehicle gross profit increased by 143.3%. Used vehicle gross
profit percentage increased to 6.7% as compared to 4.5% in the prior year.
Same store used vehicle revenue increased by 33.0% and same store used vehicle gross profit increased by
65.1%. Same store used vehicle gross profit percentage increased to 6.8% as compared to 5.5% in the prior year.
Increased demand for used vehicles was a key driver for the improvements in used vehicle gross profit and gross
profit percentage. Due to both the recent surge in demand for used cars and shortage of inventory, wholesale
and auction prices continued to remain at record highs. Insight into this trend is provided by the Canadian Black
Book Used Vehicle Retention Index ("CBBUVRI"), which monitors the health of the used wholesale vehicle market
and tracks the retained wholesale values for two to six-year-old vehicles in Canada. According to the CBBUVRI,
the index reached another all-time high in March at 118.6 points, an increase of 10.6% compared to prior year and
an increase of 4.1% compared to February 2021.
We met the increased demand for used vehicles with our Project 50 initiative, that includes both a focus on used
retail vehicle sales and the creation of the RightRide division to focus on credit-challenged customers, and our
strategic build up of used vehicle inventory. Same store used retail vehicle unit sales increased by 2,481 units to
8,162 units. We continue to prioritize retailing of used vehicles, as opposed to wholesale or auctioning used
vehicles. This ensures we are able to generate F&I and PS&CR gross profit, as well as provide additional
opportunities for AutoCanada to develop customer loyalty and build customer retention.
Our focus on increasing used retail volume is reflected by the continued improvement in our same store used to
new retail unit ratio which increased to 1.19 for Q1 2021 as compared to 1.08 in the prior year. The TTM Canadian
used to new retail unit ratio for the year improved to 1.01 at Q1 2021 as compared to 0.81 at Q1 2020. According to
DesRosiers, our performance places us well ahead of our peers as historical Canadian market used to new retail
unit ratio was 0.49 in 2019 and 0.60 in 2020. Average TTM Canadian used retail units sold per month per
Canadian dealerships increased from 41 used retail units in the prior year to 50 used retail units in the current
year, excluding Haldimand Motors.
Continuing from our fourth quarter strategic decision to build up our used vehicle inventory supply, our used
vehicle inventory position increased to $311.4 million as at March 31, 2021 as compared to $155.9 million in the
prior year, an increase of $155.4 million or close to 100%. With strong and better than market levels of used
vehicle inventory, we are well positioned to continue to take advantage of the current unprecedented used
vehicle market.
AutoCanada • 2021 First Quarter Report • Page 17Used to New Retail Units Ratio
(Quarterly on a Same Store basis and TTM on a Canadian basis)
1.01
0.95
0.93
0.88 1.19
1.08
0.99
0.91
0.86 0.85
0.75 0.72
Q2 Q3 Q4 Q1
2019 2020 2021 2020 TTM Canadian Used to New Retail Units Ratio
This trend of continuous improvement demonstrates the stability of the used retail market, our growing
competence as a used vehicle retailer, and ultimately supports our business objectives and strategy to develop a
complete business model.
U.S. Operations
Used vehicle revenue increased by 33.7% and used vehicle gross profit increased by 88.9%. Used vehicle gross
profit percentage increased to 5.9% as compared to 4.2% in the prior year.
Due to strong market demand for used vehicles, there is a thinning of used inventory supply available.
Management prioritized the build up of used vehicle inventory to meet market demand to address the limited
inventory supply. This resulted in an increase in used retail vehicles sold by 169 units to 897 units as compared to
the prior year.
With the continued optimization of the retailing process, we were able to leverage the used pricing opportunities
and used vehicle gross profit percentage improved by 1.7 ppts to 5.9%. Management will continue to strategically
build up used vehicle inventory to meet market demand.
With management's shift to prioritize growth of the operations, new retail unit sales growth in Q1 2021 outpaced
the growth in used retail units sale and resulted in a decrease in the used to new retail unit ratio to 0.65 as
compared to 0.72.
Comparisons to the prior year are impacted by the acquisition of Autohaus of Peoria on October 29, 2020.
Parts, service and collision repair
For the three-month period ended March 31, 2021
Consolidated Operations
Parts, service and collision repair revenue increased by 5.6% and gross profit increased by 16.7%.
Canadian Operations and Same Stores Results
Parts, service and collision repair revenue increased by 5.8% and gross profit increased by 19.1%. PS&CR gross
profit percentage increased to 54.2% as compared to 48.2% in the prior year.
Same stores results saw PS&CR revenue increase by 2.1%, while gross profit increased by 15.0%. Same store
PS&CR gross profit percentage increased to 54.6% as compared to 48.4% in the prior year.
The increase in same store parts, service and collision repair gross profit percentage is driven by both a change in
our product mix and the continued focus on improving margin thresholds.
There was a reduction to overall kilometers driven and a delay of routine maintenance due to pandemic related
restrictions and the trend of remote work. This trend resulted in a reduction in routine maintenance transactions
Page 18 • AutoCanada • 2021 First Quarter Reportthat typically have a lower margin and a corresponding increase in customer pay transactions that typically have
a higher margin. As a result of ongoing initiatives to optimize our profit margins, gross profit percentage for most
products has improved on a year-over-year basis.
We continue to implement our BDC strategy, which involves leveraging the large database of our customer
information across our Canadian dealership network to centralize the service work appointment booking process.
Our BDC strategy has been implemented at all Canadian dealerships locations, and should be implemented at all
Canadian collision centre locations by Q4 2021. In addition, this strategy will grow in scale with our acquisition
strategy. We have specially trained personnel to ensure consistent quality customer interactions. Further
optimization of our BDC strategy entails a number of elements including occupancy tracking, technician
recruitment, and call list development for vehicle recall and overdue maintenance follow up. This strategy has
allowed us to develop incremental and directed marketing initiatives, while focusing on improving service
retention, and will increase service bay occupancy rates over time. As a result of the BDC, despite the impacts of
the current challenging market, our service bay occupancy has increased by approximately 4 ppts.
Comparisons to the prior year are impacted by the acquisition of Auto Bugatti collision centre on October 6,
2020.
Same Store Parts, Service & Collision Repair Gross Profit ($ Millions)
51.6
50.1 50.4
49.4 49.7
47.5
43.8
38
Q2 Q3 Q4 Q1
2019 2020 2021
Same Store Parts, Service & Collision Repair Gross Profit Percentage
55.8%
54.6%
53.6%
51.6%
51.2%
50.3%
49.9%
48.4%
Q2 Q3 Q4 Q1
2019 2020 2021
AutoCanada • 2021 First Quarter Report • Page 19U.S. Operations
Parts, service and collision repair revenue increased by 4.3% and gross profit increased by 0.4%. Parts, service
and collision repair gross profit percentage decreased to 51.3% as compared to 53.3% in the prior year.
Management continues to focus on process improvements in our parts, service and collision repair operations,
which includes maximizing technician productivity and improving effective labour rates on our service work. Due
to the more stringent lockdown restrictions imposed by the State of Illinois and the City of Chicago, there was an
overall reduction in miles driven and resulted in less repair orders being completed in the current quarter as
compared to prior year. Therefore, gross profit increased as a result of the reduction in repair orders and resulting
in changes in product mix resulted in a compression to gross profit percentage.
Comparisons to the prior year are impacted by the acquisition of Autohaus of Peoria on October 29, 2020.
Finance, insurance and other
Finance and insurance products are sold with both new and used retail vehicles.
For the three-month period ended March 31, 2021
Consolidated Operations
Finance, insurance and other revenue increased by 55.4% and gross profit increased by 56.7%. Gross profit per
vehicle increased by $279 per unit.
Canadian Operations and Same Stores Results
Finance, insurance and other revenue increased by 58.1% and gross profit increased by 59.7%. Gross profit
percentage increased to 93.4% as compared to 92.5% in the prior year.
Same stores results saw finance, insurance and other revenue increase by 56.7% and gross profit increased by
58.2% to $46.3 million. Same store finance, insurance and other gross profit percentage increased 93.3% as
compared to 92.4% in the prior year. Gross profit per retail unit average increased to $3,085, up 15.5% or $413
per retail unit, as compared to $2,672 in the prior year. Gross profit increased due to both the improvements on a
per retail unit basis along with the increase of 4,055 retail units to total same store retail units of 15,010.
The $413 per retail unit increase in same store gross profit per unit is attributed to the strong foundation our F&I
initiative has built and the continued optimization of our in-house training program. The training program
leverages available data and focuses on educating our finance managers to both better understand our product
portfolio to cater to customer preferences and to better provide added value to customers throughout the sale
process. Improving our insight into customers' product preferences allows us to provide value generating
products for our customers to increase value add products per deal and ultimately improve customer retention.
F&I continues to have the highest gross profit retention in the Company. We are constantly optimizing the various
inputs and value added product menu, with an emphasis to drive consistent improvements in our F&I
performance.
Same Store Finance, Insurance and other Gross Profit ($ Millions)
46.3
40.9
35.6 36.2
32.2 33
30.9
29.3
Q2 Q3 Q4 Q1
2019 2020 2021
Page 20 • AutoCanada • 2021 First Quarter ReportSame Store Finance, Insurance and Other Gross Profit per Retail Unit Average
3,085
2,783
2,678 2,672
2,521
2,447 2,468
2,268
Q2 Q3 Q4 Q1
2019 2020 2021
U.S. Operations
Finance, insurance and other revenue increased by 32.7% and gross profit increased by 31.9%. Gross profit
percentage slightly decreased to 95.3% as compared to 95.9% in the prior year.
The gross profit percentage continues to remain strong at 95.3% and is largely due to management's continued
focus on improving our formal financing and insurance structure and process certifications. The formal structure
and training resulted in a shift in what we consider core products and ensures that products being sold drive
customer retention by providing value to our customers.
Comparisons to the prior year are impacted by the acquisition of Autohaus of Peoria on October 29, 2020.
Operating expenses
Employee Costs
Employee costs are associated with employing staff both at dealerships and at AutoCanada’s head office.
Dealership employees are largely commission based, making employee costs primarily variable in nature. Our
dealership pay structures are tied to meeting sales objectives, maintaining customer satisfaction metrics, as well
as improving gross profit and net income.
Administrative Costs
Administrative costs comprise the remaining costs of running our dealerships. Advertising, utilities, service shop
consumables, information processing, insurance, and consulting costs comprise a significant portion of
administrative costs. Administrative costs can be fixed, variable or semi-variable in nature. The Company
operates a centralized marketing department and information technology department, both of which provide
services to the dealerships in order to leverage the size of the group to lower the operating costs of the
dealerships.
Facility Lease and Storage Costs
Facility lease and storage costs relates to the cost of short-term ancillary and supplemental leasing arrangements
that support dealership facilities.
Depreciation of Property and Equipment
Depreciation of property and equipment relates to the depreciation of the dealership assets, including buildings,
machinery and equipment, leasehold improvements, company and lease vehicles, furniture, and computer
hardware. Depreciation rates vary based on the nature of the asset.
While management considers operating expenses as a percentage of gross profit to be a good indicator of
expense control, as many operating expenses are variable in nature, the Company considers operating expenses
before depreciation as a percentage of gross profit a more accurate measure of operating performance.
AutoCanada • 2021 First Quarter Report • Page 21Depreciation of Right-of-Use Assets
Depreciation of right-of-use assets relates to the right-of-use assets that arise upon the inception of a lease
arrangement. The right-of-use asset is depreciated on a straight-line basis over the shorter of the asset's useful
life and the lease term.
The following table summarizes operating expenses:
Three Months Ended March Three Months Ended March
31, 2021 31, 2020
Canada U.S. Total Canada U.S. Total
$ $ $ $ $ $
Employee costs 74,155 9,332 83,487 58,732 7,760 66,492
Government assistance (3,101) (5,398) (8,499) — — —
Administrative costs 35,512 6,916 42,428 32,966 6,410 39,376
Facility lease and storage costs 134 — 134 237 — 237
Depreciation of property and equipment 3,745 309 4,054 4,098 289 4,387
Depreciation of right-of-use assets 5,677 667 6,344 5,626 582 6,208
Total operating expenses 116,122 11,826 127,948 101,659 15,041 116,700
The following table summarizes operating expenses before depreciation as a percentage of gross profit and
operating expenses as a percentage of gross profit:
Three Months Ended March 31, Three Months Ended March 31,
2021 2020
Canada U.S. Total Canada U.S. Total
$ $ $ $ $ $
Operating expenses before depreciation 70.1% 70.1% 70.1% 86.6% 126.8% 90.5%
Total operating expenses 76.3% 76.4% 76.3% 95.8% 134.6% 99.5%
Operating expenses before depreciation as % of Gross Profit
91.4% 90.5%
81.3%
76.6% 75.8%
70.9% 70.1%
64.3%
Q2 Q3 Q4 Q1
2019 2020 2021
Total Operating Expenses
For the three-month period ended March 31, 2021
Consolidated Operations
Operating expenses before depreciation as a percentage of gross profit decreased by (20.4) ppts to 70.1% and
operating expenses as a percentage of gross profit decreased by (23.2) ppts to 76.3%, as compared to prior year.
Page 22 • AutoCanada • 2021 First Quarter ReportAdjusting for CEWS of $2.9 million, rent subsidy of $0.2 million and the forgiveness of $5.4 million of PPP loans
received in Q2 2020 for U.S. dealerships, normalized operating expenses before depreciation as a percentage of
gross profit decreased to 75.2% as compared to 90.5% in the prior year.
While the prior year was impacted by the loss of gross profit from the initial lockdowns, this normalized
improvement reflects the Company's continued optimization of the business model, including updated head
count and pay plans to a more sustainable structure.
Canadian Operations
Operating expenses before depreciation as a percentage of gross profit decreased by (16.5) ppts to 70.1% as
compared to prior year.
Adjusting for CEWS of $2.9 million and rent subsidy of $0.2 million, normalized operating expenses before
depreciation as a percentage of gross profit decreased to 72.2% as compared to 86.6% in the prior year.
Employee costs as a percentage of gross profit decreased to 48.7% as compared to 55.3% in the prior year. This
decrease is driven by the optimized business model.
U.S. Operations
Operating expenses before depreciation as a percentage of gross profit decreased by (56.7) ppts to 70.1%.
Adjusting for the forgiveness of $5.4 million of PPP loans, normalized operating expenses before depreciation as
a percentage of gross profit decreased to 105.0% as compared to 126.8% in the prior year.
This reduction in employee costs as a percentage of gross profit by (9.1) ppts to 60.3% is largely driven by
management's strategy to build up a strong sales team to meet strong market demand. The improved sales team
resulted in improvements in new and used vehicle sales volume and profitability, and overall gross profit.
Net Income (Loss) for the Period and Adjusted EBITDA
The following table summarizes Net income (loss) and Adjusted EBITDA for the three months ended March 31:
Three Months Ended March 31
2021 2020 Change
$ $ $
Net income (loss) for the period 21,334 (46,853) 68,187
1
Adjusted EBITDA 47,234 5,739 41,495
1 For the reconciliation of these Non-GAAP measures refer to Section 16, Non-GAAP Measure Reconciliations.
Net Income (Loss) for the Period
Net income (loss) for the three-month period ended March 31, 2021 improved by $68.2 million, compared to prior
year. The drivers of this change include:
● Canadian Operations segment contributed an increase of $53.7 million in the first quarter
● Impairment of non-financial assets of $(22.7) million was recognized during the quarter ended
March 31, 2020 - driven by impact of COVID-19 at the time
● U.S. Operations segment contributed an increase of $14.5 million in the first quarter
● Impairment of non-financial assets of $(8.9) million was recognized during the quarter ended March
31, 2020 - driven by impact of COVID-19 at the time
Adjusted EBITDA
Adjusted EBITDA for the three-month period ended March 31, 2021 increased by $41.5 million, compared to prior
year. The drivers of this increase include:
● Canadian Operations Adjusted EBITDA contributed an increase of $34.5 million in the first quarter year-over-
year
● U.S. Operations Adjusted EBITDA contributed an increase of $7.0 million in the first quarter year-over-year
AutoCanada • 2021 First Quarter Report • Page 23Adjusted EBITDA ($ Millions)
61.1
47.2
40.5
32.1 32.5
21.1
4.8 5.7
Q2 Q3 Q4 Q1
2019 2020 2021
Pre-IFRS 16 Adjusted EBITDA ($ Millions)
50.2
36.1
30.6
23.0 23.0
10.9
(5.4) (4.4)
Q2 Q3 Q4 Q1
2019 2020 2021
Finance Costs
The Company incurs finance costs on its revolving floorplan facilities, long-term indebtedness, banking
arrangements, lease liabilities under IFRS 16, extinguishment of debt, and unrealized fair value changes on interest
rate swaps.
During the three-month period ended March 31, 2021, finance costs on our revolving floorplan facilities decreased by
(46.5)% to $3.5 million from $6.6 million, in the same period of the prior year. The decrease is primarily driven by
both a reduction in flooring interest rates and floored new vehicle base.
During the three-month period ended March 31, 2020, loss on extinguishment of debt of $4.0 million was recognized
in relation to the amendment of the Credit Facility and Senior Notes offering that occurred on February 11, 2020.
The unrealized fair value changes on interest rate swaps represents the unrealized changes in derivative financial
instruments held for the purpose of managing exposures to fluctuations in interest rates. Changes in the fair value of
these instruments will be recorded in Finance costs as the Company has not elected to apply hedge accounting to
these contracts. For further details, refer to Note 16 in the Interim Consolidated Financial Statements for the three-
month period ended March 31, 2021.
Page 24 • AutoCanada • 2021 First Quarter ReportYou can also read