Characterization of Urban Subway Microenvironment Exposure-A Case of Nanjing in China - MDPI
←
→
Page content transcription
If your browser does not render page correctly, please read the page content below
International Journal of
           Environmental Research
           and Public Health

Article
Characterization of Urban Subway Microenvironment
Exposure—A Case of Nanjing in China
Peng Mao 1 , Jie Li 2 , Lilin Xiong 3 , Rubing Wang 1 , Xiang Wang 1 , Yongtao Tan 4 and
Hongyang Li 5, *
 1    Department of Construction Management, College of Civil Engineering, Nanjing Forestry University,
      Nanjing 210037, China; maopeng@njfu.edu.cn (P.M.); wangrubinghappy@163.com (R.W.);
      yzwx97@163.com (X.W.)
 2    Department of Construction Management and Real Estate, School of Civil Engineering, Shenzhen University,
      Shenzhen 518000, China; lijie20181@email.szu.edu.cn
 3    Department of Environmental Health, Nanjing Municipal Center for Disease Control and Prevention,
      Nanjing 210037, China; hzxionglilin@163.com
 4    Department of Building and Real Estate, The Hong Kong Polytechnic University, Hung Hom, Kowloon,
      Hong Kong 999077, China; yongtao.tan@polyu.edu.hk
 5    Department of Construction Management, School of Civil Engineering and Transportation,
      South China University of Technology, Guangzhou 510641, China
 *    Correspondence: cthyli@scut.edu.cn; Tel.: +86-156-2220-3206

 Received: 18 January 2019; Accepted: 17 February 2019; Published: 20 February 2019

 Abstract: Environmental quality in public rail transit has recently raised great concern, with more
 attention paid to underground subway microenvironment. This research aimed to provide
 guidance for healthy urban subway microenvironments (sub-MEs) according to comprehensive
 micro-environmental categories, including thermal environment, air quality, lighting environment,
 and acoustic environment from both practical and regulation perspectives. Field sampling
 experiments were conducted in Nanjing Metro Line X (NMLX). Descriptive analysis, correlation
 analysis and one-way analysis of variance were used to investigate the status quo of urban sub-MEs.
 A paired samples t-test was then performed to compare among subway station halls, platforms,
 and in-cabin trains based on integrated sub-MEs. Results show that relative humidity, air velocity,
 respirable particulate matter (PM10 ) concentration, and illuminance dissatisfy the requirements in
 relevant national standards. Significant difference was observed in lighting environment between
 station hall and platform. It was detected platforms are warmer and more polluted than train cabins.
 Additionally, subway trains generate main noise on platform which is much louder when leaving
 than arriving. Protective strategies for sub-ME improvement as well as principles for updating
 standards were proposed from a proactive point of view. The findings are beneficial for moving
 towards healthy urban sub-MEs and more sustainable operation of subway systems.

 Keywords: urban subway; microenvironment exposure; field sampling; protective strategies;
 standard update

1. Introduction
     Public rail transit witnesses a remarkable leap forward with the rapid growth of urbanization in
different countries/regions all over the world [1]. The underground subway, due to its efficiency, safety,
and large-scaled passenger capacity, has gradually become one of the most prevalent commuting
modes in rail transit systems [2,3]. According to the Statistics and Analysis Report of Urban Rail
Transit [4], the total passenger volume of rail transit nationwide had increased to 18.48 billion and

Int. J. Environ. Res. Public Health 2019, 16, 625; doi:10.3390/ijerph16040625     www.mdpi.com/journal/ijerph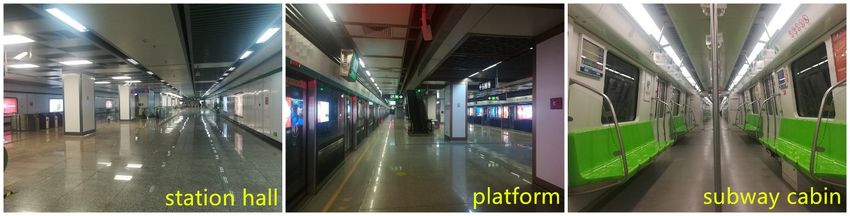
Int. J. Environ. Res. Public Health 2019, 16, 625                                                   2 of 17

there are 3884 km subway lines, at the proportion of 77.2% of urban rail transits, operated in China by
the end of 2017.
      Despite the convenience brought by subway, one serious environmental disadvantage was
observed that different air pollutants may accumulate in such confined space of train cabins where the
commuters typically spend around 75% of their commuting time [5,6]. In recent years, underground
air quality has been more concerned as the concentrations of air pollutants indoors are higher than the
ambient levels even in some matured urban subway systems [7–10]. Furthermore, much of inhalable
particulate matters on subway platforms is actually produced underground—quite different from that
breathed outdoors [11].
      Previous studies have shown that the exposure to underground transport system exacerbates
adverse health effects of passengers, such as acute changes in heart rates, pulmonary dysfunction,
cardiovascular diseases, etc., [12–14]. Besides, Jung et al. [15] confirmed that heavy metals, the major
ingredients of particulate matter (abbreviation PM thereafter) in subway air, pose great threats to
human health.
      Different understandings existed regarding the microenvironment of subways in prior studies.
For instance, it comprises the commuting mode and relevant boarding/alighting facilities (e.g., station
platforms) [16]. Considering the fact that underground transport system exposes urban population
to various sources of air pollution daily, subway commuting together with home and workplace
constitute three main microenvironments compared with the ambient environment [17]. In the current
research, urban subway microenvironments (sub-MEs, including station halls, platforms, and train
cabins), composed of confined spaces, are a special category of indoor microenvironment [18,19].
The stable microenvironment indoors is characterized by fresh air flowing, natural lighting, no noise
disturbing, and comfortable thermal conditions [20].
      Exposure to urban subway microenvironments has drawn much concern since they are relatively
enclosed and poorly ventilated [21]. Studies focusing on field monitoring in subways have increased
extensively. Air pollutants were primarily observed as ascribed to a wide range of sources, such as
traffic emissions, wheels, catenaries, brake pads, and infiltration from out-stations [22]. The volatile
organic compounds (VOCs) concentration inside subway cabins was ranked the second among
different transport modes [23]. Total volatile organic compounds (TVOCs) levels, bacterial levels, and
PM10 concentrations of underground were detected exceeding the stipulated standards as revealed in
the research of Chen et al. [24]. The subway PM concentrations were almost 20% greater than those
in ambient air [25]. Furthermore, studies have been carried out focusing on underground inhalable
particles in subway systems of many other countries and cities like Finland, Mexico, Taipei, and
Barcelona [11,26–28]. A prevailing conclusion has been reached that commuters, on the daily basis,
are exposed to subway microenvironments full of heavy air pollutants. However, most of the existing
studies defined sub-MEs from only one perspective of indoor air quality (particularly PM exposure
in subway systems), an integrated consideration of overall micro-environmental categories is still
lacking. Simultaneously, many scholars, especially in Europe, paid much attention on physicochemical
compositions and their potential health implications from exposure to air pollutants in sub-MEs.
Nawrot et al. [29] suggested traffic-related air pollution could be a vital trigger of heart attacks than
drug abuse for general population. Cheng and Lin [27] proposed that the common subway airborne
particles, including heavy metals, e.g., Ferrum (Fe), Manganese (Mn), Chromium (Cr), Nickel (Ni), and
Cuprum (Cu), can negatively affect human bodies. Karlsson et al. [30] pointed out that geno-toxicity of
underground particles is seven times higher than that in the roadway, leading to increased oxidative
pressure in lung tissues. Besides, it is evidently that in subway air, of which hydrocarbons, fungus and
bacteria, metallic elements, and some additional toxic compositions on different concentration levels
would result in different health risks, such as oxidative stress in lung tissues, excess cancer mortality,
and some other increased diseases [26,31–33]. Nevertheless, the focus of these studies is directed to
post-health effects of air pollutants underground on commuters, failing to prevent environmental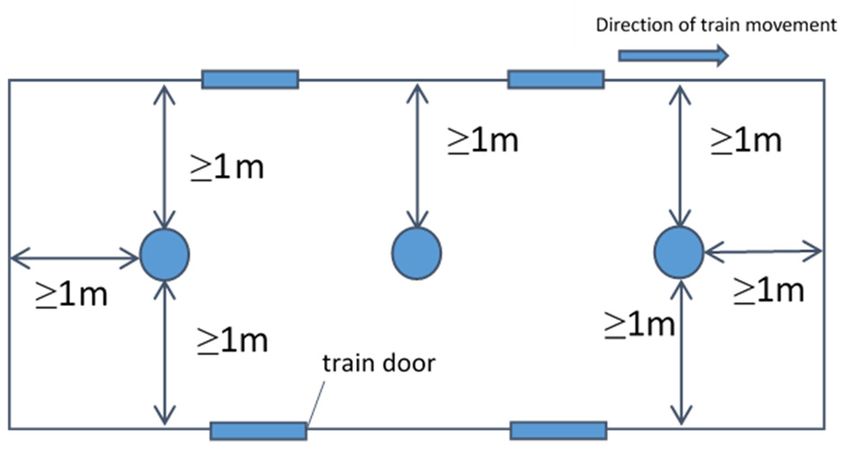
Int. J. Environ. Res. Public Health 2019, 16, 625                                                       3 of 17

issues before they emerge. Hence, it is of great necessity to propose protective strategies according to
various microenvironment categories to mitigate negative impacts in sub-MEs in a proactive manner.
      In practice, though China have promulgated some standards or norms related to indoor air quality
or urban subways, the relevant environmental indicators as well as their standardized thresholds can
hardly match with the variability of the sub-ME nowadays. Ministry of Environmental Protection of
the People’s Republic of China has proposed the revised Ambient air quality standards (GB3095-2012)
in August 2018. However, such a standard only concentrates on ambient air, and no revisions are
underlined in terms of indicators and thresholds. To effectively improve subway microenvironments
and therefore ensure public health, it is essential to formulate an updated and targeted standard on
sub-ME integration.
      Nanjing, one of the most prosperous and densely populated cities in China, is a pioneer where
the urban subway systems are open across on county levels, covering all eleven municipal districts.
There are 10 subway lines and 174 subway stations in Nanjing at present. The total length of lines has
reached 364.3 km, and another fifteen subway lines (1011.2 km) are expected step into operation in
2030 according to Nanjing City Urban Master Plan (2007–2030). It is estimated that the Nanjing subway
system carries over 34 million passengers per day on average, with the peak up to 40.2 million [34].
As a result, underground environmental quality in sub-MEs undoubtedly becomes a pervasive issue
pertaining to public health in Nanjing. Generally, the previous findings suggest exposure of commuters
is individualized due to the heterogeneity of transport system in each city. Tailored studies are needed
by taking into account the field scenarios so that more accurate results could be produced regarding
local transport-related exposure [35].
      The specific objectives of this research are therefore set, as to: (1) investigate the current situations
of urban sub-MEs regarding full micro-environmental categories with field measurement in the city of
Nanjing; (2) characterize disparities of urban sub-MEs among subway station halls, subway platforms,
and in-cabin trains; (3) propose protective strategies for urban sub-MEs improvement according to
different micro-environmental categories; and (4) develop corresponding principles for standards
or norms regarding urban subway microenvironments. The research explores broad thoughts of
operation management to improve microenvironment quality in urban subway systems. The findings
are expected to help step towards healthy urban sub-MEs from a proactive view on practice and
regulation levels and facilitate sustainable operation of subways.

2. Research Process and Methods

2.1. Sampling Area and Sites
      Opened in 2015, Nanjing Metro Line X (NMLX) of 44.9 km in length and with forty-six Model-A
trains (276 carriages in total) in service, was selected as the sampling case. It starts from the Linchang
viaduct station on the north and ends at the East Mozhou Road station on the south—passing several
important transportation hubs, downtown districts, and main residential areas, e.g., Nanjing Railway
Stations, Jiangbei Pukou, Jiangnan Gulou, Xuanwu, etc. Twenty-nine stations established are all
underground with only one exception. Among these stations, there are five interchange ones in
operation, and another eight are still under construction or planning, showing a good function of
transfer interface.
      To ensure the representativeness and generality of the research findings necessitates the selection
of both typical suburban stations and downtown stations as monitoring sites. Another two interchange
stations were also targeted based on the consideration of the functional characteristics. Simultaneously,
all of the chosen stations are located underground, which are relatively enclosed and poorly ventilated.
A random sampling approach was then applied and five trains (thirty carriages) chosen with official
codes as 033034, 049050, 065066, 077078, and 083084 respectively. Details of the monitoring sites and
conditions are shown in Table 1 and the layout of these selected stations illustrated in Figure 1.
Int. J. Environ. Res. Public Health 2018, 15, x FOR PEER REVIEW 4 of 19
Details of the monitoring sites and conditions are shown in Table 1 and the layout of these selected
stations illustrated in Figure 1.
Int. J. Environ. Res. Public Health 2019, 16, 625 4 of 17
Table 1. Detailed information of monitoring sites and conditions.
Station Category Form
Table 1. Detailed information of monitoring sites and conditions.
Xinghuo Road (XHR) Suburban station Underground two-story island
Station Category Underground
Formtwo-story
Nanjing Railway Station (NRS) Interchange station
twin-island
Xinghuo Road (XHR) Suburban station Underground two-story island
Nanjing Nanjing
ForestryRailway
University Xinzhuang
Station (NRS) Interchange station Underground
Underground two-story twin-island
Downtown station two-story island
Nanjing Forestry(NFUX)
University Xinzhuang (NFUX) Downtown station Underground two-story island
Da Xing
Da Xing Gong
Gong (DXG)
(DXG) Interchange
Interchange station Underground
station Undergroundthree-story
three-story island
island
Yu Hua Men
Yu Hua Men (YHM) (YHM) Downtown
Downtown stationstation Underground two-story island
Underground two-story island
West of Shengtai Road (WSTR) Suburban station Underground two-story island
West of Shengtai Road (WSTR) Suburban station Underground two-story island
Figure 1.
Figure 1. Sampling
Sampling Area
Area of
of Line
Line X
X of
of the
the Nanjing
NanjingMetro.
Metro.
2.2. Selection
2.2. Selection of Indicators
of Indicators andand Criteria
Criteria
ManyMany countries
countries havehave established
established their
their own
own nationalstandards
national standards of
of ambient
ambient air
airquality
qualityfollowing
following the
the WHO Air Quality Guidelines, e.g., the Ambient air quality standards of China (GB3095-2012)
WHO Air Quality Guidelines, e.g., the Ambient air quality standards of China (GB3095-2012) [36–38].
[36–38]. Nevertheless, there is great vacancy in broad legally binding force on indoor air quality
Nevertheless, there is great vacancy in broad legally binding force on indoor air quality standards,
standards, let alone that on cabins of vehicles [39]. Chinese government plays a primary role with
let alone thattoon
regard cabins
this issue.of
Tovehicles [39]. Chinese
date, relevant standardsgovernment plays awith
or norms associated primary role
indoor with regard
environments orto this
issue. urban
To date, relevant
subways havestandards or norms
been promulgated associated
nationwide, with
such indoor
as the environments
Hygienic standard for or urban
waiting subways
room
have been promulgated
of public nationwide,
transit means suchthe
(GB9672-1996), as the
CodeHygienic standard
for design of metrofor waiting roomtheofCode
(GB50157-2013), public
fortransit
indoor environmental pollution control of civil building engineering (GB50325-2010),
means (GB9672-1996), the Code for design of metro (GB50157-2013), the Code for indoor environmental and the Urban
rail transit
pollution controllighting
of civil(GB16275-2008). Sampling (GB50325-2010),
building engineering indicators were thenandidentified
the Urbanbased
railon sub-ME
transit lighting
categories in literature retrieval and the current national standards above [19,24,31]. For
(GB16275-2008). Sampling indicators were then identified based on sub-ME categories in literature
experimental quality control, the most rigorous value was selected as the final criterion of indicator
retrieval and the current national standards above [19,24,31]. For experimental quality control, the most
if the standard limits appeared different with each other (Table 2).
rigorous value was selected as the final criterion of indicator if the standard limits appeared different
with each other (Table 2).
Table 2. Sampling indicators and criteria of urban subway microenvironments.
Sub-ME Category Indicator Unit Standard Limit
Temperature ◦C 24–28 (in summer)
Thermal environment Relative humidity % 70
Air velocity m s−1 0.5
CO2 % 0.15
CO mg m−3 10
Air quality PM10 mg m−3 0.25
TVOC mg m−3 0.5
Airborne bacteria CFU per dish 75
200 (station hall)
Lighting environment Illuminance lx
100 (platform)
70 (no trains running)
Acoustic environment Noise level a dB(A) 80 (trains arriving)
80 (trains leaving)
a Noise level refers to equivalent consecutive sound level A (LAeq).Int. J. Environ. Res. Public Health 2019, 16, 625 5 of 17
2.3. Sampling Instruments
To avoid measurement errors, professional instruments were used to monitor sampling indicators.
Digital thermometer, model Testo 625 (TESTO Instrument Co., Ltd., Shanghai, China), was able to
measure temperature and relative humidity (RH) with an accuracy of ±0.5 ◦ C and ±2.5% RH. Air
velocity was monitored using an anemometer, model 9565-X (TSI, TN, USA) with the top value up
to 10.16 m s−1 . By using a set of portable CO2 analyzer, i.e., model GXH-3010E (Institute of Beijing
HUAYUN Analytical Instrument Co., Ltd., Beijing, China), CO analyzer, model GXH-3011A (Institute
of Beijing HUAYUN Analytical Instrument Co., Ltd., Beijing, China) and laser dust meter, model
LD-3C(B) (Beijing Greenwood Innovative Digital Technology Co. Ltd., Beijing, China), we measured
real-time CO2 , CO, and PM10 mass concentrations underground. As for two more indicators regarding
(1) air quality, TVOC was monitored using multifunctional portable environmental quality inspection
system instrument (Gray Wolf Sensing Solutions, LLC, Shelton, CT, USA) within 10% accuracy; and
(2) airborne bacteria were sampled by numerous transparent petri dishes which were treated with
high temperature steam produced by autoclave sterilizer. An extra 240-litre incubator, model BD240
(BINDER GmbH Headquarters, Tuttlingen, Deutschland), was then used for bacterial culture after
the field sampling. The colony counting was conducted after 48-hour-culture at 37 ◦ C. In addition,
an illumination photometer, model TES-1332A (TES Electrical Electronic Corp., Taipei, China) was
used for illuminance samplings in subway lighting environment while a noise dosimeter, model
AWA5610D (Hangzhou Aihua Instruments Co. Ltd., Hangzhou, China) measure noise levels in its
acoustic environment. Before field sampling, the instruments were well prepared in their exclusive
containers and each kind of instruments was carried by an investigator, who had been rigorously
trained for instrumental calibrations and operations.
Int. J. Environ. Res. Public Health 2018, 15, x FOR PEER REVIEW 6 of 19
2.4. Measurements and Quality Control
The field samplings in three categories of sub-MEs (i.e., thermal environment, air quality,
2.4. Measurements and Quality Control
and lighting environment) were conducted in station halls, platforms and subway cabins (Figure 2).
The field samplings in three categories of sub-MEs (i.e., thermal environment, air quality, and
This research
lightingfollows the current
environment) standard
were conducted of subway
in station acoustic
halls, platforms and environment,
subway cabins (Figureviz. 2).the
ThisAcoustical
Requirement andfollows
research Measurement
the currenton Stationof Platform
standard of Urban
subway acoustic Rail Transit
environment, viz. the(GB14227-2006)
Acoustical and
Requirement and Measurement on Station Platform of Urban Rail Transit
concentrates on platform situation when monitoring acoustic environment. Besides, the noises on (GB14227-2006) and
concentrates on platform situation when monitoring acoustic environment. Besides, the noises on
platforms are found in the pilot study that they are commonly composed of e.g., subway trains arriving
platforms are found in the pilot study that they are commonly composed of e.g. subway trains
or leaving,arriving
out screen broadcasting,
or leaving, talking noises,
out screen broadcasting, talkingand even
noises, andshoes clattering
even shoes ofofpassengers.
clattering passengers.
Figure
Figure 2. SamplingSites
2. Sampling Sites of
of Nanjing
Nanjing Metro
MetroLine
LineX (NMLX).
X (NMLX).
The whole process of sampling point selection and measurements in sub-MEs are rigorously in
The whole process of sampling point selection and measurements in sub-MEs are rigorously in
line with the latest national standards, including the Examination methods for public places—Part 1:
line with the latestparameters
physical national standards, including
(GB/T18204.1-2013), the Examination
the Examination methods methods
for publicforplaces—Part
public places—Part
2: 1:
physical parameters (GB/T18204.1-2013),
Chemical pollutant (GB/T18204.2-2014), thethe Examination
Examination methods methods for scrutiny—Part
for public places public places—Part
3: 2:
Airborne microorganism
Chemical pollutant (GB/T18204.3-2013),
(GB/T18204.2-2014), the Examination
the Examination methods
methods forfor publicplaces
public places—Part 6:
scrutiny—Part 3:
Technical specifications of health monitoring (GB/T18204.6-2013), and the Acoustical requirement
Airborne microorganism (GB/T18204.3-2013), the Examination methods for public places—Part 6:
and measurement on station platform of urban transit (GB14227-2006), where the measurements are
Technical incompliance
specifications withof health
those of themonitoring (GB/T18204.6-2013), and the Acoustical requirement
limit values selected.
and measurement on station
According platformabove,
to the standards of urban transit
at least three(GB14227-2006),
sampling points arewhere thewith
required measurements
an air are
monitoring
incompliance area over
with those 1000limit
of the m2. Hence,
valuesthe selected.
points based on indoor depth were selected, and those of
station halls and platforms were aligned vertically. Same points were distributed with regard to
According to the standards above, at least three sampling points are required with an air
illuminance monitored, while they were separately designed for acoustic measurement. When the
monitoring area over 1000 m 2 . Hence, the points based on indoor depth were selected, and those
noise was monitored, it was positioned at the middle of the platform with one meter away from
screen doors. As for sub-MEs in cabins, we experimented in two head carriages as well as a body
carriage of each train, where sampling points were similarly located to those in stations halls or
platforms. Three points were then selected based on the length of carriage. Detailed distributions of
the sampling points are shown in Figure 3.The whole process of sampling point selection and measurements in sub-MEs are rigorously in
line with the latest national standards, including the Examination methods for public places—Part 1:
physical parameters (GB/T18204.1-2013), the Examination methods for public places—Part 2:
Chemical pollutant (GB/T18204.2-2014), the Examination methods for public places scrutiny—Part 3:
Airborne microorganism (GB/T18204.3-2013), the Examination methods for public places—Part 6:
Int. J. Environ. Res. Public Health 2019, 16, 625 6 of 17
Technical specifications of health monitoring (GB/T18204.6-2013), and the Acoustical requirement
and measurement on station platform of urban transit (GB14227-2006), where the measurements are
incompliance with those of the limit values selected.
of station halls and platforms
According were above,
to the standards aligned vertically.
at least Same points
three sampling were
points are distributed
required with regard to
with an air
illuminance monitored,
monitoring area overwhile
1000 m they were separately designed for acoustic measurement. When the
2. Hence, the points based on indoor depth were selected, and those of
noise wasstation halls and platforms were aligned vertically. Same points were distributed with regard to
monitored, it was positioned at the middle of the platform with one meter away from screen
illuminance monitored, while they were separately designed for acoustic measurement. When the
doors. Asnoise for sub-MEs
was monitored,in cabins, we experimented
it was positioned in of
at the middle twothehead carriages
platform with oneas wellaway
meter as afrom
body carriage of
each train, where sampling points were similarly located to those in stations halls
screen doors. As for sub-MEs in cabins, we experimented in two head carriages as well as a body or platforms. Three
carriage of each train, where sampling points were similarly located to those in stations
points were then selected based on the length of carriage. Detailed distributions of the sampling points halls or
platforms. Three points were then selected based on the length of carriage. Detailed distributions of
are shown in Figure 3.
the sampling points are shown in Figure 3.
Int. J. Environ. Res. Public Health 2018, 15, x FOR PEER REVIEW 7 of 19
(a) Sampling point distributions in thermal environment, air quality and lighting environment
Int. J. Environ. Res. Public Health 2018, 15, x FOR PEER REVIEW 7 of 19
in station halls and platforms.
(b) Sampling point distributions in thermal environment, air quality and lighting environment
(b) Sampling
in train point distributions in thermal environment, air quality and lighting environment
cabins.
in train cabins.
(c) Sampling point distributions in acoustic environment on platforms.
(c) Sampling point distributions
3. Distributions pointsinin acoustic environment on platforms.
Figure
Figure 3. Distributionsofofsampling
sampling points in subway
subway station
station halls,halls, platforms
platforms and cabins.
and cabins.
Figure 3. Distributions of sampling points in subway station halls, platforms and cabins.
According According
to Figure to Figure
3, we3, we conducted the
conducted thesampling
sampling in point coding coding
in point order, and monitored
order, and monitored
ME-indicators simultaneously at each point. Subway cabins were monitored in time intervals before
ME-indicators simultaneously at each point. Subway cabins were monitored
According to Figure 3, we conducted the sampling in point coding order, and monitored in time intervals before
we arrived at the next sampling location. Since the experiments were conducted in ventilation
ME-indicators
we arrivedseason,
at theit was simultaneously
nextventilation
sampling at each
location. point. Subway cabins were monitored in time intervals before
systems rather Since the experiments
than cooling were conducted
systems of air conditioning that wereinoperated
ventilation season,
we arrived at the next sampling location. Since the experiments were conducted in ventilation
it was ventilation
at the time systems
of sampling. rather than
Besides, cooling
no air curtain systems
was opened ofatair
theconditioning
entrance of eachthat were
station hall. operated
All at the
season, it was ventilation systems rather than cooling systems of air conditioning that were operated
platforms were
time of sampling. equipped
Besides, no withcurtain
air screen doors.
was opened at the entrance of each station hall. All platforms
at the time of sampling. Besides, no air curtain was opened at the entrance of each station hall. All
Measurement at each point was tested via collocated sampling. Side-by-side comparisons were
were equipped
platformswithwerescreen
equipped doors.
with screen doors.
made twice for samplings in sub-ME of thermal environment, air quality, and lighting environment.
MeasurementMeasurement
at each at each
point point
was was tested via
tested via collocated sampling. Side-by-side comparisons were
Following the standard operation procedures incollocated
the Acoustical sampling.
Requirement Side-by-side
and Measurement comparisons
on were
made twice for samplings in sub-ME of thermal environment, air quality, and lighting environment.
made twice for samplings in sub-ME of thermal environment, air quality, and lighting environment.
Station Platform of Urban Rail Transit (GB14227-2006), noise was monitored
Following the standard operation procedures in the Acoustical Requirement and Measurement on
individually regarding
acoustic environment. It was sampled ten separate times when trains were arriving and leaving
FollowingStation
the standard
Platform of operation procedures
Urban Rail Transit in the noise
(GB14227-2006), Acoustical Requirement
was monitored individually and Measurement on
regarding
platforms. Moreover, equivalent consecutive sound level A (LAeq) under the circumstance of no
acoustic environment.
Station Platform of Urban It was
Rail sampled
Transit ten separate timesnoise
(GB14227-2006), when was
trains monitored
were arrivingindividually
and leaving regarding
trains passing was monitored as fundamental noise levels on platforms. Specifically, it was
platforms. Moreover, equivalent consecutive sound level A (LAeq) under the circumstance of no
acoustic environment.
monitored five times It was
whensampled ten separate
screen broadcast was on, andtimes when
another fivetrains were arriving
with broadcast off. Mean and leaving
trains passing was monitored as fundamental noise levels on platforms. Specifically, it was
value was finally
platforms.monitored
Moreover, calculated for sampling measurement of each sub-ME under
indicator.
five times when screen broadcast was on, and another five with broadcast off. Mean of no trains
equivalent consecutive sound level A (LAeq) the circumstance
The sampling experiment was conducted without impact on daily passengers commuting in
passing was
valuemonitored as fundamental
was finally calculated for sampling noise levels on
measurement platforms.
of each Specifically, it was monitored five
sub-ME indicator.
NMLX. It was assisted by specialists from Nanjing Municipal Center for Disease Control and
times when The sampling
screen during experiment
broadcast was
was samplingconducted
on, and process. without
anotherWefive impact on
with all daily
broadcastpassengers commuting
off.at Mean valuein was finally
Prevention the whole collected air samples the height of
NMLX. It was assisted by specialists from Nanjing Municipal Center for Disease Control and
calculatedPrevention
for sampling
breathing measurement
zone (0.5–1.5 of
m) [40]. Similarly,each sub-ME
when indicator.
illuminance and noise levels were monitored, the
during the whole sampling process. We collected all air samples at the height of
sampling
The breathing
sampling inlets of instrumentswas
experiment wereconducted
located at roughly 1.5 meters
without above on
impact the ground. passengers
For validity of
zone (0.5–1.5 m) [40]. Similarly, when illuminance and noise levelsdaily
were monitored, the commuting
air samples, instruments were kept off the zones with strong wind, such as ventilation shafts, air
in NMLX.sampling
It was
outlets,
inlets of instruments
andassisted
were located
by specialists
screen door-sides, and keptfrom
at roughly
Nanjing
at least
1.5 meters
one meter
above the ground.for
Municipal
away from Center
ForDisease
walls or carriage
validity ofControl and
bodies.
air samples, instruments were kept off the zones with strong wind, such as ventilation shafts, air
Moments of passengers on and off were shunned in terms of cabin samplings. Furthermore, the
outlets, and screen door-sides, and kept at least one meter away from walls or carriage bodies.
sampling time selected was reasonable, as it avoided rainy days and daily rush hours (7.00–9.00 a.m.
Moments of passengers on and off were shunned in terms of cabin samplings. Furthermore, the
and 17.00–19.00 p.m.). All instruments were seriously zero-calibrated before each measurement
sampling time selected was reasonable, as it avoided rainy days and daily rush hours (7.00–9.00 a.m.
carried out at sampling locations. Monitors at one point were set to around 6-s sampling intervals
and 17.00–19.00 p.m.). All instruments were seriously zero-calibrated before each measurement
carried out at sampling locations. Monitors at one point were set to around 6-s sampling intervalsInt. J. Environ. Res. Public Health 2019, 16, 625 7 of 17
Prevention during the whole sampling process. We collected all air samples at the height of breathing
zone (0.5–1.5 m) [40]. Similarly, when illuminance and noise levels were monitored, the sampling inlets
of instruments were located at roughly 1.5 m above the ground. For validity of air samples, instruments
were kept off the zones with strong wind, such as ventilation shafts, air outlets, and screen door-sides,
and kept at least one meter away from walls or carriage bodies. Moments of passengers on and off
were shunned in terms of cabin samplings. Furthermore, the sampling time selected was reasonable,
as it avoided rainy days and daily rush hours (7.00–9.00 a.m. and 17.00–19.00 p.m.). All instruments
were seriously zero-calibrated before each measurement carried out at sampling locations. Monitors
at one point were set to around 6-s sampling intervals [37]. The data obtained were timely logged
by trained lab assistants. All measurements of sub-MEs were completed on the same day in order to
avoid ambient influence on the daily basis.
2.5. Data Analysis
All the data shown in mean ± standard deviation (SD), were measured within their individual 95%
confidence interval. By using SPSS version 22.0 (IBM, Armonk, NY, USA), we firstly used descriptive
statistics to illustrate the current situations of urban sub-MEs in typical station halls, platforms, and
in-cabin trains. Correlation analysis via Spearman correlation coefficient was adopted to explore
the correlations of various sub-ME monitoring indicators and significance was defined as p < 0.01.
One-way analysis of variance (ANOVA) was used to make sub-ME comparisons according to station
types, i.e., suburban station, interchange station, and downtown station. We then performed a paired
samples t-test to test differences in sub-MEs of station halls versus platforms, platforms versus trains,
and various acoustic environments on platforms. Significance was defined as p < 0.05.
3. Results
3.1. Status quo of sub-MEs in NMLX
Table 3 illustrates the current sub-ME situations of different stations in NMLX. Among the six
stations selected, indicators, with values satisfying the thresholds set in relevant standards or norms
in China, are temperature, CO2 concentration, CO concentration, TVOC concentration, total count of
airborne bacteria, and noise levels. Relative humidity (RH) was found exceeding the limit easiest in
subway thermal environment. Over 50.0% of station halls and platforms experienced high RH out
of limits, with the top of 73.7% (SD = 5.5%) in station hall of NFUX station. Regarding air quality
underground, it is worth noticing that beyond-standard PM10 concentration simultaneously occurred
in station halls as well as platforms of YHM station and WSTR station. Meanwhile, we found PM10
on platforms seemed much serious than that in station halls. PM10 concentration on YHM platform
(Mean = 0.336 mg m−3 , SD = 0.035 mg m−3 ) was monitored around 1.3 times of that in its station
hall (Mean = 0.259 mg m−3 , SD = 0.023 mg m−3 ). Similarly, PM10 concentration on WSTR platform
(Mean = 0.362 mg m−3 , SD=0.113 mg m−3 ) was approx. 1.1 times higher than that in the upper
station hall (Mean = 0.338 mg m−3 , SD = 0.198 mg m−3 ). Substandard lighting environment was
commonly found in both station halls and platforms. More than 80% of stations were monitored,
whose illuminance of station halls was lower than that recommended in the standards. Station hall of
YHM station tolerated the most terrible rayless light among the six, with average illuminance of 59.2 lx
(SD = 57.2 lx). Besides, we sampled poor illuminance, which was below the recommended value,
on around half of platforms, including NFUX, YHM, and WSTR station. The most uncomfortable
lighting environment on platforms existed in WSTR station, the average illuminance of which was
measured only 35.0 lx (SD = 3.7 lx). It was not detected quite noisy hubbub on each platform of subway
stations. Average of noise levels under three conditions, viz. no trains, train arriving, and train leaving,
was no more than the lowest standard limit of 70 dB(A). When compared with station halls and platforms,
better sub-MEs were recorded in cabins of carriages, where all ME-indicators measured conformed to the
standard except RH (Mean = 70.2%, SD = 0.7%) in their thermal environment (Table 3).Int. J. Environ. Res. Public Health 2019, 16, 625 8 of 17
Table 3. Current sub-ME situations of station halls, platforms and train cabins in Nanjing Metro Line X (NMLX).
Temperature Relative Humidity Air Velocity CO2 CO PM10 TVOC Airborne Bacteria Illuminance Noise Level a
Station Site
◦C % m s−1 % mg m−3 mg m−3 mg m−3 CFU Per Dish lx dB(A)
Station hall 26.2 ± 0.1 70.0 ± 0.1 0.18 ± 0.09 0.030 ± 0.000 0.3 ± 0.2 0.068 ± 0.007 0.09 ± 0.00 2.3 ± 0.8 208.5 ± 57.7 N/A
XHR c
Platform 26.7 ± 0.1 69.6 ± 0.2 0.24 ± 0.09 0.031 ± 0.001 0.3 ± 0.2 0.075 ± 0.009 0.09 ± 0.00 2.3 ± 1.8 182.4 ± 24.5 66.1 ± 8.6
Station hall 26.8 ± 0.1 70.2 ± 0.1 b 0.13 ± 0.07 0.061 ± 0.004 0.3 ± 0.1 0.083 ± 0.008 0.10 ± 0.00 6.3 ± 2.5 166.3 ± 63.1 b N/A
NRS c
Platform 27.4 ± 0.4 69.8 ± 0.4 0.30 ± 0.23 0.057 ± 0.004 0.2 ± 0.1 0.110 ± 0.024 0.11 ± 0.00 6.0 ± 4.3 123.5 ± 9.9 67.5 ± 7.9
Station hall 26.5 ± 0.3 73.7 ± 5.5 b 0.35 ± 0.18 0.051 ± 0.002 0.4 ± 0.1 0.086 ± 0.010 0.11 ± 0.00 5.0 ± 4.2 67.0 ± 24.3 b N/A
NFUX c
Platform 25.7 ± 0.2 70.3 ± 0.4 b 0.54 ± 0.39 b 0.047 ± 0.001 0.3 ± 0.1 0.107 ± 0.033 0.11 ± 0.00 3.7 ± 2.3 54.9 ± 7.5 b 68.7 ± 7.4
Station hall 27.7 ± 0.1 69.8 ± 0.1 0.28 ± 0.16 0.059 ± 0.007 0.3 ± 0.1 0.211 ± 0.113 0.10 ± 0.00 7.5 ± 1.5 177.2 ± 97.4 b N/A
DXG c
Platform 26.9 ± 0.2 70.5 ± 0.1 b 0.08 ± 0.04 0.053 ± 0.004 0.3 ± 0.1 0.121 ± 0.008 0.11 ± 0.00 15.3 ± 7.2 103.7 ± 15.5 66.7 ± 5.7
Station hall 27.0 ± 0.1 70.4 ± 0.1 b 0.34 ± 0.15 0.038 ± 0.001 0.9 ± 0.1 0.259 ± 0.023 b 0.09 ± 0.00 4.2 ± 1.2 59.2±57.2 b N/A
YHM c
Platform 27.3 ± 0.4 70.6 ± 0.4 b 0.37 ± 0.25 0.038 ± 0.002 0.6 ± 0.1 0.336 ± 0.035 b 0.09 ± 0.00 4.0 ± 1.8 84.4 ± 23.0 b 68.7 ± 4.0
Station hall 26.0 ± 0.1 71.1 ± 0.1 b 0.50 ± 0.34 0.037 ± 0.001 0.3 ± 0.1 0.338 ± 0.198 b 0.09 ± 0.00 4.5 ± 3.0 134.8 ± 36.6 b N/A
WSTR c
Platform 26.7 ± 0.2 70.4 ± 0.2 b 0.23± 0.10 0.038 ± 0.010 0.1 ± 0.1 0.362 ± 0.113 b 0.10 ± 0.00 4.3 ± 2.7 35.0 ± 3.7 b 65.6 ± 10.1
- Train cabin 26.6 ± 0.4 70.2 ± 0.7 0.30 ± 0.11 0.037 ± 0.005 0.2 ± 0.1 0.050 ± 0.017 0.10 ± 0.02 2.1 ± 1.2 566.4 ± 34.9 N/A
aAverage noise under three conditions with no trains running, pulling in and out. b Dissatisfying the standard limits in Table 2. c Abbreviations: XHR, Xinghuo Road Station; NRS,
Nanjing Railway Station; NFUX, Nanjing Forestry University Xinzhuang Station; DXG, Da Xing Gong Station; YHM, Yu Hua Men Station; WSTR, West of Shengtai Road Station.Int. J. Environ. Res. Public Health 2019, 16, 625 9 of 17
3.2. Correlations of sub-ME Monitoring Indicators
In order to further explore the monitoring indicators, correlation analysis was conducted among
these thermal and air quality factors using Spearman coefficient (rs). Table 4 indicates that temperature
was positively related to PM10 and TVOC in a low degree (rs = 0.329, 0.389 respectively) (p < 0.01).
Moreover, a low positive correlation was observed between humidity and carbon oxides (i.e., CO and
CO2 ) (rs = 0.328, 0.433 respectively) (p < 0.01). Besides, humidity was nonlinearly related to airborne
bacteria (rs = 0.213) (p < 0.01). However, a moderate negative correlation existed between humidity
and TVOC (rs =−0.568) (p < 0.01).
Table 4. Correlation of thermal and air quality environment monitoring indicators.
Monitoring Indicators Temperature Humidity Air Velocity
CO2 −0.050 0.328 ** −0.059
CO −0.141 0.433 ** 0.011
PM10 0.329 ** −0.116 −0.118
TVOC 0.389 ** −0.568 ** 0.058
Airborne bacteria 0.038 0.213 ** −0.122
** Difference is significant at the p < 0.01 level (2-tailed).
3.3. Comparison of sub-MEs among Station Hall, Platform, and Train Cabin
Station halls and platforms were classified in the Code for design of metro (GB50157-2013) into
underground public zones, whose interior comparison regarding sub-MEs is indicated in Table 5.
Lighting environments between station hall and platform were significantly different based on spatial
variability. In other words, the average of illuminance in six station halls of 135.5 lx (SD = 79.5 lx)
were much higher than that in six platforms (Mean = 97.3 lx, SD = 50.9 lx) (p < 0.05). Nevertheless,
no significant nuance was monitored between station halls and platforms with respect to thermal
environment and air quality.
Table 5. Comparison of thermal environment, air quality, and lighting environment between station
hall and platform in Nanjing Metro Line X (NMLX).
Relative Air Airborne
Temperature CO2 CO PM10 TVOC Illuminance
Site Humidity Velocity Bacteria
◦C CFU Per
% m s−1 % mg m−3 mg m−3 mg m−3 lx
Dish
Station hall 26.7 ± 0.6 70.9 ± 2.5 0.30 ± 0.21 0.046 ± 0.012 0.4 ± 0.3 0.174 ± 0.135 0.10 ± 0.01 5.0 ± 2.8 135.5 ± 79.5
Platform 26.8 ± 0.6 70.2 ± 0.5 0.29 ± 0.25 0.044 ± 0.010 0.3 ± 0.2 0.185 ± 0.128 0.10 ± 0.01 5.9 ± 5.7 97.3 ± 50.9
p-value 0.752 0.134 0.967 0.444 0.080 0.721 0.227 0.362 0.018 *
* Difference is significant at the p < 0.05 level (2-tailed).
Comparisons of indicators were then analyzed to illustrate the difference in sub-MEs between
platforms and train cabins with the same depth and carrying a large flow of passengers on the daily
basis (Table 6). Based on statistics, temperature was the only thermal indicator, indicating significant
difference between platforms and cabins. It was detected warmer on platforms (Mean = 26.8 ◦ C,
SD = 0.6 ◦ C) than in train cabins (Mean = 26.6 ◦ C, SD = 0.4 ◦ C) (p < 0.05), as different temperatures
were set separately by air conditionings in these two locations when conducting the field sampling.
Regarding air quality, carbon oxides including CO2 and CO on platforms of 0.044% (SD = 0.010%)
and 0.3 mg m−3 (SD = 0.2 mg m−3 ) were around 18% and 33% heavier than those in cabins with
concentrations of 0.037% (SD = 0.005%) and 0.2 mg m−3 (SD = 0.1 mg m−3 ), respectively (p < 0.05).
Likewise, underground platform PM10 concentration of 0.185 mg m−3 (SD = 0.128 mg m−3 ) were
significantly higher than that inside trains of 0.050 mg m−3 (SD = 0.017 mg m−3 ) (p < 0.05), and we
also found the total count of airborne bacteria on platforms (Mean = 5.9 CFU per dish, SD = 5.7 CFU
per dish) much more than that in cabins of carriages (Mean = 2.1 CFU per dish, SD = 1.2 CFU per dish)Int. J. Environ. Res. Public Health 2019, 16, 625 10 of 17
(p < 0.05). Regarding the sub-ME of lighting environment underground, it was however brighter in
train cabins, with illuminance of 566.4 lx (SD = 34.9 lx), as compared with platforms whose illuminance
was monitored as 97.3 lx (SD = 50.9 lx) (p < 0.05).
Table 6. Comparison of thermal environment, air quality, and lighting environment between platform
and cabin in Nanjing Metro Line X (NMLX).
Relative Air Airborne
Temperature CO2 CO PM10 TVOC Illuminance
Site Humidity Velocity Bacteria
◦C CFU Per
% m s−1 % mg m−3 mg m−3 mg m−3 lx
Dish
Platform 26.8 ± 0.6 70.2 ± 0.5 0.31 ± 0.24 0.044 ± 0.010 0.3 ± 0.2 0.185 ± 0.128 0.10 ± 0.01 5.9 ± 5.7 97.3 ± 50.9
Cabin 26.6 ± 0.4 70.2 ± 0.7 0.30 ± 0.11 0.037 ± 0.005 0.2 ± 0.1 0.050 ± 0.017 0.10 ± 0.02 2.1 ± 1.2 566.4 ± 34.9
p-value 0.020 * 0.706 0.802 0.001 * 0.045 * 0.000 * 0.616 0.000 * 0.000 *
* Difference is significant at the p < 0.05 level (2-tailed).
As for the sub-ME of acoustic environment on station platforms, significant difference was found
between conditions with and without train running (p < 0.05), which illustrates that noises generated
from train arriving or leaving are the primary hubbub underground. Simultaneously, on the six
platforms monitored apart from DXG station, it was much noisier when trains were leaving than
arriving (p < 0.05). Table 7 summarizes the results.
Table 7. Comparison of acoustic environment among six subway platforms in Nanjing Metro Line X
(NMLX).
XHRa NRS a NFUX a DXG a YHM a WSTR a
Whether Or Not Train Running
Train running 71.9 ± 0.7 72.6 ± 1.7 72.6 ± 0.9 69.5 ± 1.8 71.2 ± 1.2 71.1 ± 1.1
No train running 54.6 ± 4.2 57.2 ± 4.3 60.8 ± 8.4 61.1 ± 6.9 63.7 ± 2.4 54.6 ± 11.2
p-value 0.000 * 0.000 * 0.000 * 0.004 * 0.000 * 0.001 *
Periods
Train arriving 71.4 ± 0.1 71.6 ± 1.9 72.0 ± 0.7 68.2 ± 1.3 70.4±0.9 70.2 ± 0.6
Train leaving 63.5 ± 9.6 65.4 ± 8.9 67.0 ± 8.7 66.0 ± 6.9 67.9 ± 4.6 63.3 ± 11.8
p-value 0.002 * 0.007 * 0.020 * 0.185 0.025 * 0.016 *
a Abbreviations: XHR, Xinghuo Road Station; NRS, Nanjing Railway Station; NFUX, Nanjing Forestry University
Xinzhuang Station; DXG, Da Xing Gong Station; YHM, Yu Hua Men Station; WSTR, West of Shengtai Road Station.
* Difference is significant at the p < 0.05 level (2-tailed).
4. Discussion
4.1. Improvements in Different sub-MEs
To improve the urban subway microenvironment requires categorizing environment types
indoors [39]. In this research, Sub-MEs comprise an integration of thermal environment, air quality,
lighting environment, and acoustic environment. We identify causes of indicators failed to meet the
national standards and establish protective strategies for betterment purpose.
Poor air circulation is the dominant reason for high RH underground regarding the thermal
environment of NMLX. There are also a wide range of moisture from people, facilities, subway
envelopes, above ground, etc. [39]. NRS and NFUX are the two stations near urban water areas, it is
therefore easy for hot humid air from outside to flow in through the entrances into subway station
halls. Meanwhile, sampling points where RH exceeds the standardized limit detected are commonly
the hygroscopic sites close to washrooms, tool-rooms, or below supply-air outlets of air-conditionings.
Hence, dehumidification is proposed as the priority to subway thermal environment, especially to
those sensitive sites with high humidity. It occasionally happens that air velocity surpasses the standard
value, attributed to settings and amounts of ventilation devices. Changes of air flow from the outsideInt. J. Environ. Res. Public Health 2019, 16, 625 11 of 17
to NMLX indoors mainly depend on central air-conditionings, and their operation conditions therefore
play a direct role in air velocity. This is considered as one of key indicators affecting human comfort in
enclosed areas underground. It probably results in many adverse symptoms for human being with
high air velocity, such as vasoconstriction, muscle and joint aches, and even diarrhea [41]. Therefore,
increase in human comfort as well as decrease in health risks could be both achieved if air velocity
underground is reasonably adjusted by central HVAC systems in urban sub-MEs.
Regarding air quality, PM10 is the major pollution indicator in YHM and WSTR station, whose
entrances are adjacent to traffic intersections. PM concentrations in station halls of these two stations
fluctuated more easily due to automobile gas emissions on the ground. Similar conclusion was
drawn in the research of Li et al. [16] that in-train PM concentration is likely influenced by vehicle
exhausts when metro lines is beside a high traffic road. Additionally, no use of air-conditionings in
ventilation seasons may aggravate high PM10 concentrations in subway station halls and platforms
to some extent. Similarly, Vânia Martins et al. demonstrated that ventilation and air conditioning
systems could improve subway air quality [11]. Non-ambient sources are main significant contributors
to total metro PM exposure [31,42], including emissions from rail mechanical abrasion, and dust
particle resuspensions from passenger activities [5,43]. It is therefore recommended to adopt some
air protective solutions in station halls or platforms, such as utilizing air sterilization apparatus,
strengthening dustproof function through grid design, installing platform screen doors (PSD), and
reducing combustion sources as much as possible [35]. On the contrary, PM10 in train cabins which
are air conditioned is lighter than that in station halls and platforms—consistent with the findings
of Moreno et al. [10], V. Mugica-Álvarez et al. [28] and Querol et al. [44] that the filtration of air
conditioning helps in lower PM concentrations. Similarly, in-cabin PM2.5 exposure was also detected
lighter than stations in a measurement campaign for Shanghai subway in 2015 [45]. Placement of
dustbins could be another explanation for excessive PM levels, since they were found located next
to all points of YHM and WSTR where PM10 concentrations were monitored exceeding borderlines
in field sampling. As Moreno and Miguel [6] stated, platforms or even tunnels should be cleaned
regularly to avoid the build-up of particulates and underground night work teams contribute greatly
to minimize fugitive dusts.
Lighting environment of sub-MEs is largely associated with quantities of lamps opened.
For energy saving, only half or even less the number of lamps were turned on in some station hall
or platform of NMLX. The design of interchange DXG is not in line with people-oriented principles
with low illuminance supplied for large flows of passengers. As a result, lighting comfort should
be the basis to save electrical energy during lamp management underground. Apart from controls
on the quantities of lamp opened, more intelligent designs linked to subway lighting environment
could be conducted for the balance between energy saving and lighting comfort, e.g., to increase the
transparency of lampshades, to choose lamps with high optical efficiency, or to apply smart building
lighting systems according to real-time passenger scales.
Rolling noise commonly generates from the roughness of wheel and rail surfaces or piston effect
when the subway runs [46,47]. Although the noise monitored on each platform in NMLX is lower
than the maxima in standards, some inspectors complained they suffered from tinnitus or other ear
problems after a long work period on subway platforms. It is confirmed the long-term exposure to
noisy environment results in noise-induced hearing loss and gradually, dysfunction in human nervous
system along with symptoms of daytime fatigue, hypertension, neurasthenia and so forth [48,49].
Therefore, subway operation companies should assume the responsibility to rearrange reasonable
work time for the inspectors and to provide them with ear protectors and regular occupational health
examinations due to their special work environment underground. Meanwhile, it is also imperative to
optimize designs or increase amounts of mufflers to minimize rolling noise in subway tunnels.Int. J. Environ. Res. Public Health 2019, 16, 625 12 of 17
4.2. Future Directions of sub-MEs Standards
Despite of the similarity with confined indoor microenvironment of a building, sub-ME
shows quite difference with commuters exposed during their short subway trips [50]. Therefore,
the elaboration of future standards or norms related to urban subway microenvironment should
resort to its disparity as mentioned above. Many countries/regions have promulgated ambient air
quality standards within legal framework so as to protect public health [51]. In contrast, there are
few international standards systematically categorizing subway microenvironments underground.
Meanwhile, by comparing the field measurements and those standardized in this research, several
defects were found in the current national standards related to subway environments, such as
incomplete information, antiquated versions, and poor pertinence to sub-MEs. It is therefore required
to take integration, people-orientation, and precision as the principles when updating the standards or
norms of sub-MEs in the future.
First, it is desirable to establish standards integrating all-round indicators. In recent years,
many researches have focused on concentration distributions of fine particulate matter, viz. PM2.5
in underground subways [52–54]. However, thresholds of underground PM2.5 is not included in
any of the existing standards. Actually, it is full of heavy metal which may increase health risks
of human being [35,55]. Meanwhile, high PM2.5 -to-PM10 ratios of over 50% were prior detected
in many subway microenvironments [31,56,57]. These facts might undoubtedly stimulate future
revisions in sub-ME-related standards. Currently, there is an exclusive requirement stated in the
Ambient Air Quality Standards (GB3095-2012) that class B of air quality corresponds to average
PM2.5 concentrations of 75 µg m−3 or less, while class A represents average PM2.5 concentrations
of 35 µg m−3 or less [37]. Nevertheless, such a standard is more applicable to outdoor ambient air
above ground and plays very limited role assessing concentration of underground PM2.5 in sub-MEs.
The situation is reflected by our present cognitions on microenvironment indoors that substantially
lags behind that outdoors [58]. In addition, there is no exposure limit of TVOC regulated in both the
Hygienic standard for waiting room of public transit means (GB9672-1996) and the Code for design of
metro (GB50157-2013). In fact, many VOCs originated from materials prevailing in subway air are toxic
or carcinogenic and even might trigger respiratory or cardiovascular diseases [51]. Similar drawbacks
could be also found regarding CO as well as total count of airborne bacteria from comparisons of
relevant standards. From the above, integrating full-scaled monitoring indicators is the fundamental
principle for future standards of urban subway microenvironments, especially those about air chemistry
underground. Furthermore, though the existing standards have defined their own application ranges,
they however failed to indicate the corresponding period of implementation. From perspectives of life
cycle management and multi-objective management in urban subway systems, sub-ME is regarded as
one of important subway project objectives in different stages, e.g., design, construction, and operation.
Hence, it is recommended to comprise threshold of each sub-ME indicator in the whole life cycle
of urban subways. Besides, other information associated with sub-MEs, such as microenvironment
quality objectives, definition of indicators, and emission factors as well as emission inventories should
be further covered in the future standards or norms [39].
Second, people-orientation is needed for setting standards of various micro-environmental
indicators. The authorities should give priority to feelings or satisfactions of passengers in sub-MEs,
as it is where larger volumes of passengers commuted in their daily life. Currently, many domestic
standards of subways or indoor air quality only set extreme limits instead of values recommended
based on commuter comfort. For instance, prevailing thermal environment inside trains or on platforms
is of importance to the thermal comfort of passengers [59], but no corresponding levels of human
thermal comfort have been included when setting values in those national standards. As for field
measurements of thermal environment underground in this research, temperatures in subway station
halls, on platforms, and in train cabins range in between 25.9–27.1 ◦ C, 26.1–27.7 ◦ C, and 26.4–27.2 ◦ C,
respectively, all of which meet the requirements according to the Hygienic standard for waiting room
of public transit means (GB9672-1996) and the Code for design of metro (GB50157-2013). However,You can also read