Environmental justice and urban parks. A case study applied to Tarragona (Spain)
←
→
Page content transcription
If your browser does not render page correctly, please read the page content below
Preprints (www.preprints.org) | NOT PEER-REVIEWED | Posted: 23 June 2021                              doi:10.20944/preprints202106.0554.v1

          Article

          Environmental justice and urban parks. A case study applied to
          Tarragona (Spain)
          Joan Alberich*, María Yolanda Pérez, José Ignacio Muro, Edgar Bustamante

                                       Department of Geography, University Rovira i Virgili, 43480 Vila-seca, Tarragona, Spain.
                                       * Correspondence: joan.alberich@urv.cat

                                       Abstract: There is consensus over the fact that urban green areas contribute to the quality of life of
                                       their inhabitants. So, efficient city management must assess whether the population has access to
                                       green areas and their quality in relation to vegetation, facilities or furnishings, for example. There-
                                       fore, the objective set is to establish the environmental justice of urban parks in Tarragona (Spain)
                                       by developing a Park Quality Index (PQI) and the sociodemographic characteristics (level of studies,
                                       Human Development Index [HDI], home sale and rental prices) of the population living within 300
                                       metres of a park. To prepare this, a GIS-integrated Multi-Criteria Evaluation (MCE) has been pro-
                                       duced. The results show that the green areas have low accessibility and availability and that most
                                       parks obtain an average-low PQI, with the best- valued aspect being the vegetation and the worst
                                       the facilities. As for the degree of environmental justice, a casual relationship emerges between the
                                       PQI and the indicators used. The average value of the home sale prices is the one that shows the
                                       greatest correlation. These results can be used together with participatory procedures as a basis for
                                       identifying places with greater inequality, and for selecting the more effective actions that enable
                                       increasing environmental justice with respect to green areas.

                                       Keywords: Environmental justice, Urban parks, Tarragona

                                       1. Introduction
                                             The concept of environmental justice appeared in the last third of the 20th century,
                                       within the framework of «assessing the distribution of the benefits and damage caused by
                                       human agents between places and population groups, in order to determine whether or
                                       not serious discrimination exists» [1]. The general context was a growing awareness that
                                       the spatial distribution of some human activities was clearly discriminatory for one part
                                       of the population. For example, generating, handling and storing hazardous waste or the
                                       territorial distribution of certain pollutant industries tended to be located in areas occu-
                                       pied by the less favored part of the population. Environmental justice considers that
                                       «there is a universal right to nature» on all levels (individual, family, community...), with
                                       the environment being understood as a common good [2]. So, the basis of the concept is
                                       the non-discrimination of environmental benefits and damages and the need to establish
                                       participative decision mechanisms «that can distribute those benefits and damages equi-
                                       tably among a justice community made up of located entities (subjects and objects), both
                                       current and future, who may have unequal rights and obligations» [1].
                                             From this point of view, environment justice or discrimination can be measured, in
                                       general terms, by calculating the overall computation (social, territorial and temporal) of
                                       the environment costs and benefits (which in economic terms are often called «externali-
                                       ties») generated by a certain activity or project, so as to later clarify whether or not the
                                       distribution of these elements is fair among the various groups that may be affected by
                                       said activity, one way or another. However, other authors uphold including other non-
                                       economic elements in the analysis, and choose to use indicators and variables of a different
                                       level of measurement, by applying multi-criteria analysis [3].

            © 2021 by the author(s). Distributed under a Creative Commons CC BY license.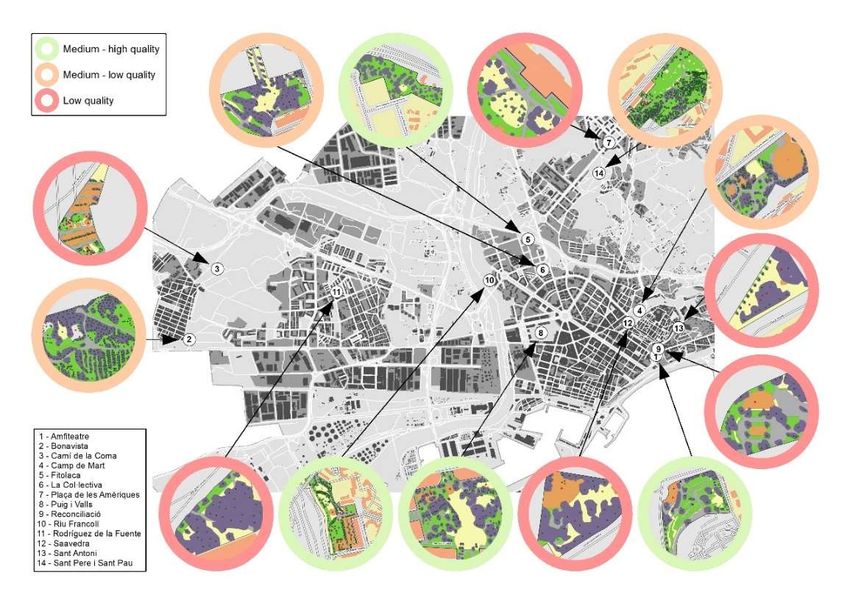
Preprints (www.preprints.org) | NOT PEER-REVIEWED | Posted: 23 June 2021                      doi:10.20944/preprints202106.0554.v1

                                          Traditionally, the study of environmental justice has focused on analyzing the distri-
                                    bution of facilities with toxic emissions, waste dumps and other environment hazards that
                                    are disproportionately close to socially disadvantaged groups. However, recent works
                                    have extended the scope of this concept to include terms such as equitable access to green
                                    areas and other natural resources [4,5]. This new interest is related to the conviction that
                                    urban parks or urban green areas help to increase the quality of life of city inhabitants.
                                          There is consensus over the fact that, broadly speaking, green areas imply benefits in
                                    six different areas [6]: 1) they help to fight pollution [7] and contribute to microclimate
                                    normalization [8,9]; 2) reduce noise [10]; 3) improve the population’s emotional wellbeing
                                    and psychophysiological balance by increasing the feeling of security [11]; 4) they improve
                                    mental and physical health [12]; 5) promote outdoor life and social meetups [13] and 6)
                                    and they increase citizens’ environmental awareness. So, urban green areas regulate the
                                    temperature and humidity, produce oxygen and filter radiation; also, they absorb pollu-
                                    tants and muffle noise; and, in addition, they are a place for going for a walk, an area for
                                    relaxing and for leisure. However, beyond their intrinsic value (their good organization,
                                    quality or degree of protection), often it is their symbolic dimension which makes them
                                    places citizens appreciate.
                                          Therefore, the World Health Organization considers urban green areas to be essential
                                    due to their inherent benefits for physical and emotional wellbeing [14]. From this point
                                    of view, in order to focus efficient city management on community interests, we have to
                                    assess whether or not the population has access to green areas, and in addition, the quality
                                    of these areas in terms of, inter alia, the existence of vegetation, available or existing facil-
                                    ities or street furnishings. Therefore, the general objective of this work is to establish the
                                    degree of environmental justice in the urban parks in the city of Tarragona by establishing
                                    a PQI and learning about the population’s socio-demographic characteristics. To do this
                                    (1) an MCE model has been constructed within a GIS, which allows us to establish the
                                    PQI, (2) indirect, standardized indicators have been determined for the socio-economic
                                    characteristics of the population living within 300 meters or less of the access to a park,
                                    such as the Synthetic Training Index (STI), the HDI or home sales prices in each sector and
                                    (3) the PQI has been correlated with the population’s socio-economic characteristics to
                                    obtain the spatial justice results in terms of the availability and quality of the urban green
                                    areas. The work is organized into 7 sections, plus the bibliography. The introduction re-
                                    flects on the concept of environmental justice; while the second section reflects on the rap-
                                    port between the quality of life and urban green areas, as well as reviewing methodology
                                    and concept aspects; the third section introduces the area of study; the fourth details the
                                    methodology stages and the tools used, while the fifth reveals the results; the sixth con-
                                    tains the discussion and the last one contains the conclusions.

                                    2. Environmental justice and urban parks through accessibility, quality and population
                                    characteristics. Approaches and methodologies for studying them
                                        The accessibility and quality of urban parks are essential factors that are frequently
                                    used to establish whether or not environmental justice exists. In addition, other factors
                                    regarding population characteristics and socio-economic indicators are used. These com-
                                    ponents are related through different spatial analysis processing and methodologies.

                                    2.1. Environmental justice factors in urban parks. Accessibility, quality of the parks and socio-
                                    demographic characteristics of the population served
                                         A significant part of the work on environmental justice and urban parks has focused
                                    on assessing the distribution of green areas in the city [15,16], by calculating the distance
                                    between the place of residence and the nearest green area, and using a geographic infor-
                                    mation system [17]. Although the unit often used is the distance in meters, some authors
                                    choose to measure accessibility using the travelling time according to the means of
                                    transport used (public transport, by foot, by bicycle and private car) [18]. Calculating these
                                    indicators using Euclidean and network distances shows a clear influence of the type of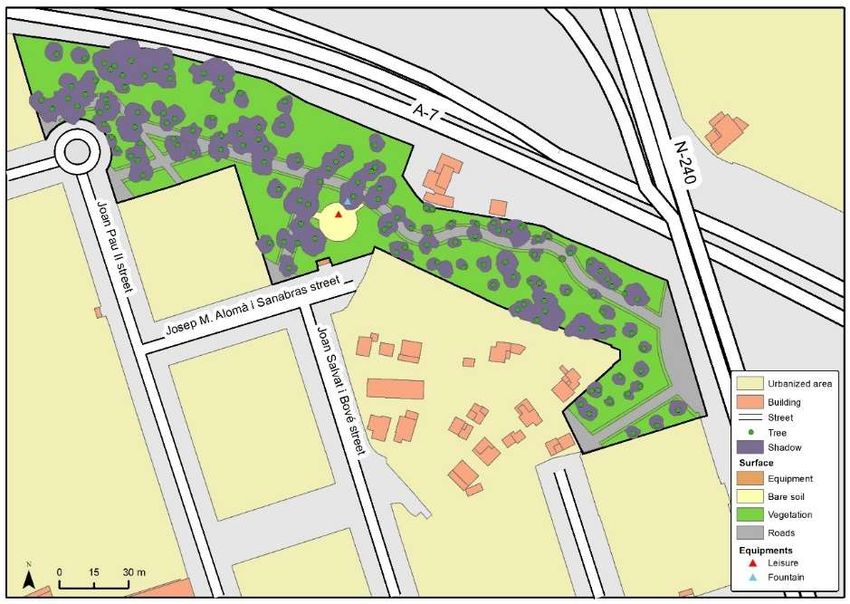
Preprints (www.preprints.org) | NOT PEER-REVIEWED | Posted: 23 June 2021                      doi:10.20944/preprints202106.0554.v1

                                    distance chosen (Euclidean versus the distance in the network). Therefore, we have to use
                                    these indicators carefully as planning support tools.
                                           Analyzing accessibility, understood to be the physical or time separation between the
                                    actual location of the park and the users’ place of residence, is complemented with archi-
                                    tectural accessibility issues (for example, if it is a non-closed space); psychological acces-
                                    sibility (if it is attractive enough for the potential users to visit it) [19] or its «walkability»,
                                    i.e. its transitability whereby the parks are accessible to people with limited mobility, such
                                    as children or the older population [20].
                                           However, it is clear that the potential user public in each park (served population) is
                                    not made up of a uniform group of individuals with common demographic, economic
                                    and social characteristics. In fact, there is a consensus confirming that social injustice re-
                                    garding urban green areas usually goes hand in hand with a certain social stratification
                                    and/or residential segregation [21], which can lead to what some authors call «green gen-
                                    trification» [22]. In this respect, some contributions examine the relationship between the
                                    number, proximity and quality of green areas, the socio-economic characteristics of the
                                    inhabitants [23-26] and the composition of the dwellings [24]. In addition to these charac-
                                    teristics, consideration is often given to the ethical composition [27-29]. For example, De
                                    Sousa [22] in their comparative work between Faro (Portugal) and Tartu (Estonia), ob-
                                    served significant inequalities in the housing districts of the socialist stage in the first of
                                    the cities, where most of the Russian minorities live (with variable availability of public
                                    green spaces between 1.04 and 164.07 sqm. per inhabitant), whereas the Romanian com-
                                    munities in Faro were located in districts without access to public green spaces, although
                                    with smaller differences (from 1.22 to 31.44 sqm. per inhabitant). Other studies, on the
                                    other hand, focus on specific demographic groups like young people [6] or immigrants
                                    [30]. The availability of this information and its high degree of territorial disaggregation
                                    in sources like the Municipal Register of Inhabitants makes it easy to use since it can be
                                    georeferenced. The data on the population’s income is a different case, because due to
                                    confidentiality issues, it is difficult to obtain. In this case, it is essential to use secondary
                                    sources to deduce the economic level of the population that a park serves.

                                    2.2. Approaches and methodologies for the environmental justice study regarding urban parks
                                          An important issue shared by the literature consulted is the actual definition of an
                                    urban park. Although there is no single definition, the one provided by Jennings et al. [31]
                                    is considered appropriate (as it is necessarily broad), and states that urban parks are «a
                                    kind of green area that is generally public property and, consequently, accessible to the
                                    general public; and can include children’s parks, leisure facilities and other characteristics
                                    that promote open air recreation». In order to analyze these urban green areas, they have
                                    been divided into categories according to their surface area and function in the urban
                                    space, according to their contents, different services, uses and social values that they pro-
                                    vide for different segments of the population [23, 32].
                                          A large part of the works published on environmental justice regarding urban parks
                                    adopt a quantitative perspective. Qualitative approaches on this question are harder to
                                    find. In this respect, a notable exception is the work by Smiley et al. [33], who analyses the
                                    opinions and preferences of minority ethnic groups regarding the use of the urban parks
                                    in Houston (Texas) using the data obtained from two ad hoc surveys. From a quantitative
                                    orientation, GIS have been used to process the information. However, some authors have
                                    criticized the use of these tools, arguing that they specify the geographical units and
                                    threshold distances inappropriately and ignore the actual movement by people. There-
                                    fore, in some recent research, people have opted to use the georeferenced data produced
                                    by the mobile telephone to obtain behavior patterns within green areas. These emphasize
                                    the real activities by park users, in terms of both space and time [26]. Another option is
                                    applying a public participation GIS, which can be an alternative for obtaining multifaceted
                                    knowledge on accessibility patterns [34].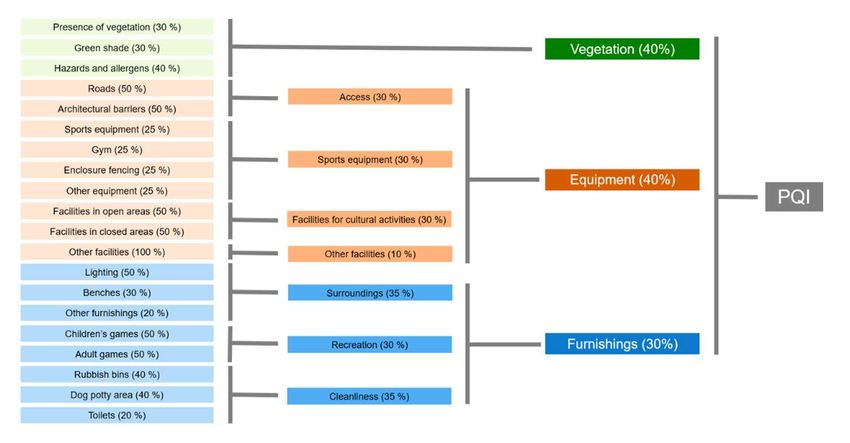
Preprints (www.preprints.org) | NOT PEER-REVIEWED | Posted: 23 June 2021                   doi:10.20944/preprints202106.0554.v1

                                          In order to establish the relationship between the distribution and quality of the parks
                                    and the population’s socio-demographic characteristics, the Pearson correlation coeffi-
                                    cient [25], the index of dissimilarity or the analysis of conglomerates has been used [35].
                                    Often, these parameters are accompanied by the use of statistical indicators to measure
                                    the significance of the differences observed, like the Gini coefficient or the analysis of var-
                                    iance (Anova) test [23,29]. Equally, in comparative works between two or more cities, lo-
                                    gistic regression techniques have been used to control and neutralize the different charac-
                                    teristics of the urban fabric among the study cases [29]. Finally, another methodological
                                    aspect refers to the actual measurement of the social and environmental quality of the
                                    urban parks. In relation to this, some authors express the need to measure six parameters:
                                    access, services, security, social inclusion, visual and aesthetic quality, and, finally, the
                                    ecological function [36].

                                    3. Area of study. The green areas and the urban parks in Tarragona
                                          The city of Tarragona is part of an urban area with nearly 380,000 inhabitants, with
                                    16 municipalities and a surface area of just over 350 square kilometers. In 2019, the mu-
                                    nicipality of Tarragona had a population of 142,859 inhabitants, who, when distributed
                                    over the 57.88 square kilometers of their municipal area, represent a density of 2.468 in-
                                    hab./km2. However, this average value does not reflect the internal inequalities, since the
                                    city has a clear «oil stain» layout, with a consolidated and densely populated urban center
                                    and a polarized periphery [37].
                                          The Catalan Urban Planning Act (revised text of 2010) establishes that the urban
                                    structure of the municipalities is made up of general and local systems, the facilities and
                                    a system of free public places. The system of free spaces includes parks, gardens, green
                                    areas and spaces for amusement, leisure and sport. The urban green system is usually
                                    formed in the urban fabric in a series of isolated elements that can have an important
                                    ecological value with respect to the continuity of habits. So, the linear elements such as
                                    walks, park ways or linear parks, behave like connectors complemented by the tree-lined
                                    roads in the urban section. The interconnection between parks, gardens and interstitial
                                    spaces makes up a comprehensive green mosaic that increases biodiversity and implies
                                    an improvement in the quality of the public space.
                                          The Tarragona Municipal Urban Planning Plan (2013) defines the municipality’s sys-
                                    tem of free spaces in a broad sense. According to this document, this system includes the
                                    public parks and gardens, the ramblas (boulevards), squares and all the free, public green
                                    spaces located on urban, urbanisable or non-urbanisable land. For its part, Agenda 21 Lo-
                                    cal in Tarragona considers urban green to be the city spaces where natural elements pen-
                                    etrate in the form of parks or gardens, tree-lined, with water bodies or garden elements in
                                    the streets.
                                          Between the years 2012 and 2017, the Environment Department of the Tarragona
                                    Town Hall quantified a total of 65 green areas intended for public spaces, totaling 371 Ha
                                    of urban green (3.71km2). These areas include the green spaces that are part of the urban
                                    section [38]. Out of this group of green spaces in the city of Tarragona, 14 appeared de-
                                    fined as urban parks [39]. These are distributed throughout the municipal territory, except
                                    in the area of the residential estates in the east (Figure 1). These public facilities respond
                                    to very varied typologies, from landscaped urban squares, like the Sant Antoni park, just
                                    over 1200 m2 or 0.12 hectares, to extensive areas of natural vegetation, like the fluvial part
                                    of the Francolí river, which reports 13.7 hectares.
Preprints (www.preprints.org) | NOT PEER-REVIEWED | Posted: 23 June 2021 doi:10.20944/preprints202106.0554.v1
Figure 1. Location of the urban parks in Tarragona. Source: Own work. Orthophotomap base map
1:5.000 of Institut Cartogràfic i Geològic de Catalunya.
4. Data and methods
The analysis is divided into three well-defined stages grouping different tools and
methodologies: (1) using a GIS and a MCE integrated into the former; (2) field work and
(3) statistical analysis. Using a Geographical Information System (GIS) has made it possi-
ble to digitalize the elements existing in the parks and their limits, geolocate the data re-
garding the population registered in the Municipal Register of Inhabitants, and select the
target population; in other words, that lives within 300 meters or less of an access point of
any of the parks and, finally, obtain part of the information needed to develop the factors
of the MCE model using spatial analysis operations and implementing them.
Field work has also been carried out, through visits to the parks included in the study,
between the spring and summer of 2018. The purpose of these visits was to obtain direct
information to establish the PQI, check the digitalized mapping and take photographs to
characterize these spaces.
Finally, a statistical analysis was carried out on the sample taken from the selection
of inhabitants register at a distance equivalent to or within 300 meters from a park access
point to try and characterize the socio-demographic viewpoint of the potential user pop-
ulation of the said space.
With the set of indicators, both direct and indirect, that characterize the quality of the
urban parks, a hierarchical and weighted Multi-criterial Assessment Model has been de-
signed which has allowed us to obtain the PQI. This index has been correlated with the
demographic and socio-economic characteristics of the target population.
4.1. Assessing the quality of the parks
The quality of urban parks is very important with respect to spatial and environmen-
tal justice [40]. The quality-of-life community indicators for parks used in this work have
been selected from the Madrid case (Spain) [41] and Bucaramanga (Colombia) [42]. In each
urban park in Tarragona, we have generated a spatial and theme-based database with
information on the urban location, the surface area covered by vegetation, the covered
green shadow and the various facilities (Figure 2). This information has been digitalizedPreprints (www.preprints.org) | NOT PEER-REVIEWED | Posted: 23 June 2021 doi:10.20944/preprints202106.0554.v1
based on the Topographic Map 1:5.000 and orthophotography on the same scale; both
documents provided by the Institut Cartogràfic i Geològic de Catalunya.
Figure 2. Example of the mapping database of the Fitolaca park (Tarragona). Source: own work.
For assessment purposes, the model has included a total of 20 factors associated with
the quality of the parks. Each of these factors has been assessed on a scale of 0 to 3, where
in a standardized way, the value of 0 corresponds to the situation of the lowest quality of
the park, and the value of 3 refers to the highest quality of the park.
4.2. Demographic and socio-economic population indicators
Data from the Municipal Register of Inhabitants was used to characterize the popu-
lation in the city of Tarragona on 31 December 2019. This database stores the residents’
postal address, and therefore it was possible to geolocate the registers based on this ad-
dress and build up a mapping layer. Subsequently, those inhabitants living within 300
meters of the nearest park access point were selected, considering the mode of transport
to be walking because it is healthy and not affected by economic conditioning [43].
Some authors [44] use two factors to characterize the population demographics: the
level of studies and nationality. The level of studies collected in the register of inhabitants
in Tarragona refers only to the population aged 16 years old and over, and it has been
grouped into five categories. To compare the different territorial units analyzed, a Syn-
thetic Training Index (STI) was created based on introducing a weight weighting for the
population at each training level. This way, an index is obtained with values between 0
and 1, where 0 would be equivalent to the whole of the illiterate population and 1 would
represent the opposite extreme, with all the population having university education. In
order to neutralize the influence of the population’s aged-based structure in terms of ed-
ucation (an older population tends to have lower education levels than a young popula-
tion), a direct standardization was carried out, based on applying a typical population
structure (the whole of the population of the city of Tarragona) to the fourteen neighbor-
hoods of the parks under analysis.
The second variable chosen is that regarding the origin of the population. In this case,
we have opted to use the population’s place of birth, as opposed to the nationality because
it addresses the idea of those people from immigrant families who have been born in
Spain. In order to compare the different territorial units, the population born abroad has
been characterized using the average value of the HDI published by the United Nations
Population Division in 2020. In addition, in order to reflect better the diversity of thePreprints (www.preprints.org) | NOT PEER-REVIEWED | Posted: 23 June 2021 doi:10.20944/preprints202106.0554.v1
population born in Spain, the HDI of the autonomous community of birth was taken into
consideration from the Instituto Valenciano de Investigaciones Económicas (year 2019).
In third place, and due to the lack of disaggregated data on the income level, the
population’s economic characterization has been analyzed indirectly based on housing
prices. This information has been taken from the property portal, Idealista.com, which
allows you to consult the average renting and purchasing prices per square meter for
apartments in a specific area. Thanks to this option, it was possible to define the 300 meters
area of influence around each park. The information obtained this way is comparable with
that from the Register of Inhabitants.
4.3. The Multi-criterial Evaluation (MCE) and the Park Quality Index (PQI)
This work adopts the multi-criterial assessment model in order to discover the degree
of quality or suitability of urban parks, based on selecting a series of indicators, subindica-
tors and factors (Figure 3). To do this, the initial 20 factors (first hierarchical level) have
been grouped into 7 subindicators (second hierarchical level) and, in turn, these have been
joined together in three indicators that correspond to (1) the quality of the vegetation, (2)
the quality of the facilities and (3) the quality of the street furnishings (level 3). Finally, the
combination of the three indicators leads to the Quality-of-Life Community indicator for
parks - PQI (level 4).
Figure 3. MCE of the quality of the urban parks. Source: own work.
One of the essential characteristics of an MCE is the importance or weights by per-
centage of each factor, subindicator and indicator used in the model. The final result ob-
tained will depend very much on the weight assigned to each part of the model. In this
case, the weight assignment is related to the established hierarchies and groups so that
they each add up to 100%. If we take the third hierarchical level as an example, and apply
the decision formula or rule, vegetation is combined with a 40% weighting and facilities
with a 30% weighting, while the weighting for property is 30%.
5. Results
The results of the research are structured in three areas. First of all, those related to
the distribution and provision of the urban parks in the city; secondly, reference is made
to their quality based on calculating the PQI; and finally, thirdly, an attempt is made to
determine whether environmental justice exists by relating, on the one hand, the quality
of the parks and, on the other hand, the population’s socio-demographic characteristics.
5.1. The distribution and provision of urban parks in the cityPreprints (www.preprints.org) | NOT PEER-REVIEWED | Posted: 23 June 2021 doi:10.20944/preprints202106.0554.v1
The distribution of parks in Tarragona reveals a concentration in the central part of
the city. This corresponds to the area with the greatest density populations: out of the
fourteen parks in existence, five are located in the Ensanche area (Saavedra, Camp de
Mart, La Col·lectiva, Riu Francolí and Puig i Valls parks). Equally, this highlights the num-
ber of parks in the eastern area, with the Amfiteatre park, in Sant Antoni and Reconciliació
park. However, three aspects need to be specified: a) it is the urban area with the largest
surface area in the whole city; b) the total surface area of the existing parks is not very big,
and most of them cover an average or small surface area; and c) most are in the area near-
est the city center, neighboring on the historic center, where there is no urban park because
of the morphological characteristics. The northern area has low-density residential estates
and does not have this kind of facilities (Figure 4). No doubt, the existence of a high num-
ber of private urban green areas means there are no public urban spaces. The districts to
the west of the city have a high population and proportionally few urban parks.
According to the data taken from the land registry plots in each of the fourteen urban
parks listed by the town hall in the city of Tarragona, their total surface area is 374,606
sqm. However, this overall figure hides various case studies: the surface area differs con-
siderably between the parks, with two of them, the Riu Francolí park (with 130,684 sqm.)
and Sant Pere i Sant Pau park (with 122,130 sqm.) representing two thirds of the total
surface area of urban parks (Figure 4). At the other extreme, we find parks corresponding
more to the concept of landscaped square, such as the Sant Antoni square (1,294 sqm.) and
Fitolaca square (1,558 sqm.).
140.000
130.684
122.130
120.000
100.000
80.000
60.000 54.173
40.000
24.644
20.000
10.092 8.551
4.972 4.353 4.352 3.490 2.213 2.100 1.558 1.294
0
Camp de Mart
Riu Francolí
Puig i Valls
La Col·lectiva
Plaça de les Amèriques
Reconciliació
Sant Antoni
Sant Pere i Sant Pau
Rodríguez de la Fuente
Amfiteatre
Bonavista
Camí de la Coma
Saavedra
Fitolaca
Figure 4. Surface area of the urban parks in Tarragona, in sqm. Source: own work.
There is also a difference between the occupancy percentages of each surface area
type in the parks (green areas, bare soil, roads and facilities). Generally speaking, vegeta-
tion is the predominant type, as it covers a little more than half the area (55.1%), with
much higher values in the cases of the Bonavista (81,5%) and particularly, the Sant Pere i
Sant Pau (88.2%) parks. In the case of the latter, its large surface area makes it the city’s
big «green lung». On the other extreme, we have the «landscaped squares» in Sant Antoni
and Rodríguez de la Fuente, which have extremely low vegetation values (14.5% and
17.0%, respectively).
Finally, it is worth highlighting the disparity between the surface area occupied by
the various facilities (sport, culture, etc.) in each park. In some parks, these elements are
completely non-existent (La Col·lectiva and Rodríguez de la Fuente parks), while in others
(Camp de Mart and Camí de la Coma park), at least one third of the surface area is covered
by facilities.Preprints (www.preprints.org) | NOT PEER-REVIEWED | Posted: 23 June 2021 doi:10.20944/preprints202106.0554.v1
5.2 The provision and distribution of urban parks with respect to the population
The surface area of the urban parks in relation to the inhabitants shows an average
available surface area of 2.62 sqm. per inhabitant. This figure rises to 15.09 m2/inhab. with
all the green spaces (periurban) in the municipality. The value achieves the thresholds
recommended by the World Health Organisation, which establishes a figure around 10-
15 sqm./inhabitant. As for their accessibility, 39% of the population in the Tarragona cap-
ital live within 300 metres of an urban park and the average distance in a straight line is
710 metres, which is much higher than would be recommended (Table 1).
Table 1. Average surface area available per inhabitant and average distance to the nearest
urban park
Total population Population living < 300 meters
Average Average
Urban parks sqm./ sqm./
Inhabitants distance Inhabitants distance
inhabitant inhabitant
(m.) (m.)
Amfiteatre 4053 518.1 2.11 918 205.2 9.31
Bonavista 9945 337.1 0.44 4440 181.7 0.98
Camí de la Coma 2931 436.7 0.72 308 270.3 6.82
Camp de Mart 5618 294.3 4.39 2841 202.3 8.67
Fitolaca 1089 334.9 1.43 314 235.4 4.96
Riu Francolí 6799 207.3 1.48 6131 123.2 1.65
La Col·lectiva 6190 257.9 0.80 4374 189.4 1.14
Pl. de les Amèriques 20,867 1285.5 2.60 6296 170.6 8.60
Puig i Valls 32,105 369.3 0.11 13,046 154.1 0.27
La Reconciliació 2015 155.6 64.86 2015 155.6 64.86
Rodríguez de la Fuente 23,728 435.6 0.09 5331 172.7 0.42
Saavedra 9565 324.9 0.45 4245 196.0 1.03
Sant Antoni 15,168 2424.4 0.09 3004 157.2 0.43
Sant Pere i Sant Pau 2786 179.8 43.84 2395 137.2 50.99
Total 142,859 710.3 2.62 55,658 166.4 6.73
Source: own work.
If the urban areas are taken as the analysis unit, we can observe that the provision of
urban park surface area per inhabitant is unequal according to the area of residence. This
geographic distribution shows an important degree of environmental injustice. So, some
areas appear without any urban parks inside them (the historical centre and Sant Salva-
dor), whereby the rate is 0 sqm./inhabitat. In some areas, like the case of Bonavista, the
parks lie in the periphery of the urban area. In others, such as Torreforta and Ensanche,
there is a minimum provision per inhabitant, resulting from the combination of its rela-
tively high population and the low surface area of the existing parks. The area with the
residential estates in the eastern area (Levante) has below-average values, but due to its
urban characteristics, it is marked by low density, the presence of private green areas and
its disconnection from the city.
5.3 The quality of urban parks
The average PQI in Tarragona is 53.39 points, with the highest assessment in vegeta-
tion (67.86), followed by street furnishings (45.50) and facilities (32.32) (Table 3 and Figure
5). Out of the fourteen urban parks analysed, none of them has a «good» quality (PQI
equal to or higher than 70 points), and only four have a «medium-high» rating (60-69
points). Specifically, these are the Puig i Valls park (62.81), the Riu Francolí park (62.22),
the Amfiteatre park (61.42) and the Fitolaca park (60.29). Their overall score (totalPreprints (www.preprints.org) | NOT PEER-REVIEWED | Posted: 23 June 2021 doi:10.20944/preprints202106.0554.v1
assessment of vegetation, facilities and furnishings) is due to different factors. So, the Puig
i Valls and Amfiteatre parks owe their high assessment to the vegetation (number of ex-
amples, green shadow and absence of allergenic species, 80.00 and 83.33 respectively),
although with the other two indicators they have fairly discrete scores (facilities 39.00 and
32.08; furnishings 40.02 and 59.15, in the same previous order). On the contrary, the good
score obtained by the Riu Francolí park is not due to the assessment of its vegetation (with
53.33 points, it is only just the third lowest urban green area in the city). Instead, it is due
to the good quality of both its facilities (74.78) and its furnishings (67.43), in which it leads
the city ranking as a whole.
Table 2. PQI values for each park and each indicator
Urban parks Vegetation (40%) Facilities (30%) Furnishings (30%) PQI (100%)
Amfiteatre 83.33 39.00 40.02 61.42
Bonavista 86.67 31.60 33.67 59.65
Camí de la Coma 36.67 54.28 52.00 44.90
Camp de Mart 63.33 35.48 41.34 50.87
Fitolaca 80.00 30.00 51.17 60.29
Riu Francolí 53.33 74.78 67.43 62.22
La Col·lectiva 80.00 15.65 47.00 55.66
Pl. de les Amèriques 46.67 26.00 62.83 45.54
Puig i Valls 80.00 32.08 59.15 62.81
La Reconciliació 63.33 14.40 45.58 46.66
Rodríguez de la Fuente 63.33 33.15 16.33 44.04
Saavedra 63.33 34.63 36.60 49.47
Sant Antoni 66.67 1.25 56.60 47.80
Sant Pere i Sant Pau 83.33 3.20 27.35 56.05
Total 67.86 32.32 45.50 53.39
Source: own work.
With a «medium-low» score (between the values 50 and 59 in the PQI) we find four
parks: Bonavista, Sant Pere i Sant Pau, la Col·lectiva and el Camp de Mart. The good qual-
ity of their vegetation, which helps to offset fairly mediocre scores in the other two PQI
components, gives them an intermediary score. The most representative case in this re-
spect is the Col·lectiva park, where the quality of the vegetation (80 points, the sixth high-
est) offsets the discrete score for its facilities (15.65).
Finally, we find six parks with a «low» assessment for their quality (PQI under 50
points): Saavedra, Sant Antoni, La Reconciliació, plaça de les Amèriques, Camí de la Coma
and Rodríguez de la Fuente. In all of them, with the exception of the Camí de la Coma
park, the best scoring indicator is the vegetation, while in the other two indicators (facili-
ties and furnishings), the values obtained are low (Table 2). The extreme cases are the
furnishings score in the Rodríguez de la Fuente park (16.55) and, particularly, the score
for the virtually non-existent facilities in the Sant Antoni park (1.25).Preprints (www.preprints.org) | NOT PEER-REVIEWED | Posted: 23 June 2021 doi:10.20944/preprints202106.0554.v1
Figure 5. Location and quality level of the urban parks in Tarragona. Source: own work.
The results of the analysis reveal a meagre relationship between the location of the
parks in the urban area and their quality. In terms of environmental justice, it could be
expected that the parks located in the more peripheral areas were a lower quality, while
those in the center of the urban hub were a better quality. However, in all the urban areas,
there are parks with different assessments according to their PQI. Just one example in this
case: two urban parks very close together, the Amfiteatre park and Reconciliació park,
separated by just one street, have very different PQI values: while the first one has «me-
dium-high» quality (61.42 points), the second one has «low» quality (46.66).
5.4 Environmental justice regarding socio-economic characteristics: the level of studies, the place
of birth and housing prices
As we can see from Figure 6A, the relationship between the PQI value and the stand-
ardized STI of the population living within 300 meters reveals a degree of environmental
inequity. On the one hand, with the positive value of the R2 coefficient, and, on the other
hand, the actual positive slope of the trend line, it can be concluded that there is a casual
relationship between the parks with a lower level of quality and the lower level of studies
among the population living within 300 meters. In spite of this, this relationship is not
particularly robust, with an R2 coefficient value = 0.1159. One factor that influences this
behavior lies in the lower values of some urban parks, much lower than the rest of the
cases analyzed. In the urban parks with better values, the relationship of their coefficient
is not so clear, or in other words, the higher values in a variable correspond to the highest
scores in the other one.
The results of the correlation between the HDI of the place of birth and the PQI reveal
a clear correlation: the PQI value for each park and the average value of the HDI correlate
with a R2 of 0.1667 (Figure 6B).
The correlations between the PQI and the average price per square meter purchased
or rented (Figures 6C and 6D, respectively) show fairly similar situations: both if the
dwelling is purchased or rented, its price is higher among those located near the greater
quality parks. There is also a clearer relationship (R2 = 0.2123) in the case of purchased
dwellings, as the result of a direct linear correlation, whereby the lowest values of one
variable are related to the also lowest indicators of the other variable, and vice versa. It
could be thought that this direct relationship has something to do with the more or lessPreprints (www.preprints.org) | NOT PEER-REVIEWED | Posted: 23 June 2021 doi:10.20944/preprints202106.0554.v1
central location of each park with respect to the city as a whole, understanding that the
housing prices follow a more or less concentric logic, whereby the more central apart-
ments have higher prices than those located in peripheral areas.
At any event, although this idea in the case of the dwellings is certain, it has already
been mentioned that the quality of the parks does not follow this same pattern, and so the
robustness of the relationship is not due to this trend. A weaker, but equally positive (Fig-
ures 6C and 6D) relationship is the one between the price of home rentals and each park’s
PQI (R2=0.1530).
(a) (b)
(c) (d)
Figure 6. Correlation between the quality of the parks (PQI) and the socio-demographic variables of the population living
within 300 meters of the nearest park: (a) study level index for the population; (b) average value of HDI; (c) Average value
of the purchasing price (euros/m2) and (d) average value of the rental price (euros/m2). Source: own work.
6. Discussion
This article assesses the environmental justice in the city of Tarragona (Spain) with
respect to the accessibility, availability and quality of the urban parks and the socio-de-
mographic characteristics of its population. According to the Regional Office for Europe
of the World Health Organization [14], the minimum surface area of urban green areas
must be between 10 and 15 square meters per inhabitant, and within a distance of 300
metros or 5 minutes walking of the dwelling. However, some authors [19] maintain that
this strictly quantitative measurement of the provision of green spaces is not enough, and
that the parks must fulfil three basic conditions: availability (they are within a maximum
distance that allows its potential users to enjoy it), accessibility (when the user feels wel-
come, can access it freely and use it for recreational purposes at any time) and, finally, a
certain degree of attractiveness (when the space responds to individual needs, expecta-
tions and preferences).
The relationship between the disaggregated and precise socio-economic data has
made it possible to obtain positive correlations between these characteristics, park acces-
sibility and quality, providing evidence of the deficits in some areas in the city of Tarra-
gona. Certain urban areas are under-endowed with urban parks vis-à-vis the land occu-
pancy system, and are mostly under dispersed forms and without general system reser-
vations, beyond the needs arising from mobility. Despite this, they require greater re-
search attention. By comparing the different green areas with the neighborhood’s socialPreprints (www.preprints.org) | NOT PEER-REVIEWED | Posted: 23 June 2021 doi:10.20944/preprints202106.0554.v1
characteristics, it is possible to identify the priority areas so as to improve their condition,
accessibility, quality and distribution [45]. This research has not segmented the socio-eco-
nomic information on specific groups (according to age, origin), although it has standard-
ized the values used for analyzing them. In future research, it would be relevant to con-
sider the different user groups, the feeling of safety and security and social interaction.
This work has not considered the quality of the parks as a factor of environmental
justice because urban green areas are relevant for the urban quality of life and for promot-
ing environmental equity [46]. For their part, some authors [47] believe that in order to
determine environmental justice, the accessibility and availability of green areas, you have
to also consider their quality. The results from their analysis, combined with the socio-
economic characteristics, broaden the understanding of environmental justice with re-
spect to the parks. The literature on this issue has found numerous proofs of this. Corley
et al. [36] established relationships between the various aspects involved in the quality of
urban green areas, and Brown et al. [48] found significant associations between the types
of urban parks and their benefits for the population. Another important conclusion from
these approximations, is that improving and designing urban parks should consider resi-
dent preferences so as to keep them in mind [49, 50]. These actions would allow them to
become community assets [51].
In response to this need, this work has built the PQI; synthetic index that can be used
to assess environmental justice, with greater precision than the availability of green sur-
face areas or their distance. Another significant contribution from this work is that the
lack of information on the population’s income level has been substituted by alternative
sources. So, to establish the correlations with the PQI, the work instead used the level of
studies, the resident population’s HDI and home sale and rental prices within a distance
of 300 meters of a park. Out of these variables, the one that has shown a greater correlation
is home sale prices.
Some of the limitations found in this study are related to urban mobility. By selecting
a population within a distance threshold with respect to a park, you start with the premise
that the population only uses the urban parks in their own urban residency area, in other
words, as if these urban divisions led to «islands» or self-contained compartments, with-
out people moving from one to the other. Obviously, this is not entirely true, since mobil-
ity is a fundamental component of cities, conditioned by the place of residence and the
locations people visit regularly (work, leisure areas, daily shopping, children’s study
area). Therefore, beyond the analysis of the provision of urban parks based strictly on the
place of residence, it would be important to bear in mind the population’s daily mobility.
The type of mobility used here is by foot, following the recommendations of the World
Health Organization. However, due to the promotion of public transport as part of coun-
tries’ commitment to reduce the consumption of hydrocarbon fuels, and the proliferation
of Personal Mobility Vehicles (PMV), this segmented conception of the city has to change
or, at least, reconsider the cut-off thresholds and take into account other types of mobility.
It is also necessary to mention that when selecting the population served by a park, it was
decided to apply the Euclidean distance, i. e. the distance in a straight line from the access
of the nearest park to the place of residence, instead of the real distance using the city road
section. With this latter consideration, accuracy could be increased. On the other hand, the
central location of the urban parks with respect to the city as a whole, can influence the
value of the homes located in more central areas, as opposed to others further away. In
the case of the quality of the Tarragona parks, we have not found this association, and so
the statistical correlation does not follow this trend.
Using the MCE techniques to build the PQI is an attempt to reduce subjectivism, but
this always remains because just choosing the factors and their weights is a subjective
action. Differentiating the selection of weights (vegetation 40%, facilities 30% and furnish-
ings 30%) can provide a positive reading due to the possible actions aimed at increasing
the quality of the parks: the improvements to vegetation may require a greater economic
effort which in some cases has a temporary repercussion (e.g. annual vegetation) or in
others long-term results are obtained (e.g. time it takes for the tree vegetation to reachPreprints (www.preprints.org) | NOT PEER-REVIEWED | Posted: 23 June 2021 doi:10.20944/preprints202106.0554.v1
adult age). Intervention and maintenance both regarding facilities and, particularly, fur-
nishings, can lead to gains in the quality of the parks in a relatively economic way, in a
short-term and with significant durability.
7. Conclusions
There is great disparity among the parks in the city of Tarragona: peripheral parks
and central parks; large parks and landscaped squares. In terms of quality, vegetation is
the parameter with the best score, while facilities and furnishings have deficiencies. The
value obtained in accessibility is lower than that recommended by the EU, and the same
occurs with the availability of green spaces, although this reduces if we consider green
spaces on the whole. Based on the correlations between the PQI and the population’s so-
cio-economic characteristics, it can be stated that there is a casual relationship between
these variables. However, the levels of environmental injustice are reduced.
This work has shown that the relationship between access to green areas and envi-
ronmental justice is complex. The deficits in accessibility and quality can be overcome
with strategies and actions that increase the number of green areas available in places
where there are inequalities. The new urban agendas include analyzing urban habitabil-
ity, reducing social inequalities and improving healthy conditions so that the planning,
design and management of urban green areas should take socio-spatial attributes into ac-
count.
Funding: This work is part of the research project entitled «El paisaje como valor colectivo. Análisis
de su significado, usos y percepción social» (Landscape seen as a collective value. Analysis of its
meaning, uses and social perception) (CHORA), financed by the Ministry of Science, Innovation and
Universities (State Program for Fostering Scientific Research and Technique of Excellence, State Sub-
program for Generating Knowledge. 2018-2020. CSO2017-82411-P), AEI/FEDER, EU and Depart-
ment of Research and Universities of the Generalitat of Catalonia (2017SGR22).
Acknowledgments: Acknowledgements to Mrs. Lurdes Llorach de la Peña, Mr. Joan Jaume Iniesta
Girona (Town Hall of Tarragona) and to Messrs. Robert Casadevall Camps and Marc Domínguez
Mallafré (Universitat Rovira i Virgili) for their co-operation for documenting this work.
References
1. Moreno, A. Justicia ambiental. Del concepto a la aplicación en planificación y análisis de políticas territoriales. Scripta Nova 2009,
XIV (316).
2. Flipo, F. L’espace écologique: fondements d’une théorie politique de la dimension naturelle de la liberté; París, Les Cahiers du pôle de
recherche et d’enseignement Proses, 2002.
3. Martínez Alier, J.; Roca, J. Economía ecológica y política ambiental; Ciudad de México, Fondo de Cultura Económica, 2000.
4. Boone, C. G.; Buckley, G. L.; Grove, J. M.; Sister, C. Parks and people: An environmental justice inquiry in Baltimore, Maryland.
Annals of the Association of American Geographers 2009, 99, pp. 767-787.
5. Jennings, V.; Floyd, M. F.; Shanahan, D. Coutts, C.; Sinykin, A. Emerging issues in urban ecology: implications for research,
social justice, human health, and wellbeing. Population and Environment 2017, 39 (1), pp. 69-86.
6. Wolch, J. R.; Byrne, J.; Newell, J. Urban green space, public health, and environmental justice: The challenge of making cities
‘just green enough’. Landscape and Urban Planning 2014, 125, pp. 234-244.
7. Su, J. G.; Jerrett, M.; Nazelle, A. de; Wolch, J. Does exposure to air pollution in urban Parks have socioeconomic, racial o ethnic
gradients? Environmental Research 2011, 111, pp. 319-328.
8. Jim, C. Y.; Chen, W. Consumption preferences and environmental externalities: A hedonic analysis of the housing market in
Guangzhou. Geoforum 2007, 38, pp. 414-431.
9. Gill, S.; Handley, J. F.; Ennos, R.; Pauleit, S. Adapting Cities for Climate Change: The Role of the Green Infrastructure. Built
Environment 2007, 33 (1), pp. 115-133.
10. Margaritis. E.; Kang, J. Relationship between green space-related morphology and noise pollution. Ecological Indicators 2017, 72,
pp. 921-933.
11. Branas, C.; Cheney, R. A.; MacDonald, J. M.; Tam, V. A difference-in-differences analysis of health, safety, and greening vacant
urban space. American Journal of Epidemiology 2011, 174 (11), pp. 1296-1306.
12. Coppel, G.; Wüstemann, H. The impact of urban green space on health in Berlin, Germany: Empirical findings and implications
for urban planning. Landscape and Urban Planning 2017, 167, pp. 410-418.Preprints (www.preprints.org) | NOT PEER-REVIEWED | Posted: 23 June 2021 doi:10.20944/preprints202106.0554.v1
13. Bijker, R. A.; Sijtsma, F. J. A portfolio of natural places: Using a participatory GIS tool to compare the appreciation and use of
green spaces inside and outside urban areas by urban residents. Landscape and Urban Planning 2017, 158, pp. 155-165.
14. World Health Organization. Regional Office for Europe. Urban green spaces and Health. A review of evidence. Copenhagen, 2017.
15. La Rosa, D. Accessibility to greenspaces: GIS based indicators for sustainable planning in a dense urban context. Ecological
Indicators 2014, 42, pp. 122-134.
16. Silva, C. S.; Viegas, I.; Panagopoulos, T.; Bell, S. Environmental justice in accessibility to green infrastructure in two European
Cities. Land 2018, 7 (4), art. 134.
17. Xiao, Y.; Wang, Z.; Li, Z.; Tamg, Z. An assessment of urban park access in Shanghai. Implications for the social equity in urban
China. Landscape and Urban Planning 2017, 157, pp. 383-393.
18. Xu, M.; Xin, J.; Su, S.; Weng, M.; Cai, Z. Social inequalities of park accessibility in Shenhen, China: The role of park quality,
transport modes, and hierarchical socioeconomic characteristics. Journal of Transport Geography 2017, 62, pp. 38-50.
19. Biernacka, M.; Kronenberg, J. Classification of institutional barriers affecting the availability, accessibility and attractiveness of
urban green spaces. Urban Forestry & Urban Greening 2018, 36, pp. 22-33.
20. Rigolon, A.; Toker, Z.; Gasparian, N. Who has more walkable routes to parks? An environmental justice study of Safe Routes
to Parks in neighborhoods of Los Angeles. Journal of Urban Affairs 2017, 40 (4), pp. 1-16.
21. Rigolon, A. A complex landscape of inequity in access to urban parks: A literature review. Landscape and Urban Planning 2016,
153, pp. 160-169.
22. De Sousa Silva, C.; Viegas, I.; Panagopoulos, T.; Bell, S. Environmental justice in accessibility to green infrastructure in two
European cities. Land 2018, 7 (134), pp. 1-23.
23. Almohamad, H.; Knaack, A. L.; Habib, B. M. Assessing spatial equity and accessibility of public green spaces in Aleppo City,
Syria. Forests 2018, 9 (11), art. 706.
24. Shen, Y.; Sun. F.; Che. Y. Public green spaces and human wellbeing: Mapping the spatial inequity and mismatching status of
public green space in the Central City of Shanghai. Urban Forestry and Urban Greening 2017, 27, pp. 59-68.
25. Tu, X.; Huang, G.; Wu. J. Contrary to common observations in the West, urban park access is only weakly related to neighbor-
hood socioeconomic conditions in Beijing, China. Sustainability 2018, 10 (4), art. 1115.
26. Xiao, Y.; Wang, Z.; Fang, J. Exploring the disparities in park access through Mobile phone data: Evidence from Shanghai, China.
Landscape and Urban Planning 2019, 181, pp. 80-91.
27. Omer, I.; Or, U. Distributive environmental justice in the city: differential access in two mixed Israeli Cities. Tijdschrift voor
Economische en Sociale Geografie 2005, 96 (4), pp. 433-443.
28. Rigolon, A.; Browning, M.; Jennings, V. Inequities in the quality of urban park systems: An environmental justice investigation
of cities in the United States. Landscape and Urban Planning 2018, 178, pp. 156-169.
29. Lara-Valencia, F.; García-Pérez, H. Disparities in the provision of public parks in neighborhoods with varied Latino composition
in the Phoenix Metropolitan Area. Local Environment 2018, 23 (12), pp. 1107-1120.
30. Kabisch, N.; Haase, D. Green justice or just green? Provision of urban green spaces in Berlin, Germany. Landscape and Urban
Planning 2014, 122, pp. 129-139.
31. Jennings, V.; Gaither, C. J.; Gragg, R. S. Promoting environmental justice through urban space access: a synopsis. Environmental
Justice 2012, 5 (1), pp. 1-7.
32. Ibes, D. C. Sustainable urban park systems. Cities and the Environment 2014, 7 (2), pp. 1-30.
33. Smiley, K. T., Sharma, T., Steinberg, A., Hodges-Copple, S., Jacobson, E.; Matveeva, L. More inclusive parks planning: park
quality and preferences for park access and amenities. Environmental Justice 2016, 9 (1), pp. 1-7.
34. Laatikainen, T.; Tenkanen, H.; Kyttä, M.; Toivonen, T. Comparing conventional and PPGIS approaches in measuring equality
of access to urban aquatic environaments. Landscape and Urban Planning 2015, 144, pp. 22-33.
35. Kabisch, N.; Haase, D. Green spaces of European cities revisited for 1990-2006. Landscape and Urban Planning 2013, 110, pp. 113-
122.
36. Corley, E. A.; Ahn, J. J.; Kim, Y.; Lucio, J.; Rugland, E.; Molina, Á. L. Conceptualizing lenses, dimensions, constructs, and indi-
cators for urban park quality. Environmental Justice 2018, 11 (6), pp. 208-221.
37. Saladié, Ò.; Roquer, S.; Oliveras, J.; Muro, J. I. Història de Tarragona. Volum VI: La ciutat actual. Geografia i urbanisme. Lleida, Pagès
Editors, 2012.
38. Ajuntament de Tarragona. Tarragona en xifres 2017. Tarragona, 2017.
39. Ajuntament de Tarragona. Espais verds i parc urbans de Tarragona, 2020. https://www.tarragona.cat/neteja-i-medi-ambient/espais-
verds-i-camins/parcs-urbans.
40. Pacione, M. Urban environmental quality and human wellbeing. A social geographical perspective. Landscape and Urban Plan-
ning 2003, 65, pp. 19-30.
41. Canosa, E., Sáez, E., Sanabria, C., Zavala, I. Metodología para el estudio de los parques urbanos: la Comunidad de Madrid.
GeoFocus 2003, 3, pp. 160-185.
42. Rivera, L. M. Los parques urbanos como indicadores de calidad de vida, símbolos de bienestar y espacios de uso recreativo:
una investigación en Bucaramanga (Colombia). Universidad & Empresa 2014, 16 (27), pp. 215-237.
43. Qiu, J.; Bai, Y.; Hu, Y.; Wang, T.; Zhang, P.; Xu, Ch. Urban Green Space Accessibility Evaluation Using Age-Based 2-Step Float-
ing Catchment Area Method. IGARSS 2019 - 2019 IEEE International Geoscience and Remote Sensing Symposium, pp. 7490-
7493, 2019.Preprints (www.preprints.org) | NOT PEER-REVIEWED | Posted: 23 June 2021 doi:10.20944/preprints202106.0554.v1
44. Schüle, S. A.; Hilz, L. K.; Dreger, S.; Bolte, G. Social inequalities in environmental resources of green and blue spaces: a review
of evidence in the WHO European region. International Journal of Environmental Research and Public Health 2019, 16, pp. 1-15.
45. Ibes, D. C. A multy-dimensional classification and equity analysis of an urban park system: A novel methodology and case
study application. Landscape and Urban Planning 2015, 137, pp. 122-137.
46. Csomós, G., Farkas, J. Z., Kovács, Z. Access to urban green spaces and environmental inequality in post-socialist cities. Hungar-
ian Geographical Bulletin 2020, 69 (2), pp. 191-207.
47. Yu, S.; Zhu, X.; He, Q. An assessment of urban park access using house-level data in urban China: through the lens of social
equity. International Journal of Environmental Research and Public Health 2020, 17, pp. 1-20.
48. Brown, G.; Rhodes, J.; Dade, M. An evaluation of participatory mapping methods to assess urban park benefits. Landscape and
Urban Planning 2018, 178, pp. 18-31.
49. Byrne, J.; Wolch, J. Nature, race, and parks: past research and future directions for geographic research. Progress in Human
Geography 2009, 33 (6), pp. 743-765.
50. Fors, H; Molin, J. F.; Murphy, M. A.; Bosch, C. K. van den. Use participation in urban green spaces – For the people or the parks?
Urban Forestry & Urban Greening 2015, 14, pp. 722-734.
51. Mullenbach, L. E., Baker, B.L., Benfield, J., Hickerson, B., Mowen, A. J. Assessing the relationship between community engage-
ment and perceived ownership of an urban park in Philadelphia. Journal of Leisure Research 2019, 50 (3), pp. 201-219.You can also read