Behavior of non-reinforced and reinforced green mortar with fibers - De Gruyter
←
→
Page content transcription
If your browser does not render page correctly, please read the page content below
Open Eng. 2021; 11:67–84

Research Article

Eethar Thanon Dawood* and Mafaz Hani Abdullah

Behavior of non-reinforced and reinforced green
mortar with fibers
https://doi.org/10.1515/eng-2021-0006                                        crease to 4.25 billion tons per year in 2030 [1]. The produc-
Received Aug 03, 2020; accepted Oct 06, 2020                                 tion of this material requires the use of a huge amount of
                                                                             raw materials (limestone, clay and etc), energy (electric-
Abstract: The behavior of non-reinforced green mortar
                                                                             ity and heat) and fossil fuels (natural gas, fuel oil, coak
with fibers has been observed. Different green mortar
                                                                             or some wastes) in addition to air and water [2–4]. The
mixes have been prepared using different percentages of
                                                                             high quantity of pollutants generated and non-renewable
waste glass powder (WGP), steel slag (SG) and silica fume
                                                                             resources consumed during cement industry make cement
(SF).The properties of flow, density, ultrasonic pulse veloc-
                                                                             material has a negative impact on the environment [4].
ity (UPV), compressive and flexural strengths have been
                                                                             Although this industry causes the formation of wastewa-
tested for such green mortar in the first phase of the ex-
                                                                             ter, solid waste, and noise, the main environmental issues
perimental work. The selected green mortar mix that gives
                                                                             are associated with air emissions and energy consump-
good properties with the acceptable ranges of cement re-
                                                                             tion. The high amounts of the carbon dioxide(CO2 ), nitro-
placement by such cementitious materials has been uti-
                                                                             gen oxides (NOx), sulfur oxides (SOx) and dust emissions
lized to achieve the second phase of the experimental
                                                                             in addition to the other air pollutants are released from
work. Thus, the uses of human hair fibers, sisal fibers and
                                                                             cement manufacturing [5–8]. Approximately 8% of glod-
stainless steel nails fibers in the form of individual and
                                                                             bal carbon dioxide (CO2 ) emission is released from cement
hybrid fibers system and testing for the same properties
                                                                             industry [8]. Moreover, the production of one ton of ce-
mentioned above have been performed. The third phase
                                                                             ment releases 360 pounds of dust [9], requires about 1.597
includes the cost estimation for the said mortar. Whereas,
                                                                             metric ton of raw materials [9, 10] and consumes a high
the last phase deals with analysis of the results using
                                                                             amounts of electricity and thermal energy. Another var-
the integrated AHP and TOPSIS method for selection the
                                                                             ious industrial processes (silicon metal, ferrosilicon and
best performance of the green mortar. The results of mono
                                                                             steel) also have a significant role on the environment im-
sisal fiber, human hair fiber and stainless nails fiber by
                                                                             pact. The accumulation of solid wastes generated as a
0.75, 0.75 and 2% of volume fraction respectively, exhib-
                                                                             byproduct of these industry is one of the reasons which
ited the highest increase in compressive strength, flexural
                                                                             lead to deteriorate the environment. In 2016, the global
strength, UPV and density compared with other percent-
                                                                             crude steel, silicon and ferrosilicon production has esti-
ages.
                                                                             mated at 1630, 2.7 and 6.4 million tons respectively [11].
Keywords: Green mortar, Sisal fibers, Human hair fibers,                     Production of one ton of the steel, silicon and ferrosili-
TOPSIS                                                                       con generates a high amount of solid waste like slag and
                                                                             silica fume dust respectively [12]. Besides the accumula-
                                                                             tion of the non-biodegradable solid waste like waste glass
                                                                             in the landfills is the one of phenomena which has neg-
1 Introduction
                                                                             ative impact on the environment. For reducing this en-
                                                                             vironmental impact, reducing of raw materials and en-
Cement is the one of the most produced materials in the
                                                                             ergy consumption during cement production, producing
world. Annual global cement production has been esti-
                                                                             sustainable building material, saving in cementand recy-
mated at 4.15 billion tons in 2016, and is expected to in-
                                                                             cling of waste products, many materials were blended with
                                                                             cement to make green building materials [13–16]. Waste
                                                                             glass powder(WGP), steel slag(SG) and Silica fume(SF) are
*Corresponding Author: Eethar Thanon Dawood: Building and                    non-biodegradable materials and available as waste mate-
Construction Dept, Technical College of Mosul, Northern Technical            rials [17–19]. Utilization these materials with cement can
University; Email:eethar2005@yahoo.com
                                                                             improve mortar or/and concrete workability, early and
Mafaz Hani Abdullah: Building and Construction Dept, Technical
College of Mosul, Northern Technical University                              long term strength and long term durability [20–22]. Phys-

  Open Access. © 2021 E. Thanon Dawood and M. Hani Abdullah, published by De Gruyter.                  This work is licensed under the Creative
Commons Attribution 4.0 License
68 | E. Thanon Dawood and M. Hani Abdullah
ical properties and chemical composition of these mate- strength as synthetic fibers such as polypropylene fibers
rials have a significant roleon the properties of concrete. and gain ductility and flexural toughness to concrete and
Many previous studies [23–26] have concluded that the mortar [49]. Recently, human hair has been also used as
chemical composition and the particle size of WGP have fibers for reinforcing concrete or mortar [50, 51]. Many re-
governed its pozzolanic activity, smaller particles decrease searchers [52–54] have reported that the reinforcing of con-
alkali silica reaction and give higher strength. crete with human hair fiber(HHF)can enhance mechan-
Several researchers [22, 27] have focused on the use ical properties. The use of micro fibers such as human
of SG with cement to improve the density ,durability and hair fibers (HHF) can delay the formation of micro cracks
strength of concrete at later ages. Many researchers [28–32] by enhancing the pre peak mechanical properties [55, 56].
have studied the properties of mortar or/and concrete pre- Moreover, utilization of Sisal fibers and Human hair fibers
pared from blended cement with supplementary cemen- has a positive impact on environmental and economic as-
titious materials (SCMs). Silica fume is the one of SCMs pects [57]. The incorporation of steel fibers in concrete and
which can contribute to improve the mechanical proper- mortar has been documented by many researchers [58, 59].
ties of mortar and concrete at identical water-binder ra- Although, this type of fibers have characterized by high
tio (W/b) and replacement level [33–35]. The high content elastic modulus, tensile strength, flexural rigidity and gain
of amorphous silicon dioxide and very fine particles of good properties to mortar and concrete. It is expensive
silica fume are responsible for its high pozzolanic activ- compared with other types of fibers. So, Stainless steel
ity [33, 36]. The amorphous silicon dioxide reacts with cal- nails (SIF) have been used as fibers instead of steel fibers
cium hydroxide, which is resulted from hydration cement, in this study. Stainless steel nails fibers are recognized by
and lead to produce calcium silicate hydrate (C-S-H). The low cost and good properties. Utilization this type of fibers
fine particles size of silica fume can fill the gap between ce- can contribute to increase the compressive strength, flexu-
ment particles. Thus, silica fume have significant role on ral strength and other properties of concrete [42].
the densify of the interfacial transition zone between ce- Several researchers [60, 61] have worked to improve ac-
ment paste and fine aggregate which lead to enhance the curate building material properties and predict new mod-
microstructure of cement mortar and concrete [33]. Utiliza- els. Multiple regression analysis is the one of statistical
tion of SF, SG and WGP as a supplementary cementitious techniques which have been utilized to analysis properties
materials in binary, ternary blends has been studied by of concrete and mortar, predict the good relationship be-
many researchers [37, 38]. They are observed that the use tween concrete or mortar properties and produce general-
of the mixture of SF and WGP or SG as a partial replace- ized results for new concrete or mortar before test [62–64].
ment of cement led to relieve the retardation effect of waste Analytic Hierarchy Process (AHP) and Technique for Order
glass powder or steel slag on the early hydration of cement Preference by Similarity to Ideal Solution (TOPSIS) are one
and improve the microstructure of hardened cement paste of these methods which were used to select the best rein-
at later ages. Thus, the use of Waste glass powder, Steel forced green mortar based on its behavior and to rank the
slag and Silica fume with cement in combination form can non-reinforced green mortars based on its cost.
contribute to produce green mortar and enhance its overall Although, many literatures are available for combina-
performance. Therefore, the utilize SCMs were considered tion silica fume and pozzolanic materials in the mortar or
in this study. concrete, their utilization with three different types of the
Generally, Concrete and mortar are brittle materials fibers (sisal fibers, human hair fibers and low cost stain-
with low tensile strength and low deformation capac- less steel nails) to produce reinforced green mortar is still
ity [39]. The incorporation of the fibers in cementitious ma- limited. The major objectives of this research can be sum-
trix mainly improves tensile, flexural, impact strength and marized into three parts:
flexural toughness [40–42]. Industrial and natural fibers
1. The investigation of the green mortar behavior pro-
have been studied by many researchers [43–45]. Utiliza-
duced from waste glass powder, steel slag and silica
tion of natural ,renewable and low cost fibers instead of
fume and reinforced with natural and cheap fibers.
industrial and high cost fibers has resulted in many advan-
2. Selecting and ranking the best green mortar based
tages such as reducing Carbon footprint of construction in-
on its properties and cost.
dustry, reducing of raw materials consumption and econ-
omy [46]. Sisal fibers(SIF) is one of the natural/vegetable
fibers which need a low degree of manufacturing for their
processing in comparison with synthetic fibers [47, 48].
It can contribute to provide the same level of flexuralBehavior of non-reinforced and reinforced green mortar with fibers | 69
spectively. As list in Table 1, the SO3 contents of clear
2 Materials and Mix proportions waste glass powder and steel slag powder was less than
the acceptable limit, Loss of ignition (LOI) and moisture
2.1 Materials content have been neglected. Minor compounds such as
ZrO2 , TiO2 , CuO, Cr2 O3 , NiO, MnO, As2 O3 are also found
Ordinary Portland Cement (OPC) type (CEM I) of strength in clear waste glass and steel slag samples under con-
class 42.5N was used in this study. It is obtained from Sulay- sideration, the amount of individual component was not
maniyah cement factory, Bazian district, Kurdistan, Iraq. more than 0.5%. Densified Micro-silica (SF)was procured
Clear waste glass powder and Steel slag powder (prepared from MSASA-Construction Solutions for Africa, Pomona
by ball mill machine) were supplied from glass recycling AH, South Africa.
plant andiron production factory, Mosul, Iraq respectively. The chemical composition and physical properties of
The specific gravity and fineness of these materials were OPC, WGP, SG and SF are given in Table 1. The sand used
measured according to ASTM C188 [65] and ASTM C204 for preparing of non-reinforced green mixes was prepared
[66]. Chemical composition of both Clear waste glass pow- according to 20-30 sand requirements ASTM C778 [67]. Its
der(WGP) and steel slag (SG) powder were examined us- specific gravity was measured according to ASTM C 128
ing a XRF-1800 Sequential X-ray fluorescence spectrome- [68] and was 2.590. Whereas, the sand used for preparing
ter. According to ASTM C618, (SiO2 + Al2 O3 + Fe2 O3 ) the reinforced green mixes was prepared according to graded
minimum requirement for a standard pozzolana is 70% sand requirements ASTM C778 [67]. It was used to obtain a
which is comparable with the results obtained for the clear homogeneous mixture containing fibers, the specific grav-
waste glass and steel slag samples. As per ASTM standard ity was 2.577. Superplasticizer obtained to enhance the
mentioned above, the maximum limit of SO3 , Loss on Ig- workability of mixes was procured from Specialties con-
nition (LoI) and Moisture content is 4%, 10% and 3% re- struction chemicals factory, Jahra, Kuwait. Its commercial
Table 1: Physical properties and Chemical composition of the OPC, WGP, SG and SF.
Description OPC WGP SG SF
Physical properties
Specific gravity, gm/cm3 3.15 2.315 4.994 1.98
Blaine’s fineness, cm2 /gm 4850 4094 8028 -
Chemical composition (% wt.)
Ferric oxide, Fe2 O3 % 3.44 1.168 95.430 0.795
Calcium oxide, CaO % 61.46 11.940 0.646 1.436
Silicon dioxide, SiO2 % 19.53 72.71 4.027 93.29
Potassium oxide, SO3 % 2.25 0.323 0.837 0.851
Alkalies (K2 O + Na2 O) % 0.58 8.906 1.078 0.875
Manganese oxide, MnO % - 0.014 0.496 0.043
Magnesium oxide, MgO % 3.82 1.480 0.141 0.137
Aluminum oxide, Al2 O3 % 4.92 1.487 0.523 0.264
Loss of ignition, % 3.11 - - -
C3 S % 57.39 - - -
C2 S % 13.53 - - -
C3 A % 7.20 - - -
C4 AF % 10.46 - - -
Table 2: Properties of superplasticizer
Typical characteristics
Specific gravity Setting time Air entrainment Chloride content Calcium chloride Content
1.06 – 1.08 @ No retardation at70 | E. Thanon Dawood and M. Hani Abdullah
(a) Sisal Fibers (b) Steel Nails (c) Human Hair Fibers
Figure 1: Fibers utilized in this study
Table 3: Fibers properties. before adding them to the mixes. Stainless steel nails (SNF)
were procured from local markets, Mosul, Iraq (Figure 1).
Properties SIF HHF SNF SIF and HHF were used in 0.5, 0.75 and 1% of volume frac-
Average diameter (mm) 0.225 0.20 0.92 tion. (SNF) were used in 1, 1.5 and 2% of volume fraction.
Average length (mm) 18±2 18±2 18±2 The properties of three different types of fibers are pre-
Specific gravity (gm/cm3 ) 1.4 0.4 6.678 sented in Table 3.
name is KUT PLAST PCE 600. The properties of superplas- 2.2 Mix proportions
ticizer are shown in Table 2. Tap water was utilized in all
mixes. In this research, total forty one [41] mixes were prepared;
Three different types of fibers used in this study were Ten [10] of them were prepared to measure pozzolanic ac-
sisal fibers, human hair fibers and stainless steel nails tivity for each of waste glass powder, steel slag and sil-
in mono and hybrid fibers system. Sisal fibers (SIF) were ica fume. Binder/sand ratio was 1:2.75, water/binder ratio
brought in bundles form with length 1 meter approxi- (W/B) was 0.59, and the mix proportions of these mixes are
mately. They were separated and cut into (18 ± 2) mm be- shown in Table 4.
fore using them in the mixes. They were supplied from lo- Moreover, nineteen [19] mixes were prepared to pro-
cal markets, Mosul, Iraq. Human hair fibers (HHF) were duce non-reinforced green mortars, binder/sand ratio was
obtained from local hair salons, Mosul, Iraq. They were 1:2.75, water + superplasticizer/binder ratio (W+SP/B) was
washed, separated, combed and cut them into (18±2) mm
Table 4: Mortar mix proportions for measuring Pozzolanic activity.
Mix No. Cement mixes (%) OPC WGP SG SF Sand W/B
(kg/m3 ) (kg/m3 ) (kg/m3 ) (kg/m3 ) (kg/m3 )
1 100%OPC 508 0 0 0 1397 0.59
2 90%OPC+10%WGP 454 51 0 0 1389 0.59
3 85%OPC+15%WGP 428 75 0 0 1383 0.59
4 80%OPC+20%WGP 402 100 0 0 1381 0.59
5 90%OPC+10%SG 460 0 51 0 1405 0.59
6 85%OPC+15%SG 435 0 77 0 1408 0.59
7 80%OPC+20%SG 411 0 103 0 1414 0.59
8 94%OPC+6%SF 475 0 0 30 1389 0.59
9 92%OPC+8%SF 464 0 0 40 1386 0.59
10 90%OPC+10%SF 453 0 0 50 1383 0.59Behavior of non-reinforced and reinforced green mortar with fibers | 71
Table 5: Mix proportions of non-reinforced green mortar.
Mix No. Cement mixes (%) OPC WGP SG SF Sand SP W+SP
(Kg/m3 ) (Kg/m3 ) (Kg/m3 ) (Kg/m3 ) (Kg/m3 ) % /B
U1 100%OPC 565 0 0 0 1554 2 0.39
U2 90%OPC+10%WGP 506 56 0 0 1546 2 0.39
U3 85%OPC+15%WGP 476 84 0 0 1540 2 0.39
U4 80%OPC+20%WGP 446 112 0 0 1535 2 0.39
U5 90%OPC+10%SG 512 0 57 0 1565 2 0.39
U6 85%OPC+15%SG 485 0 86 0 1570 2 0.39
U7 80%OPC+20%SG 458 0 115 0 1576 2 0.39
U8 94%OPC+6%SF 528 0 0 34 1546 2 0.39
U9 92%OPC+8%SF 515 0 0 45 1540 2 0.39
U10 90%OPC+10%SF 503 0 0 56 1537 2 0.39
U11 80%OPC+8%WGP+12%SG 454 45 68 0 1559 2 0.39
U12 80%OPC+10%WGP+10%SG 452 45 68 0 1554 2 0.39
U13 80%OPC+5%WGP+15%SG 455 29 85 0 1565 2 0.39
U14 78%OPC+10%WGP+12%SG 441 57 68 0 1557 2 0.39
U15 75%OPC+12.5%WGP+12.5%SG 423 71 71 0 1554 2 0.39
U16 75%OPC+10%WGP+15%SG 425 57 85 0 1559 2 0.39
U17 74%OPC+8%WGP+12%SG+6%SF 417 45 68 34 1551 2 0.39
U18 72%OPC+8%WGP+12%SG+8%SF 405 45 67 45 1546 2 0.39
U19 70%OPC+8%WGP+12%SG+10%SF 393 45 67 56 1543 2 0.39
Table 6: Mix proportions of reinforced green mortar used superplasticizer
Index OPC Sand WGP SG SF Sp. (%) W+SP./B SIF (%) HHF (%) SNF (%)
(kg/m3 ) (kg/m3 ) (kg/m3 ) (kg/m3 ) (kg/m3 )
M0 358 1405 41 61 51 2 0.56 - - -
M1 358 1405 41 61 51 2 0.56 0.5 - -
M2 358 1405 41 61 51 2 0.56 0.75 - -
M3 358 1405 41 61 51 2 0.56 1 - -
M4 358 1405 41 61 51 2 0.56 - 0.5 -
M5 358 1405 41 61 51 2 0.56 - 0.75 -
M6 358 1405 41 61 51 2 0.56 - 1 -
M7 358 1405 41 61 51 2 0.56 - - 1
M8 358 1405 41 61 51 2 0.56 - - 1.5
M9 358 1405 41 61 51 2 0.56 - - 2
M10 358 1405 41 61 51 2 0.58 0.5 0.5 1.5
M11 358 1405 41 61 51 2 0.58 0.75 0.5 1
0.39, the mix proportions of these mixes are listed in Ta- imum superplasticizer dosage (2%) by weight of cement
ble 5. was also used in these mixes as listed in Table 6.
Another twelve [12] mixes were prepared by substitut-
ing 8%, 12% and 10% of cement by WGP, SG and SF re-
spectively and using three different types of fibers (sisal
fibers, human hair fibers and stainless steel nails) with
different percentages of volume fraction to produce rein-
forced green mortars, binder/sand ratio was 1:2.75, max-72 | E. Thanon Dawood and M. Hani Abdullah
strength for 50×50×50 mm and 40×40×160 mm samples, re-
3 Methodology spectively, at age 7 and 28 days.
3.1 Experimental method
Ten [10] mixes were prepared to measure the pozolanic ac- 3.2 AHP and TOPSIS methodology
tivity of solid waste materials (waste glass powder, steel
slag and silica fume) by following steps: a) Cement and 3.2.1 Analytic Hierarchy Process (AHP)
solid waste material were mixed for 1 to 2 minutes. b) Then,
the sand was added and mixed with the mixture for 1 to 2 The Analytic Hierarchy Process (AHP) is a multi-criteria
minutes. c) Tap water was added to the mixture and mixed decision making approach which organizes and analyzes
for 2 to 3 minutes. Non-reinforced green mixes were pre- complex decisions [73]. It was developed by Thomas Saaty
pared by the same steps mentioned above, except that the in the 1970, 1980 and 1990 [74]. The decision problem in
superplasticizer was mixed with tap water before adding this approach is arranged in hierarchic structure [74]. The
into the mixture. Reinforced green mixes were prepared arrangement is in the descending form from an overall
by the same steps mentioned above. Then, the fibers were goal to criteria, sub-criteria and alternatives in successive
added gradually in to the mixture. levels [75]. In this paper, AHP was used to evaluate the
At least three [3] specimens were cast for all mixes. weight of the thirteen [13] criteria of reinforced green mor-
These specimens were prepared at room temperature tars and non-reinforced green mortars. Five [5] of them
(25±2∘ C). After 24 hour of molding and humidity not less were compressive strength, flexural strength, UPV and cost
than 75%, the specimens were demolded, immersed in tap of reinforced green mortars and another eight [8] were raw
water and treated up to 7 and 28 days. materials, electricity energy, thermal energy, CO2 , dust,
Flow test was conducted for each mix according to waste glass, steel slag and silica fume of non-reinforced
ASTM C1437 [69]. Dry density test was conducted for green mortars. The criteria weight of reinforced green mor-
70.7×70.7×70.7mm specimens at 28 day according to ASTM tars and non-reinforced green mortars were computed us-
C642 [70]. Ultrasonic pulse velocity (UPV) was performed ing the following general steps:
through 70.7×70.7×70.7 mm specimens at 28 day as per
to ASTM C642 [70] after thirty minutes of taking them
out of water. The compressive and flextural strength tests Step 1:
were applied on 50×50×50 mm cubes and 40×40×160 mm Conduct the comparison for two criteria at the same time
prisms at different ages (7 and 28 days) by using ASTM with respect their impact on the mortar prepared. The
C109 [71] and ASTM C348 [72] respectively. comparison conducts based on the one common scale
Motorized Cement flow table was used for measuring (adapted from Satty [75] that is displayed in Table 7 to build
flowability of mixes. Laboratory oven was used to deter- the Pair-wise comparison matrix (F).
mine the mass of oven-dried sample and the mass of sur- The Pair-wise comparison matrix (F) builds by asking
face dry sample after boiling for 5 hours. Specific grav- questions to experts or decision makers like, which crite-
ity apparatus was used to calculate apparent mass of the rion is more important with regards to the decision goal.
sample in water. Ultrasonic tester was utilized for mea- The answers to these questions will construct the matrix
suring the propagation time of ultrasound pulses with a
precision of 0.1 µs through 70.7×70.7×70.7 mm specimen.
Hydraulic compression testing machine (300 kN capacity)
was utilized to measure compressive strength and flexural
Table 7: One common scale (adapted from Saaty) used in this study.
Definition
Equal Somewhat Much more Very much Absolutely Intermediate
importance more important more more Values
important important important
Intensity of 1 3 5 7 9 2, 4, 6, 8
importanceBehavior of non-reinforced and reinforced green mortar with fibers | 73
Table 8: Values of the Random Consistency Index (RCI) for small problems.
Number of criteria
2 3 4 5 6 7 8 9 10
Random Consistency Index 0 0.58 0.90 1.12 1.24 1.32 1.41 1.45 1.51
∑︀4
(F) as shown below: b) Calculate the sum of each raw ( j=1 Yij) in the ma-
C2 · · · C m ⎫ trix (Y). The result will be (S).
⎧ C1
C1 ⎪ f12 · · · f1m ⎪
⎧ ⎫
f11
⎪
⎪ ⎪
⎪ ⎪ S1 ⎪
⎪ ⎪
= C2 f21 f22 · · · f2m ⎪
⎪ ⎪
⎨ S2 ⎪
⎪
F = (f ij )m×m ⎨ ⎬ ⎪ ⎬
.. ⎪ .. .. .. .. ⎪ S= .
. ⎪
⎪ . . . . ⎪
⎪ ⎪
⎪ .. ⎪
⎪
⎪ ⎪ ⎪ ⎪
C m f m1 f m2 · · · f mm
⎩ ⎭ ⎪
⎩ ⎪
Sm
⎭
where f ij represents a quantified judgment on C i /C j with c) Divide the calculated sum of each raw (S) to criterion
f ii = 1 and f ij = 1/f ji for i, j = 1, · · · , m weight (wi). The result will be (S/W)
⎧ ⎫
⎪
⎪ S1 /w1 ⎪ ⎪
⎪ ⎪
Step 2: ⎨ S2 /w2 ⎪
⎪ ⎬
S/W =
Compute the sum ( 4i=1 f ij ) for each column in matrix (F). ⎪ ... ⎪
∑︀
⎪ ⎪
Then, divide (F ij ) to computed sum according to Eq. 1, the
⎪
⎪ ⎪
⎪
S m /w m
⎩ ⎭
result will be matrix (X):
F ij Compute the consistency index (CI) according to
x ij = ∑︀m (i = 1, 2 . . . 4, j = 1, 2 . . . 4) (1) Eq. 2.
i=1 F ij
(︁ ∑︀m )︁
i=1 (S/w)ij
m −m
⎧ C1 C2 · · · C m ⎫ CI = (2)
m−1
C1 ⎪ ⎪ x11 x12 · · · x1m ⎪ ⎪
(where, m is number of compared criteria)
⎪ ⎪
X= C 2
⎪
⎨ x21 x22 · · · x2m ⎪ ⎬
.. ⎪ .. .. .. .. ⎪ The random consistency index (RCI) is obtained us-
. ⎪ . . . . ⎪
⎪
⎪ ⎪
⎪ ing Table 8. Based on the number of the criteria used
C m x m1 x m2 · · · x mm
⎩ ⎭
in AHP method, the random consistency index is de-
termined. The consistency ratio (CR) is computed by
dividing (CI) to (RC). If the consistency ratio (CR) is
Step 3:
≤ 0.1 ,the pair wise comparison matrix (F) is consid-
Calculate the average of each raw in the matrix (X) to ob-
ered to have an acceptable trust worthy and consis-
tain the weight (w) of each criterion.
tency; otherwise, it required to be revised [76].
Step 4:
3.3 Technique for Order Performance by
Check the consistency of the pairwise comparison matrix
(F) by using the following steps: Similarity to Ideal Solution (TOPSIS)
a) Construct matrix (Y) by multiplying the criterion TOPSIS is a simple and useful approach which is used to
weight (w) withpairwise comparison matrix (F). deal with the complex system related to making a best
C2 · · · C m ⎫ choice among several alternatives [77]. It was developed
⎧ C1
C1 ⎪ Y11 Y12 · · · Y1m ⎪ by Ching-Lai Hwang and Yoon in 1981. The concept of this
⎪ ⎪
technique is based on the selecting the ideal alternative
⎪ ⎪
Y= C 2
⎪
⎨ Y 21 Y22 · · · Y2m ⎪ ⎬
.. ⎪ .. .. .. .. ⎪ which has the shortest distance from the positive ideal so-
. ⎪ . . . . ⎪
⎪
⎪ ⎪
⎪ lution and the farthest distance from the negative ideal
C m Y m1 Y m2 · · · Y mm
⎩ ⎭
solution [62]. In this research, TOPSIS was used to select
Where Yij represents the result of the multiplying fij and rank the best of reinforced green mortar based on
by wj, i = 1, . . . , m; j = 1, . . . , m. its properties. In addition this technique was also used74 | E. Thanon Dawood and M. Hani Abdullah
to determine and rank the best and worst non-reinforced Step 5:
green mortar based on its impact on the environment. The Compute the distance of all alternatives to the positive and
ranking and determining of reinforced and non-reinforced negative ideal reference point (D+ and D− ) by using Eq. 4
green mortars was achieved using the following steps: and Eq. 5, respectively.
⎯
⎸ n
⎸∑︁
+
Di = ⎷ (bij − aj+ )2 (4)
Step 1: j=1
Construct the decision matrix (N) for ranking of the alter-
natives, the structure of matrix can be expressed as follow: ⎯
⎸ n
⎸∑︁
Di− = ⎷ (bij − aj− )2 (5)
⎧ C1 C2 · · · C n ⎫
A1 ⎪⎪ Z11 Z12 · · · Z1m ⎪⎪
j=1
⎪ ⎪
N = A2 Z21 Z22 · · · Z2m ⎬
⎪
⎨ ⎪
.. ⎪ .. .. .. .. ⎪
. ⎪
⎪ . . . . ⎪
⎪ Step 6:
⎪ ⎪
A m Z m1 Z m2 · · · Z mm
⎩ ⎭
Calculate the relative closeness coefficient (R) of each al-
Where A i represents the alternatives i, i = 1, . . . , m; C j rep- ternative to the ideal reference point by using Eq. 6. Then,
resents the criteria that are required on which the alterna- conduct the outranking of the alternatives in descending
tive is judged, j = 1, . . . , n; Z ij represents j th attribute, order. The larger value of Ri indicates to the better perfor-
j = 1, . . . , n related to i, the alternative; and Z ij is the ob- mance of the alternative.
tained value representing the performance rating of each D−i
R i = (︀ (6)
D+i + D−i
)︀ (︀ )︀
alternative Ai with respect to each requirement C j .
Step 2:
Calculate the normalized decision matrix (V): The raw
4 Results and discussion
data can be normalized by utilizing Eq. 3. to produce the
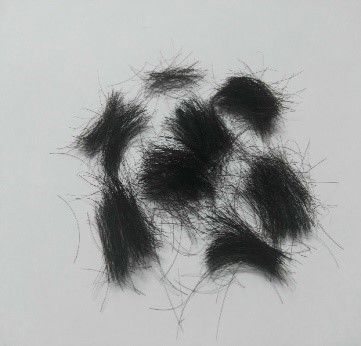
4.0.1 Pozzolanic activity index (PAI)
matrix (V).
n ij
V ij = √︃ (3)
m The average of three values of compressive strength of mor-
2
∑︀
n ij tar prepared for measuring the pozzolanic activity of waste
i=1
glass powder, steel slag or silica fume are shown in (Fig-
Where i = 1, 2, 3, . . . . . . , m and j = 1, 2, 3, . . . . . . , n ure 2). The ratio between compressive strength of mortar
containing supplementary cementitious material (waste
glass powder, steel slag or silica fume) and compressive
Step 3: strength of control mortar at the same age is called activity
Compute the weighted normalized decision matrix (B) by index which assesses the pozzolanic activity of the supple-
multiplying the weights of criteria (w) with the normalized mentary cementitious materials as displayed in (Figure 2).
decision matrix (V). In this paper, the weights of criteria The results indicate that the compressive strength of mor-
(w) were previously calculated based on AHP method. tar containing waste glass powder or steel slag decreases
with increases cement. The reduction of the strength can
be attributed to the reduction of the amount of cement and
Step 4: the pozzolanic activity variation of these materials and ce-
Determine the positive ideal reference point (A+ ) and neg- ment. Moreover, the presence of these materials in cement
ative ideal reference point (A− ) respectively. past lead to delay of C3 S and C3 A hydration at early age
A+ = {a+1 , a+2 . . . a+n } = {(max bij|j ∈ Cb), (mini bij|j ∈ CP)} and the activity of the compounds (SiO2 + Al2 O3 + Fe2 O3 )
of waste glass powder or steel slag is less than the activity
of the same compounds of cement [23, 78].
A− = {a−1 , a−2 . . . a−n } = {(mini bij|j ∈ Cb), (max bij|j ∈ CP)}
Although, The use of waste glass powder and steel slag
Where Cb is benefit-type attributes (the higher value is the led to slightly decrease in the strength, these materials are
better) and Cp is benefit -type attribute (the lower value is considered in this study due to its pozzolanic activity. As
the better). per ASTM C 618 [79], the minimum requirement of strengthBehavior of non-reinforced and reinforced green mortar with fibers | 75
activity index for a standard pozzolana is 75% at age 7 and of silica fume leads to more quantity demand of water for
28 days. Therefore, Waste glass powder and steel slag are hydration and for flowability [21, 33, 81]. In contrast, waste
considered as pozzolanic materials due to the strength ac- glass powder content in mix does slightly increase of flow
tivity index of waste glass powder and steel slag, at replace- mix by increasing replacement ratio of cement. It might be
ment level 20%, was 87 and 86% at age 7 days and 80 and the effect of glass material which is cleaner in nature. This
79% at age 28 days respectively. result is supported by recently studies which conducted by
Also, the strength activity index of silica fume was ex- other researchers [33, 82].
amined according to ASTM C1240 [80]. The results indi- On the other side, the results in Table.10 indicate
cate that the strength activity index of silica fume, at re- that the folwability of green mix reduces due to the ad-
placement level 10%, is 112 and 104% at age 7 and 28 days dition of the sisal fibers. This can be attributed to the
respectively. As per ASTM C standard mentioned above, amount of cellulose which forms (43-56)% by weight of
the minimum requirement of accelerated pozzolanic activ- sisal fibers [83]. The large quantity of hydrophilic hydroxyl
ity index of silica fume is 85% at age 7 days. Therefore, groups which containing cellulose make sisal fibers are
this material is considered as pozzolanic material in this water-absorbent [84]. The same trend at adding human
research. Moreover, the results indicate that the compres- hair fibers to the mix.
sive strength of mortar containing replacement ratio of ce- Indeed, the chemical composition of cortex and cuti-
ment by 10% of silica fume show the highest compressive cle, which consisted of human hair fiber, rich of keratin
strength in comparison with other mortars. Indeed, the peptide bonds as well as to hydrophilic side chains (pheno-
high fineness, high content of amorphous silicon dioxide lic, carboxyl, amino, hydroxyl, guanidine, etc.) which con-
of silica fume and sufficient content of calcium hydroxide tribute to absorption of water [85]. Therefore, addition hu-
acquired by hydration of cement play a significant role on man hair fibers to the mix led to reduce its flowability. But,
improvement production of calcium silicate hydrate (C-S- the inclusion of stainless steel nails in the mix increases
H) supplying additional compressive strength [19]. the flowability of mortar as shown in Table 10. This is may
be attributed to low porosity and softness of the surface
of this type of fibers as well as shape of roller tapered of
stainless steel nails.
In hybridization case, it is observed that the flowabil-
ity of reinforced green mixes with hybrid fibers M10 and
M11 was decreased obviously. Therefore, water-binder ra-
tio was increased to 0.58 for obtaining flowability 80% and
60% for M10 and M11 respectively as shown in Table 10.
The reduction of flowability of M11 was higher than M10.
This can be attributed to the amount of sisal fibers and
stainless steel nails which was used in the both mixes. The
increment of sisal fiber volume fractions and reduction of
stainless steel nails volume fraction in M11 led to decrease
its flowability compared with M10.
4.0.3 Compressive strength
Figure 2: Activity index at 7 and 28 days
Table 9 lists the results of the compressive strength of
non-reinforced green mortar. The results indicated that
the compressive strength of mortars containing replace-
ment ratio of cement by waste glass powder and steel slag
4.0.2 Workability was decreased in comparison with control mortar (U1) at 7
and 28 days. The decreasing rate was by 21.345, 0.778 and
Table 9 exhibits the flowability of non-reinforced green 9.895% at age 28 days for U2, U3 and U4, respectively. And
mixes. This table indicates that the flowability of the mix by 22.937, 18.137 and 34.020% at age 28 days for U5, U6 and
decreases with increases the replacement ratio of cement U7, respectively, in comparison with control mortar. So, the
by silica fume or/and steel slag. The high specific surface replacement 15% of cement by waste glass powder or steel76 | E. Thanon Dawood and M. Hani Abdullah
Table 9: Non-reinforced green mortar test results.
Mix Cement mixes (%) Flow Compressive Flexural UPV. Dry density
Name (%) strength (MPa) strength (MPa) (Km/sec) (Kg/m3 )
7day 28day 7day 28day 28day 28day
U1 100%OPC 113 36.465 40.331 6.821 7.823 4.521 2266
U2 90%OPC+10%WGP 113 26.691 31.722 6.012 6.782 4.046 2210
U3 85%OPC+15%WGP 115 33.879 40.017 6.681 7.800 4.402 2256
U4 80%OPC+20%WGP 109 30.373 36.340 6.594 7.497 4.287 2250
U5 90%OPC+10%SG 113 27.892 31.080 6.013 6.691 4.001 2212
U6 85%OPC+15%SG 110 29.608 33.016 6.303 7.142 4.131 2242
U7 80%OPC+20%SG 105 22.989 26.610 5.032 6.209 3.527 2165
U8 94%OPC+6%SF 105 36.948 42.836 6.701 7.482 4.556 2270
U9 92%OPC+8%SF 100 41.533 43.394 6.821 7.563 4.582 2283
U10 90%OPC+10%SF 82 43.372 48.866 7.021 8.032 4.713 2369
U11 80%OPC+8%WGP+12%SG 108 29.269 31.896 6.213 6.679 4.024 2220
U12 80%OPC+10%WGP+10%SG 115 28.059 33.927 5.861 7.380 4.356 2248
U13 80%OPC+5%WGP+15%SG 105 24.799 32.344 5.758 6.977 4.207 2229
U14 78%OPC+10%WGP+12%SG 110 26.887 31.908 5.823 6.782 4.092 2222
U15 75%OPC+12.5%WGP+12.5%SG 113 24.805 32.569 5.523 7.146 4.227 2235
U16 75%OPC+10%WGP+15%SG 109 23.271 30.331 5.227 6.094 4.032 2206
U17 74%OPC+8%WGP+12%SG+6%SF 113 23.204 29.323 5.321 6.502 3.901 2197
U18 72%OPC+8%WGP+12%SG+8%SF 110 25.178 30.088 5.921 6.821 4.021 2210
U19 70%OPC+8%WGP+12%SG+10%SF 108 29.572 32.068 6.221 7.321 4.107 2225
Table 10: Reinforced green mortar test results.
Index Flow (%) Compressive Strength (MPa) Flexural Strength (MPa) UPV. Dry density
(Km/sec) (Kg/m3 )
7day 28-day 7-day 28-day 28-day 28-day
M0 135 20.480 28.088 4.452 4.831 3.645 2100
M1 128 20.661 28.206 4.686 5.166 3.667 2165
M2 118 21.657 30.170 4.968 5.562 3.919 2173
M3 105 20.773 28.265 4.858 5.202 3.668 2169
M4 132 20.547 29.021 4.621 5.021 3.887 2173
M5 128.6 20.809 30.733 4.829 5.342 3.989 2191
M6 126 20.490 28.675 4.612 5.088 3.701 2137
M7 138.6 21.677 29.012 6.092 6.285 3.901 2234
M8 142 21.930 29.597 6.560 6.767 3.951 2278
M9 144 22.912 32.408 7.005 8.177 3.991 2323
M10 80 23.555 28.578 5.661 5.787 3.698 2260
M11 60 22.130 28.098 5.295 5.638 3.655 2174
slag boosts the best performance in comparison with 10 19.245 and 24.794% at age 28 days for U11, U12, U13, U14,
and 20% replacement ratio of cement. U15 and U16, respectively. And, the reduction of compres-
Moreover, the results of mortar using of the mixture sive strength was by 27.294, 25.397 and 20.487% at age of
of waste glass powder and steel slag as partial replace- 28 days for the mixes U17, U18 and U19, respectively, com-
ment of cement indicated that the compressive strength pared to control mortar.
was reduced in comparison with control mortar at 7 and 28 The reduction of mortar strength containing waste
days. The reduction was by 20.914, 15.878, 19.803, 20.884, glass powder or /and steel slag can be attributed to the de-Behavior of non-reinforced and reinforced green mortar with fibers | 77
creasing of the amount of cement in the mix and the con- posites of mortar which led to diminish of porosity of hard-
tribution of the hydration or the pozzolanic reactivity of ened mortar [59].
waste glass powder or steel slag did not compensate for the While, reinforced mix by 0.5, 0.75 and 1% of human
reduction of the cement content [86]. Moreover, the pres- hair volume fractions led to increase the compressive
ence of slag in cement mortar leads to slightly delay the strength of mortar by 3.321, 9.416 and 2.089% at 28 days
hydration of C3 S at early age where slag acts as retarder to respectively. This enhancement in compressive strength
the hydration of compound C3 A [87]. come back to the proper amount of HHF which did not lead
Although, the results show that the presence of waste to cause balling and lumping of HHF during the mixing
glass powder and steel slag led to decrease the strength, process as well as high modulus, high tensile strength of
the reduction of the strength of mortar containing waste HHF and its ability to reduce the micro-fractures or cracks
glass powder was lower than mortar containing slag. This of hardened mortar [54]. Also, it can be seen that the inclu-
is attributed to the high content of amorphous of silicon sion 1% of HHF in the mix led to decrease the compressive
dioxide (72.71%) and the sufficient content of Na2 O in strength by 1.532 and 2.089% at age 7 and 28 days respec-
waste glass powder. Indeed, the presence of Na2 O in ac- tively in comparison with M5 as listed in Table 10. This re-
ceptable level led to act as a catalysts in forming calcium duction can be attributed to the agglomeration of HHF dur-
silicate hydrate in early age [78, 86]. ing blending with composites of mortar which has resulted
While, the results of the mortar containing replace- in non-homogeneity mix as noted by [50].
ment ratio of cement by silica fume indicate that the com- Moreover, the results in Table 14, indicates that the
pressive strength increases with increase silica fume con- compressive strength of M7, M8 and M9 increased by
tent in the mortar compared with control mortar. The in- 3.290%, 5.372% and % 15.380, respectively at age 28 days
crements were by 6.211, 7.594 and 21.162% at age 28 days in comparison with control mortar (M0). The increasing of
for U8, U9 and U10, respectively. compressive strength can be ascribed to the good mechan-
The increases in the compressive strength can be at- ical bond strength between the stainless steel nails and
tributed to the decreased volume of large pores in the ce- mortar.
ment mortar and the spaces between fine aggregate and For hybrid fiber reinforced mortar, the compressive
cement past due to its high fineness [63, 78]. Moreover, sil- strength of M10 and M11 has shown increment by 1.744 and
ica fume have significant role on the reducing of Ca(OH)2 0.035%, respectively, at age of 28 days, compared with con-
resulted from cement hydration by reacting with it to form trol mortar.
C3 S2 H3 [63, 78]. Thus, the presence of silica fume was en-
hanced the strength of mortar in this study.
On the other side, the drop in compressive strength 4.0.4 Ultrasonic pulse velocity (UPV)
of mortar containing silica fume, waste glass powder and
steel slag blended cement can be attributed to the rea- Table 9 illustrates the results of ultrasonic pulse velocity
sons mentioned above regarding to the presence of waste test (UPV) of non-reinforced green mortar. The results indi-
glass powder and steel slag. Although, the silica fume con- cate that the UPV of mortar containing waste glass powder
tributes to increase the strength of mortar the agglomera- and steel slag was decreased compared to control mortar.
tion of silica fume, which cannot be broken down by nor- The decreasing recorded rate ranged from 2.632 to 10.506%
mal mixing, lead to decrease the strength. The core of ag- due to partial replacement of cement by WGP. Also, there
glomeration does not take part in hydration. Thus, it cause were remarkable decreases of UPV due to the partial re-
the weakness in binder paste [29]. placement of cement by SG. Such decreases ranged from
Table 10 shows the results of reinforced green mortar 8.626 to 21.986% by such replacement. In contrast, the
with mono and hybrid fibers. This Table shows that the mortar containing replacement ratio of cement by the sil-
compressive strength of M1, M2 and M3 was increased by ica fume exhibited slight increases of UPV. The increasing
0.420%, 7.412% and 0.630%, respectively, at age 28 days rate ranged from 0.774 to and 4.246% by partial replace-
compared with control mortar M0. The higher increase ment of cement with SF. The grain size and high quantity
was observed at M2 then the compressive strength of M3 of hydration products (C-S-H and CH) of silica fume in com-
was demonstrated the reductions by 4.081 and 6.314% at parison with WGP and SG led to reduction in porosity and
7days and 28 days respectively. The increase in compres- void ratio of hardened mortar [86]. Thus, UPV of mortar
sive strength may be attributed to identical SIF percent and containing silica fume higher than UPV of mortar contain-
bond strength between the surface of sisal fibers and com- ing waste glass powder or/and steel slag.78 | E. Thanon Dawood and M. Hani Abdullah
The similar trend for mortar containing WGP, SG and tively, at age 28 days. Moreover, the increment of the flex-
SF blended cement. UPV results revealed mild to moder- ural strength of M9 was higher than that of M10 and
ate decreases by the inclusions of different percentages of M11. The increments were by 41.299 and 45.034% at age
such cementitious materials. 28days, respectively. The use of mono stainless steel fibers
However, the highest reduction of UPV has been ob- shows a significant increment of flexural strength for mor-
tained due to replacement of cement by to WGP and SG tar. While, the use of this type of the fiber with sisal fibers
which has less efficiency compared with silica fume result- and human hair fibers in hybrid form led to decrease the
ing in porosity and void ratio increases in the hardened flexural strength in comparison with mortar containing
mortar which cause decreasing in UPV [87]. stainless steel nails in mono form. This can be attributed to
The results in Table 10 indicate that the UPV of sisal clearly decrease the flowability of reinforced mortar with
fiber reinforced mortar, Human hair fiber reinforced mor- hybrid fibers. Besides of that, some of sisal fibers and hu-
tar and stainless steel nail reinforced mortar showed man hair fibers were agglomerated leading to cause non-
higher values of UPV than that of control mortar. The in- homogeneous mix.
creases in such values ranged from 0.603 to 9.492% for
mixes (M1-M9). Moreover, the results of mortar contain-
ing hybrid fibers showed that the UVP of M10 and M11 in- 4.0.6 Dry density
creased by 1.454 and 0.274%, respectively, compared with
control mortar. This can be attributed to good mechanical Table 9 depicts the results of oven dry density of non-
bond between the fibers and cementitious matrix and the reinforced green mortars. The obtained results indicate
ability of fibers to arrest cracks at the micro and macro lev- that the dry density of control mortar (100% OPC) was
els which leads to densify of the microstructure and de- higher than mortar containing waste glass powder or/and
crease the cracks and porosity in hardened mortar. steel slag. The decreasing of the density can be ascribed
to the greater variation between pozzolanic reactivity of
cement and supplementary cementitious materials (waste
4.0.5 Flexural strength glass powder and steel slag) which led to increase the
voids ratio and the porosity in hardened mortar. In con-
The results of flexural strength of non-reinforced green trast, the density of mortar containing silica fume. The re-
mortar are given in Table 9. The results indicate that the sults indicates that the density of mortar U8, U9 and U10
flexural strengths of mortar containing waste glass powder was higher than of control mortar (100%OPC). The increas-
or/and steel slag were decreased in comparison with con- ing was by 0.176, 0.750 and 4.545% respectively. This is be-
trol mortar (100%OPC). This can be attributed to the same cause of high amount of amorphous silicon dioxide made
reasons mentioned in compressive strength. However, a by silica fume to reduce Ca(OH)2 provided by cement hy-
slight increase in flexural strength of mortar prepared by dration to form calcium silicate hydrate gel [39, 54]. More-
90% OPC+10% SF has been recorded. over, the high fineness of silica fume made it acts as filler
While, the results indicate that the flexural strength of material and because of which fits the spaces between ce-
mortar containing mono or hybrid fibers was higher than ment past matrix and the aggregate cement paste interfa-
control mortar as listed in Table 10. The highest increases cial zone leading to improve the density of hardened mor-
were 15.131, 10.577 and 69.261% at age 28days for individual tar [20]. Also, it is observed that the dry density of M1, M2
fibers form 0.75% SIF, 0.75% HHF and 2% SNF. The devel- and M3was higher than Control mortar(M0). The increas-
oping of the flexural strength can be attributed to the good ing was by 3.095, 3.476 and 3.285% respectively as shown
mechanical bond between the fibers and cementitious ma- in Table 10. The same trend for M4, M5 and M6, there
trix. The presence of fibers, on the other hand, had a bene- was little increasing by 3.476, 4.333 and 1.761% respectively.
ficial effect on the post-crack behavior, promote the flexu- The reason can be attributed to good mechanical bond be-
ral strength and ductility and hence toughness of the mor- tween cementitious matrix and fibers. Moreover, the use
tar [43]. The increasing of flexural strength was mainly ob- of sisal fibers and human hair fibers can contribute to fill
served in the reinforced mortar containing higher volume the micro space in cementitious matrix leading to improve
fraction of stainless steel nails due to the high elastic mod- the density. Moreover, the inclusion of 1, 1.5 and 2% volu-
ulus of stainless steel nails compare to other fibers. metric fraction of stainless steel nails led to increase the
In hybridization case, It is observed that the flexu- oven dry density. The increasing was by 6.380, 8.476 and
ral strength of M10 and M11 was higher than of control 10.619% for M7, M8 and M9 in comparison with control mor-
mortar. The increases were by 19.788 and 16.704% respec- tar (M0). This is because of high specific gravity of stainlessBehavior of non-reinforced and reinforced green mortar with fibers | 79
steel nails and ability of this type of fibers to improve inter- 4.2 Selection of the best green mortar
facial bond characteristics between the matrix and fibers.
For hybridization mixes, the results Indicate that the The integrated AHP and TOPSIS method was also used to
dry density of M10 and M11was increased by 7.619 and rank and select the best reinforced green mortar. In this
3.523, respectively, in comparison with control mortar stage, there were twelve [12] alternatives and four [4] crite-
(M0).This enhancements are attributed to appropriate ra- ria of reinforced green mortars. The alternatives were rep-
tio uses of sisal fiber, human fiber and stainless steel nails resented the reinforced green mortars. The criteria were
volume fraction which led to improve the microstructure represented the properties of the reinforced green mor-
of matrix [48, 54]. tar which were Compressive strength, Flexural strength,
UPV and Cost. Based on AHP method, the weight for each
criterion was calculated. The matrices and results, which
4.1 Estimation of green mortar cost were obtained through applying of AHP method to evalu-
ate the criterion weight, were illustrated in Table 13-14. The
The estimated cost of reinforced green mortar was eval- checking of pair-wise matrix (F) was achieved according to
uated on the basis of the different materials which were the step 4 which was previously mentioned in the general
used to prepare green mortar as listed in Table 11-12. The steps of AHP method. The results were listed in Table 15.
estimated cost of each material was depended on the exist- The consistency index (CI) obtained was 0.020 and the
ing market cost. random consistency obtained from Table 8 was 0.9. Thus,
the pair-wise comparison matrix was considered in this
study due to the consistency ratio was 0.022. Then, TOPSIS
Table 11: Estimated cost of material used
Materials Quantity Cost in USD ($) Table 13: The pair-wise comparison matrix (F) of reinforced green
mortars (AHP method).
OPC 1000 Kg 67$
WGP 1000 Kg 55$1
Compressive Flexural UPV Cost
SG 1000 Kg 55$1
strength strength in
SF 1000 Kg 850$
USD
Local River Sand 1000 Kg 17$
Compressive 1 1 2 1/3
Superplasticizer 1000 Liter 1000$
strength
SIF 1000 Kg 150$
Flexural 1 1 2 1/3
HHF 1000 Kg 100$2
strength
SNF 1000 Kg 800$
UPV 1/2 1/2 1 1/3
1: Grinding cost, 2: Collecting and Washing cost
Cost in USD 3 3 3 1
Table 12: Estimated cost of reinforced green mortar
Index OPC Sand WGP SG SF SIF HHF SNF Sp. Cost in
(Kg/m3 ) (Kg/m3 ) (Kg/m3 ) (Kg/m3 ) (Kg/m3 ) (Kg/m3 ) (Kg/m3 ) (Kg/m3 ) (L/m3 ) USD
M0 358 1405 41 61 51 - - - 10 106.831
M1 358 1405 41 61 51 7 - - 10 107.881
M2 358 1405 41 61 51 10.5 - - 10 108.406
M3 358 1405 41 61 51 14 - - 10 108.931
M4 358 1405 41 61 51 - 2 - 10 107.031
M5 358 1405 41 61 51 - 3 - 10 107.131
M6 358 1405 41 61 51 - 4 - 10 107.231
M7 358 1405 41 61 51 - - 66.8 10 160.271
M8 358 1405 41 61 51 - - 100 10 186.831
M9 358 1405 41 61 51 - - 134.6 10 214.511
M10 358 1405 41 61 51 7 2 100 10 188.081
M11 358 1405 41 61 51 10.5 2 66.8 10 162.04680 | E. Thanon Dawood and M. Hani Abdullah
Table 14: Matrix X calculated and weights of criteria of reinforced green mortars (AHP method).
Compressive strength Flexural strength UPV Cost in USD
Compressive strength 0.181818 0.181818 0.25 0.166667
Flexural strength 0.181818 0.181818 0.25 0.166667
UPV 0.090909 0.090909 0.195076 0.118371
Cost in USD 0.545455 0.545455 0.375 0.5
Weight 0.195076 0.195076 0.118371 0.491478
Table 15: Matrix Y for checking the pair-wise comparison matrix evaluated in AHP method.
Compressive Flexural UPV Cost in USD Si Si/wi
strength strength
Compressive strength 0.195076 0.195076 0.236742 0.163826 0.79072 4.053395
Flexural strength 0.195076 0.195076 0.236742 0.163826 0.79072 4.053395
UPV 0.097538 0.097538 0.118371 0.163826 0.477273 4.03201
Cost in USD 0.585228 0.585228 0.355113 0.491478 2.017047 4.104043
Table 16: The alternatives and criteria used in TOPSIS method for ranking of reinforced green mortars.
Index Compressive Strength (MPa) Flexural Strength (MPa) UPV (Km/sec) Cost in USD
28 days 28 days 28 days
A1 28.206 5.166 3.667 107.881
A2 30.170 5.562 3.919 108.406
A3 28.265 5.202 3.668 108.931
A4 29.021 5.021 3.887 107.031
A5 30.733 5.342 3.989 107.131
A6 28.675 5.088 3.701 107.231
A7 29.012 6.285 3.901 160.271
A8 29.597 6.767 3.951 186.831
A9 32.408 8.177 3.991 214.511
A10 28.578 5.787 3.698 188.081
A11 28.098 5.638 3.655 162.046
Table 17: Normalized decision matrix (V) obtained from TOPSIS method for reinforced green mortars.
Compressive strength Flexural strength UPV Cost in USD
A1 0.289572 0.264401 0.289208 0.221168
A2 0.309736 0.284669 0.309083 0.222244
A3 0.290178 0.266244 0.289287 0.22332
A4 0.29794 0.25698 0.306559 0.219425
A5 0.315515 0.273409 0.314604 0.21963
A6 0.294387 0.260409 0.29189 0.219835
A7 0.297847 0.321673 0.307663 0.328573
A8 0.303853 0.346342 0.311607 0.383024
A9 0.332712 0.418507 0.314761 0.439771
A10 0.293392 0.296185 0.291653 0.385587
A11 0.288464 0.288559 0.288262 0.332212Behavior of non-reinforced and reinforced green mortar with fibers | 81
Table 18: The weight normalized decision matrix (B) and the positive and negative ideal reference point obtained from TOPSIS method.
Compressive strength Flexural strength UPV Cost in USD
A1 0.056489 0.051578 0.034234 0.108699
A2 0.060422 0.055532 0.036586 0.109228
A3 0.056607 0.051938 0.034243 0.109757
A4 0.058121 0.050131 0.036288 0.107842
A5 0.061549 0.053336 0.03724 0.107943
A6 0.057428 0.0508 0.034551 0.108044
A7 0.058103 0.062751 0.036418 0.161486
A8 0.059274 0.067563 0.036885 0.188247
A9 0.064904 0.081641 0.037259 0.216137
A10 0.057234 0.057779 0.034523 0.189507
A11 0.056272 0.056291 0.034122 0.163275
a+i 0.064904 0.081641 0.037259 0.107842
a−i 0.056272 0.050131 0.034122 0.216137
Table 19: The distance to the positive and negative ideal reference point (Di+ and Di− ), Relative closeness coeflcient (R i ) to the ideal
reference point and the ranking for each alternative.
Number of mix Alternative Di+ Di− Ri Ranking of the alternative
1 A1 0.031376 0.107448 0.773987 4
2 A2 0.026535 0.107155 0.801518 1
3 A3 0.031046 0.106396 0.774116 3
4 A4 0.032247 0.108332 0.770613 6
5 A5 0.028503 0.108415 0.791824 2
6 A6 0.03185 0.108102 0.772422 5
7 A7 0.057284 0.056166 0.495073 7
8 A8 0.081823 0.033142 0.288279 9
9 A9 0.108295 0.032821 0.232582 11
10 A10 0.085468 0.027726 0.244942 10
11 A11 0.061642 0.05322 0.463339 8
method was applied to rank the reinforced green mortars. placement ratio of 15% from WGP shows the best
The raw data used in the TOPSIS technique, were listed in performance of mortar compared with another re-
Table 16. The matrices and the results obtained from this placement ratio. Thus, the percentage of compres-
technique were show in Table 17-18. Table 19 showed that sive strength decrease is 0.778% compared with con-
the second mix of the reinforced green mortar is the best trol mortar mix.
as it got the rank 1 and the ninth mix is the worst mix as it 2. Incorporation of 10% SF as replacement of OPC with
got the rank 11. or without utilizing superplasticizer, gives the high-
est increase in the compressive strength strength by
about 21% compared to control mix. Also the UPV
and density for such mortar mix shows increases
5 Conclusions from 4.512 to 4.713 Km/sec and 2226 to 2369 Kg/m3
compared to control mortar mix.
Some conclusions are revealed for this study which deals
3. Inclusion of mono fibers into the green mortar
with the production of green mortar as follows:
shows significant increases in flexural strength com-
1. Replacement of OPC by 10, 15 and 20% of WGP or pared with control mortar. Using mono sisal fiber,
SG with or without using superplasticizer leads to human hair fiber and stainless nails fiber by 0.75,
decrease the compressive strength of mortar.The re- 0.75 and 2% of volume fraction, respectively, gives82 | E. Thanon Dawood and M. Hani Abdullah
the highest increases compared with control mortar [8] Andrew, Robbie M. Global CO2 Emissions from Cement Produc-
in compressive strength, by about 7.4, 9.4 and 15.4%, tion. Earth System Science Data. 2018;10, 195–217. Availabe
from: https://doi.org/10.5194/essd-10-195-2018
respectively. And in flexural strengths are increased
[9] DAN BABOR DP and LJ, Abstract. Environmental Impact of Con-
by about 15.1, 10.6 and 69.3%, respectively. UPV val-
crete. Bull Polytech Inst Jassy, Constr Archit Sect. 2009;4(59):27–
ues are increased by 3.47, 4.33 and 10.6%, respec- 35.
tively. [10] Ali N, Jaffar A, Anwer M, Alwi SKK, Anjum MN, Ali N, Raja MR,
4. The hybridization of sisal fibers, human hair fibers Hussain A, Meng X. The Greenhouse Gas Emissions Produced by
and stainless steel fibers gives remarkable increases Cement Production and ItsImpact on Environment: A Review of
Global Cement Processing. Int J Res (IJR). 2015;2(2):489–500.
in the compressive strength, flexural strength and
[11] RoskillInformation Services. Outlook for silicon metal diverges
UPV compared with control mortar. The highest in- sharply from that for ferrosilicon. Roskill, united kingdom.2017.
creases of compressive strength, flexural strength Available from: https://roskill.com/news/outlook-silicon-metal-
and UPV are 1.7, 19.7 and 1.45, respectively, for the diverges-sharply-ferrosilicon
mortar mix with 0.5% SIF + 0.5% HHF + 1.5% SNF [12] Malhotra K. Iron and Steel Slag Utilization: A Comprehensive
Analysis. Int J Eng Sci Invent. 2019;8(08):69–75.
compared with control mortar mix.
[13] Dave N, Kumar A, Srivastava A, Kumar S. Experimental anal-
5. The use of integrated AHP and TOPSIS method
ysis of strength and durability properties of quaternary
shows good strategy for the selection of best mortar cement binder and mortar. Constr Build Mater [Internet].
mixes weather they are reinforced or non-reinforced 2016;107:117–24. Available from: http://dx.doi.org/10.1016/
green mortar. Such methods help the researchers j.conbuildmat.2015.12.195
for selecting the best green mortars which are eco- [14] Alwared A, Al-Hubboubi S, Rasen RA. Effect of Waste Glass Pow-
der as a Supplementary Cementitious Material on the Concrete
nomic and ecofriendly mortars that possess positive
Mix Properties. Assoc Arab Univ J Eng Sci. 2018;25(4):43–54.
impacts on the environment. Available from: https://doi.org/10.13140/RG.2.2.21896.67845
[15] Islam MM, Islam MS, Rahman MA DA. STRENGTH BEHAVIOR
Acknowledgement: The work described in this paper has OF MORTAR USING SLAG AS PARTIAL REPLACEMENT OF CE-
been conducted in the laboratory of the technical engineer- MENT. MIST Journal: GAIAXY(DHAKA). 2011; 1–10. Available from:
https://doi.org/10.3329/mist.v3i0.8053
ing college of Mosul-Northern Technical University.
[16] Khazaleh, Mahmoud. Eco-Friendly Green Concrete: A Review.
IAPE ’19, Oxford, United Kingdom: 19–21.2019.
[17] Muthupriya, P, B G Vishnuram, and K Subramanian. PREVENTION
OF AIR POLLUTION BY USING SILICA FUME AS CEMENTITIOUS
References MATERIAL. Nature Environment and Pollution Technology.2008;
7 (2): 267–70.
[1] IEA. Cement-Tracking Industry. IEA, Paris. 2019. Available from: [18] Abbas S, Soliman AM, Nehdi ML. Exploring mechanical and
https://www.iea.org/reports/tracking-industry-2019. durability properties of ultra-high performance concrete in-
[2] Valderrama C, Granados R, Luis J, Gasol CM, Guillem M, Josa corporating various steel fiber lengths and dosages. Con-
A. Implementation of best available techniques in cement str Build Mater [Internet]. 2015;75:429–41. Available from:
manufacturing: a life-cycle assessment study. J Clean Prod http://dx.doi.org/10.1016/j.conbuildmat.2014.11.017
[Internet]. 2012;25:60–7. Available from: http://dx.doi.org/ [19] Mehta A, Ashish DK. Silica fume and waste glass in cement con-
10.1016/j.jclepro.2011.11.055 crete production: A review. J Build Eng [Internet]. 2019;100888.
[3] Jose-Luis Galvez-Martosa HS. Resources, Conservation and Re- Available from: https://doi.org/10.1016/j.jobe.2019.100888
cycling An analysis of the use of life cycle assessment for [20] Ramli CCB and M. Mechanical Strength and Durability Prop-
waste co-incineration in cement kilns. Resources, Conserv Re- erties of High Performance Mortar Containing Densified Silica
cycl [Internet]. 2014;86(x):118–31. Available from: http://dx. Fume. Am J Appl Sci. 2011;8(1):82–91. Available from: https://
doi.org/10.1016/j.resconrec.2014.02.009 doi.org/10.3844/ajassp.2011.82.91
[4] Simge Çankaya BP. A comparative life cycle assessment for [21] Rashad AM. Recycled waste glass as fine aggregate replace-
sustainable cement production in Turkey. J Environ Man- ment in cementitious materials based on Portland cement.
age [Internet]. 2019;249:1–11. Available from: https://doi.org/ Constr Build Mater [Internet]. 2014;72:340–57. Available from:
10.1016/j.jenvman.2019.109362 http://dx.doi.org/10.1016/j.conbuildmat.2014.08.092
[5] Ernst Worrell, Katerina Kermeli CG. Energy Eflciency Improve- [22] Afroz M, Venkatesan S, Patnaikuni I. Effects of hybrid fibers
ment and Cost Saving Opportunities for Cement Making. ENERGY on the development of high volume fly ash cement composite.
STAR® Guid Energy Plant Manag. 2013. Constr Build Mater [Internet]. 2019;215:984–97. Available from:
[6] Shraddha Mishra DNAS, Health. A Review On Environmental and https://doi.org/10.1016/j.conbuildmat.2019.04.083
Health Impacts Of Cement Manufacturing Emissions. Int J Geol [23] SHao Y, Lefort T, Moras S, Rodriguez D. Studies on concrete con-
Agric Environ Sci. 2014;2(3):26–31. taining ground waste glass. Cem Concr Res. 2000;30:91–100.
[7] K.Syamala Devi VVL and AA. Impacts of Cement Industry on Envi- [24] Caijun Shi KZ. A review on the use of waste glasses in the
ronment – An Overview. Asia Pacific J Res. 2018;1:156–61. production of cement and concrete. Resour Conserv Recycl.
2007;52:234–47. Available from: https://doi.org/10.1016/j.resYou can also read