London's Architecture Sector - Update 2018 - Mark Wingham - Greater London Authority
←
→
Page content transcription
If your browser does not render page correctly, please read the page content below

Working Paper 93

London's Architecture Sector - Update 2018
Mark Wingham
March 2018
London's Architecture Sector - Update 2018
                                                                                                    Working Paper 93

copyright
Greater London Authority
March 2018

Published by
Greater London Authority
City Hall
The Queens Walk
London SE1 2AA

www.london.gov.uk
Tel 020 7983 4922

Minicom 020 7983 4000

ISBN 978-1-84781-678-8

Cover photograph

© James Parkinson

For more information about this publication, please contact:

GLA Economics

Tel 020 7983 4922

Email glaeconomics@london.gov.uk

GLA Economics provides expert advice and analysis on London’s economy and the economic issues facing
the capital. Data and analysis from GLA Economics form a basis for the policy and investment decisions
facing the Mayor of London and the GLA group. GLA Economics uses a wide range of information and data
sourced from third party suppliers within its analysis and reports. GLA Economics cannot be held responsible
for the accuracy or timeliness of this information and data. The GLA will not be liable for any losses suffered
or liabilities incurred by a party as a result of that party relying in any way on the information contained in
this report.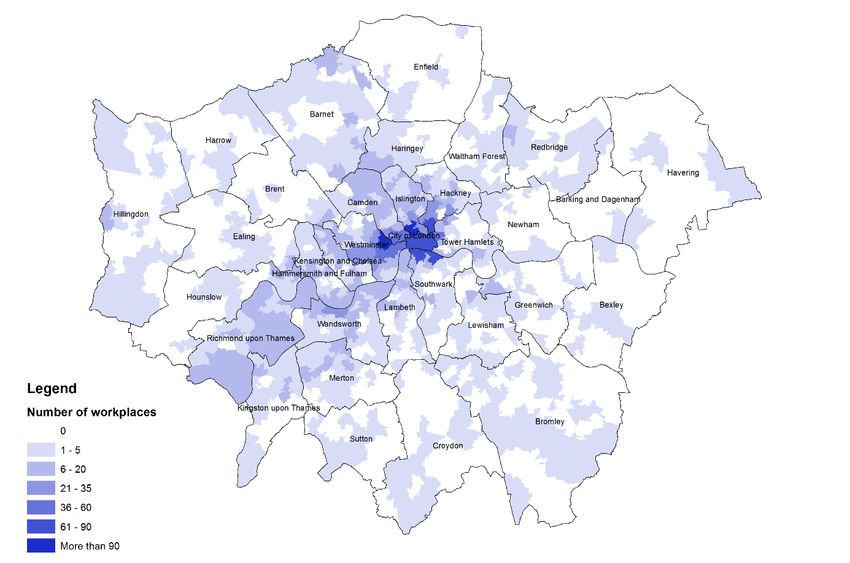
London's Architecture Sector - Update 2018
                                                                                                                   Working Paper 93

Contents
Executive summary ...................................................................................................................... 2
1     Introduction ......................................................................................................................... 4
2     Definitions ........................................................................................................................... 5
3     Businesses ............................................................................................................................ 8
4     Labour market .................................................................................................................... 24
5     Education ........................................................................................................................... 46
6     Tourism .............................................................................................................................. 54
7     International trade ............................................................................................................. 57
8     Conclusions ........................................................................................................................ 59
Appendix 1: DCMS creative industries definition ....................................................................... 60

GLA Economics                                                                                                                                1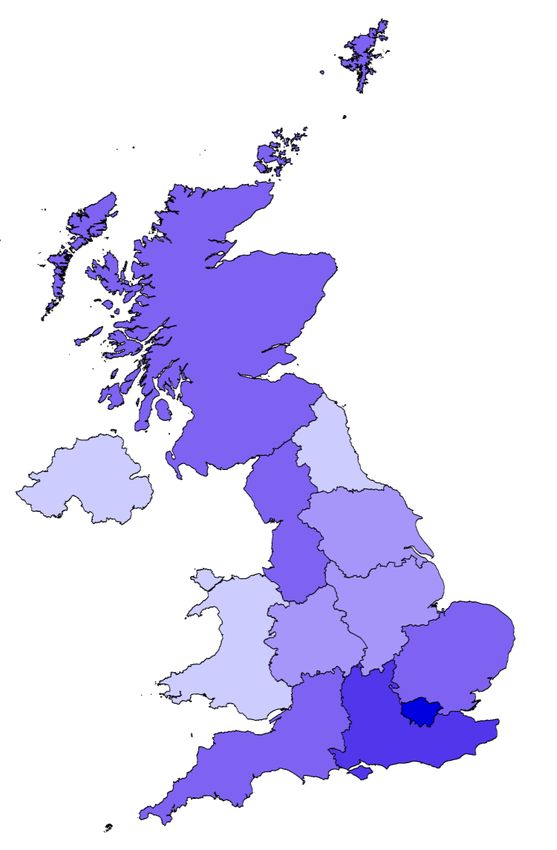
London's Architecture Sector - Update 2018
                                                                                         Working Paper 93

Executive summary
This publication updates previous analysis looking at the economic contribution of London’s
Architecture sector. In addition to updating Working Paper 86, it adds to the wider evidence
base looking at the creative industries such as London’s Creative Industries – 2017 Update. This
update also looks at the socio-economic characteristics of jobholders in London’s Architecture
sector. That is in addition to economic output, the labour market, education and international
competitiveness.

Overall, some of the key points from this analysis include:

Businesses
• The number of workplaces (i.e. the place of work like an individual office) in London’s
   Architecture sector has been growing. There were 4,515 workplaces in 2017 of which nine in
   every ten had parent enterprises (i.e. the business in its entirety which may include one or
   more workplaces not necessarily in London) that were micro businesses employing less than
   ten employees.

• Across the UK, the annual turnover of the Architecture sector was approximately £6.7 billion
  in 2016.

• London’s Architecture sector produced £1.9 billion (constant 2015 prices) in gross value
  added (GVA) – a measure of the value of goods and services produced – in 2016. That was
  the equivalent of 0.5 per cent of the London economy and broadly in line with the size of
  London’s Postal and courier activities (£1.8 billion) and Motor trades (£2 billion) sectors.

• London’s Architecture sector has grown 7.7 per cent per annum in real terms on average
  between 2009 and 2016. That was faster than the rate of real growth for the creative
  industries and the London economy.

• Overall, more than two-fifths of the Architecture sector’s GVA for Great Britain was from
  London in 2016.

Employment
• There were 26,200 jobs in London’s Architecture sector (including HR and finance jobs) in
  2016. If only looking at architect occupations regardless of sector, there were 27,600 jobs.
  Combining the two definitions, there were 15,000 architects in London’s Architecture sector
  in 2016.

• The gross median hourly wage excluding overtime in London’s Architecture sector was
  £18.33 in 2017. That was higher than the all-sector average of £16.72.

• Just under half (46.7 per cent) of jobs in London’s Architecture sector were taken by women
  in 2016. This proportion (37 per cent) was lower when looking at architect jobs (regardless
  of sector), however.

• There has been a lot of progress in recent years in closing the gender pay gap in London’s
  Architecture sector. In 2017, the median hourly wage excluding overtime for men was
  £18.47 (± £2.51) compared with £17.84 (± £3.18) for women.

GLA Economics                                                                                          2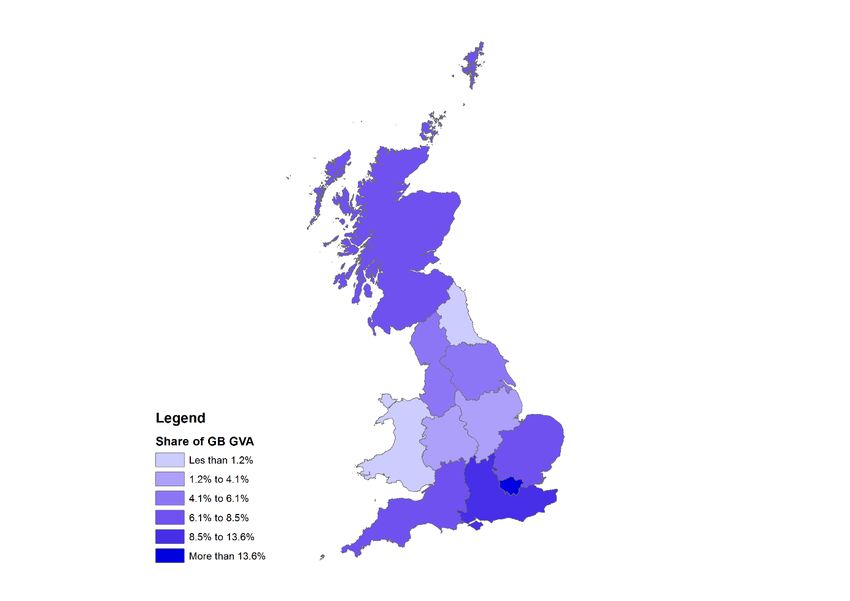
London's Architecture Sector - Update 2018
                                                                                        Working Paper 93

• Around two-fifths (42.4 per cent) of jobholders in London’s Architecture sector were aged
  16-34.

• One-third (33.3 per cent) of all jobs in London’s Architecture sector were taken by people
  with a non-UK nationality in 2016.

• London’s Architecture and engineering sector (the lowest sector disaggregation possible)
  was less ethnically diverse than the all-sector average during the 2014 to 2016 period.

• Similarly, there was a lower proportion of jobholders with a non-Christian religion in
  London’s Architecture and engineering sector compared with the all other industries average
  in the 2014 to 2016 period.

• There was no statistical difference in the proportion of jobholders who were disabled in
  London’s Architecture and engineering sector and the all other industries average between
  2014 and 2016.

• It is not possible to look at other socio-economic characteristics like sexuality and socio-
  economic class due to data limitations.

Education
• One-in-six (16.5 per cent) undergraduates and one-in-three (34.7 per cent) postgraduates
   studying Architecture, building and planning in the UK did so in London during the 2015-16
   academic year.

• Across the UK, 20.4 per cent of undergraduates and 37.6 per cent of postgraduates
  studying Architecture, building and planning degrees were international students.

Tourism
• Estimates suggest that 2.8 per cent of domestic overnight and 4.2 per cent of domestic day
   visitors to London undertook activities related to architecture. However, there are potential
   issues with these estimates particularly around attribution and double counting with other
   tourism activities.

• Overall, based on several simplifying assumptions, between £427.7 million and £497.8
  million of London’s GVA could be attributed to architecture-related tourism.

International trade

• The UK is a net exporter of Architectural services. In 2016, the UK exported £439 million of
  Architectural services and only imported £41 million.

• The value of the Architectural services exports across the UK has grown at a nominal annual
  rate of 4.3 per cent on average between 2013 and 2016.

• Architecture sits within the wider Technical, trade related, operating leasing and other
  business services product group. Given this, approximately one-third of the UK’s exports for
  this product group went to the EU in 2016. However, the destination of Architecture exports
  specifically may be different.

GLA Economics                                                                                         3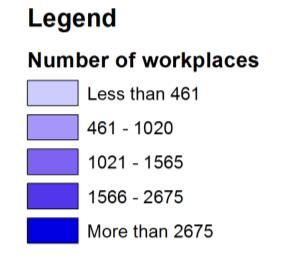
London's Architecture Sector - Update 2018
                                                                                                         Working Paper 93

1            Introduction
GLA Economics published for the first time estimates of the economic contribution of London’s
Architecture sector in 2017. Working Paper 86 looked at indicators such as the number of
architectural businesses, the number of job in the Architecture sector and how architecture
supports London’s international competitiveness1. This paper provides an update to these
metrics as well as new socio-economic information about the jobholders working in London’s
Architecture sector.

This publication also sits alongside other GLA Economics work looking at the creative
industries2.

To remain consistent with earlier work, the definition of the Architecture sector used in this
paper is unchanged. The main definition is the same as that used by the Department for
Culture, Media & Sport (DCMS) which can be used with various official statistics datasets. Other
definitions come from the Higher Education Statistics Agency (HESA) subject categories and the
Office for National Statistics (ONS) trade classifications. These definitions and data sources are
outlined in the next chapter.

After this, Chapters 3 to 7 look at London’s Architecture sector in terms of its businesses,
employment, the number of people studying architecture and how the sector helps supports the
capital’s international competitiveness. The final chapter summarises the main findings in this
paper.

1
    Wingham, M (2017). London’s architectural sector, GLA Economics Working Paper 86.
2
    Rocks, C (2017). London’s creative industries – 2017 update, GLA Economics Working Paper 89.

GLA Economics                                                                                                          4
London's Architecture Sector - Update 2018
Working Paper 93
2 Definitions
The definitions used in this paper are consistent with those in the previous update. These are
set out in this chapter.
DCMS definition
The main definition used in this paper was developed by DCMS for the creative industries. This
enables comparison with other pieces of work including previous GLA Economics analysis. At its
core, the DCMS definition of creative industries is based on the definition set out in the
Government’s 2001 Creative Industries Mapping document3. This stated that creative industries
are those…
“…which have their origin in individual creativity, skill and talent and which have a
potential for wealth and job creation through the generation and exploitation of
intellectual property.”
From this, DCMS developed a statistical definition of creative industries which reflects the above
statement4. Their methodology can be thought of in two steps. The first was to identify the
occupations typically associated with being creative using Standard Occupation Classifications
(SOC). Then the ‘creative intensity’ – that is, the number of creative jobs (using the creative
occupation definition) divided by the total number of jobs – is calculated for every industry
using Standard Industry Classifications (SIC). If industries have more than 6,000 jobs and have a
creative intensity of more than 30 per cent (with a small number of exceptions), then they are
considered to be creative industries.
The full creative industries definition is shown in Appendix 1, though the relevant definitions
relating to architecture are shown below.
Table 1: Architecture industry definition
Creative industries group SIC 07 Description
Architecture 71.11 Architectural activities
which consists of:
71.11/1 Architectural activities
71.11/2 Urban planning and landscape architectural activities
Source: DCMS Sectors
Table 2: Architectural occupations definition
Creative occupations group SOC 10 Description
Architecture 2431 Architects
2432 Town planning officers
2435 Chartered architectural technologists
3121 Architectural and town planning technicians
Source: DCMS Sectors
Ultimately, by using these definitions together or separately, the Architecture sector can be
characterised in several ways. For example, and as shown in Figure 1:
3
DCMS (2001). Creative industries mapping documents 2001, 9 April 2001, pg.5.
4
DCMS (2016). Creative industries economic estimates methodology, 10 February 2016.
GLA Economics 5London's Architecture Sector - Update 2018
Working Paper 93
• Architectural occupations: architectural jobs in London regardless of whether they are in the
architecture industry or not (i.e. they could be in other industries like construction and
public administration).
• Architectural industries: all jobs within the architecture industries, so this can include
architects, HR and finance occupations.
• Architectural occupations in the architectural industries.
Figure 1: The Architecture sector
Includes other occupations like HR and Architectural occupations in
finance other industries like
construction
Architectural Architectural
industries occupations
Architectural occupations in architectural sectors
Note: not drawn to scale
HESA definition
Another definition of architecture comes from the Higher Education Statistics Agency (HESA).
They collect information about the higher education sector and, as such, the definition is based
on the subject area of the courses undertaken by undergraduates and postgraduates5.
Specifically, it uses the Joint Academic Coding System (JACS) which categorises subjects in a
hierarchy up to four digits. Higher Education Institutions (HEIs) self-report the subject areas,
but there is no requirement for further education providers to provide this information.
The relevant definitions for architecture courses are shown below6. In this paper, the subject
area – Architecture, building and planning – has been used as this is the most commonly
available breakdown within the various HESA datasets. That said, where possible, this is
disaggregated into the principle subjects (i.e. Architecture). It is not possible to go further down
to the specific subjects.
5
HESA (2017). Students 2016/17.
6
While ‘K200 Building’ may not initially look like it would be classified as architecture, it refers to the study of building materials
and techniques. This is similarly the case using the industry definition.
GLA Economics 6London's Architecture Sector - Update 2018
Working Paper 93
Table 3: Architecture-related higher education courses definition
JACS 3 JACS 3 principle subject JACS 3 subject
subject area
K100 K100 Architecture K110 Architecture design theory
Architecture, K120 Interior architecture
building and K130 Architectural technology
planning K190 Architecture not elsewhere classified
K200 Building K210 Building technology
K220 Construction management
K230 Building surveying
K240 Quantity surveying
K250 Conservation of buildings
K290 Building not elsewhere classified
K300 Landscape and garden K310 Landscape architecture
design K320 Landscape studies
K330 Landscape design
K340 Garden design
K390 Landscape and garden design not elsewhere classified
K400 Planning K410 Regional planning
K420 Urban and rural planning
K430 Planning studies
K440 Urban studies
K450 Housing
K460 Transport planning
K490 Planning not elsewhere classified
K900 Others in architecture, K990 Architecture, building and planning not elsewhere
building and planning classified
Source: HESA
This paper also uses information from the Research Excellence Framework (REF) to show the
quality of and funding amounts for research. This information is broken down by 36 subject
areas7 with the one relating to architecture the most (and therefore used in this paper) being
Architecture, built environment and planning. No further breakdowns are available.
ONS international trade definition
While the majority of ONS datasets use the SIC and SOC classifications meaning the DCMS
definition of architecture can be used, a different product classification is used for the
international trade in services statistics. The ONS produces the International Trade in Services
(ITIS) data in accordance with the International Monetary Fund’s Balance of Payments manual8
which sets out the classification of 52 service products that are traded9. One of these service
products is Architectural activities which will be used as the principle definition in this paper.
While surveying could also be counted in this definition, following a reclassification of products
in 2012, it is now included in the Scientific and Other Technical Services (including Surveying)
which is too broad for inclusion.
7
http://www.ref.ac.uk/panels/unitsofassessment/
8
ONS (2015). International trade in services: quality and methodology information, 30 January 2015.
9
See Table 5 of the ONS International trade in services release for a list of all 52 service product areas
(https://www.ons.gov.uk/businessindustryandtrade/internationaltrade/bulletins/internationaltradeinservices/2014).
GLA Economics 7London's Architecture Sector - Update 2018
Working Paper 93
3 Businesses
Key points
• There were 4,515 workplaces (i.e. the place of work like an individual office) in London’s
Architecture sector in 2017.
• More than a quarter of the UK’s architectural workplaces were in London and this share
has been growing over time.
• Almost nine in every ten workplaces had parent enterprises (i.e. the business in its entirety
which may include one or more workplaces not necessarily in London) that were micro
businesses employing less than ten employees in 2017. Consequently, a similar proportion
had annual turnover of £1 million or less.
• Across the UK, the annual turnover of the Architecture sector was approximately £6.7
billion in 2016.
• London’s Architecture sector produced £1.9 billion (constant 2015 prices) in gross value
added (GVA) – a measure of the value of goods and services produced – in 2016. That
was in line with the size of London’s Postal and courier activities (£1.8 billion) and Motor
trades (£2 billion) sectors.
• London’s Architecture sector has grown 7.7 per cent per annum in real terms on average
between 2009 and 2016. That was faster than the rate of real growth for the creative
industries and the London economy.
• More than two-fifths of the Architecture sector’s GVA for Great Britain was from London
in 2016.
This chapter looks at the number and location of architectural practices in London. These
businesses contribute to London’s economy in terms of their fee incomes or revenues which is a
proxy for the value of the output that they produce. Consequently, the economic contribution
of architecture is also discussed in this chapter.
Number of businesses
There were 4,515 workplaces in London’s Architecture sector in 2017. This was more than a
quarter (26.7 per cent) of the UK total. That is by far the highest share for any UK region, with
the next largest being the South East with 15.8 per cent (2,675 workplaces).
GLA Economics 8London's Architecture Sector - Update 2018
Working Paper 93
Map 1: Workplaces in the Architecture sector by UK region in 2017
Source: ONS Inter-Departmental Business Register
The number of workplaces in London has been increasing over time. It has increased from 3,905
workplaces in 2015 to 4,515 in 2017. That was an average rate of growth of 7.5 per cent, which
was faster than the UK average of 5.3 per cent. Data is available back to 2001, but comparisons
with years prior to 2015 are not on a like-for-like basis due to methodological changes.
GLA Economics 9London's Architecture Sector - Update 2018
Working Paper 93
Table 4: Number of workplaces in the Architecture sector by UK region between 2001
and 2017
Region 2001 2005 2010 2015 2016 2017CAGR
(15-17)
North East 145 165 260 380 395 390 1.3%
North West 470 615 935 1,240 1,255 1,295 2.2%
Yorkshire and The Humber 325 500 645 930 975 1,020 4.7%
East Midlands 275 400 600 800 835 890 5.5%
West Midlands 405 550 745 920 975 1,015 5.0%
East 530 705 1,020 1,345 1,455 1,565 7.9%
London 1,295 1,865 2,635 3,905 4,240 4,515 7.5%
South East 915 1,235 1,755 2,410 2,565 2,675 5.4%
South West 515 725 985 1,300 1,385 1,465 6.2%
Wales 185 275 365 425 440 460 4.0%
Scotland 540 690 1,055 1,205 1,220 1,230 1.0%
Northern Ireland 295 375 425 380 380 385 0.7%
UK Total 5,895 8,100 11,425 15,240 16,120 16,905 5.3%
London’s share of UK 22.0% 23.0% 23.1% 25.6% 26.3% 26.7% n/a
Note: Improvements to the data collection process means that the historic data is not directly comparable. This is
particularly the case when major changes were implemented in 2011 and 2015. Source: ONS Inter-Departmental
Business Register
Despite this, architecture only accounted for 0.8 per cent of all workplaces in London during
2017 (up from 0.35 per cent in 2001).
While architectural workplaces can be found across London, a larger proportion of them can be
found in inner London (Map 2)10. Particularly the City of London, Westminster, Islington and
Hackney. This is consistent with the spatial distribution of the creative industries which is
presented in GLA Economics Working Paper 70.
10
The information shown in Maps 1-3 are based on middle layer super output areas (MSOAs). This is a standard definition of
geographical areas and allows for the reporting of small area statistics.
GLA Economics 10London's Architecture Sector - Update 2018
Working Paper 93
Map 2: Number of workplaces in the Architecture sector by London MSOA in 2017
Note: figures have been rounded to the nearest five. That means that some MSOAs that reportedly have no
workplaces in the architecture sector may be untrue. Source: ONS Inter-Departmental Business Register
Perhaps that is not surprising as there tends to be a larger number of businesses in inner rather
than outer London. Subsequently, looking at the percentage of workplaces in the Architecture
sector may give a better representation of the spatial distribution. Map 3 shows that there is a
much wider distribution of architectural workplaces across London on this basis.
GLA Economics 11London's Architecture Sector - Update 2018
Working Paper 93
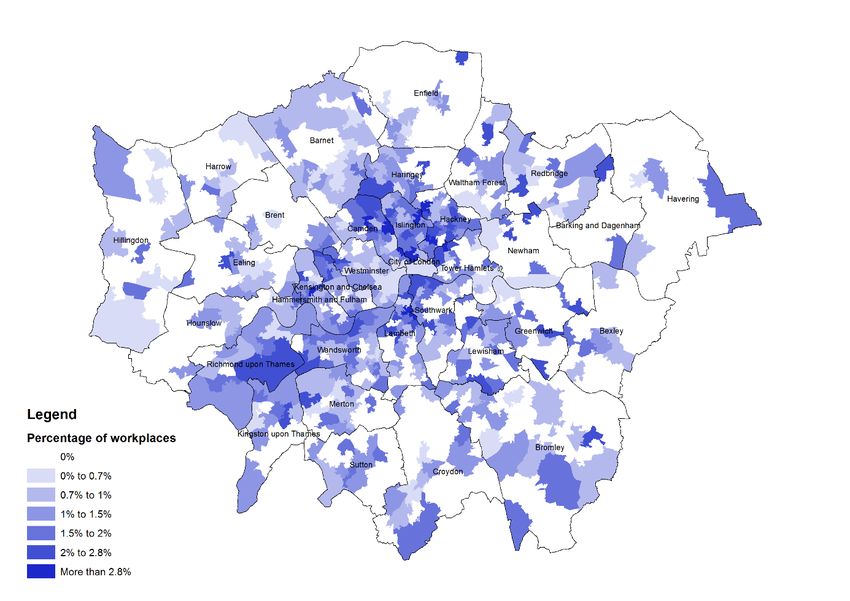
Map 3: Percentage of workplaces by London MSOA that are in the Architecture sector
in 2017
Note: figures have been rounded to the nearest five. That means that some MSOAs that reportedly have no
workplaces in the architecture sector may be untrue. Source: ONS Inter-Departmental Business Register
Map 4 takes a closer look at some of these locations. Areas with more than 2 per cent of
workplaces in the Architecture sector are highlighted in red. This includes the South Bank,
Shoreditch, Camden and Stoke Newington among others.
GLA Economics 12London's Architecture Sector - Update 2018
Working Paper 93
Map 4: London MSOAs where the percentage of workplaces in the Architecture sector
is greater than 2 per cent in 2017, central London and some surrounding areas
Note: figures have been rounded to the nearest five. Source: ONS Inter-Departmental Business Register
In comparison to 2016 and after accounting for any differences that could be a result of
rounding11, there has been an increase in the number of architectural workplaces near
Spitalfields, Old Street, St Giles and the City (green hashed areas). There was only one MSOA
area which saw a decline in the number of architecture workplaces between 2016 and 2017
(blue hashed areas). This was in Redbridge near the area between Redbridge and Gants Hill
stations.
Whereas the above analysis referred to workplaces, further characteristics of architectural firms
in London are on an enterprise basis. A workplace (or local unit) is an individual place of work
like an office or a shop. These are counted as being in London if the individual premise is within
the London boundary. In contrast, an enterprise can instead be thought of as the overall
business which can be made up of one or more workplaces that are not necessarily all in
London.
Acknowledging this, the majority (86.9 per cent) of workplaces in London’s Architecture sector
had parent enterprises that were micro enterprises with less than ten employees12. In fact, only
11
Estimates of the number of businesses have been rounded to the nearest five. Consequently, to be sure that the actual
difference between 2016 and 2017 is not overstated due to rounding, only differences of ten or more businesses have been
included.
12
This includes enterprises with zero employees which can happen if an enterprise is operated by a single individual or by
partners who did not employ anyone else in the business for example.
GLA Economics 13London's Architecture Sector - Update 2018
Working Paper 93
3.8 per cent of workplaces had parent enterprises that employed more than 50 people. As can
be seen in Figure 2, workplaces with micro parent enterprises have been dominant over time
and this share has been increasing13.
Figure 2: Number of workplaces in London's Architecture sector by size of parent
enterprise between 2001 and 2017
Note: Methodological changes in 2011 and 2015 means that more businesses were added to the IDBR and could
explain some of the increase. Source: ONS Inter-Departmental Business Register
Reflective of most architectural workplaces in London having micro parent enterprises, 45.2 per
cent had parent enterprises with annual turnover less than £100,000. A further 43.5 per cent
had parent enterprises with annual revenues between £100,000 and £1 million, up from 39.8
per cent in 2015.
13
Comparisons made over time are complicated due to methodological changes. For example, data prior to 2009 have been
converted from SIC 1992 and SIC 2003 to SIC 2007 to provide a consistent time series, but industry breakdowns should
nonetheless be used with caution. Also, between 2011 and 2012, more businesses were added to the ONS Inter-Departmental
Business Register due to improvements to HMRC’s computer systems. Similarly, the IDBR coverage was extended to include
solely PAYE-based businesses in 2015 which also increased the number of businesses on the Register.
GLA Economics 14London's Architecture Sector - Update 2018
Working Paper 93
Figure 3: Number of workplaces in London's Architecture sector by turnover of parent
enterprise between 2001 and 2016
Note: Methodological changes in 2011 and 2015 means that more businesses were added to the IDBR and could
explain some of the increase. Source: ONS Inter-Departmental Business Register
Value of work
This section looks at the fees that architectural firms charge for their services.
The ONS estimated that turnover in the UK’s architectural sector was £6.7 billion in 2016. That
was slightly down from £7.2 billion in 2015 without taking account for inflation (i.e. in nominal
terms)14. An increase in the sample size to include pay as you earn (PAYE) businesses in 2015
also means that these estimates cannot be directly compared with the historic series.
Acknowledging that, turnover in the Architecture sector has generally been rising over time as
shown in Figure 4.
14
ONS Annual Business Survey
GLA Economics 15London's Architecture Sector - Update 2018
Working Paper 93
Figure 4: Turnover of the UK's Architecture sector between 2008 and 2016, current
prices, £ millions
Note: A methodology change to include PAYE businesses in 2015 means that the historic data is not directly
comparable. Source: ONS Annual Business Survey
Regional data is available, but not to the same disaggregation. Instead of referring specifically
to the Architecture sector, it refers to the ‘Architectural and engineering activities; technical
testing and analysis’ industry. The latest data point is also for 2015 and does not yet currently
include the impact of including PAYE businesses15. Given this, the turnover of this broad
industry was £12.2 billion in London during 2015. That was up from £8.8 billion in 2008 in
nominal terms, representing an average rate of nominal growth of 4.7 per cent per annum.
London had approximately one-fifth (19.4 per cent) of the turnover for the UK in 2015.
Alternatively, a different approach to estimating the value of work undertaken by architectural
firms is to use the RIBA Business Benchmarking and The Architects’ Journal 100 (AJ100)
surveys. Both separately ask architectural businesses in the UK about their revenue and salaries,
though the former also includes questions about profit, marketing spend and clients. While both
are survey based, they target different companies with some overlap. The RIBA survey targets
RIBA affiliated companies only and responding is a condition for membership. In contrast, the
AJ100 is voluntary and open to all architectural firms, though the results are only published for
the 100 largest businesses responding. This means that both sets of survey data are not
necessarily representative of the entire Architecture sector. In addition, some caution should be
given to the accuracy of the information provided by these surveys; the information may
potentially be biased (selection, reporting, recall and positive results bias among others) and
there is no way to check the validity of the responses.
Acknowledging the above, the RIBA Business Benchmarking Survey suggested that £3 billion of
revenue was generated by RIBA chartered practices across the UK in 201716. That was up 7 per
15
The next update which should include PAYE businesses is due for publication in July 2018.
16
RIBA (2017). RIBA business benchmarking 2017, Report prepared for the RIBA by The Fees Bureau.
GLA Economics 16London's Architecture Sector - Update 2018
Working Paper 93
cent from 2016 (without accounting for inflation). Moreover, of the £3 billion in revenue for the
UK, around 60 per cent was generated by practices based in London.
Meanwhile, the AJ100 reported that total fee income for the UK was approximately £2.2 billion
in 2017 (based on the top 100 largest companies of which contained 106 individual businesses
with one not disclosing the information)17. Following a similar approach to last time, this
information can be allocated to a region based on the location of the businesses’ registered
head office with Companies House18. However, this simple approach does not account for firms
which may have more than one office location in the UK. This presents an issue as total fee
income will be allocated to where the business is headquartered and not necessarily where the
income was earned. Arguable, this issue could be larger for London where many large
architectural firms are registered meaning the figures for the capital could be overstated.
Acknowledging this, it is estimated that London-based architectural businesses brought in
approximately £1.7 billion of fee income in 2017, the equivalent of 78.7 per cent of the UK
total.
Table 5: Fee income by UK region of AJ100 architectural firms in 2017, £ millions
UK region UK offices - all projects Overseas offices Total fee income
North East £16.9 £1.0 £17.8
North West £79.8 £9.7 £89.5
Yorkshire & Humber £31.7 £0.6 £32.3
East Midlands £27.4 £0.2 £27.6
West Midlands £29.4 £1.6 £30.9
East £20.4 £0.0 £20.4
London £870.2 £873.4 £1,739.3
South East £92.8 £77.9 £170.7
South West £31.5 £0.0 £31.5
Scotland £17.0 £0.0 £17.0
Wales £29.1 £0.0 £29.1
Northern Ireland £4.3 £0.2 £4.5
UK total £1,250.5 £964.6 £2,210.6
Note: Some firms did not disclose their fee income and, consequently, not included in these figures. Source: AJ100
Gross value added
A different measure to illustrate the Architecture sector’s contribution to the London economy
is gross value added (GVA). This is a measure of the value of goods and services produced and
is defined as output minus the cost of inputs associated to that production (i.e. intermediate
consumption). This differs from the value of work discussed above which is essentially a
measure of revenue and, therefore, includes an element of profit.
The size of London’s economy in terms of GVA was £395.9 billion in 2016. This is measured
using the income approach which essentially involves adding up the income generated in the
production of goods and services. This is also a National Statistic. However, this information is
only available by broad industry groups. Alternatively, the ONS has published balanced GVA
estimates which take the strengths of the income approach and an alternative production
approach to measuring GVA. The balanced GVA estimates are available to a low level of
17
The Architects’ Journal (2017). AJ100, 2017.
18
Companies House (2018). Business register.
GLA Economics 17London's Architecture Sector - Update 2018
Working Paper 93
disaggregation, which means it is more applicable in estimating the GVA of the Architecture
sector19. However, it is currently considered an experimental statistic while it undergoes
evaluation meaning the figures are subject to revision. Acknowledging this, the total GVA for
London was £408.5 billion in 2016 using the balanced approach.
Still the GVA balanced estimates are only available at the division 2-digit SIC level, whereas the
Architecture sector definition is at the 4-digit SIC level (see Chapter 2). Consequently, the GVA
of the Architectural and engineering activities division (SIC 71) needs to be apportioned to the
Architecture sector (SIC 71.11). GLA Economics Current Issues Note 52 discusses a method that
can be used to apportion GVA and is predominantly based on the share of jobs20. That is, the
share of jobs in the Architecture sector to the wider Architecture and engineering activities
division can approximate the share of GVA21. Given the level of granularity required, the jobs
data only refers to employee jobs and is taken from the ONS Business Register and Employment
Survey (BRES)22.
Overall, the share of employee jobs in London’s Architecture sector in relation to the
Architectural and engineering activities division total was 31.5 per cent in 2016. Applying this to
the estimate of GVA for London’s Architectural and engineering activities division (£5.9 billion)
suggests that GVA for London’s Architecture sector was approximately £1.9 billion in constant
2015 prices during 201623. That was up from £1.1 billion in 2009 representing an average
annual rate of real growth of 7.7 per cent.
19
For more information, see:
https://www.ons.gov.uk/economy/grossvalueaddedgva/bulletins/regionalgrossvalueaddedbalanceduk/1998to2016
20
See: Smith, B & Girardi, A (2017). Productivity trends: GVA per workforce jobs for London and the UK, 1997-2015, GLA
Economics Current Issues Note 52. Additionally, a small adjustment factor is applied to the regional estimates to ensure
consistency with the UK/Great Britain totals.
21
An issue with this approach is that it assumes the same level of productivity among the individual sectors within the wider
division. For example, it assumes that the amount of output per job is the same in all constituent sectors.
22
The preferred measure of jobs uses the Workforce Jobs series and includes employee and self-employed jobs for instance.
However, the workforce jobs series is not available at a low level of disaggregation. For more information, see:
https://www.ons.gov.uk/employmentandlabourmarket/peopleinwork/employmentandemployeetypes/methodologies/aguidet
olabourmarketstatistics
23
In February 2018, DCMS published estimates of the regional GVA of the architecture sector for the first time (see:
https://www.gov.uk/government/statistics/dcms-sectors-economic-estimates-2016-regional-gva). This used a similar
methodology to GLA Economics in that regional balanced GVA data is apportioned to a specific sector. However, while GLA
Economics apportions GVA using the share of jobs, DCMS uses the share of approximate GVA (aGVA) derived from the ONS
Annual Business Survey. Currently, DCMS’s estimates are being reviewed so, at this stage, they should be used with caution (as
with the GLA Economics figures). Acknowledging this, DCMS estimated that the GVA of London’s Architecture sector was £1.98
billion in 2016 in current prices (48 per cent of the GB total), compared with the GLA Economics figure of £1.96 billion in
current prices (43.2 per cent of the GB total).
GLA Economics 18London's Architecture Sector - Update 2018
Working Paper 93
Figure 5: London's Architecture sector GVA, constant 2015 prices, £ millions
Source: ONS Regional GVA (balanced estimates), ONS Business Register and Employment Survey, GLA Economics
Approximately two-fifths (41.4 per cent) of the GVA from Great Britain’s Architecture sector
was from London in 2016. This is larger than London’s share of total GB GVA (24.1 per cent24)
suggesting that the capital is more specialised in architecture than the rest of Great Britain. The
region with the next largest share of GB’s Architecture sector GVA was the South East (13.6 per
cent).
24
This excludes GVA that cannot be assigned to a specific region (i.e. it excludes Extra-Regio GVA).
GLA Economics 19London's Architecture Sector - Update 2018
Working Paper 93
Map 3: GVA share of GB's Architecture sector by region in 2016
Source: ONS Regional GVA (balanced estimates), ONS Business Register and Employment Survey, GLA Economics
As noted above, the GVA from London’s Architecture sector has grown 7.7 per cent in real
terms on average between 2009 and 2016. That was the second fastest rate of growth among
the UK regions, with the South West seeing 8.5 per cent real growth on average during this
period. In some areas like Scotland and Wales, there has been relatively little growth in real GVA
since 2009.
GLA Economics 20London's Architecture Sector - Update 2018
Working Paper 93
Figure 6: Compound annual rate of growth in real GVA of the Architecture sector by
GB region, constant 2015 prices, 2009 to 2016
Source: ONS Regional GVA (balanced estimates), ONS Business Register and Employment Survey, GLA Economics
London’s Architecture sector represented 0.5 per cent of the London economy. (Total GVA of
the London economy was £400.5 billion in constant 2015 prices during 201625.) In terms of the
creative industries, architecture contributed around 4 per cent of its total economic output in
2016. In fact, the Architecture sector is larger in economic output terms than the Crafts, Design:
product, graphic and fashion design and Museums, galleries and libraries creative industries
(Table 6). However, it is less than a third of Advertising and marketing and less than a fifth of
Film, TV, video, radio and photography.
Table 6: GVA by creative industry group in London in 2016, constant 2015 prices, £
millions
Creative industry group GVA (£ millions) as a percentage
Advertising & Marketing £6,787.8 14.8%
Architecture £1,860.6 4.1%
Crafts £76.7 0.2%
Design: Product, Graphic & Fashion Design £1,439.2 3.1%
Film, TV, Video, Radio & Photography £12,841.2 28.0%
IT, Software & Computer Services £10,794.2 23.5%
Publishing £6,828.9 14.9%
Museums, Galleries & Libraries £383.6 0.8%
Music, Performing & Visual Arts £4,870.8 10.6%
Creative industry total £45,882.9 100.0%
Source: ONS Regional GVA (balanced estimates), ONS Business Register and Employment Survey, GLA Economics
25
This uses the ONS Regional GVA (balanced) estimates. However, this is an experimental statistic meaning that it is subject to
revision. Alternatively, the ONS Regional GVA (income approach) data are the only GVA estimates that are National Statistics
and robust. Using this income approach data suggests that total GVA for London was £395.9 billion in 2016 in nominal prices
(compared with £408.5 billion in nominal prices or £400.5 billion in constant 2015 prices when using the balanced estimates).
GLA Economics 21London's Architecture Sector - Update 2018
Working Paper 93
Figure 7 shows a wider comparison of the Architecture sector with other selected industry
divisions (2-digit SIC) in London26. Architecture’s GVA in London was broadly like Postal and
courier activities (£1.8 billion) and Motor trades (£2 billion). It was bigger than Manufacture of
food products (not including drinks, £1.6 billion), Gambling and betting activities (£1.7 billion)
and Residential care activities (£1.3 billion). It was also only slightly smaller – in relative terms –
than Accommodation (£3.4 billion) and Civil Engineering (£3.5 billion).
Figure 7: GVA by selected industry division (2 digit SIC) in London in 2016, constant
2015 prices, £ millions
Note: Architecture does not relate to a specific industry division (2 digit SIC). Instead it is based on the DCMS
Creative Industries definition which is based on sub-classes (4 digit SIC). Source: ONS Regional GVA (balanced)
Additionally, architecture has grown at a faster average rate than the creative industries more
widely and the all-sector average in London. For example, between 2009 and 2016, architecture
26
For more information about SIC codes and the type of activities that are included in these divisions, see:
http://www.neighbourhood.statistics.gov.uk/HTMLDocs/SIC/ONS_SIC_hierarchy_view.html
GLA Economics 22London's Architecture Sector - Update 2018
Working Paper 93
GVA has grown at an average annual rate of 7.7 per cent in real terms. This compared with 7.3
per cent for the creative industries and 3.2 per cent for London overall.
Figure 8: Index of GVA by industry for London between 2009 and 2016, constant 2015
prices, 100 = 2009
Source: ONS Regional GVA (balanced), ONS Business Register and Employment Survey, GLA Economics
GLA Economics 23London's Architecture Sector - Update 2018
Working Paper 93
4 Labour market
Key points
• There were approximately 26,200 jobs in London’s Architecture sector in 2016. While up
from 2015, it remains lower than the peak of 34,100 jobs in 2010. More than a quarter of
jobs in the UK’s Architecture sector were in London.
• London had 27,600 architect occupations – regardless of sector – in 2016. Similarly, more
than a quarter of architects in the UK were based in London.
• Combining the two definitions, there were approximately 15,000 architects in London’s
Architecture sector in 2016. This means that more than half of the jobs in the Architecture
sector are architect occupations.
• Almost half of all jobs in London’s Architecture sector were taken by women in 2016.
• Two-fifths of jobholders in the sector were aged 16-34.
• Looking at the wider Architecture and engineering sector, the workforce was less
ethnically diverse than the London all-sector average between 2014 and 2016.
• Similarly, a lower percentage of jobholders in London’s Architecture and engineering
sector had a non-Christian religion than the London all-sector average.
• There was no statistical difference in the percentage of jobholders with a disability
between London’s Architecture and engineering sector and the all-sector average.
• One-third of jobholders in London’s Architecture sector specifically had a non-UK
nationality in 2016. Specifically, 24.1 per cent had an EU27 nationality other than the UK.
• The gross median hourly wage excluding overtime in London’s Architecture sector was
£18.33 in 2017. That was higher than the average for all jobs in London.
This chapter provides an overview of employment and the labour market characteristics of the
workforce in London’s Architecture sector. Additional information about the socio-economic
characteristics of the workforce – such as by ethnicity, religion and disability – is also now
provided in this update.
Employment in London’s Architecture sector can be defined in one of three ways. It could refer
to the total number of jobs in the Architecture sector and include HR and finance occupations;
it could refer to architect jobs only, but in any sector; or it could refer to architect jobs within
the Architecture sector. All three definitions are used in this chapter.
It should also be noted that the jobs data used in this chapter comes from the ONS Annual
Population Survey. This is consistent with the approach taken in the GLA Economics Creative
Industries Updates, as well as the DCMS Sectors Economic Estimates releases. It allows for more
comprehensive data about the characteristics of the workforce, like their age and gender.
However, this is inconsistent – and thus not directly comparable – with other pieces of analysis
GLA Economics 24London's Architecture Sector - Update 2018
Working Paper 93
that uses different job estimates (i.e. the ONS Workforce Jobs series) such as GLA Economics
Labour Market Projections.
Number of jobs
There were approximately 26,200 jobs in London’s Architecture sector in 2016. This figure
includes HR and finance jobs. Although up from the estimate for 2015, it remains lower than
the peak of 34,100 jobs recorded in 2010. Generally, London has historically had more than a
quarter of all jobs in the UK’s Architecture sector.
Table 7: Number of jobs in the Architecture sector by UK region between 2009 and
2016
UK region 2009 2010 2011 2012 2013 2014 2015 2016
North East 2,400 2,500 2,400 2,400 2,100 3,200 1,800 1,900
North West 8,600 6,900 6,400 9,300 8,500 6,000 6,900 8,800
Yorkshire & Humber 5,700 7,400 5,500 3,600 4,600 5,100 7,200 5,600
East Midlands 6,100 6,400 6,600 4,900 3,300 2,000 3,700 6,300
West Midlands 5,800 4,200 3,700 6,200 5,000 6,100 4,900 7,200
East 10,600 7,000 9,200 7,800 11,700 10,800 7,300 6,500
London 24,300 34,100 29,500 25,900 26,700 27,100 23,500 26,200
South East 10,900 8,600 10,100 9,700 12,000 16,000 13,600 13,700
South West 8,400 8,000 7,300 6,700 7,000 9,200 6,500 7,100
Wales 2,600 2,100 3,600 3,000 3,500 3,300 3,600 2,500
Scotland 9,000 8,900 7,700 9,500 8,400 9,800 10,100 8,900
Northern Ireland 1,300 2,000 1,800 1,600 1,000 2,900 2,300 2,400
UK total 96,100 98,400 94,500 90,700 94,100 101,900 91,400 97,900
London share of UK 25.4% 34.8% 31.4% 28.6% 28.5% 26.7% 25.8% 26.9%
Source: ONS Annual Population Survey
Alternatively looking at the number of architect occupations in London, there were around
27,600 jobs in 2016. A longer time-series is available using this definition and suggests that the
number of architect jobs in London has, on the whole, been growing over time (Figure 9).
GLA Economics 25London's Architecture Sector - Update 2018
Working Paper 93
Figure 9: Number of architect jobs in London between 2004 and 2016
Source: ONS Annual Population Survey
London’s share of the UK total number of architect jobs was 27.9 per cent in 2016. Historically,
London has largely had more than a quarter of all architect jobs, which is the highest share for
any UK region (Table 8).
Table 8: Number of architect jobs by UK region between 2009 and 2016
UK region 2009 2010 2011 2012 2013 2014 2015 2016
North East 2,900 2,500 1,600 1,900 2,200 2,600 3,300 3,100
North West 8,400 6,300 7,600 8,700 8,500 6,300 5,300 9,900
Yorkshire & Humber 6,600 8,700 5,300 3,100 4,800 6,500 7,300 5,900
East Midlands 4,900 4,300 3,700 3,300 4,000 4,200 5,700 6,300
West Midlands 3,900 3,600 4,100 5,000 5,600 5,300 6,900 4,800
East 10,100 7,800 5,900 6,200 10,300 8,400 5,300 5,200
London 24,000 29,900 25,100 21,600 30,000 26,200 24,800 27,600
South East 11,800 9,800 9,400 8,000 11,500 17,400 13,200 13,700
South West 8,100 9,300 6,300 5,300 8,500 9,800 7,100 8,300
Wales 3,500 2,700 3,600 3,400 3,700 3,700 3,400 3,300
Scotland 9,500 7,800 8,000 11,000 10,200 12,800 12,400 9,100
Northern Ireland 1,200 3,300 3,500 3,100 3,700 4,000 2,400 1,900
UK total 95,400 96,400 85,200 81,400 103,400 107,400 97,400 99,700
London share of UK 25.3% 31.2% 29.9% 26.8% 29.1% 24.5% 25.6% 27.9%
Source: ONS Annual Population Survey
Meanwhile, in 2016, there were 15,000 jobs in London when using a strict definition of
architect jobs in the Architecture sector (Table 9). Due to small samples, it is not possible to
present this information for the other UK regions. That said, London typically has more than a
quarter of all architect jobs in the Architecture sector across the UK.
GLA Economics 26London's Architecture Sector - Update 2018
Working Paper 93
Table 9: Number of architect jobs in the Architecture sector in London between 2009
and 2016
UK region 2009 2010 2011 2012 2013 2014 2015 2016
London 16,800 22,500 20,900 13,300 18,700 15,900 12,600 15,000
UK total 57,800 61,200 56,100 50,000 60,400 63,700 49,700 51,600
London share of UK 29.1% 36.8% 37.3% 26.5% 31.0% 25.0% 25.4% 29.2%
Source: ONS Annual Population Survey
Altogether, Figure 10 shows the various ways that the number of jobs in London’s Architecture
sector can be categorised.
Figure 10: Number of jobs in London's Architecture sector in 2016
Includes other occupations like HR and Architectural occupations in
finance other industries like
construction
Architectural Architectural
industries occupations
26,200 jobs 27,600 jobs
Architectural occupations in architectural sectors
15,000 jobs
Note: Not drawn to scale. Source: ONS Annual Population Survey
Looking at this overlap in greater detail, more than half of all jobs in London’s Architecture
sector were architect occupations. For example, in 2016, 57.5 per cent of all jobs in London’s
Architecture sector were architect occupations implying the remaining 42.5 per cent of jobs
were non-architect occupations like HR and finance. Or, put a different way, more than half of
all architect jobs in London were in the Architecture sector. That is, 54.5 per cent of all architect
jobs in London were in the Architecture sector implying the remaining 45.5 per cent were in
other industries like construction.
Employment status
Most of the jobs in London’s Architecture sector were employees (also including Government
trainees and unpaid family workers), with 83.8 per cent of the jobs in 2016. The remaining 16.2
per cent of jobs were taken by self-employed workers. It is a similar trend for the UK, though
usually with a higher percentage of self-employed workers. On a year-on-year basis, the share
of self-employed workers in London’s Architecture sector dropped from 30.7 per cent in 2015.
GLA Economics 27London's Architecture Sector - Update 2018
Working Paper 93
However, generally since 2009 and ignoring year-on-year fluctuations, the percentage of self-
employed workers has hovered on average around 22 per cent.
Table 10: Percentage of jobs in the Architecture sector by employment status
between 2009 and 2016
Employment status 2009 2010 2011 2012 2013 2014 2015 2016
London
Employees* 80.5% 76.4% 73.1% 82.3% 77.9% 82.2% 69.3% 83.8%
Self-employed 19.5% 23.6% 26.9% 17.7% 22.1% 17.8% 30.7% 16.2%
UK
Employees* 75.1% 71.2% 73.6% 72.7% 68.9% 72.5% 70.3% 74.3%
Self-employed 24.9% 28.8% 26.4% 27.3% 31.1% 27.5% 29.7% 25.7%
Note: Employees also includes Government trainees and unpaid family workers. Source: ONS Annual Population
Survey
It is a similar picture when looking at architect jobs in any sector. Approximately 84.1 per cent
of architect jobs in London were taken by employees (including Government trainees and
unpaid family workers), with the remaining 15.9 per cent taken by self-employed workers.
Again, there is usually a higher percentage of self-employed workers at the UK-level. In
comparison to 2015, the share of self-employed architects in London has declined from 21.6
per cent and this continues the downward trend from the recent highs of 28 per cent in 2011
and 2012.
Table 11: Percentage of architect jobs in any sector by employment status between
2009 and 2016
Employment status 2009 2010 2011 2012 2013 2014 2015 2016
London
Employees* 82.1% 75.6% 71.9% 71.8% 80.8% 79.1% 78.4% 84.1%
Self-employed 17.9% 24.4% 28.1% 28.2% 19.2% 20.9% 21.6% 15.9%
UK
Employees* 76.8% 71.8% 72.4% 71.7% 72.8% 72.0% 72.5% 74.9%
Self-employed 23.2% 28.2% 27.6% 28.3% 27.2% 28.0% 27.5% 25.1%
Note: Employees also includes Government trainees and unpaid family workers. Source: ONS Annual Population
Survey
Socio-economic characteristics of jobholders
This section looks at the characteristics of the jobholders working in the Architecture sector.
Given the ambitions of the Mayor to ensure that the city works for all Londoners27, this section
looks at additional socio-economic characteristics than the previous report. Previously, only
gender and age were considered, but this update now also includes ethnicity, religion and
disability among others.
There are other socio-economic and protected characteristics that are important and of interest.
However, issues around statistical accuracy and confidentiality (see Box 1) means that these
cannot be analysed for the Architecture sector. For example:
27
For example, see: Mayor of London (2016). A city for all Londoners, October 2016.
GLA Economics 28London's Architecture Sector - Update 2018
Working Paper 93
• Socio-economic class
Ideally this would look at the socio-economic background of jobholders working in London’s
Architecture sector. That is to see whether these jobs are being accessed by people from
deprived backgrounds for example. However, official data captures socio-economic class
using the National Statistics Socio-Economic Classification (NS-SEC)28. This measures the
employment relations and conditions of occupations. Consequently, it is mostly based on
the occupation of jobholders rather than their background. Not only is this less useful in
terms of the policy context, but there is also little variation in occupations when looking at
the Architecture sector specifically. That is, most jobs would be professional or associate
professional occupations. This makes it more difficult in identifying statistically significant
differences among jobholders, as well as raising issues around confidentiality.
• Sexual orientation
Around 3.2 per cent of people in London identified as lesbian, gay, bisexual or ‘other’
(LGBTQ) in 201629. That was the highest share for any UK region and compared against a
UK average of 2.5 per cent. However, given this, it would not be feasible to look at the
number of jobholders in London’s Architecture sector as the sample size would become too
small to produce any reliable estimates.
• Other protected characteristics
The Equality Act 2010 covers other protected characteristics including being married or in a
civil partnership, trans people and being pregnant or on maternity leave. However, these are
not included in this report because of a lack of data, small sample sizes and issues around
statistical accuracy.
Box 1: A note on statistical accuracies
The employment data used in this paper comes from the ONS Annual Population Survey. This
is the largest household survey run by the ONS with a survey sample of approximately
320,000 respondents. Consequently, it is ideal for this type of analysis as it can be used to
produce granular estimates, but there are limits to the level of detail that can be provided.
The issue with granularity is that the information is based on fewer and fewer responses with
each attribute. Already, the 320,000 survey responses are broken down to only those from
London and again to look only at the Architecture sector. Therefore, breaking this down
further to look at a socio-economic characteristic may mean that the actual number of
responses is too small to be considered reliable and accurate. For example, if the sample size
was too small, then the estimate could be greatly affected by any anomalies (see Figure 11).
It could also be relatively easy to identify the person or business responding to the survey
breaking confidentiality rules among other issues.
28
For more information, see:
https://www.ons.gov.uk/methodology/classificationsandstandards/otherclassifications/thenationalstatisticssocioeconomicclass
ificationnssecrebasedonsoc2010
29
ONS Sexual identity statistical bulletin. The total includes responses of do not know and did not respond.
GLA Economics 29You can also read


