Internet Access and its Implications for Productivity, Inequality, and Resilience - WFH Research
←
→
Page content transcription
If your browser does not render page correctly, please read the page content below
Internet Access and its Implications for Productivity,
Inequality, and Resilience
JULY 10, 2021

AUTHORS
Jose Maria Barrero,* Nicholas Bloom,** and Steven J. Davis***

ABSTRACT
About one-fifth of paid workdays will be supplied from home in the post-pandemic economy, and
more than one-fourth on an earnings-weighted basis. In view of this projection, we consider some
implications of home internet access quality, exploiting data from the new Survey of Working
Arrangements and Attitudes. Moving to high-quality, fully reliable home internet service for all
Americans (“universal access”) would raise earnings-weighted labor productivity by an estimated
1.1% in the coming years. The implied output gains are $160 billion per year, or $4 trillion when
capitalized at a 4% rate. Estimated flow output payoffs to universal access are nearly three times
as large in economic disasters like the COVID-19 pandemic. Our survey data also say that
subjective well-being was higher during the pandemic for people with better home internet service
conditional on age, employment status, earnings, working arrangements, and other controls. In
short, universal access would raise productivity, and it would promote greater economic and social
resilience during future disasters that inhibit travel and in-person interactions.

*
  Instituto Tecnológico Autónomo de México. Email: jose.barrero@itam.mx.
**
   Stanford University. Email: nbloom@stanford.edu.
***
    University of Chicago Booth School of Business and the Hoover Institution. Email:
Steven.Davis@chicagobooth.edu.
JEL No. D13, D23, E24, J22, G18, M54, R3
Keywords: Internet access, productivity, COVID-19, working from home, remote work, earnings inequality,
subjective well-being, economic resilience
Acknowledgements: This paper was commissioned by the Aspen Economic Strategy Group. The views expressed
herein are those of the authors and do not necessarily reflect those of the Aspen Economic Strategy Group or its
membership. Thanks to Melissa Kearney and Amy Ganz for comments on an earlier draft. We gratefully
acknowledge financial support from Stanford University, the University of Chicago Booth School of Business,
Asociación Mexicana de Cultura A.C., the Stanford Institute for Human-Centered Artificial Intelligence, the W.E.
Upjohn Institute for Employment Research, and Toulouse Network for Information Technology.
1. Introduction
Americans supplied half or more of paid workdays from home in spring 2020, ten times the pre-
COVID share. They continued to supply more than 40% of workdays from home through spring
2021.1 We explain why the shift to working from home (WFH) will endure in Barrero, Bloom,
and Davis (2021b). Our analysis and forward-looking survey evidence suggest that WFH will
settle at about one-fifth of paid workdays in the coming years, and at higher levels for the well-
educated and highly compensated. This abrupt, enormous, persistent shift to remote work has
been greatly enabled by home internet access and a host of complementary technologies.
These remarkable developments prompt several questions that we tackle in this paper. First, if
everyone had high-quality, fully reliable home internet service in the coming years, how much
would it boost productivity? Second, how much did subpar internet service degrade productivity
during the pandemic? Third, would universal access to high-quality, reliable internet service
materially increase WFH in the coming years and, if so, by how much? Fourth, would universal
access raise or lower earnings inequality? As we explain, the implications for earnings inequality
are unclear a priori, even as to the sign of any effect. Fifth, video conversations and virtual
meetings yield some of the emotional and psychological benefits that humans normally enjoy in
person, raising another question: How do subjective and objective indicators of well-being relate
to internet access quality during the pandemic, a time of pervasive (physical) social distancing?
To address these questions, we tap multiple waves of data from the Survey of Working
Arrangements and Attitudes (SWAA), an original cross-sectional survey of our design. We have
fielded the SWAA monthly since May 2020, thus far collecting 43,000 responses from working-
age Americans who earned at least $20,000 in 2019. The survey asks about working
arrangements during the pandemic, internet access quality, productivity, subjective well-being,
employer plans about the extent of WFH after the pandemic ends, and more. The SWAA asks
explicitly about working “full days at home.” Thus, our WFH measures do not encompass
workdays split between home and office or work at satellite business facilities.
Many SWAA respondents report higher productivity when WFH during the pandemic than when
working on employer premises before the pandemic. Using SWAA data on the relative
productivity of WFH, employer plans about who will work from home in the post-pandemic
economy and commuting times, Barrero, Bloom, and Davis (2021b, hereafter “BBD”) estimate
that a re-optimization of working arrangements in the post-pandemic economy will boost
1
Barrero, Bloom, and Davis (2020), Bick et al. (2020), Brynjolfsson et al. (2020) and Ozimek (2020) provide
evidence on the extent of working from home in the spring of 2020. Barrero, Bloom, and Davis (2021b) provide
evidence on its evolution at a monthly frequency through April 2021.
1productivity by 4.6% relative to the pre-pandemic situation.2 The main source of this
productivity gain is the savings in commuting time afforded by WFH. The productivity boost
reflects a combination of higher productivity when WFH for some workers and the selected
nature of who works from home in the post-pandemic economy.
The productivity projections in our earlier work are conditioned on the prevailing level of
internet access quality, which varies considerably across households. In this paper, we instead
estimate the productivity effects of universal access to high-quality internet service. We
approach the matter in two ways: First, using responses to the SWAA question, “How much
would your efficiency working from home increase if you had perfect high-speed internet?”
Second, using regression models that relate SWAA data on the relative productivity of WFH to
internet access quality. Under both approaches, we exploit SWAA data on employer plans for
who will work from home in the post-pandemic economy, and how much.
To preview our main results, we estimate that universal access to high-quality home internet
service (hereafter, “universal access”) would raise earnings-weighted productivity in the post-
pandemic economy by 1.1%. To obtain this figure, we combine employer plans for who will
work from home, and how much, with self-assessed productivity effects of universal access. For
many workers, the implied productivity effect is zero—either because they don’t plan on WFH
in the post-pandemic economy, already have high-quality home internet service, or don’t
anticipate a productivity effect in any event. However, some workers who plan on WFH in the
post-pandemic economy also expect a productivity gain from better internet service.
Given an aggregate output elasticity with respect to labor services of two-thirds, a 1.1% boost in
labor productivity implies flow GDP gains of $160 billion per year, or a present value gain of $4
trillion at a 4% discount rate. Our data also suggest that better home internet access increases the
propensity to work from home. Universal access would, according to our estimate, raise the
extent of WFH in the post-pandemic economy by about 0.7 of a percentage point. When we
account for this effect, it slightly raises our estimate for the earnings-weighted productivity
benefits of moving to universal access.
To assess the distributional consequences of universal access, we adopt the benchmark
assumption that earnings are proportional to productivity in the cross section. Under this
assumption, the SWAA data let us estimate the impact of universal access on the earnings
distribution. Two basic effects are in play: On average, lower-income workers have home
internet service of lower quality and lesser reliability. In isolation, this fact suggests that moving
to universal access would reduce inequality. However, planned levels of WFH in the post-
pandemic economy rise strongly with earnings in the cross section. This effect cuts the other
2
This estimate is a projection of how the pandemic will affect future productivity through the pandemic-induced re-
optimization of working arrangements. See BBD and Erdziek (2021) on how the pandemic drives a re-optimization
of working arrangements. To be sure, the pandemic may have additional productivity consequences, positive and
negative, through other channels.
2way. On net, we find that universal access would be of little consequence for overall earnings
inequality and for the distribution of average earnings across major demographic groups.
Internet access quality was more consequential during the pandemic, because WFH accounted
for a larger share of labor services. For the period from May 2020 to April 2021, we estimate that
subpar internet access degraded earnings-weighted productivity by 3%. As before, our
counterfactual is universal access to high-quality, fully reliable internet service. For perspective,
consider the size of the U.S. output shortfall during the pandemic. Real GDP per capita was
about 11% below its pre-pandemic trend in the second quarter of 2020 and about 4.5% below
trend in the third quarter.3 These figures imply that universal access would have materially
moderated the U.S. output shortfall during the pandemic. They also imply that the flow payoffs
to universal access are larger in other disaster scenarios (e.g., another pandemic) that inhibit
travel and in-person interactions but do not cut off the internet itself. Partly for this reason, we
see universal access as even more valuable to society than suggested by a simple capitalization
of its expected flow benefits.
More broadly, our societal experience with remote work and virtual connectivity during the
COVID-19 pandemic highlights the resilience value of the internet and other technologies that
facilitate commerce and socializing at a distance. These technologies enabled large sectors of the
economy to function well during the pandemic, even as people sheltered in place and socially
distanced. They also facilitated a swift expansion of online commerce and delivery services,
making it much easier for people to socially distance and curtail the spread of the virus.
Similarly, universal access would promote economic resilience in the face of future pandemics
and other disasters that inhibit travel and in-person interactions.
Universal access also promotes other forms of resilience. To see this point, start with the fact that
loneliness and social isolation are harmful to mental and physical health. This observation leads
naturally to the conjecture that social distancing during the pandemic had negative health effects
for many Americans. It also raises the question of whether internet access alleviates the harmful
health effects of social distancing. In this regard, we find that subjective well-being increases
with internet access quality during the pandemic conditional on work status, working
arrangements, and a battery of other controls. While we do not estimate causal effects on well-
being, our evidence suggests that home internet access mitigates the negative health effects of
loneliness and social isolation in a time of pervasive social distancing, and that better access does
so to a greater extent.
Before proceeding, we note some limitations of our data and analysis. First, our SWAA sample
may underrepresent persons who lack home internet access, leading us to misstate the impact of
universal access. Second, we rely on worker assessments of productivity in gauging the
3 See Figure 6 in Davis, Liu, and Sheng (2021).
3consequences of universal access.4 Employer assessments may differ. Third, our projections
neglect static general equilibrium effects. For example, suppose universal access encourages
more WFH and thereby drives down the cost of office space in city centers. In turn, cheaper
office space could moderate the induced shift to remote work. We think equilibrium effects of
this sort are likely to be quite small, especially given the very modest size of our estimate for
how universal access would affect the extent of WFH. Fourth, our projections ignore dynamic
effects. These could flow from technological advances that promote WFH over time (Bloom,
Davis, and Zhestkova 2021) or the longer-term consequences of universal access itself, which
could prompt changes in job design that facilitate remote work.5 These dynamic effects could be
important, but they are also hard to project. Finally, we are silent about costs, which are surely
relevant to judgements about the desirability of moving to universal access.
2. Working arrangements, productivity, and internet access in the cross
section
2.a. The Survey of Working Arrangements and Attitudes
We have fielded the SWAA since May 2020, collecting 2,500 to 5,000 responses per month.
Each survey wave contains 40 to 55 questions on demographics, employment status, working
arrangements, earnings, commuting, internet access, expectations and experiences related to
WFH, perceptions, and more. Our focused questions and large sample size give us an
unparalleled window into the WFH phenomenon during the pandemic and let us make data-
based projections for the post-pandemic U.S. economy.6
The SWAA target population covers U.S. residents, 20 to 64 years old, who earned at least
$20,000 in 2019. Given these parameters, QuestionPro and Inc-Query recruit respondents on our
behalf from lists of verified persons supplied by leading market research aggregators, who gather
potential respondents from multiple sources. One reason to tap multiple sources is that the form
of respondent compensation depends on where and how they are recruited. Some respondents
4 BBD show that the self-assessed productivity effects of WFH align reasonably well with less subjective measures
based on commuting time savings. They also find that desired and planned levels of WFH in the post-pandemic
economy rise strongly with the self-assessed, relative productivity of WFH. These results give us confidence that
our productivity data are meaningful.
5
As one example, doctors and patients report that the use of video conferencing to discuss test results and conduct
routine follow-up consultations can be more efficient and convenient than in-person visits. Universal access
facilitates this type of remote healthcare delivery, which makes it more practical for healthcare professionals to work
remotely.
6
See Barrero, Bloom, and Davis (2021a) for the full set of questions. Our data are available to other researchers at
www.WFHresearch.com, and we continue to field the SWAA and update the website about once a month. We do
not collect personally identifiable information, do not contact respondents directly, and have no way to recontact
them.
4receive airline miles in exchange for survey participation, for instance, while others receive cash
or credits that unlock internet game features. No respondents sign up specifically for our survey.7
The resulting distribution of SWAA respondents appears similar to that of working-age
respondents in Current Population Survey (CPS) data from 2010 to 2019, except the SWAA
features notably larger shares of high earners and persons with advanced degrees. Throughout
this paper, we reweight raw SWAA responses (after dropping speeders) to match the distribution
of respondents in the 2010–2019 CPS over cells defined by the cross product of four age bins,
sex, six education categories, and four earnings bins. The resulting marginal distributions by age,
sex, education, earnings, major industry, and Census division in the reweighted SWAA data are
very similar to the corresponding CPS distributions (Figure 2 in BBD).
Respondents can, and sometimes do, take our survey using a mobile device that does not require
home internet access or using wifi internet outside the home (for example their workplace during
a break). Still, our sample may be skewed away from persons who lack home internet access.
Insofar as our sample is skewed in this manner, we may understate the impact of universal access
for the simple reason that it would involve a bigger change for persons who currently lack
access. Other sources of sample selection may affect some of our results, as we discuss below.
2.b. The extent of working from home
Table 1 summarizes the extent of WFH before, during, and after the COVID-19 pandemic. Our
post-COVID projections rely on responses to the following SWAA question:8
After COVID, in 2022 and later, how often is your employer planning for you to work full
days at home?
- Never
- About once or twice per month
- 1, 2, 3, 4, or 5+ days per week [separate options for each]
- My employer has not discussed this matter with me or announced a policy about it
- I have no employer
In constructing our projections, we drop persons with no employer in the survey week. We
assign zeros to “Never” and “About once or twice per month,” 20% for one full day per week
WFH, 40% for two full days, and so on. We also assign zeros to “My employer has not discussed
this matter with me …” on the view that employers are unlikely to raise the matter with workers
7
Following best practice for surveys of this type, we drop persons who complete the survey in less than two minutes
in May, less than three minutes in the July to November 2020 waves, and less than five minutes in later waves.
Given the nature and number of our survey questions, these “speeders” are unlikely to supply careful responses.
After dropping speeders, which cuts the sample about 20%, median completion time ranges from three minutes and
ten seconds in May 2020 to 10 minutes and 55 seconds in December 2020.
8
Before the August 2020 wave, the question specified “After COVID in 2021…” instead of 2022.
5in jobs for which WFH is impractical or infeasible. See BBD on how we estimate the extent of
WFH before and during COVID and comparisons to results from other surveys.
Table 1: Working from home before, during, and after the Covid-19 pandemic
Notes: The pre-COVID estimate for the extent of WFH relies on data from the 2017–2018 American Time
Use Survey, as described in Barrero, Bloom, and Davis (2021). Estimates for “During COVID” rely on
data from the May 2020 through May 2021 waves of the SWAA. Estimates for “Post-COVID” rely on
worker responses to questions about employer plans in the six most recent waves of the SWAA, namely
December 2020 to May 2021. We re-weight raw responses in the SWAA to match the share of working-age
respondents in the 2010–2019 CPS in each {age x sex x education x earnings} cell. Standard errors in
parentheses.
As reported in Table 1, we project that WFH will account for 21.9% of full paid workdays in the
post-pandemic economy, 27.7% on an earnings-weighted basis. The higher earnings-weighted
figure reflects the strongly positive cross-sectional relationship between the extent of WFH and
worker earnings. WFH also rises strongly with educational attainment, as seen in the lower
panel. In contemplating these figures, recall that our target population is persons 20–64 who
earned at least $20,000 in 2019. Thus, we under sample low-wage and part-time workers, who
tend to be concentrated in Food Services, Retail Trade, and other industries with lesser scope for
WFH. For this reason, our results may overstate the equal-weighted WFH share in the post-
pandemic economy. This feature of our sample matters little for earnings-weighted results.
2.c. The relative productivity of working from home
To assess the relative productivity of WFH, the SWAA puts the following question to all persons
who report WFH at some point during the pandemic:
How does your efficiency working from home during the COVID-19 pandemic compare
to your efficiency working on business premises before the pandemic?
6- Better—I am more efficient at home than I was working on business premises
- About the same—I'm equally efficient in both places
- Worse—I am less efficient at home than I was working on business premises
For those who respond “Better” [“Worse”], we follow up with:
How much more [less] efficient have you been working from home during the COVID-19
pandemic than on business premises before the COVID-19 pandemic?
Response options are: Under 5% more [less] efficient; 5 to 10% more [less] efficient; 10 to 15%
more [less] efficient; 15 to 25% more [less] efficient; 25 to 35% more [less] efficient; and Over
35% more [less] efficient.
As seen in Figure 1, 44% of respondents say that WFH is about as productive as working on
employer premises. The balance of the other 56% tilts toward greater productivity when WFH.
That is, the average worker reports greater productivity when WFH. As shown in BBD, the
planned extent of WFH in the post-pandemic economy rises strongly with the relative
productivity of WFH. Thus, the productivity boost generated by a shift to WFH in the post-
pandemic economy reflects a combination of higher productivity when WFH for many workers
and the selected nature of who works from home in the post-pandemic economy.
Putting the various pieces of information together, BBD estimate that the post-pandemic shift to
WFH will drive an earnings-weighted productivity gain of 4.6% relative to the situation with
pre-pandemic working arrangements. This gain arises mainly from the savings in commuting
time afforded by more WFH. Because they do not account for commuting time, conventional
measures of productivity will show a smaller gain. Indeed, when BBD mimic conventional
measures, they project that the re-optimization of working arrangements in the post-pandemic
economy will boost measured productivity by only 1%.
2.d. The cross-sectional distribution of home internet access quality
Figure 2 displays the distribution of home internet access quality based on responses to the
question, “How reliable is your internet connection?” About 41% of SWAA respondents say
they have “perfect” home internet service that “works 100% of the time.” Another 43% say their
home internet service works “90% of the time,” 12% say it works “70% to 80% of the time,” 2%
say less than “70% of the time,” and 2.5% have no home internet connection.
7Figure 1: Efficiency of WFH vs. working on business premises
Source: Responses to the question, “How does your efficiency working from home during the COVID-19 pandemic compare to your
efficiency working on business premises before the pandemic?”
Notes: Data are from 38,250 survey responses collected from August 2020 to May 2021 by Inc-Query and QuestionPro. We asked a
similar question in earlier waves but focus on August 2020 to May 2021 when we kept the question and response options consistent.
We re-weight raw responses to match the share of working age respondents in the 2010–2019 CPS in each {age x sex x education x
earnings} cell.
Figure 2: Distribution of internet quality among SWAA respondents
Source: Respondents to the question, “How reliable is your internet connection?” in the Survey of Working Arrangements and
Attitudes.
8Notes: Data are from 43,250 survey responses collected from May 2020 to May 2021 by Inc-Query and QuestionPro. We re-weight
raw responses to match the share of working age respondents in the 2010-2019 CPS in each {age x sex x education x earnings} cell.
Table 2 provides information about how the average quality of internet access varies by
demographics and other respondent characteristics. The overall average access quality is 88.9%,
meaning that home internet service works about 89% of the time for the average person with
WFH experience during the pandemic. Average access quality is similar for men and women and
somewhat smaller for persons 50–64 years of age. Average access quality rises with education
and with earnings in 2019. When we further weight responses by number of children in the
household, overall average access quality is somewhat higher at 90.8%. Here, it’s worth keeping
in mind that households with no working parent, or no parent who earned at least $20,000 in
2019, are not in-scope for our sample. Appendix Table A.1 provides more information about
how internet access quality varies with observables in the SWAA.
Table 2: Average internet access quality by group
Notes: Percent of the time that the internet works, based on responses to the question, "How reliable is
your internet connection?" Data are from over 40,000 survey responses collected between May 2020 and
May 2021 by Inc-Query and QuestionPro. We reweight raw responses to match the share of working age
respondents in the 2010–2019 CPS in a given {age x sex x education x earnings} cell. The second and
fourth columns additionally weight by the number of children present in the household.
2.e. How WFH productivity relates to home internet access quality
Figure 3 summarizes how the relative productivity of WFH relates to internet access quality in
the cross section. Persons with internet access that works all the time report an average
productivity difference of nearly 8% in favor of WFH. At the other end of the scale, persons with
internet access that works less than 70% of the time and those who lack home internet access
report average productivity differences of about 1% in favor of employer premises. Figure 3, in
conjunction with Figure 2, clearly points to the potential for universal access to raise productivity
for persons who work from home. Since WFH is projected to account for more than one-fourth
9of all earnings-weighted workdays in the post-pandemic economy, Figures 2 and 3 also imply
that universal access would raise overall productivity in the economy.
Figure 3: Self-assessed efficiency while WFH by reported internet quality
Source: Responses to the following questions in the Survey of Working Arrangements and Attitudes.
“How reliable is your internet connection?”
“How does your efficiency working from home during the COVID-19 pandemic compare to your
efficiency working on business premises before the pandemic?”
“How much more [less] efficient have you been working from home during the COVID-19 pandemic
than on business premises before the COVID-19 pandemic?”
Notes: Data are from 38,250 survey responses collected from August 2020 to May 2021 by Inc-Query and
QuestionPro.. We re-weight raw responses to match the share of working age respondents in the 2010–
2019 CPS in each {age x sex x education x earnings} cell.
3. Projecting the effects of universal access
3.a. Direct productivity effects
We now project the effects of a hypothetical move to universal access, defined as a shift from the
current access situation (summarized in Figure 2 and Table 2) to one with high-quality, fully
reliable internet access in all households. In forming our productivity projections, we combine
individual-level data on the planned extent of WFH in the post-pandemic economy with
individual-level estimates for the productivity impact of universal access.
10We estimate the individual-level productivity impacts using two distinct approaches. The first
exploits responses to the following question: “How much would your efficiency working from
home increase if you had perfect high-speed internet?” Responses to this question, summarized
in Figure 4, elicit self-assessed causal effects of the hypothetical in question. Accordingly, we
interpret the suitably aggregated responses as yielding estimated causal effects, subject to the
qualifications sketched above and discussed more fully below. Survey responses to this question
for persons with WFH experience during the pandemic say that universal access raises the
earnings-weighted average efficiency of time spent WFH by 3.3%. Appendix Table A.2 provides
information on how the self-assessed efficiency gains vary with observables.
Figure 4: “How much would your efficiency working from home increase if you had perfect
high-speed internet?”
A. All Respondents with WFH Experience B. Only Those with Imperfect Reliability
Source: Responses to the following questions in the Survey of Working Arrangements and Attitudes:
“How reliable is your internet connection?”
“How much would your efficiency working from home increase if you had perfect high-speed
internet?”
Our second approach relies on regression models that relate the productivity of WFH to internet
access quality in the cross section. The dependent variable is WFH efficiency during the
pandemic relative to that of working on employer premises before the pandemic. Appendix
Table A.3 reports our estimated regression models. Our preferred model controls for earnings,
education, gender, presence of children, state of residence, and industry of the worker’s current
or last job. Using this model, and interpreting the coefficient on internet access quality as a
causal effect, we calculate the individual-level productivity change associated with universal
access.
11Table 3 draws together the pieces of our analysis to report two sets of results: Estimates for the
aggregate labor productivity shortfall caused by subpar internet access during the pandemic in
column (1), and estimates for the aggregate labor productivity gains caused by universal access
in the post-pandemic economy. The regression approach implies a productivity shortfall due to
subpar internet service of 0.7% during the pandemic and a productivity gain from universal
access of 0.3% in the post-pandemic economy. The approach based on self-assessed causal
effects yields larger productivity consequences: a 3% shortfall during the pandemic and a 1.1%
gain from universal access in the post-pandemic economy.
Table 3: Earnings-weighted productivity effects of internet access quality
Notes: Column (1) reports the estimated aggregate productivity shortfall during the pandemic due to
subpar internet access quality by many Americans who worked from home. See Figure 3 for the
distribution of subpar internet service. Column (2) reports the estimated earnings-weighted productivity
gains of universal access to high-quality, fully reliable home internet service in the post-pandemic economy
when using employer plans for who works from home, and how much. Column (3) also adjusts for the post-
pandemic rise in WFH that we estimate, and which we report in Table 5 below. See Figure 4 for the
distribution of self-assessed causal effects from gaining access to high-quality, fully reliable internet
service. See Table 3 for regression models that relate WFH productivity to internet access quality. We use
column (1) in Table 3 for the row titled, “Regression-imputed (simple)”; and we use column (7) in Table 3
for the row, titled “Regression-imputed (simple)”. Data are from 43,250 survey responses collected from
May 2020 to May 2021 by Inc-Query and QuestionPro. We re-weight individual-level data to match the
share of working age respondents in the 2010–2019 CPS in each {age x sex x education x earnings} cell.
The regression approach might seem more familiar than the approach that relies on the self-
assessed efficiency effects of better internet access. However, we see the self-assessment
approach as superior, precisely because it relies on survey questions that seek to elicit a causal
12effect. In contrast, our regression-based approach to quantifying the causal productivity effects of
better internet service relies on strong assumptions that might not hold.9 Accordingly, we focus
on results that rely on self-assessment effects in the rest of the paper.
3.b. The response of WFH to universal access and knock-on productivity effects
Thus far, we have ignored any effect of home internet access quality (and availability) on the
extent of WFH. If better access improves WFH efficiency, as our foregoing evidence strongly
indicates, we expect universal access to increase the extent of WFH. The question is how much.
Figure 5 confirms that the extent of WFH rises with internet access quality conditional on the
worker’s earnings and industry of employment, which we interpret here as crude controls for the
nature of the worker’s job. The upper regression line and black dots reflect data on reported
levels of WFH during the pandemic as of the survey week. The lower regression line and red
dots reflect employer plans for WFH in the post-pandemic economy, as reported by the worker.
In both cases, a ten percentage-point increase in the working availability of home internet access
brings a 0.8 percentage-point increase in the extent of WFH. This effect is statistically significant
but modest in size.
Figure 5: How the incidence of WFH relates to internet access quality conditional on
industry and earnings
Notes: Coef during COVID = 0.08 (0.03). Coef post-COVID = 0.08 (0.02) N = 24890. Controls for
industry, survey wave FE, and 2019 earnings. 7/2020 and later survey waves.
9
The slope coefficient on internet access quality has a causal interpretation only under strong assumptions,
including the assumption that the variation in internet access quality is conditionally uncorrelated with omitted
determinants of WFH efficiency.
13Table 5 reports the estimated impact of universal access on the extent of WFH when we interpret
the slope coefficients in these regressions as casual effects. The overall estimated impact on the
extent of WFH—an increase of 0.7 percentage points—is quite modest both during and after
COVID. The impact also varies little across demographic groups. Hence, when we account for
the impact of universal access on the extent of WFH in the post-pandemic economy, our
estimates for the aggregate labor productivity effects of universal access barely budge. This point
can be seen by comparing the results in columns (2) and (3) of Table 4.
Table 5: Extra WFH induced by universal access during and after the COVID-19
pandemic
Notes: Estimated percent of full paid WFH days are 45.4 during COVID and 22.2 post-COVID. Average
increase in percent of WFH days are based on a regression and imputation method that estimates the
relationship between WFH days and internet quality with controls for 2019 earnings and industry of the
current or most recent job. We multiply the slope coefficient by the increase in internet reliability that takes
each respondent to 100% reliable internet. The sample includes respondents who are working during
COVID. Data are from over 40,000 survey responses collected between May 2020 and May 2021 by Inc-
Query and QuestionPro. We reweight raw responses to match the share of working age respondents in the
2010–2019 CPS in a given {age x sex x education x earnings} cell.
3.c. Assessing the estimated productivity and output effects
Figure 6 summarizes our results on the aggregate labor productivity effects of universal access.
The “Post-COVID” data points are from column (2) in Table 4. The other data points trace out
our estimates for the productivity shortfall caused by subpar internet access during the pandemic.
The magnitude of the shortfall ranges from 2.6 to 3.6% for the self-assessment approach,
fluctuating over time with the extent (and cross-sectional distribution of) WFH during the
pandemic. The smaller 1.1% gain that we estimate for the causal effect of universal access in the
post-COVID economy reflects a lower incidence of WFH.
14Figure 6: Earnings-weighted productivity gains from universal access to high-quality,
reliable home internet service
Notes: Adjusts for each respondent’s amount of WFH during COVID and employer plans post-COVID.
As remarked in the introduction, we can use these labor productivity estimates and a standard
aggregate production function to derive implications for aggregate output. In particular, we work
with a production function that exhibits constant returns to scale and a value of two-thirds for the
elasticity of output with respect to labor services. Given this production function, and holding
fixed the values of non-labor inputs, a 1.1% improvement in labor productivity implies an
aggregate output gain of 0.73% (= (1.011)2/3 − 1) per period in the post-pandemic economy.
Similarly, a 3% labor productivity shortfall due to subpar internet access implies an aggregate
output loss of 2% during the pandemic. In other words, the flow output loss during the pandemic
is nearly three times as large as the projected flow benefits from universal access in the post-
COVID economy. This comparison underscores the economic resilience value of universal
access: the output payoff is much larger in pandemic-like disaster states when output is unusually
low and the marginal value of output is unusually high.
Our estimates for the impact of universal access on productivity and output could be biased for
various reasons. As explained above, we may under sample persons who lack home internet
access. Moving to universal access would be a very large change for persons who currently lack
access. Thus, if our sample is selected against those who currently lack access, it may
downwardly bias our estimated productivity effects. Perhaps, however, under-represented
persons have smaller productivity responses to better internet service because their jobs offer less
scope for WFH. This effect cuts the other way. In any event, persons with no internet access tend
15to have low earnings and productivity. Thus, a given percentage change in their productivities
would have relatively modest effects on earnings-weighted mean productivity. In light of these
observations, we think sample selection against persons who lack home internet access is a small
concern in our analysis.
Two other sources of bias strike us as potentially more important. First, insofar as pandemic-
related stresses, the presence of kids at home due to school closures, a lack of familiarity with
remote work technologies, and other forces pull down WFH productivity during the pandemic,
our regression models understate the likely strength of any relationship between the relative
efficiency of WFH to internet access quality after the pandemic. To a lesser extent, this point
also applies to our estimated individual-level productivity effects under the self-assessment
approach. For example, an initial lack of familiarity with remote work technologies may pull
down the self-assessed impact of better internet service on the relative efficiency of WFH. Such
transitory negative effects on WFH productivity during the pandemic lead us to understate WFH
efficiency in the post-pandemic economy and, hence, to understate the productivity and output
benefits of universal access in a post-pandemic setting.
Second, we have no data on the relative efficiency of WFH for respondents with no WFH
experience during the pandemic (as of the survey date). That’s 43.3% of respondents on an
equal-weighted basis and an estimated 34.2% on an earnings-weighted basis.10 Thus, the Table 3
and Figure 6 estimates rest on an implicit assumption that persons with no WFH experience
during the pandemic have the same average productivity responsiveness to better internet service
as persons in the analysis sample. If excluded persons disproportionately hold jobs that are
poorly suited for WFH, which seems likely, their exclusion leads us to overstate the effects of
universal access on productivity and output.
A few additional observations are helpful in thinking about the potential effects of universal
access on future productivity and output. First, we expect the structure of the economy to
continue evolving in ways that expand opportunities for remote work. Examples include greater
remote service delivery by health care professionals, social workers, educators, and customer-
service staff in government agencies, all of which shifted to greater remote work in reaction to
the pandemic. Even activities as seemingly unsuitable as operating oil and gas wells are seeing a
shift to remote workers (Jiao and Tovar 2020). Looking across countries, Hatayama et al. (2020)
find a strong positive relationship between GDP per capita and the extent to which jobs in the
country are amenable to WFH. In light of these observations, it seems likely that the flow
productivity and output benefits of universal access will rise over time.
Advances in complementary technologies is another reason to expect the flow benefits of
universal access to rise over time. In this regard, Bloom, Davis, and Zhestkova (2021) find that
10
To derive the earnings-weighted estimate, we assign respondents to the midpoints of their 2019 earnings bins (or
$1 million for the top bin of $500,000 or more).
16the pandemic drove a rise in the share of new U.S. patent applications that advance technologies
in support of video conferencing, telecommuting, and remote interactivity. This finding suggests
that a redirection of technical change in reaction to COVID-19 and a persistent shift to WFH will
raise the quality and efficiency of remote work in the future. Insofar as complementary
technologies improve, universal access is likely to have larger payoffs.
3.d. Earnings inequality
Since the foregoing productivity analyses are built up from micro data, we can easily consider
the implications of universal access for the distribution of individual-level productivities. If, in
addition, we assume that individual earnings are proportional to productivities in the cross
section, we can estimate the consequences of universal access for the distribution of earnings.
Clearly, the proportionality assumption is only an approximation, but we regard it as a useful and
transparent one.
Applying this assumption, we estimate that universal access would raise earnings by 1% for
persons who earned $20,000–50,000 in 2019, 1.2% for those who earned $50,000–100,000,
1.3% for those who earned $100,000–200,000, and 1.1% for those who earned more than
$200,000 in 2019. These estimates reflect employer plans for who will work from home in the
post-pandemic economy, how much, and self-assessed productivity effects of better internet
service. The proportional earnings gains are smaller at the bottom end, because low-wage jobs
offer little scope for WFH. In short, moving to universal access would not materially affect
earnings inequality according to our analysis.
Table 6 reports estimated productivity effects of universal access for demographic and other
groups. Here as well, our projections imply that universal access would have modest effects on
the (log) earnings distribution. Using the self-assessment approach, we find the smallest
estimated effect of universal access for persons who did not finish high school (0.3%) and the
largest for persons with a four-year college degree (1.4%).
17Table 6: Efficiency gains from universal access to high-quality internet by group
Notes: Average WFH efficiency gain post-COVID from universal access to high-quality internet, based on
responses to "How much would your efficiency working from home increase if you had perfect high-speed
internet?" The sample includes respondents who responded to the self-assessment question and the question
about how much their employer is planning for them to work from home, except those who said they have no
employer. For each respondent we multiply the potential efficiency gain from perfect internet by the fraction
of working days their employer is planning for them to be WFH post-COVID. Data are from over 40,000
survey responses collected between May 2020 and May 2021. We reweight raw responses to match the share
of working age respondents in the 2010–2019 CPS in a given {age x sex x education x earnings} cell.
4. Internet access and subjective well-being during the Pandemic
That loneliness is negatively associated with physical and mental health is well documented in
the psychology literature. As remarked in the opening paragraph of a highly cited article by Holt-
Lunstad et al. (2015), “Being socially connected is not only influential for psychological and
emotional well-being but it also has a significant and positive influence on physical well-being
and overall longevity.” Similarly, a highly cited article by Thoits (2011) opens by remarking,
“Substantial evidence has accumulated over the past few decades showing that social ties and
social support are positively and causally related to mental health, physical health, and
longevity…. Evidence also documents that social support buffers the harmful physical and
mental health impacts of stress exposure.”
This body of evidence suggest that social distancing during the pandemic and pandemic-related
stresses had negative health effects for many Americans. It also suggests the hypothesis that
better internet access during the pandemic alleviated the harmful psychological and other health
effects of social distancing and pandemic-related stresses. Consistent with this hypothesis,
Wallinheimo and Evans (2021) find higher life quality and lower depression scores for middle-
18age and older Americans who used the internet more often during June and July 2020. These
positive associations were concentrated among people who used the internet mainly for
communication, while those who used it for government or health-related searches experienced
more depression symptoms. Varma et al. (2021) find that younger people were particularly
vulnerable to stress, anxiety, and depression during the pandemic. Suicides and internet queries
about suicide fell during the pandemic, contrary to concerns when lockdowns were first
implemented. See, for example, Ahmad et al. (2021), Ayers et al. (2021), and Sinyor et al.
(2020). Ability to connect over the internet may be one reason why suicides did not rise during
the pandemic.
Other studies point to a broader potential for internet use and social media to be sources of
harmful effects on well-being. See, for example, Alcott et al. (2021), Servidio et al. (2021), and
Elhai et al. (2020). We do not aim to assess the overall effects of internet usage on well-being.
Our much more limited objective is to provide evidence as to whether better internet access is
associated with positive effects on well-being during a period with sharply restricted in-person
interactions. The effects of better internet access during normal periods may well be different.
Also, in contrast to most other studies, we examine the relationship of well-being to internet
access quality rather than internet usage or usage patterns. Access quality is arguably more
exogenous with respect to well-being than usage intensity or usage patterns.
To quantify subjective well-being among SWAA respondents, we ask the following question:
“Please imagine a ladder with steps numbered from zero at the bottom to ten at the top. The top
of the ladder represents the best possible life for you and the bottom of the ladder represents the
worst possible life for you. If the top step is ten and the bottom step is zero, on which step of the
ladder do you feel you personally stand at the present time?” We multiply the responses by ten to
put them on a scale that runs from zero to 100.
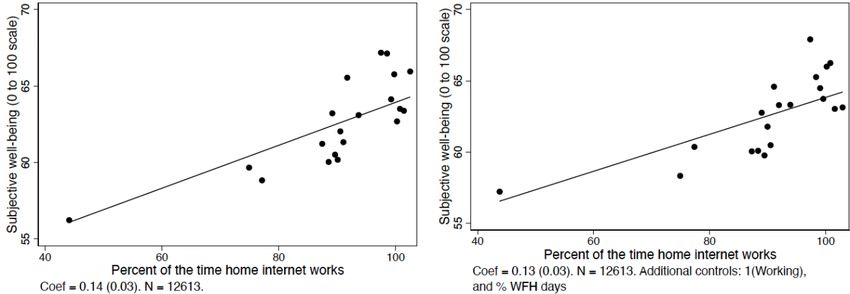
Figure 7 presents binned scatter plots of subjective well-being against the percent of time that the
respondent’s home internet service works. The left plot controls for gender, years of education,
our four age bins, the log of 2019 earnings, whether the respondent lives with other adults,
whether he or she lives with children, and whether the respondent lives with a partner. The slope
coefficient of 0.14 says that a ten percentage-point increase in internet availability is associated
with a 1.4 percentage-point higher value of well-being. The right plot, which adds controls for
employment status and working arrangements, yields a very similar relationship.
Appendix Table A.4 considers more flexible statistical models and extra controls. One additional
result is that employed persons enjoy substantially higher well-being.11 Controlling for other
factors, the improvement in subjective well-being associated with working is more than one-third
11
In line with a large body of evidence that job loss and unemployment bring sizable declines in subjective well-
being (Frey and Stutzer 2002). To see this point, recall that the SWAA sample is limited to persons who earned at
least $20,000 in 2019. Thus, SWAA respondents who are jobless in the survey week recently had jobs but became
unemployed or left the labor force.
19as large as the standard deviation of well-being in the sample.12 For those who work, well-being
is higher for persons who work from home a larger percentage of the week. Perhaps surprisingly,
we find little evidence that the association of well-being with internet access quality is weaker
for persons living with a partner or other adult.
Figure 7: How subjective well-being relates to internet access quality during the pandemic
Notes: Binned scatter plots of subjective well-being against internet quality. Both specifications control for
gender, years of education, log(2019 earnings), age bin FE, whether living with other adults, whether
living with children, and whether living with a partner. Subjective wellbeing is ten times the response to the
following question:
“Please imagine a ladder with steps numbered from zero at the bottom to ten at the top. The top of
the ladder represents the best possible life for you and the bottom of the ladder represents the
worst possible life for you. If the top step is 10 and the bottom step is 0, on which step of the
ladder do you feel you personally stand at the present time?”
Data are from over 40,000 survey responses collected between May 2020 and May 2021 by Inc-Query and
QuestionPro. We reweight raw responses to match the share of working age respondents in the 2010–2019
CPS in a given {age x sex x education x earnings} cell. Robust standard errors in parentheses. *** p5. Universal access as a source of economic and social resilience
By raising output in the face of infectious disease outbreaks, biological attacks, and other disaster
states that involve physical social distancing, universal access to high-quality home internet
service would strengthen U.S. economic resilience. For society as a whole and for individual
firms and workers, the capacity to quickly switch between production modes of roughly equal
productivity is a valuable option that pays off especially in bad states of the world. Firm-level
examples include contamination events, flood damage, explosions, and destructive fires that
temporarily sideline the employer premises as a place of work. At the macroeconomic level, our
analysis says that the output payoff to universal access during pandemic-like disasters is nearly
three times as large as the payoff during normal periods. Our evidence also suggests that
universal access promotes resilience by providing a ready means of engagement and socializing
when circumstances compel physical distancing.
Universal access has other important benefits that we do not quantify, and that are likely to be
especially valuable during pandemic-like disasters. For example, better internet access improves
the ability of households to turn to online shopping and home delivery services during a
pandemic-like disaster. As another example, Chiou and Tucker (2020) find that compliance with
stay-at-home orders during the COVID-19 pandemic rose with access to high-speed internet
service, even after controlling for household income. As a third example, better internet access
promotes student engagement in remote-learning settings. Obviously, the value of remote
learning is greater when a pandemic or other disaster leads to school closures. Using data from
the early stages of the COVID-19 pandemic, Sen and Tucker (2020) find that areas with lower
test scores, more poor children, and more non-White children faced greater problems with
internet access. Thus, universal access may ameliorate the gap in learning opportunities between
children from more and less advantaged families.
In sum, high-quality home internet access and complementary technologies enhance economic
and social resilience in the face of pandemics and certain other disasters that inhibit travel and in-
person interactions. That said, we recognize that internet access is not a general-purpose source
of resilience in the face of all disasters. For example, extended electricity outages over a large
area would prevent most people in the area from accessing the internet to work, socialize, or
study remotely. Cyberattacks that disable the electrical power grid or the internet itself would be
hugely disruptive in any event, and possibly more disruptive insofar as the economy is highly
adapted to remote work. As this remark suggests, widespread reliance on the internet and remote
work can intensify other vulnerabilities.
216. Conclusion
The COVID-19 pandemic triggered a huge shift to working from home, and much of that shift
will endure. Using our forward-looking survey data, we project that more than one-quarter of
earnings-weighted workdays will be supplied from home after the pandemic ends.
Motivated by these developments, we examine data on how internet access quality affects
productivity when working from home. According to our analysis, moving to high-quality, fully
reliable home internet service for all Americans would raise earnings-weighted labor
productivity by an estimated 1.1% in the coming years. The implied output gains are $160 billion
per year, or $4 trillion when capitalized at a 4% rate. Estimated flow output payoffs to universal
access are nearly three times as large in COVID-like disaster states. Better home internet service
during the pandemic is also associated with greater subjective well-being, conditional on
employment status, working arrangements, and a battery of other controls. The extra economic
and social benefits of universal access during the pandemic underscore its resilience value in the
face of disasters that inhibit travel and in-person interactions.
We express our main quantitative results as the benefits of moving to universal access, but the
underlying empirical analysis rests on linear models and relationships. Thus, closing half the gap
between universal access and the current household distribution of internet access quality has,
according to our analysis, productivity and output effects that are half as large. This feature of
our analysis simplifies a comparison of the benefits to the costs of better home internet access.
There is an obvious need to quantify these costs to inform judgments about the wisdom of
moving part or all the way to universal access. We hope that our work encourages a study of the
cost side as well as further examinations of the benefits. We also hope to encourage additional
research into sources of economic and social resilience in the face of disasters, which we see as
an important but understudied topic.
22References
Ahmad, Farida B. and Robert N. Anderson. 2021. “The Leading Causes of Death in the US for
2020.” Journal of the American Medical Association 325 (18): 1829–1830.
Alcott, Hunt, Matthew Gentzkow, and Lena Song. 2021. “Digital Addiction.” National Bureau of
Economic Research Working Paper #28936.
Altig, David, Jose Maria Barrero, Nick Bloom, Steven J. Davis, Brent Meyer, Emil Mihaylov
and Nick Parker. 2020a. “Firms Expect Working from Home to Triple.” Macroblog, 28
May.
———. 2021. “WFH Is Onstage and Here to Stay,” Macroblog, 25 February.
Altig, David, Jose Maria Barrero, Nick Bloom, Steven J. Davis, Brent Meyer and Nick Parker,
2020b. “Surveying Business Uncertainty.” Forthcoming, Journal of Econometrics.
Angelici, Marta and Paola Profeta. 2020. “Smart working: Flexibility without constraints.” CES
Working Paper #8165.
Ayers John W., Adam Poliak, Derek C. Johnson, Eric C. Leas, Mark Dredze, Theodore Caputi,
and Alicia L. Nobles. 2021. “Suicide-Related Internet Searches During the Early Stages of
the COVID-19 Pandemic in the US.” JAMA Network Open, 4 (1).
Barrero, Jose Maria, Nicholas Bloom, and Steven J. Davis. 2020a. “60 Million Fewer Commuting
Hours per Day: How Americans Use Time Saved by Working from Home.” VoxEU CEPR
Policy Portal, 23 September.
———. 2020. “COVID-19 Is Also a Reallocation Shock.” Brookings Papers on Economic
Activity, Summer, 329–371.
———. 2021a. “Question Repository for the Survey of Working Arrangements and Attitudes.”
available at www.WFHresearch.com.
———. 2021b. “Why Working from Home Will Stick.” National Bureau of Economic Research
Working Paper #28731.
Bartik, Alexander W., Zoe B. Cullen, Edward L. Glaeser, Michael Luca, and Christopher T.
Stanton, 2020. “What Jobs are Being Done at Home During the Covid-19 Crisis?
Evidence from Firm-Level Surveys.” National Bureau of Economic Research Working
Paper #27422.
Behrens, Kristian, Sergey Kichko, Jackques-Francois Thisse. 2021. “Working from Home: Too
Much of a Good Thing?” CESifo Working Paper #8831.
23You can also read