Dissecting the Impact of Imports from Low-Wage Countries on French Consumer Prices - Banque de France
←
→
Page content transcription
If your browser does not render page correctly, please read the page content below
Dissecting the Impact of Imports
    from Low-Wage Countries on French
              Consumer Prices
                      Juan Carluccio1, Erwan Gautier 2,
                         Sophie Guilloux-Nefussi3

                                  April 2018, WP #672

                                             ABSTRACT
We provide a quantitative assessment of the impact of imports from low-wage countries
(LWCs) on CPI inflation in France during 1994-2014, using detailed micro data on imports
and exports. The share of imports from low-wage countries in consumption increased
from about 2% to 7%, and resulted in a negative impact on CPI inflation of about 0.17 pp
per year on average. This effect decomposes in three channels. 1) The substitution channel,
capturing the replacement of domestic production by goods from LWCs, accounts for
almost -0.05 pp. 2) The rise in the proportion of LWC goods in total imports weighed
down on imported inflation. This channel reduced French CPI inflation by 0.06 pp per year.
3) Instrumental variable estimation of the competition channel at the product level shows that
the increase in the market share of LWCs in French expenditures led to a negative effect of
0.06 pp on CPI inflation.

Keywords: inflation, low-wage countries, imports, globalization, price index, consumers
JEL classification: E31; F62

1Banque de France and University of Surrey. Contact: juan.carluccio@banque-france.fr
2 Banque de France and Université de Nantes. Contact: erwan.gautier@banque-france.fr
3
 Banque de France. Contact: sophie.guilloux-nefussi@banque-france.fr
We have benefited from discussions with Huw Dixon, Romain Faquet, Guillaume Gaulier, John Lewis,
Romain Restout and participants at the 3rd Conference - Using Micro Price Data Workshop at Cardiff
Business School (2017), the 3rd Bank of England/Banque de France International Macroeconomics
Workshop (2017), the Theories and Methods in Macroeconomics Conference (2018) and the French
Treasury Fourgeaud Seminar (2018).
Working Papers reflect the opinions of the authors and do not necessarily express the views of the Banque de
                 France. This document is available on publications.banque-france.fr/en
NON-TECHNICAL SUMMARY
A salient feature of the current phase of the globalization process, which begun in the early
1990s, is the rapid and unprecedented integration of emerging economies in world trade.
Theory predicts that this evolution should benefit households in developed countries
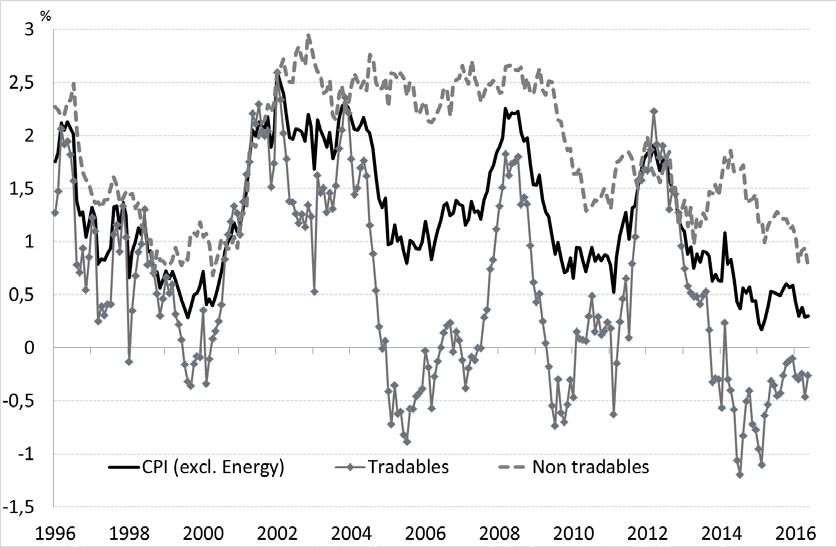
through lowering consumer prices. Figure 1 depicts French CPI inflation and its
decomposition into tradable and non-tradable goods inflation. Inflation in tradable goods
has been consistently lower since the mid-1990s, corroborating the intuition that
international trade openness might have weighed down on inflation over the last two
decades.
French Inflation and the Decomposition into Tradables and Non-tradables
Source: Insee data; computations by the authors
In this paper we provide an assessment of the effect of imports from low-wage countries
on inflation in France from 1994 to 2014, quantifying different channels through which the
effect operated. We estimate that the share of imports from low-wage countries in French
consumption tripled during the period, from 2.4% in 1994 to 6.9% in 2014. The main
result of our analysis is that, had this share remained at its 1994 level, French inflation
would have been 0.17 pp higher per year on average. For comparison, French CPI inflation
(excluding energy) was 1.3% on average over that period, and inflation in manufactured
goods was 0.7%. The single most important country in accounting for these effects is
China. The share of Chinese goods in French consumption grew from 0.7% to 3.5% over
the sample period, a five-fold increase. We find that imports from China alone contributed
to reducing French inflation by 0.10 pp on average, accounting for a little more than half of
the overall effect.
We use quasi-exhaustive firm-level data from the French Customs with information on
quantities and values of imports by product and origin-country, from which we construct
detailed import price indices. We create a concordance table to assign each of the imported
products to a consumption category in the French CPI. Importantly, these data allow us to
Banque de France WP #672 iidocument the evolution of the share of imports in French consumption by origin country,
and to asses by how much those changes have contributed to the dynamics of consumer
prices. The use of detailed product-level prices (by country of origin) is key as it allows
obtaining measures of differences in price levels, which are essential to our exercise.
We decompose the overall effect into three additive channels. First, imports from low-cost
countries replaced goods that were previously produced domestically, with the
corresponding shift in the consumption basket resulting in lower overall prices. Our
estimations suggest that this Substitution Channel reduced French CPI inflation by 0.05 pp
per year on average, accounting for about one third of the overall effect.
A second channel, labeled the Imported Inflation Channel, transits via the evolution of import
prices: the rate of growth of imported good prices affects the CPI proportionally to the
share of these goods in total consumption. We decompose the evolution of the import
price index according to the imports' origins. We find that the increasing share of LWCs in
total French imports of consumption goods depressed import price inflation by around
0.4 pp per year. This in turn reduced French CPI inflation by 0.06 pp per year on average.
Finally, raising LWC imports affect the price-setting behavior of domestic firms, thus
impacting CPI inflation indirectly, which we label the Competition Channel. Fiercer import
competition can negatively impact prices. We find an elasticity of producer prices to LWC
import penetration of about -1. Given the share of imports in total consumption and the
increase in imports from LWCs over the period, this third channel accounts for a reduction
of CPI inflation by 0.06 pp per year on average
It is worth noting that our estimations do not take into account indirect general equilibrium
effects that might take place in the long run (such as price adjustments in tradables
resulting from an income effect, or changes in labor and wages). Estimation of general
equilibrium effects would require a structural macro model, which is left for future
research. This work focuses on quantifying the direct effect on consumer prices.
Impact des importations des pays à bas salaire
sur l’inflation française
RÉSUMÉ
Nous évaluons l'impact des importations en provenance des pays à bas salaire sur
l'inflation de l'IPC en France entre 1994 et 2014 à partir de données individuelles détaillées
sur les importations et les exportations. La part des importations en provenance des pays à
bas salaire dans la consommation est passée d'environ 2 % à 7 % et a eu un impact négatif
sur l'inflation d'environ 0,17 pp par an en moyenne. Cet effet se décompose en trois
canaux. 1) Le canal substitution, qui mesure le remplacement de la production domestique
par des biens provenant des pays à bas salaire, représente environ 0,05 pp. 2)
L'augmentation de la proportion de biens produits dans des pays à bas salaire dans les
importations totales a pesé sur l'inflation importée. Ce canal a réduit l'inflation de l'IPC de
0,06 pp par an. 3) L'estimation par variables instrumentales du canal de la concurrence
montre que la hausse de la part de marché des pays à bas salaire a eu un effet négatif
d'environ 0,06 pp par an sur l'inflation de l'IPC.
Mots-clés : inflation, pays à bas salaire, importations, mondialisation, prix, consommateurs
Les Documents de travail reflètent les idées personnelles de leurs auteurs et n'expriment pas nécessairement
la position de la Banque de France. Ils sont disponibles sur publications.banque-france.fr
Banque de France WP #672 iii1 Introduction
A salient feature of the current phase of the globalization process, which begun in the early
1990s, is the rapid and unprecedented integration of emerging economies in world trade.
Theory predicts that this evolution should benefit households in developed countries
through lowering consumer prices. In policy circles, the idea that raising imports from
emerging economies could depress the level and dynamics of consumer prices in rich
countries gained renewed attention in light of the low levels of inflation observed in the
latter.1 As an illustration, Figure 1 plots French CPI inflation and its decomposition into
inflation of tradables and non-tradables separately. Inflation in tradables is consistently
lower since the mid-1990s, corroborating the intuition that international trade openness
might have weighed down on inflation over the last two decades.
[Insert Figure 1 here]
In this paper we provide an assessment of the effect of imports from low-wage countries
on inflation in France from 1994 to 2014, quantifying different channels through which
the effect operated. We aim at providing a detailed understanding of the French case,
which also sheds light on the implications of globalization for consumer prices in the Euro
Area and other developed countries.
We estimate that the share of imports from low-wage countries in French consumption
tripled during the period, from 2.4% in 1994 to 6.9% in 2014. The main result of our
analysis is that, had this share remained at its 1994 level, French inflation would have
been 0.17 pp higher per year on average. For comparison, French CPI inflation (exclud-
ing energy) was 1.3% on average over that period, and inflation in manufactured goods
was 0.7%. The single most important country in accounting for these effects is China.
The share of Chinese goods in French consumption grew from 0.7% to 3.5% over the
1
ECB President Mario Draghi recently made this concern explicit: “Falling import prices partly
explain the subdued performance of core inflation, too. This is because imported consumer products
account for around 15% of industrial goods in the euro area,” Introductory speech, ECB Forum on
Central Banking, Sintra, 27/7/2017.
2sample period, a five-fold increase. We find that imports from China alone contributed
to reducing French inflation by 0.10 pp on average, accounting for more than half of the
overall effect.
We use quasi-exhaustive firm-level data from the French Customs with information
on quantities and values of imports by product and origin-country, from which we con-
struct detailed import price indices. We create a concordance table to assign each of the
imported products to a consumption category in the French CPI. Importantly, these data
allow us to document the evolution of the share of imports in French consumption by
origin country, and to asses by how much those changes have contributed to the dynamics
of consumer prices. The use of detailed product-level prices (by country of origin) is key
as it allows obtaining measures of differences in price levels, which are essential to our
exercise.
We decompose the overall effect into three additive channels. First, imports from
low-cost countries replaced goods that were previously produced domestically, with the
corresponding shift in the consumption basket resulting in lower overall prices. Our esti-
mations suggest that this Substitution Channel reduced French CPI inflation by 0.05 pp
per year on average, accounting for about one third of the overall effect. A second chan-
nel, labeled the Imported Inflation Channel, transits via the evolution of import prices:
the rate of growth of imported good prices affects the CPI proportionally to the share
of these goods in total consumption. We decompose the evolution of the import price
index according to the imports’ origins. We find that the increasing share of LWCs in
total French imports of consumption goods depressed import price inflation by around
0.4 pp per year. This in turn reduced French CPI inflation by 0.06 pp per year on av-
erage. Finally, raising LWC imports affect the price-setting behavior of domestic firms,
thus impacting CPI inflation indirectly, which we label the Competition Channel. Fiercer
import competition can negatively impact prices (e.g. Chen et al. [2009], De Loecker et
al. [2016]). We find an elasticity of producer prices to LWC import penetration of about
3−1. Given the share of imports in total consumption and the increase in imports from
LWCs over the period, this third channel accounts for a reduction of CPI inflation by
0.06 pp per year on average.2
Our paper contributes to a small but burgeoning literature quantifying the impact
of imports from China on consumer prices in advanced economies. Amiti et al. [2017]
estimate that imports from China reduced the U.S. manufacturing price index by 7.6%
between 2000 and 2006. .3 Bai and Stumpner [2017], using scanner data for a group of
industries, and Jaravel and Sager [2018], using comprehensive data comparable to ours,
estimate the impact of Chinese import penetration on U.S. prices. They rely on move-
ments in Chinese exports to locations other than the United States to identify exogenous
supply shocks –following the strategy of Autor et al. [2013]. Both papers find negative
effects of Chinese imports on U.S. consumer prices, with those in Jaravel and Sager [2018]
being close to ours in magnitude. Like the latter works, we use supply shocks to estimate
domestic price responses. But our wider approach allows us to evaluate the macroe-
conomic significance of the effect more precisely by identifying separately each channel
through which the overall impact transits. Moreover, we show that, while China is very
important, a substantial part of the overall effect is due to other low-wage countries,
implying that a proper overall evaluation cannot be restricted to China alone.
Our paper also relates to a previous literature studying the impact of import pen-
etration on other price indices, either import prices or producer prices. A first group
of works focuses on the evolution of import prices (Kamin et al. [2006] for the United
2
We consider only imports of goods that are similar to the ones actually produced by domestic firms
in order to capture competition in goods’ market. Our analysis does not take into account imports
of intermediate inputs that might increase domestic firms’ productivity with consequences on domestic
prices. Hence, the estimate we produce is to be taken as a lower bound to the overall impact of LWC
imports on French CPI inflation.
3
Amiti et al. [2017] use China’s WTO entry as an exogenous shock, and find that China’s lower input
tariffs increased its imported goods and boosted firms’ productivity, resulting in lower export prices and
larger exports values into the United States. Berlingieri et al. [2016] also look at the effect of trade
agreements, but those implemented by the European Union between 1993 and 2013. They find that
these shocks translated into a reduction in the consumer price index of 0.24% over the period, with
effects being much stronger for high-income countries.
4States, Glatzer et al. [2006] for Austria, Mac Coille [2008] and Nickell [2005] for the
United Kingdom, Pain et al. [2008] for the Euro Area and the United States). The gen-
eral conclusion is that the rapid increase in LWC imports depressed import prices in these
countries because of the lower prices of imported goods. Interestingly, the magnitude of
the effects reported by these works is very close to what we find. A second approach
uses reduced-form regressions to assess the indirect impact of LWC imports on producer
prices (Auer and Fischer [2010] and Auer et al. [2013] using sector-level data for the US
and five European countries, Bugamelli et al. [2015] with individual firm level data for
Italy, Gamber and Hung [2001] with product-level data). These papers cover particular
aspects that are embedded as different channels in our estimates of the overall impact of
LWC imports on CPI inflation.
The rest of the paper is organized as follows. Section 2 provides a simple analytical
framework that guides the empirical work. Section 3 presents the data sources and the
construction of the main variables. Section 4 presents the results, and Section 5 concludes.
2 Analytical Framework
We now present a simple analytical framework that will form the basis of our empirical
exercise. The log of the consumer price index at time t, pt , can be written as a weighted
average of tradables and non-tradables:
pt = βt pTt + (1 − βt )pN
t
T
(1)
where pTt and pN
t
T
are respectively the log of the price indices of tradables and non-
tradables at any given year t, and βt the share of tradables in total consumption.
To quantify the impact of imports originating in low-wage countries it proves useful
to further decompose pTt as a weighted average of imported and domestically-produced
goods, consumed in shares ηt and (1 − ηt ) respectively, and with (log) price indices pFt
5and pD
t :
pTt = ηt pFt + (1 − ηt )pD
t
(2)
Here, the price of imported goods is expressed in euros, which means that the effect of
exchange rate fluctuations is included in this channel. The reason is that our object of
interest is the impact of imports from LWCs for French consumers, whatever the exact
source of variations in import prices.
Similarly, the price index of imported goods, pFt , can be written as:
pFt = γt pLW
t
C
+ (1 − γt )pHW
t
C
(3)
where pLW
t
C
and pHW
t
C
are (log) price indices of imports from low- and high-wage countries
respectively, and γt the share of LWC imports in total French imports of consumption
goods in year t.
Combining expressions (1), (2) and (3), differentiating with respect to time, rearrang-
ing terms and denoting inflation rates with πt = ∂pt /∂t we obtain the following expression
for the rate of CPI inflation in France (see Appendix A for the full derivation):
∂ηt ∂γt LW C
πtCP I LW C D HW C LW C HW C
= βt γt pt − pt + βt ηt (p − pt ) + γt πt − πt
| ∂t {z } | ∂t t
{z }
Substitution Channel Imported Inflation Channel
+ βt (1 − ηt )πtD +Λt
| {z }
Competition Channel
HW C ∂ηt HW C D
NT ∂βt T NT
with Λt = βt ηt πt + (1 − γt ) p − pt + (1 − βt )πt + (p − pt )
∂t t ∂t t
(4)
Equation (4) makes explicit the role of imports from low-wage countries on CPI in-
flation, and forms the basis of our empirical analysis. Imports from LWCs affect the
evolution of domestic inflation as described by the highlighted terms, labeled “channels”:
i. The Substitution Channel measures how changes in the share of consumption of
6imported goods affect the dynamics of CPI prices in France, for a given price-level
differential between domestically-produced and imported goods.
ii. The Imported Inflation Channel quantifies the impact of variations in the import
price index arising from changes in the share of LWCs in total imports (a “switching
effect”, first term in the brackets) and in the differential growth of prices between
goods produced in LWCs and HWCs (a “differential inflation effect”, second term).
iii. The Competition Channel represents the effect of LWC imports on domestic pro-
ducer prices through increased competitive pressures, which affect inflation in pro-
portion to the share of domestic goods in domestic consumption, (1 − βt ηt ).
We quantify the total effect of LWCs on πtCP I , providing a decomposition into the
three above channels from 1994 to 2014. The first two channels are measured with an
accounting decomposition method, whereas the third one requires to estimate the reaction
of domestic firms to increased LWC import penetration with a reduced-form econometric
exercise.
While we will discuss some of the elements in the extra term Λt , our aim is not to
provide a fully-fledged quantification of it. The first term in Λt measures the impact of
imports originating in high-wage countries, through imported inflation and substitution
of domestic production.4 The last two terms represent the contribution of non-tradables
∂βt
to overall inflation, through changes in the share of tradables, ∂t
(pTt − pN T
t ), and in-
flation of non-tradable goods, (1 − βt )πtN T . While imports of consumption goods from
LWCs should not affect those terms directly, they can potentially have an impact via gen-
eral equilibrium effects, stemming from shifts in demand arising from the extra-income
generated by the availability of cheaper goods. Quantifying general equilibrium effects
requires the estimation of a structural model, which is beyond the scope of this paper
4
Supply shocks in LWCs can affect exports to France and also prices of French imports from HWCs,
for example through competition effects, or by affecting worldwide commodity prices. In our analysis we
observe equilibrium values for pHW C that incorporate these effects in case they are present.
7(and, furthermore, such task would require to comparable price levels of tradables and
non-tradables which are highly difficult to compare since it implies to compare prices of
goods with prices of services).
3 Data
3.1 Data Sources
We obtain our sample from different administrative and statistical data sets. Our main
source is a quasi-exhaustive administrative file collected by the French Customs Office. It
provides the yearly values (in euros) and quantities of imports (by country of origin and
product) and exports (by country of destination and product) for all trading firms over
the period 1994-2014.5 Trade flows are classified at the CN 8-digit level (EU - Combined
Nomenclature). The first six digits are identical to the subheading level (6-digit) of the
international Harmonized Nomenclature (HS6), and the last two digits are added by the
European Commission.6 We restrict our sample to imports and exports of manufactured
goods, and we end up with around 14,000 product codes.7
To calculate the share of import in consumption by product we use data on the value
of household consumption at a disaggregated level of the COICOP classification, obtained
from INSEE.8 To estimate the reaction of domestic prices to import penetration we use
Producer Price Indexes (PPI) also from INSEE, corresponding to domestic production
5
Flows with non-EU countries whose value is below 1,000 euros are excluded from the data set. In
the case of EU countries, the threshold is larger, varying from 40,000 to 150,000 euros depending on the
year. These thresholds leave out a very small proportion of French trade flows.
6
As an example, CN8 code 18061015 “Cocoa powder, containing added sugar or sweetening matter -
Containing no sucrose or containing less than 5% by weight of sucrose (including invert sugar expressed
as sucrose) or isoglucose expressed as sucrose” is an extension of HS6 code 18061015 “Cocoa powder,
containing added sugar or sweetening matter”.
7
We exclude raw materials (HS01-15, 23, 25-27, 31 and 41) e.g., “Vegetable products”, “Mineral
products”, “Fertilizers” and “Works of art, collector’s pieces and antiques”, and “Services” (HS97-99).
We keep only importers whose main activity falls within NACE Rev-2 codes 10-33. Excluded trade flows
are about 5% of the total value of French imports and exports.
8
The COICOP is the United Nations’ classification of individual consumption expenditures by house-
holds according to their purpose. This classification is in particular used to compute CPI inflation.
8at the 4-digit level of the French NAF Rev 2 classification (identical to the NACE Rev 2
classification of activities).
3.2 Country Categories
We classify source countries into three different categories according to their GDP per
capita relative to the French GDP per capita. Following Bernard et al. [2006] and Auer
and Fischer [2010], GDPpc ratios are calculated on average over the period 1994-2014, and
the composition of groups is held fixed over the sample period. “High-wage countries” are
those with GDPpc higher than 75% of the French GDPpc. “Low-wage countries (LWCs)”
are those for which the GDPpc lies between 25% and 75% of the French GDPpc. “Very
low-wage countries (VLWCs)” includes countries with GDPpc lower than 25% of France’s.
We look separately at the cases of China and the New European Union member states
(NEUMS), the former grouping countries that joined the EU after 2004.9 Table 1 reports
a detailed list of countries by category.
[Insert Table 1 here]
3.3 Identification of Final Consumption Products
We define the set of consumption goods as those goods included in the French CPI.
Implementing this definition requires mapping CN8 codes to products in the level 3 of
the COICOP classification. To our knowledge, a direct concordance table from CN8 to
COICOP is not available. We first concord CN8 codes into 6-digit CPA codes (about
3,000 different products), and then we use a concordance table from CPA to COICOP.10
We keep only those products in the Customs data set that match into COICOP categories
9
Bulgaria, Croatia, Cyprus, Czech Republic, Estonia, Hungary, Latvia, Lithuania, Malta, Poland,
Romania, Slovakia, Slovenia
10
The CPA is the statistical classification of products by activity used in the European
Union. Concordance tables were obtained from the EU statistical website RAMON: http :
//ec.europa.eu/eurostat/ramon/relations/index.cf m?T argetU rl = LSTR EL.
9(about 4,500 CN8 codes out of a total of 14,000). By definition, products without a match
are classified as imports of intermediate goods. As an example, the CN8 code 61112010,
“Babies’ garments and clothing accessories, knitted or crocheted: Gloves, mittens and
mitts”, maps into the COICOP code 03.1.2, “Garments”. An example of a CN8 code that
has no counterpart in the COICOP classification is 28121011, “Chlorides and chloride
oxides”.
One important caveat is that some products can be used either for consumption or as
inputs, depending on the user (e.g., personal computers). This distinction is impossible
to observe in the data, and thus our import penetration measure might be overestimated.
For COICOP categories that refer to are services, we assume imports of consumption
goods to be zero.
3.4 Share of Imports in Consumption and Import Price Indices
Share of imports in consumption: For each 3-digit COICOP code i we define the
Mit
share of imports in consumption as βit ηit = Cit
, with Mit being imports of good i and
Cit domestic consumption of the same good at time t (βit is the share of tradables in
total consumption and ηit the share of tradable goods that are imported, as defined in
Section 2). We denote βit ηitg , with g ∈ {HW Cs, LW Cs, V LW Cs, N EU M S, China}, the
share of imports from each of the five country groups in domestic consumption of good
i. By construction: ηit = ∀g ηitg .
P
Unlike imports, the value of consumption reported by INSEE includes VAT and dis-
tribution margins, as it aims at reflecting prices actually paid by consumers. To obtain
comparable figures we first scale import values with a uniform 20% distribution margin,
corresponding to the average margin of the retail sector as estimated by Andrieux and
d’Isanto [2015], which includes both transportation and distribution costs. The sample
of products covered by Andrieux and d’Isanto [2015] for this calculation is close to the
10set of tradable goods purchased for consumption purposes we consider.11 Then, we apply
VAT rates to the import values inclusive of margins, the normal rate (20% since January
2014) applies to most of our imported products whereas a reduced rate of 5.5% applies
to food products.
Import Price Indices: We proxy product-level prices with unit values, defined as the
ratio of value to quantity. We calculate unit values at the product(CN8)-country level,
the most disaggregated level available, in order to minimize measurement errors. For
F
each country category g and product i, we first calculate a price index Pgi,0 as a weighted
geometric average of unit values, where t = 0 is the first year this product is in our
sample. Weights γic are the share of imports of each product i and country c in total
French imports of product i from country-group g:
γ
Y
F ic,0
Pgi,0 = Pic,0
c∈g
For the remaining years we compute the import price level for product i imported
from country group g at time t as:
F F F
Pgi,t = Pgi,t−1 πgi,t
where
F γic,t−1
Q
F c∈gt−1 (Pic,t )
πgi,t =Q F γic,t−1
c∈gt−1 (Pic,t−1 )
Naturally, some product-country pairs drop out of the sample over time. In such cases,
we impute to those goods a price change equal to the average change of the remaining
of the index. This methodology is in line with the standard procedure proscribed by the
IMFs Export and Import Price Index Manual (International Monetary Fund [2009]) and,
11
Andrieux and d’Isanto [2015] found some heterogeneity in margin rates across products or type of
outlets but we cannot apply different margin rates to different types of outlets or different goods. Overall,
these differences are going from 10% in communication products sold in supermarkets to 40% for frozen
products sold in specialized outlets.
11as highlighted by Atkeson and Burstein [2008], is equivalent to excluding these goods
at the time they drop from the index and re-normalizing the weights for the remaining
goods to sum up to one.
For each product i, the import price level is then obtained from:
Y
F F γgi,t
Pi,t = (Pgi,t )
∀g
and import price inflation of product i is calculated as:
F F F
πi,t = ln Pi,t − ln Pi,t−1 .
The aggregate import price inflation is calculated as the weighted average of all prod-
ucts’ inflation:
X
πtF = F
γi,t πi,t (5)
∀i
where γ always stands for the share in total imports: γi,t is the share of imports of
product i in total imports, γgi,t is the share of imports of product i from country group
g in total imports.
[Insert Figure 2 here]
Figure 2 shows the evolution of the import price index over the period 1995-2014
(we use 1994 as the base year, thus the inflation measures start in 1995). To check the
validity of our index, we also plot two aggregate measures of import inflation published by
INSEE. The closest official series is the monthly import price index for the manufacturing
industry, constructed with surveys to individual firms starting in 2005. As can be seen, the
inflation rate calculated using this price index correlates very strongly with our import
price inflation (correlation coefficient of 0.73). To have an idea of how well our index
represents import data previous to 2005, we include the year-on-year percentage change
in the import deflator from the National Accounts. This index covers a wider range
12than ours since it includes not only manufactured goods but also services and extractive
industries such as mining and quarrying, with the latter making inflation more volatile.
Still, the correlation with the import price index is high (correlation coefficient of 0.55).
Thus, we can be safe in that our measure of import prices, calculated with unit values
from the Customs data set, reflects the aggregate evolution of French import prices well.
4 Results
We now provide a quantification of the impact of imports from low-wage countries on
French CPI inflation. We follow the decomposition described in Section 2 and present
the results for each channel successively.
4.1 Substitution Channel
As discussed in Section 2, imports can lower domestic inflation because consumers can
substitute domestically-produced goods with cheaper imported goods. On average over
our sample period, the share of tradable goods in total consumption (βt ) is 46% and the
average share of imports in tradable consumption (ηt ) is 32%. Thus, the average share
of imports in total consumption (βt ηt ) is a little higher than 14%. Figure 3 provides the
evolution of the share of imports in total consumption for 1994-2014. Import penetration
shows a clear upward trend, going from 10% in 1994 to 17% in 2014. On average, the
import share in consumption increased by 0.3 pp per year over the period.
[Insert Figure 3 here]
Import penetration can increase for two reasons: a rise in the weight of tradable
goods in the CPI inflation or/and an increase of the share of imports in tradable good
consumption. Figure 3 decomposes changes in import penetration according to these two
factors. Bars in light grey represent the contribution of change in the share of tradables in
13the CPI (ηt × ∂β
∂t
t
) and the bars in dark grey, give the contribution of changes in the share
∂ηt 12
of imports in tradable consumption (βt × ∂t
). The average year-on-year change in the
share of imports in tradables is +0.8 pp, contributing to the increase import penetration
by 0.37 pp on average per year (= 0.46 × 0.8). This increase happened in spite of the
reduction in the share of tradables in total consumption, and the rising share of services:
βt passed from 49% in 1995 to 43% in 2014, contributing negatively to the evolution of
import penetration by approximately −0.07 pp.
A rise in import penetration lowers inflation only if imported goods are cheaper
than the goods they replace. Therefore, estimating the effect of increasing imports on
CPI French inflation requires a measure of the price differential between imported and
domestically-produced goods (pFt − pD
t ). Given the lack of available data on the price
levels of domestically-produced goods, we proxy domestic prices with French export unit
values, as in Emlinger and Fontagné [2013]. We compute export unit values using the
same methodology we described in Section 3.4 for the case of imports. We then select
those CN8 products that are both imported (M ) and exported (X) by French firms,
compute the ratio ln PtM − ln PtX by product (as a proxy for pFt − pD
t ) and compare
their levels and evolution over time. Export prices are collected at their F.O.B. values
(Free on Board), that is at the value of the good at the origin country’s border, and
thereby excluding transportation and freight costs. Import prices are on the other hand
collected at their C.I.F. values at the importing country’s border, and are inclusive of
Cost, Insurance and Freight costs. To account for this wedge we add 5% to all export
unit values, based on the mean estimate of the CIF-FOB margin for France during the
same period of this study, given by Miao and Fortanier [2017].
Figure 4 plots the yearly average (across products) ratio of import prices to export
prices ln PtM − ln PtX . The grey line is constructed using all import origins. On
average over the period, import prices were around 15% lower than export prices and
∂(βt ηt ) ∂βt
12
The total change is ∂t = ∂t ηt + βt ∂η
∂t .
t
14their ratio remained rather stable over time, with a slightly decreasing trend. Given
that the share of imports in French consumption increased by 0.37 pp per year, and
that imports were 15% cheaper, the overall effect of raising imports (irrespective of their
origin) on French CPI inflation was of −0.05 pp per year on average.
[Insert Figure 4 here]
In order to quantify the contribution of LWC to this overall effect, we decompose
price differentials by origin. We find that import prices from HWCs are on average 3%
cheaper than French export prices, this ratio being fairly constant over time (Figure 4,
black line). This indicates very small differences between prices of goods produced in
France and those produced in other high-wage countries (we obtain similar results when
restricting to export prices destined to HWCs only). The price differential with imports
from LWCs as a whole (i.e. China, NEUMS and other LWCs) is much larger than the
one obtained for HWC imports. The average log price differential over 1994-2014 is of
41%.13 This difference slightly declined over time. Price ratios calculated for Chinese
and NEUMS imports do not show strong differences.14
We calculate the contribution of LWC imports to the Substitution Channel using the
formula in equation (4). We find a negative effect of a little less than −0.05 pp on average
per year: βt ∂η t
γ (pLW C − pD
∂t t t t ) = 0.46 × 0.8 × 0.31 × (−0.41) = −0.05. The impact of
HWC imports is very small (less than −0.01 pp). Thus, almost the entire effect of the
substitution channel is due to cheaper imports from low-wage countries.
Import penetration is strongly concentrated in some specific products (i.e. Clothing,
Furnishings and Recreation and Culture goods), and the overall effect reported above
13
Emlinger and Fontagné [2013] obtain a price ratio between French prices and LWC import prices
higher than 2 over the period 2000-2010. However, one difference with Emlinger and Fontagné [2013] is
that we calculate price ratios at level 8 of CN classification whereas they compare prices at level 6 of the
CN classification.
14
Note that the price-differentials we document should be taken as upper bounds, due to likely biases
arising from quality differences, if the average quality of French exports is higher than that of French
imports from LWCs. Estimating quality differences requires the use of a structural model, which is out
of the scope of our paper.
15masks strong heterogeneity across product categories. Figure 5 plots the share of im-
ports in consumption by product category (level 1 of COICOP classification). In 1994,
LWC imports were concentrated in Clothing, Furnishings and Recreation and Culture,
with imports representing between 20% and 34% of consumption. These three sectors
represented altogether 20% of the CPI but about half of total imports of consumption
goods. The largest increases in import penetration are observed for Clothing and Fur-
nishings. In 2014, imports account for about 75% of French consumption of Clothing,
55% of Furnishings. In Communication, which includes cell phones and related devices,
import penetration has increased greatly, from 0% to about 12%.
[Insert Figure 5 here]
Table 2 provides an estimation of Channel 1 by product category. For each product,
we calculate the share of tradables, the average change in import penetration, the LWC
share in all imports and the price differential. The fourth column gives our estimation
of the individual product substitution effect. The largest effects are obtained for Cloth-
ing and Furnishings, being of −0.8 and −0.2 pp respectively. On the contrary, much
smaller effects are obtained for Recreation and Culture, Communication and other goods
and services. The last column reports the contribution of each product category to the
aggregate substitution effect (i.e. taking into account the share of each product category
in the CPI): 80% of the overall effect is due to Clothing and Furnishings (−0.04 pp out
of −0.05 pp for the overall effect).
[Insert Table 2 here]
4.2 Imported Inflation Channel
Imports from low-wage countries can affect French imported inflation if households replace
consumption of goods from HWCs by consumption of goods from LWCs and their price
levels are different, or if, for a given import structure, prices of goods from LWCs grow
16more slowly than other imports (or a combination of both). Figure 6 plots the share of
each origin in total imports. During the period under analysis, imports of consumption
goods continuously switched towards goods from LWCs and away from those from HWCs.
In 1994, high-wage countries accounted for around 76% of total French imports, declining
steadily to reach 57% in 2014. The main drivers of this increase in the share of LWCs
are China and the NEUMS.
[Insert Figure 6 here]
The inflation differential between HWC and LWC imports over the same period (see
Figure 7), was rather small, with the inflation rate of French imports from LWCs being
slightly higher than that of imports from HWCs.
[Insert Figure 7 here]
We decompose import price inflation into a “switching effect” and a “differential
inflation effect” using the formula of the Imported inflation channel in equation (4).
Import inflation increased by about 0.6% per year over the sample period, as shown in
Figure 7 (same annual growth rate of the import deflator from the National Accounts).
LWC imports had a strong negative contribution, close to −0.4 pp on average per year.
Figure 8 plots the two components of the imported inflation channel, the switching effect
in dark grey bars and the inflation differential effect in light grey bars. The overall
effect of LWC imports on French import inflation is the combination of a strong negative
switching effect of −0.47 pp on average, and a rather small positive impact of the inflation
differential of +0.06 pp. In other words, LWC imports gained market shares, depressing
import prices, in spite of the fact that prices of imports from LWCs increased a little
faster than those of goods imported from HWCs.
[Insert Figure 8 here]
17The negative contribution of the switching effect was strongest during 2000-2012
(−0.59 pp). It is also quite heterogeneous across groups of LWCs. Figure 9 plots the
contribution of each country category to the switching effect and shows that almost all of
variation is due to imports from China: −0.37 pp out of −0.47 pp per year on average.15
The contribution of NEUMS is about −0.08 pp and that of very low-wage countries and
intermediate low-wage countries around −0.01 pp.
[Insert Figure 9 here]
The contribution of the inflation differential is positive on average, but varies over
time. It was negative in the years at the beginning of the 2000’s (−0.24 pp on average
from 2001 to 2004), meaning that import prices from LWCs grew faster that those from
HWCs over that period. After the crisis, the inflation differential has been positive
and large from 2009 to 2012 (with a contribution of +0.30 pp per year on import price
inflation on average). The post-crisis positive effect is almost fully driven by Chinese
imports. Table 3 provides an international comparison of LWC contribution to import
inflation in several countries. All studies point to a negative effect of LWC imports on
import inflation, and of a magnitude which is very close to the one we obtain.
Eventually, the overall imported inflation channel is the sum of the switching effect
( ∂γ LW C HW C LW C HW C
∂t
t
(p t −p t ), −0.47 pp on average) and the inflation differential effect (γt π t − π t ,
+0.06 pp on average), weighted by the share of imports in domestic consumption (βt ηt ,
0.14 on average). We obtain that the contribution of the imported inflation channel to
CPI inflation is -0.06 pp (= 0.14 × [−0.47 + 0.06] = −0.06, see also Table 7).
Looking by products (Table 4), the imported inflation channel is at play in almost
all COICOP category except Food, Alcohol & Tobacco and Restaurants & Hotels. This
channel weighed down on consumer inflation everywhere but in Communication.
[Insert Table 4 here]
15
The highest values for the switching effects coincide with China’s entry in the WTO.
184.3 Competition Channel
Channel 3 transits through the pro-competitive effect of imports from LWCs. Trade
integration with low-wage countries implies an increase in competitive pressures that
might push domestic producers to lower their prices. In our framework, the impact of
changes in the rate of inflation of domestically-produced goods π D affects CPI inflation
through the term βt (1 − ηt )πtD in equation (4).
In this section we estimate the impact of LWC import penetration on sector-level
domestic producer price inflation. Our estimating equation is the following:
D LW C
πi,t = Ψ∆Si,t + κ∆labcosti,t + η∆inputcosti,t + λt + νi + i,t (6)
d
where πi,t is the log-difference of producer prices (domestic market) between year t − 1
LW C
and t for product i, ∆Si,t is the variation of the share of imports from LWC in domestic
consumption of good i, ∆labcost is the annual growth rate of labour cost in sector i and
∆inputcost the annual change in the intermediate input cost for sector i, λt is a time
fixed-effect and νi is a product fixed effect.
Ψ is our coefficient of interest. We expect Ψ < 0, implying that increases in the
market share of low-wage imports in sector i reduce domestic inflation. Notice that the
reduced-form equation (6) and the hypothesis Ψ < 0 are very general and arise in a
broad group of theoretical models of variable markups. In Appendix B, we describe in
more details a simple model that delivers this equilibrium relationship in the case of
oligopolistic competition between domestic and foreign producers.
We estimate equation (6) using data on producer price inflation at the 4-digit level of
the CPA classification from INSEE. LWC import penetration is defined as total imports
of country category divided by total imports plus French domestic production (excluding
LW C
Mi,t
production for exports): St (LW C) = Yi,t +Mi,t −Xi,t
, with Yi,t , Mi,t and Xi,t representing
sector i’s total domestic production, imports and exports. We measure imports with
19the trade data described in Section 3 and we obtain domestic production from Eurostat’s
PRODCOM survey. We concorde trade data at the HS 6-digit level to production data at
the CPA Rev2 level using a concordance table from the European Commission’s RAMON
website. We define St using imports from all LWCs and alternatively using imports from
China only. Following Auer and Fischer [2010] and Auer et al. [2013], the denominator
is averaged over the full sample to reduce concerns that results might be driven by the
responses of the French production to French prices.16 Annual change in total labor costs
and in intermediate input costs are calculated using sector-level data from STAN-OECD
Database (at level 2 of the NACE classification). These variables capture changes in
marginal costs.
OLS estimation of Ψ might suffer from endogeneity bias. Both domestic prices and im-
ports depend positively on (unobserved) demand shocks in France, which if present would
generate a positive correlation between both variables. Similarly, unobserved productiv-
ity shocks affecting French producers might lower prices and change demand towards
domestic goods and away from imports. Given these considerations, OLS estimations are
likely to provide upward-biased coefficients of the true effect of low-wage import penetra-
tion on domestic prices. To account for this potential bias we use instrumental variables
that generate variations in low-wage countries’ market shares while being exogenous to
movements in France’s demand and supply. We identify supply shocks in LWCs with the
year-on-year growth rate of manufacturing exports from each LWC to the world, exclud-
ing France, in the spirit of Autor et al. [2013]. As argued by Auer and Fischer [2010],
these supply shocks should have a relatively higher impact in sectors for which LWCs
have a comparative advantage with respect to France. This is captured with a measure
of each sector’s labor intensity. Thus, the instrument combines a variable that varies over
time with a time-invariant sector characteristic. Hence our instrumental variable varies
both over time and across products.
16
Results are similar if we relax this assumption.
20We estimate equation (6) with Panel IV 2SLS regressions. In all specifications, we
compute heteroskedasticity robust standard errors. Appendix C provides details on the
variables construction and reports the results of the first-stage regressions. In the first-
stage equation, our instrumental variable is significant at 1%-level for specifications using
all products whereas when restricting the sample to consumption goods or high-import
penetration sector estimated parameters are statistically significant at 5% or 10% level.
Our instrument also passes several tests of weak instrument when considering all prod-
ucts whereas when we restrict our sample to some product categeories we loose some
identification power.
[Insert Table 5 here]
[Insert Table 6 here]
Tables 5 and 6 report the results of both the OLS and IV regressions respectively for
CH
all LWCs, and restricting the import penetration variable to China only (i.e. ∆Si,t ).
Columns (1) and (2) use the full sample of 154 CPA products. An increase in the market
share of imports coming from LWCs has a small positive effect on domestic producer-price
inflation. Controlling for endogeneity, we find a strong negative effect of LWC import
penetration on producer price inflation. A 1% increase in the share of LWCs in any
given sector’s demand decreases domestic producer prices by 1.2%, an effect statistically
significant at 5%. Auer et al. [2013] report very similar magnitudes for France (between
−1 and −2.7%). The regression using only China provides a negative but non-significant
OLS estimates. Like for LWC, the negative effect is highly amplified in the IV regressions:
a 1%-increase in Chinese import penetration leads to lower domestic inflation by 1.9 pp.
Notice that IV estimates are also much less precise.
In columns (3) and (4) we restrict the sample to consumption goods (that is, those
that can be matched with COICOP, in a similar vein as described in Section 3). The
elasticity of French PPI to import penetration is estimated at −0.8 for all LWCs and
21−1.1 in the case of China only. The estimates are much noisier in the light of the smaller
sample size and become not significant. The last two columns of Tables 5 and 6 report
results where we restrict the sample to sectors with a high import penetration (larger
than 33%), obtaining qualitatively similar effects as with the full sample.
With the elasticities of import penetration to producer prices in hand, we are able
to quantify the total effect of the pro-competitive channel on French CPI inflation using
βt (1 − ηt )πtD . On average, 46% of CPI expenditures are in tradable goods, decomposing
into 32% of imported goods and 68% of domestically-produced goods. Thus, 32% (=0.46
× 0.68) of CPI consumption is produced by domestic firms whose price-setting behavior
is potentially affected by import competition. The average increase in LWC market share
over the sample period is 0.17 pp. Using the elasticity estimates obtained from the IV
regressions (on all goods, column 2),17 it gives a total effect of the Competition channel of
0.06 pp (= −1.2 × 0.17 × 0.32). Using the elasticity obtained from the IV regressions with
only consumption goods, the total contribution of Channel 3 is around -0.04. However,
we should point out that our elasticities are estimated with some degree of imprecision. If
we take the boundaries of the 90% confidence interval of our parameter estimates for all
goods, the total contribution of Channel 3 would be between -0.01 and -0.12 pp. When
looking at the effect of China alone, the average change in import penetration is a bit
smaller (less than 0.1 pp per year) but the impact on producer price inflation is a little
higher (1.9), leading to an overall effect of a little more than 0.02 pp on CPI inflation
(= −1.9 × 0.1 × 0.32).
5 Conclusion
We can now provide our estimate of the total effect of LWC imports on CPI inflation in
France during 1994-2014. It is the sum of the three channels as shown in equation (4).
17
We prefer this estimates to the one including only consumption goods because using the sample of
all goods allows us to have a better identification power. Moreover, estimates for all goods or restricting
to consumption goods are not statistically different.
22The Substitution Channel, which transits through the changes in consumption favoring
foreign goods, had a negative effect on French CPI inflation that we estimate to be of
0.05 pp on average. The Imported Inflation Channel, which quantifies the impact of
variations in the import price index arising from changes in the share of LWCs in total
imports, is estimated to have reduced French import inflation by −0.4 pp, resulting in
a negative impact of −0.06 pp on average on CPI inflation. Finally, the Competition
Channel, which measures the impact on the CPI that is due to the local producers’ price
responses to increased competitive pressures from LWCs, is estimated to have had a
negative impact on CPI inflation of about −0.06 pp. Therefore, the main result provided
by our analysis is that, during 1994-2014, LWC imports have contributed negatively to
the evolution of French CPI inflation, by about −0.17 pp per year on average. Put
differently, our estimations imply that had the imports from LWCs remained at their
1994 level, French inflation would have been 0.17 pp higher per year on average during
the 20 years that followed.
Among LWCs, China clearly stands out. Imports from China increased from 7%
to almost 21% of total French imports of consumption goods. In terms of share in total
French consumption, they passed from 0.7% to 3.5% over the same period. Table 7 shows
the calculations of the different channels for China alone. The total effect is estimated
to be −0.10 pp, therefore explaining more than half of the overall effect of LWCs. The
raise of China as a mega-trader has been widely documented, and France is no exception
to the Chinese dominance of international trade during the past decades.
Over the period 1994-2014, the total effect of LWC imports on CPI inflation has been
somewhat higher since the beginning of 2000s. On average, the overall effect is a little
smaller than −0.10 pp before 2002 whereas it is closer to −0.20 pp after. This comes in
particular from a higher effect transiting through the modification of structure by country
origin of our imports (channel 2).
It is worth noting that, by focusing on year-to-year changes, the estimates we provide
23are to be interpreted as an average of successive short-run effects. Our estimations do
not take into account possible effects on the prices of non-tradables resulting from income
effects due to cheaper tradable goods. Neither do we measure changes in labor and wages
that might result from openness to international trade in the long run, nor reaction of
monetary policy. Estimation of such general equilibrium effects would require a structural
macro model, which is left for future research. This work focuses solely on quantifying the
short-run direct impact on consumer prices, which we believe can be useful for guiding
monetary policy decisions. In the long run, appropriate adjustments in monetary policy
should ensure that inflation goes back to the target.
24References
Amiti, Mary, Mi Dai, Robert C. Feenstra, and John Romalis, “How Did Chinas
WTO Entry Benefit U.S. Consumers?,” NBER Working Papers 23487, National Bureau
of Economic Research, Inc June 2017.
Andrieux, Virginie and Aurelien d’Isanto, “Des marges commerciales variees selon
les produits, mais proches entre grandes surfaces,” Insee Focus, n45, Insee 2015.
Atkeson, Andrew and Ariel Burstein, “Pricing-to-Market, Trade Costs, and Inter-
national Relative Prices,” American Economic Review, December 2008, 98 (5), 1998–
2031.
Auer, Raphael A. and Andreas M. Fischer, “The effect of low-wage import com-
petition on U.S. inflationary pressure,” Journal of Monetary Economics, 2010, 57 (4),
491–503.
, Katrin Degen, and Andreas M. Fischer, “Low-Wage Import Competition, In-
flationary Pressure, and Industry Dynamics in Europe,” European Economic Review,
2013, 59, 141–166.
Autor, David H., David Dorn, and Gordon H. Hanson, “The China Syndrome:
Local Labor Market Effects of Import Competition in the United States,” American
Economic Review, October 2013, 103 (6), 2121–68.
Bai, Liang and Sebastian Stumpner, “,” Mimeo, University of Edinburgh. 2017.
Bank of Finland, “Finnish Import Prices and Globalization,” Monthly Bulletin 3, Bank
of Finland 2006.
Berlingieri, Giuseppe, Holger Breinlich, and Swati Dhingra, “The Impact of
Trade Agreements on Consumer Welfare,” CEPR Discussion Papers 11148, C.E.P.R.
Discussion Papers March 2016.
25Bernard, Andrew B., Bardford Jensen, and Peter K. Schott, “Survival of the best
fit: Exposure to low-wage countries and the (uneven) growth of U.S. manufacturing
plants,” Journal of International Economics, 2006, 68 (1), 219–237.
Bugamelli, Matteo, Silvia Fabiani, and Enrico Sette, “The Age of the Dragon:
The Effect of Imports from China on Firm-Level Prices,” Journal of Money, Credit
and Banking, 09 2015, 47 (6), 1091–1118.
Cardoso, Fatima and Paulo Soares Esteves, “The effects of Low-Cost Countries on
Portuguese Manufacturing Import Prices,” Working Paper 4, Banco de Portugal 2008.
Chen, Natalie, Jean Imbs, and Andrew Scott, “The dynamics of trade and com-
petition,” Journal of International Economics, February 2009, 77 (1), 50–62.
Coille, Conall Mac, “The impact of low-cost economies on UK import prices,” Quar-
terly Bulletin, Bank of England 2008.
De Loecker, Jan, Pinelopi K. Goldberg, Amit K. Khandelwal, and Nina Pavc-
nik, “Prices, Markups, and Trade Reform,” Econometrica, 2016, 84 (2), 445–510.
Emlinger, Charlotte and Lionel Fontagné, “(Not) Made in France ,” La lettre du
CEPII, 2013, 333, –.
Gamber, Edward N and Juann H Hung, “Has the Rise in Globalization Reduced
U.S. Inflation in the 1990s?,” Economic Inquiry, January 2001, 39 (1), 58–73.
Glatzer, Ernst, Ernest Gnan, and Maria Teresa Valderrama, “Globalization,
Import Prices and Producer Prices in Austria,” Monetary Policy & the Economy, 2006,
(3), 2443.
International Monetary Fund, “Export and Import Price Index Manual: Theory and
Practice,” [Washington, D.C.]: International Monetary Fund, 2009, 2009.
26You can also read


