A comparison of CO2-based car taxation in EU-28, Norway and Switzerland
←
→
Page content transcription
If your browser does not render page correctly, please read the page content below

Report for Transport & Environment

  Fair & Low Carbon Vehicle Taxation in Europe

  A comparison of CO2-based car
  taxation in EU-28, Norway and
  Switzerland

Matthias Runkel, Alexander Mahler,
assisted by Ann-Cathrin Beermann and Annina
Hittmeyer November 2018

Forum Ökologisch-Soziale Marktwirtschaft e.V. • Green Budget Germany
Publication date: November 2018

Imprint
Forum Ökologisch-Soziale Marktwirtschaft (FÖS) / Green Budget Germany (GBG)
Schwedenstraße 15a
13357 Berlin, Germany

Tel +49 (0) 30 76 23 991 30
Fax +49 (0) 30 76 23 991 59
www.foes.de foes@foes.de

About FÖS/GBG
Forum Ökologisch-Soziale Marktwirtschaft / Green                       unions for its expertise in fiscal instruments, environ-
Budget Germany (FÖS/GBG) has been researching                          mental and climate policy and foremost for its capacity
and disseminating information about the potential                      to evaluate and develop policy proposals in the field of
and benefits of environmental fiscal reform (EFR), the                 EFR. Over the last years GBG has led and participated
application of market-based instruments (MBI) and                      in numerous research projects and has a proven track
the removal of environmentally harmful subsidies for                   record in the development, analysis and evaluation of
more than twenty years. GBG is widely recognized                       environmental policies.
among policy-makers, NGOs, companies and trade

Picture Credits
Foto Coverpage: © digitalstock - Fotolia.com

Forum Ökologisch-Soziale Marktwirtschaft e.V. • Green Budget Germany
Fair & Low Carbon Vehicle Taxation in Europe                                                      3 / 24

Fair & Low Carbon Vehicle Taxation in Europe

           ...................................................................................................................................................................................

                         ....................................................................................................................................................................

                                                       ..........................................................................................................................................
                                                                     ......................................................................................................................................................
                                                   ........................................................................................................................................................................
                                                        ................................................................................................................................................................
                                ........................................................................................................................................................................................
                                  .........................................................................................................................................................
                                                                        ................................................................................................................................................
                                           .............................................................................................................................................................................
                         .................................................................................................................................................................
                                                          .............................................................................................................................................................
                                                              .........................................................................................................................................................
                                       ................................................................................................................................................................................
                                                    ..........................................................................................................................................

            ..............................................................................................................................................................................

                                       .....................................................................................................................................................

                                  .........................................................................................................................................................

ABSTRACT
                                                                                             passenger cars and to
make real progress regarding the actual emissions of the road transport sector, European countries have to im-
prove and sharpen their policy instruments at hand. There is plenty of room to align the fiscal incentive scheme
with climate and environmental policy goals by using the available vehicle and related taxes much more efficiently.
Looking at the 28 European member countries plus Norway and Switzerland, many cases of well-designed and
effective vehicle taxation are available. This paper compares the different tax systems and derives several policy
recommendations. For eight countries (Belgium, France, Germany, Italy, Netherlands, Portugal, Spain, and United
Kingdom), a more detailed comparison along four example vehicles was conducted and a ranking was compiled.
The first chapter takes a look at the progress made so far. Some countries have reduced average emission values
substantially, but the growing gap between these type-approval and real-world values is alarming and has some
serious implications for climate policy, CO2-based vehicle taxation and tax revenues, consumers and manufactur-
ers. The second chapter gives a broad overview over vehicle taxation in all countries under consideration, focusing
on their CO2-based components, and looks at each tax in more depth in the subsections. Chapter 3 gives a sys-
tematic comparison of the different tax systems by calculating and comparing actual tax amounts for a selection of
eight countries. Some noteworthy examples of good and bad practice are highlighted in chapter 4. The last chap-
ter derives several policy recommendations regarding the use and design of vehicle taxes.

Forum Ökologisch-Soziale Marktwirtschaft e.V. • Green Budget Germany
Fair & Low Carbon Vehicle Taxation in Europe 4 / 24
155
1 Introduction target of 95 gCO2/km (EU average) will be reached.
135
Also, most of the progress made so far only exists
The European Union has set mandatory emission on paper. The CO2 emission values, which are
reduction targets for new vehicles in order to im- measured on the test stand have been diverging
prove fuel economy and reduce the total CO2 emis- from real-world values. The gap between both val-
115
sions of the road transport sector in Europe. By 2021, ues widened quickly from 14% in 2006 to 42% in
the EU-wide fleet value for passenger cars has to be 2016 (ICCT/TNO 2017). This implies that the reduc-
reduced to 95 grams of CO2 per kilometre tion of CO2 emission values has had a much weaker
(gCO2/km). For the years until 2030, the European
95
impact in terms of actual CO2 emissions from the
Denmark
Czech Republic
Norway
Portugal
Croatia
Belgium
Bulgaria
United Kingdom
Austria
Netherlands
Malta
Germany
Poland
Lithuania
France
Slovenia
Italy
Spain
Romania
Luxembourg
Slovakia
Hungary
Greece
Ireland
Finland
Cyprus
Sweden
Commission propose that average CO2 emissions road sector. It is also undermining the policy efforts
will have to be 37.5% lower compared to 2021. The of CO2-based taxation.
intermediate target is to reduce emissions by 15%
until 2025. The 95g target thus applies until and Figure 1: Average CO2 emissions from new
including 2024. passenger cars by year of registration
(2006-2016)
Some progress has been made since regulation
443/2009 of the European Parliament setting emis- 2016 2015 2012 2010 2008 2006
sion performance standards for new passenger cars gCO2/km
was adopted in 2009. Figure 1 shows that all 95 125 155 185
28 EU member countries plus Norway and Switzer- Norway
land have been moving towards the target.
Netherlands
The largest change (-65.5 g/km) can be seen in
Portugal
Sweden. The country started from the last place
though, and it is still far behind countries like Norway Denmark
or the Netherlands. A very high share of battery Greece
electric and plug-in hybrid vehicles (29% of passen- France
ger car registrations in 2016) is one reason for Nor-
Croatia
2 emissions. The Nether-
lands achieved their progress with fewer electric Malta
vehicles (6%). Denmark and Portugal, too, have very Ireland
low emission values despite a very low electric share Italy
(Fair & Low Carbon Vehicle Taxation in Europe 5 / 24
The CO2 Emissions Gap 2 Vehicle Taxation in Europe
As mentioned before, the gap between type- The most relevant taxes for buyers, owners or users
approval and real-world CO2 emission values for of passenger cars are value added taxes (VAT), addi-
passenger cars has widened to around 42% in 2016 tional sales or registrations taxes, periodical taxes on
(ICCT/TNO 2017). The enormous gap is a serious ownership like annual vehicle taxes, fuel taxes as well
problem for many reasons as income tax on the use of company cars. They have
reduction targets are diluted, if the reductions on a significant impact on the total costs of ownership
the test stand have only limited impact on real-world and thus determine, depending on their design,
emissions. consumer choices.
Secondly, CO2-based vehicle taxation is losing its Table 1 on page 6 gives an overview of passenger car
effectiveness and efficiency, because the tax base is taxation in the EU28, Norway and Switzerland. In
extremely distorted. The emissions gap is impairing recent years, many countries have adopted taxes or
tax components based on CO2 emissions or, equiva-
revenues (FÖS 2018). The following chapters show lently, fuel consumption (bold and highlighted in
that most European countries have implemented grey).
CO2-based car taxation elements over the last two All countries under consideration have value added
decades. Such climate policy efforts require reliable taxes,
emission values safeguarded by a rigorous regulato- there are exemptions or special regulations in some
ry framework and realistic test procedures. states, especially for electric vehicles. For example,
Beyond the political dimension, unreliable CO2 electric vehicles are required to pay neither VAT nor
emission values are also detrimental to consumers registration tax in Norway (Norwegian Customs
and car manufacturers (ICCT 2016). Consumers 2018), which is a huge financial advantage. Applica-
base their buying decisions on unreliable fuel con- ble VAT rates vary widely between countries. For EU
sumption values, which are equivalent to CO2 values member states, the legal minimum VAT rate is 15%.
and bear unexpected running costs in the future. At Most European countries impose one-off taxes on
the same time, manufacturers are competing on a the acquisition of cars (e.g. registration tax, sales tax;
heavily distorted market, focusing on the test stand see chapter 2.1) and periodical taxes on ownership
rather than the real world. Manufacturers with more (e.g. road tax, motor vehicle tax; see chapter 2.2).
realistic values suffer a disadvantage on many di- These taxes are usually based on car characteristics
mensions. Their cars appear more climate-damaging like weight, cylinder capacity, fuel consumption or
on paper and they are taxed at higher rates, if taxa- CO2 emissions. In most cases CO2-based tax com-
tion is based on CO2. ponents have been introduced within the last two
The introduction of the Worldwide harmonized decades. Taxes that are (partly) based on CO2 are
Light vehicles Test Procedure (WLTP) in 2017 will highlighted in Table 1.
reduce the emissions gap to some extent. But it will Only few countries have introduced CO2-related
not close it entirely. Stewart et al. (2015) estimate for elements in the taxation of company cars. The pri-
the United Kingdom that the WLTP will reduce the vate use is usually taxed as income, based on a per-
gap to the still very large number of 23% in 2020,
and they expect it to rise again in the following years. pany cars is described in more detail in chapter 2.3.
Like VAT, fuel taxes are one of the most common
taxes across countries. Taxes on gasoline, diesel etc.
are imposed in all thirty countries under considera-
tion. For EU member states, minimum rates are
applicable, but the taxed rates above the minimum
vary widely. The taxation of fuels, especially alterna-
tive fuels like electricity, is neither coherent between
nor within most countries. This creates incoherent
price structures, which often benefits diesel. The
taxation of fuels is looked at in chapter 2.4.
Forum Ökologisch-Soziale Marktwirtschaft e.V. • Green Budget GermanyFair & Low Carbon Vehicle Taxation in Europe 6 / 24
Table 1: Passenger car taxation in EU28 + NO, CH (CO2- and fuel consumption related taxes highlighted)
Country VAT Registration/Purchase Ownership Use of company car (taxable benefit)
Price, CO2 emissions, fuel 18% (per year) of cost price (24% for cars above
Austria 20%
type, CO2-based malus
Engine power
CO2 threshold); maximum rates apply
4-18% (per year) of list price depending on CO2
CO2 emissions, Cylinder CO2 emissions, and fuel type times 6/7 and age-based correc-
Belgium 21%
capacity, age, regions cylinder capacity tion; CO2-based
Taxed as a benefit or companies pay 10% of
Bulgaria 20% - Engine power related costs
Croatia 25% CO2 emissions, fuel type Engine power, age No information
CO2 emissions, cylinder No information
Cyprus 19%
capacity
CO2 emissions
Czech 12% (per year) of the actual purchase price
21% - Engine size
Republic
25% (per year) of the value of the car price up to
Fuel consumption, safety Fuel consumption, DKK 300,000; 20% of the rest; environmental
Denmark 25%
equipment weight
based on fuel consumption
From 2018, benefit based on vehicle capacity
Estonia 20% - - and age (regular rate ,
vehicles older than 5 years)
CO2 emissions, 10.8-16.8% (per year) of cost price or 17-19
Finland 24% CO2 emissions, price
weight x days cent/km depending on year of first registration
9% (per year) of cost price; 12% if employer pays
CO2 based Bonus-Malus fuel; the rate is reduced by 3% points if the car is
France 20%
system
CO2 emissions
older than 5y
CO2 emissions and 12% (per year) of list price plus factor based on
Germany 19% -
cylinder capacity commuting distance
CO2 emissions or 4%-22% (per year) of net retail price (rate in-
Greece 24% CO2 emissions, price
cylinder capacity creases with price)
Taxable benefit based on engine power (in kW);
Hungary 27% Age, cylinder capacity Age motor vehicle tax is deductible
6-40% (per year) of original market value de-
Ireland 23% CO2 emissions, price CO2 emissions pending on CO2 thresholds and business mile-
age (not yet operational)
30% of 15,000km per year are assumed to be
for personal use and taxed at a rate per kilome-
Italy 22% Kilowatt, weight, seats Engine power ter determined by the Italian Automobile Club
(ACI)
Weight, cylinder - (per year) depending on cylinder
Latvia 21% Weight, fuel type
cap., engine power capacity
Lithuania 21% - - No information
CO2 emissions or 6-21.6% (per year) depending on fuel type and
Luxembourg 17% -
cylinder capacity CO2 emissions
CO2 emissions, price, CO2 emissions, 22% (per year) of list price (if private use
Malta 18%
vehicle length vehicle age >500km/year), 4% for zero emission cars
CO2 emissions, Taxable benefits (per year): 0-35% (per year) of
CO2 emissions, fuel effi- list price depending on CO2 emissions, fuel
Netherlands 21%
ciency
weight, province,
fuel type and age
3,000-4,800 PLN (per year) depending on
Poland 23% Cylinder capacity - cylinder capacity
CO2 emissions, cylinder CO2 emissions and 0-20% (per year) depending on purchase price
Portugal 23%
capacity cylinder capacity and fuel type
CO2 emissions, cylinder No information
Romania 19%
capacity, exhaust emissions
Cylinder capacity
Slovakia 20% Engine power, age Cylinder capacity 12% (per year) of cost price
Slovenia 22% CO2 emissions, price Cylinder capacity 18% (per year) of cost price
20% (per year) of cost price; reduction if low
Spain 21% CO2 emissions, price Engine rating private use; since 2016, reduction for alternative
vehicles (incl. Euro 6)
9% (per year) of list price + additional compo-
CO2 emissions, nents based i.a. on interest rate; reductions for
Sweden 25% -
weight apply
Forum Ökologisch-Soziale Marktwirtschaft e.V. • Green Budget GermanyFair & Low Carbon Vehicle Taxation in Europe 7 / 24
Country VAT Registration/Purchase Ownership Use of company car (taxable benefit)
By fuel since 2018; 37% (per year) of list price if income is >£8,500
United - (CO2-based CO2 emissions, per annum; discounts based on CO2 emissions
20%
Kingdom cylinder capacity and fuel type
until 2017
Motor vehicle tax
CO2 emissions, weight, replaced by 30% (per year) of list price; reductions for elec-
Norway 25%
exhaust emissions, fuel type in tric cars
2018
Engine power,
7,7% 9.6% (per year) of cost price excl. VAT
Switzerland +4%1
- cylinder capacity,
weight, fuel
Source: based on ACEA (2016), ACEA (2017a), complementary information from 1Office (2017), Corporate Vehicle Observatory (2016), Deloitte
(2016), Harding (2014), Kuljus (2017), Trafikkforsikringsforeningen (2017)
1
The Swiss car tax amounts to 4% of the imported car value (ACEA 2017a). It is a tax on the acquisition of a car, but is more similar to VAT than other
registration/purchase taxes in all other countries.
Forum Ökologisch-Soziale Marktwirtschaft e.V. • Green Budget GermanyFair & Low Carbon Vehicle Taxation in Europe 8 / 24
Registration/purchase taxes
Taxes on the registration or acquisition of 4vehicles Figure 2: Registration taxes and average CO2
are often found to be a very effective instrument in emissions in 2015
terms of CO2 reductions (see e.g. Adamou 3 et al. no registration tax
(2014), Brand et al. (2013), 2
(2014), Gerlagh et al. (2016), Kok (2015)). The addi- CO2- or fuel consumption based
1 fiscal
tional upfront costs are a clear price signal and based on other characteristic
incentive to the buyer. 0 (e.g. age, weight, cylinder capacity)
The effectiveness, of course, depends on the tax 1 2 g CO2/km
design, most importantly the tax amount. In contrast 95 105 115 125 135
to annual vehicle or fuel taxes, which incur over an Norway 100.5
indefinite time horizon and are likely to change, one- Netherlands
off taxes upon registration are much easier to take Portugal
into consideration when buying a car. Denmark
It is therefore not surprising that countries with Greece
CO2-based taxes on registration or purchase tend France 111.0
to have lower average CO2 emission values. Figure Croatia
2 shows all thirty countries ranked by their average Malta
CO2 value for new passenger car registrations in Ireland
2015. There is a clear distinction between countries Italy
with CO2-related taxation (green) and countries Spain 115.3
with no (grey) or different tax systems (blue) with Belgium
the exception of Italy. Other tax bases like engine Slovenia
power or weight correlate only roughly with CO2 and United Kingdom *
are thus less accurate. Finland
Of course, Figure 2 does not imply causality, but it Austria 123.7
supports the scientific findings that well-designed Romania
taxes upon acquisition can be an important cli- Cyprus
mate policy instrument. Czech Republic
Sweden
It is worth mentioning that there are important dif-
Luxembourg 127.5
ferences within the group of countries with CO2-
Slovakia
related taxation. The Netherlands, Denmark and
Germany
France, for instance, have very high fiscal incentives.
Poland
The bonus-malus system in France not only punish-
Hungary
es the purchase of high-emission vehicles, but also
Lithuania 130.0
grants premiums for low-emission vehicles. The
Bulgaria
state-induced cost incentives between low- and
Switzerland
high-emission vehicles can easily amount to several
Latvia
thousand euros, which is usually a relevant fraction
Estonia 137.2
of the vehicl .
The effectiveness of a tax clearly depends on its * The vehicle excise duty (VED) in the United Kingdom is a periodi-
design. A CO2-related but weak tax may not have cal tax levied on car ownership. Its first year rates, however,
any significant impact at all. Several important de- are different from the standard rates; they have the effect
of an implicit registration tax.
sign elements to consider are described in the case
Source: based on ACEA (2017a), Eurostat (2017), FleetNews (2016),
studies in chapter 4. Statista (2017)
Despite their effectiveness, several countries, in-
cluding Sweden, Germany, Luxembourg and Swit-
zerland, do not impose any registration tax at all. This
may partly explain their rather high CO2 values.
Almost all European countries subsidize the pur-
chase of electric vehicles (see e.g. European Envi-
ronment Agency 2016). These subsidies are often,
but not always, implemented as an exemption from
registration taxes.
Forum Ökologisch-Soziale Marktwirtschaft e.V. • Green Budget GermanyFair & Low Carbon Vehicle Taxation in Europe 9 / 24
Taxes on ownership The CO2-
above 95 g/km) creates a clear incentive for con-
Vehicle ownership (including leased cars) is usually ventional cars, but cannot be applied to electric
taxed on a periodical, often annual basis. The most vehicles. The tax rate for cylinder capacity differs for
common tax bases are engine power, engine size or gasoline and diesel ( 2 and 9.50 for every 100 cc,
cylinder capacity (e.g. in horse power or cc) and CO2 respectively). Since Germany does not have a target
emissions. In Germany, for example, the annual to reduce cc, this distinction is not purposeful and
motor vehicle tax is based on cylinder capacity, dif- distorts competition. Cylinder capacity is not a good
ferentiated by diesel and gasoline, and type- indicator for engine performance, which could be a
approval CO2 emissions. Every additional gram of more suitable tax base. It also cannot be applied to
CO2 above 95 is taxed at two euros. electric vehicles. These are instead taxed based on
Taxes on ownership are less effective than regis- their total permitted weight.
tration taxes regarding the reduction of CO2 emis- The German motor vehicle tax is not technology-
sion values (see e.g. Alberini/Bareit (2017), Gerlagh neutral and creates contradicting tax incentives. The
et al. (2016), Malina (2016)). The financial implica- cc and weight components do not follow a clear
tions of the recurring tax are harder to evaluate in political goal and are not applied consistently. The
advance, among other things, because the holding CO2 component has a political goal, but cannot be
period is uncertain and tax laws may change. In applied uniformly across all vehicle types. A more
many cases, CO2 is only one of several tax compo- coherent, goal-oriented and accurate taxation of
nents. The financial advantage of buying a low- conventional and alternative vehicles is desirable.
emission vehicle is less clear. Consumers are thus
less sensitive to ownership taxes than to one-off Table 2: Motor vehicle tax examples for Germany
registration taxes with a clear price signal. The im- VW Golf VII (2017)
pact on the buying decision is hence rather low. 1.0 TSI
Attributes BMT e-Golf GTD
Ownership taxes, like registration taxes, also do not
affect usage. The tax is independent of actual kilo- Fuel type
metres driven or litres of fuel consumed, so there is cubic capacity (cc) -
no impact on actual emissions of CO2. The instru- gCO2/km
ment is not suited to address neither average CO2 kilowatt
emission values nor actual CO2 emissions. horsepower, PS
Perm. weight, kg
Despite the lower environmental effectivity, many
list price,
countries have adopted CO2-based ownership taxes
Motor vehicle tax,
(see Table 1). The periodical taxes generate a con-
annual tax amount
stant stream of revenues,
does not change quickly. The predictability is of By tax component
course a great advantage CO2 -
Most European countries subsidize the ownership of cc -
electric vehicles (see e.g. European Environment weight - -
Agency 2016). These subsidies are often imple- Sources: ADAC Autodatenbank for attributes. Own calculations
mented as an exemption from motor vehicle taxes. 1
Electric cars have zero CO2 emission in use, but the generation of
electricity may be accompanied by high emissions de-
This is the case for example in Germany. The CO2-
pending on the energy source.
and cc-based annual tax does not apply to electric 2
Electric vehicles are exempted from the motor vehicle tax for the
vehicles. Instead, EVs, which are usually heavier than first five years after registration.
comparable conventional cars without battery, are
taxed based on their total permitted weight, like Other countries, of course, face the same problem.
trucks. There is however a temporary tax exemption In many cases, battery electric vehicles (BEV) are
for the first five years after registration. simply exempted from taxation. Under CO2-based
The case of Germany illustrates that many vehicle taxation the tax amount often just turns out to be
taxes in Europe are not yet aligned with recent zero. In Spain, annual ownership taxes are based on
technological developments. Often, there is no a calculated engine rating, which leads to unfavour-
logic in the taxation of alternative technologies. able tax rates for electric vehicles. In most regions,
Table 2 shows three variations of a 2017 VW Golf VII tax rates for BEV are therefore reduced by 75%. In
(diesel, electric and gasoline), the main vehicle at- the case of a Renault Zoe, the annual tax amounts to
tributes and the corresponding tax amounts. The Annex A). Tax rates are however generally
three examples demonstrate the incoherencies in very low, so that the Spanish tax on car ownership is
German motor vehicle taxation. unlikely to have any incentivizing effect.
Forum Ökologisch-Soziale Marktwirtschaft e.V. • Green Budget GermanyFair & Low Carbon Vehicle Taxation in Europe 10 / 24
Company car taxation In Belgium, the applicable rate is determined by a
formula that is linearly increasing with CO2. The
The use of a company car for private purposes with-
resulting rates, which are applied to the list price and
out reimbursement is defined as a benefit in kind
an age correction factor, are rather low. The tax
(BIK) that has to be added to the taxable income of
incentive is thus weak despite its dynamic tax de-
the beneficent. In most European countries, the BIK
sign. According to own calculations, the rate is ap-
is calculated as list or cost
proximately 5% at 90 gCO2/km and 14.4% at 199 g.
price (see also Table 1). But the real financial benefit
of privately using a company car often exceeds the One result of the high subsidization is the high and
BIK by far, which constitutes a subsidy to the em- rising share of commercially registered passenger
ployee (as well as the use of a car instead of other cars. In Germany, for example, 65% of all new pas-
modes of transportation). The subsidy dispropor- senger cars in 2016 were registered by companies.
tionally benefits people with higher incomes and Not all of them are also used privately though (e.g.
encourages the purchase and use of larger, more rental cars or cars registered by dealers). The share
expensive cars (Damert/Rudolph 2018; Jacob et al. for top-end vehicles, which are often heavier and
2016). Studies in different countries show that the less fuel efficient, is even higher: 88% according to
undertaxation of company cars also causes employ- UBA (2014).
ees to make use of it more excessively (Harding composition of new cars significantly. Via the sec-
2014). The privilege promotes car usage, aggravat- ond-hand market they also have a substantial long-
ing air pollution and CO2 emissions and should be lasting effect on the overall fleet (Jacob et al. 2016).
considered an environmentally harmful subsidy Taxation based on environmental aspects, e.g. fuel
(Princen (2017), UBA (2014)). efficiency, emissions or distance travelled for private
Figure 3 (Princen 2017) compares the level of subsi- purposes, would incentivize smaller, less environ-
dization among European countries. It shows the mentally harmful cars and less car use. It could have
percentage gap between the company cost of long lasting positive effects, as observed in the UK
providing a car and the taxable benefit of using a car. when the company car tax bill was reformed. Taxa-
This indicator shows that company cars appear to be tion is now based on CO2 emission value, and
undertaxed in all countries. The size of the gap is company car drivers have been choosing cars with
however very different. The gap amounts to around lower values since the reform (Her Majesty´s Reve-
35% in Bulgaria, because, among other things, the nue and Customs (HMRC) 2006). The number of
flat rate for calculating the BIK is only 10% (see Table registered company cars also declined: by 250,000
1). On the other end of the spectrum, the rate in between 2001 and 2003 (ibid.). The reform was a
Ireland ranges from 5-30% depending on busi- main reason for employers and employees to give up
ness/private mileages. In the future, the system will their company cars (ibid.). Additionally, a change in
also take into account CO2 emissions and the rate the taxation of free fuel for private use made it less
will range from 6-40% (ACEA 2017a). attractive to grant this incentive, resulting in a re-
duction of private mileage driven in company cars
Figure 3: Subsidy for private use of company cars (ibid.).
Similar effects were observed in the Netherlands,
where a tax reform towards a CO2-based system,
including company car taxation, resulted in a de-
~21% crease of 11% average CO2 emissions (13 g/km) and a
higher share of electric vehicles (Kok 2015). The
subsidization of company cars is also among the
lowest in EU countries (see Figure 3).
The subsidy is calculated as the percentage gap between the
company cost of providing a car and the taxable benefit of
using a car.
Source: Princen (2017)
Forum Ökologisch-Soziale Marktwirtschaft e.V. • Green Budget Germany20
0 1
0100
Fair & Low Carbon Vehicle Taxation in Europe 11 / 24
Netherlands
Denmark
Portugal
Austria
Spain
Hungary
Switzerland
Czech Republic
Estonia
Bulgaria
United Kingdom
Portugal
Belgium
Denmark
Norway
Croatia
Austria
Germany
Malta
Lithuania
Italy
Latvia
Poland
Netherlands
France
Slovenia
Slovakia
Luxembourg
Spain
Hungary
Romania
Finland
Greece
Switzerland
Ireland
Cyprus
Sweden
Fuel taxes
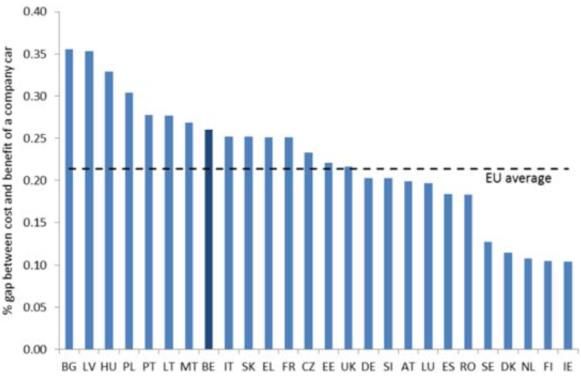
While registration taxes, ownership taxes, etc. ad- Figure 4: Diesel and petrol tax rates, in
dress efficiency of the vehicle itself, fuel taxes ad- Euro/1000 liter; diesel share in new car
dress the demand for fuel directly and thus actual 0registrations in 2016 Tax Gap
CO2 emissions. Every litre of fossil fuel contains a
Diesel Unleaded Petrol
certain amount of carbon dioxide and a tax puts a
price on every gram emitted. Fuel taxes are hence Diesel min rate Petrol min rate
most suitable to internalize climate costs. 0 Tax Gap
Fuel taxes are imposed in all countries under con- Diesel Petrol
0 200 400 600 800
sideration, and the EU Energy Tax Directive provides EU minDiesel share
EU min
minimum rates for member countries. Tax rates vary Netherlands 19%
considerably between countries and fuels though. In
Italy 57%
particular, diesel is taxed at a lower rate than gaso-
line in most countries (see Figure 4), although it has Finland 32%
a considerably higher energy and carbon content. It Greece 55%
has to be taken into account though that the differ-
United Kingdom 48%
ent VAT rates across countries multiply the effect on
final fuel prices at the gas station. Sweden¹ 52%
Well-designed energy taxation should be based on Portugal 66%
the principle of equivalence, i.e. fuels should be Switzerland 40%
taxed according to their energy and/or carbon con-
Germany 45%
tent (see e.g. FÖS/IKEM 2016, Transport & Envi-
ronment 2017). This implies that diesel should be France 54%
taxed at a higher rate than gasoline. The current Belgium 52%
system thus, grants diesel an unjustified cost
Ireland 70%
advantage, which in turn increases demand for
and production of diesel cars. Denmark 36%
A removal of the tax gap has been called for by many Malta 36%
actors (e.g. European Commission 2011, OECD Norway 31%
2012) and several European countries have started
Croatia 60%
reducing the gap (see e.g. Damert/Rudolph 2018) or
announced to so, like Belgium and France. Slovakia 42%
Additionally, tax rates should be harmonized in or- Slovenia 50%
der to restrict tax competition between countries Austria 57%
and avoid a race to the bottom. Lower rates in cen-
Cyprus 43%
trally located countries like Luxembourg attract
additional revenues from fuel tourism and they are a Czech Republic 42%
challenge to neighbouring countries that want to Estonia 27%
implement more progressive fuel taxation.
Luxembourg 65%
This chapter only looks at diesel and petrol, because
Spain 58%
they are still the most common types of fuel for pas-
senger cars. The taxation of electricity is not yet Latvia 40%
adapted to the electrification of transport and a Lithuania 41%
consistent comparison between countries is difficult.
Poland 30%
Tax rates vary even more widely and are often de-
pending on the charging location or the consumer. Hungary 36%
In most countries, electricity is taxed at much lower Romania 51%
rates than conventional fuels, because, among other
Bulgaria 49%
things, they are not intended to contribute to road
financing. In the long term, the electrisation of
Source: graph based on ACEA (2017a), Federal Customs Admin-
transport necessitates new road financing models
istration (2017), The Norwegian Tax Administration (2016);
like intelligent road pricing. diesel share calculated using EEA (2017) data
1
Includes a tax on CO2
Forum Ökologisch-Soziale Marktwirtschaft e.V. • Green Budget GermanyFair & Low Carbon Vehicle Taxation in Europe 12 / 24
3 Country Ranking system seems to have a positive effect on average
CO2 emission values, which are among the lowest in
Chapter 3 looks at a selection of eight countries and the EU28. On the downside, the Netherlands have
gives a systematic comparison of the different tax the largest gap in fuel taxation.
systems by calculating and comparing actual tax
Germany can be found at the bottom of the ranking.
amounts. The ranking is based on the total of the
In terms of taxation, buying, owning and fuelling a
four individual tax rankings. For each tax, countries
car (preferably a big diesel company car) is com-
were ranked according to the differential between
paratively cheap. The absence of any registration tax
the highest and the lowest tax amounts payable (or
is a wasted opportunity to incentivise a reduction in
taxable benefit-in-kind for company cars) for the
average CO2 emission values, which are among the
four vehicles under consideration. The ranking thus
highest in the EU28. Ownership taxes are CO2-
takes into account the level of taxation (as an indica-
based, but tax rates are too low to be effective.
tor of effectiveness) and the degree of differentia-
tion (as an indicator of efficiency). Portugal and the United Kingdom share the second
rank. The UK appears to score on the wrong taxes
The sum of all rankings is not weighted, although it is
though. Registration taxes in particular seem to be
obvious that some taxes are more important than
too low to be effective and the average emission
others. In particular, registration taxes and company
value (120.1 gCO2/km) is rather high.
car taxation appear to have a much higher impact on
buying behaviour than taxation of car ownership. It is
however difficult to justify specific weights that Country and vehicle selection
could be applied.
Tax amounts payable are calculated for eight coun-
The individual rankings are shown and explained in
tries (Belgium, France, Germany, Italy, Netherlands,
chapter 3.2.
Portugal, Spain, and United Kingdom) and four cars
Table 3: Country ranking of passenger car (see Table 4).
taxation in eight countries The countries chosen represent the seven largest
Ranking of tax system EU car markets (in terms of fleet size in 2016, exclud-
Ø ing Poland). The Netherlands are of particular inter-
gCO2/km est, because all taxes under consideration are di-
Country new reg- rectly or implicitly linked to CO2. Belgium is of par-
istrations ticular interest because of its company car market
2016
and the CO2-based taxation of company cars.
The cars were selected in order to cover a wide
Nether- range of tax-relevant vehicle characteristics with
lands
representative models from various segments. The
Portugal most relevant characteristic for this report is the CO2
United emission value (or equivalently fuel consumption).
Kingdom
Therefore, the Renault Zoe was chosen as the best-
Belgium
selling zero-emission vehicle (B-segment small cars).
Italy The VW Golf was chosen as the best-selling car in
France Europe (C-segment medium cars). The Audi A4 was
Spain chosen as a representative company car (diesel, D-
segment large cars). The Mercedes-Benz GLE350d
Germany
was chosen as a high-emission SUV (J-segment
Sources: ACEA (2017a, 2017b, 2018), Eurostat (Passenger cars by
sport utility cars).
age [road_eqs_carage])
The vehicle characteristics and assumptions pre-
The Netherlands are in the first place because of sented in Table 4 were used for the calculations of
their high and differentiated vehicle taxes. Registra- tax amounts payable. OEMs offer slightly different
tion as well as ownership taxes are high and (partly) vehicles in different countries. Characteristics were
based on CO2 emission values. Computation of the tried to match the car specifics as close as possible.
benefit-in-kind is also high and CO2-based. The tax
Forum Ökologisch-Soziale Marktwirtschaft e.V. • Green Budget GermanyFair & Low Carbon Vehicle Taxation in Europe 13 / 24
Table 4: Vehicle characteristics and assumptions
Renault VW Golf VII Audi A4 Mercedes-Benz
Zoe (R90) 1.0 TSI 2.0 TDI GLE350d
Euro market segment B small C medium D large J - SUV
Fuel type Electric Gasoline Diesel Diesel
Euro norm - Euro 6b Euro 6b Euro 6c
CO2 emissions (g/km) 0 109 109 199
List price incl. VAT (Euro)a 23,818 21,333 38,078 66,899
List price excl. VAT (Euro)a 19,771 17,709 31,609 55,543
Purchase price (assumption 10% off) 21,437 19,199 34,271 60,209
cc - 999 1,968 2,987
Empty weight (kg) 1,502 1,237 1,615 2,175
kW 68 81 110 190
kWh battery capacity 22 . . .
Assumed vehicle age 2.4 c 9.9 b
Assumed annual mileage (private use) 12305 km d
Average fuel/energy consumption per 100km 13,3kWh 4.8l 4.2l 7.5l
Annual fuel/energy consumption 1,729kWh 624l 546l 975l
Sources and explanations: a entry prices for basic models (i.e. without options) from national OEM websites weighted by fleet size in 2016 of eight
countries under consideration (Eurostat; road_eqs_carage); b average age of passenger cars in 2016 (ACEA 2018) weighted by fleet size); c
sales-weighted average age (2012-2017, worldwide); d M model) weighted by fleet size.
Tax calculations Figure 5: Registration tax payable (Euro)
The tax amounts payable for each car in each coun- Renault VW Audi Mercedes
try were calculated using information from the
40,000
ACEA Tax Guide 2017 (ACEA 2017a). In some cases
information was taken from additional sources. If
available, official tax calculators were used to con- 30,000
firm the calculations.
Registration taxes
20,000
As mentioned in chapter 2.1, registration taxes are
often found to be the most effective incentive in 10,000
terms of reduce the average CO2/km emission of car
fleets.Figure 5 shows the tax amount payable for the
0
four cars in all eight countries. The amounts differ
significantly between countries.
Taxation is very high in the Netherlands and Portu- -10,000
gal, especially for high-emission vehicles. Tax rates DE IT UK ES BE FR PT NL
are high and highly differentiated (by CO2). Germa- Source: own calculations
ny does not levy any registration tax. In Italy, tax
rates are very low with little differentiation. Also, the In Annex A (Table 7 on page 24) tax curves can be
tax is not based on CO2 but kilowatts. In the UK, tax found for six countries. The curves show how the
rates are highly differentiated but comparatively CO2-based tax component changes with every
low. g/km. The curves visualise the incentive structure of
The tax system in Spain appears ineffective. Due to the tax system with respect to CO2 emission values.
the very rough differentiation, only the Mercedes- To understand a tax incentive structure it is illumi-
Benz falls into the taxable region, which only starts at nating to look e.g. at the
120 gCO2/km. mum and maximum and its effective range. In the
case of France, for instance, the tax curve is very
Belgium and France have built their subsidisation of
steep, but only between 127 and 191 g/km. Below
BEV into their tax systems. Registration taxes are
and above these thresholds there is no additional
negative for such cars (Bonus-Malus-Schemes).
incentive to reduce emissions (except for additional
bonuses for low emission vehicles).
Forum Ökologisch-Soziale Marktwirtschaft e.V. • Green Budget GermanyFair & Low Carbon Vehicle Taxation in Europe 14 / 24
Periodical ownership taxes Figure 7: Fuel taxes payable
Ownership taxes are levied in all eight countries Renault VW Audi Mercedes
under consideration. They are generally much lower 700
than registration taxes (mind the different scale on
the y-axis in Figure 6). 600
Again, we see high and differentiated rates in the
500
Netherlands. for
passenger cars with more than 190 g/km. This only 400
affects the Mercedes-Benz here. It is unlikely that
such a tax has any effect on CO2 emission values. 300
The threshold at 190 g/km is way above the average
of 109.8 g/km for new passenger cars in France in 200
2016.
100
Figure 6: Ownership taxes payable (Euro)
Renault VW Audi Mercedes 0
3,000 NL ES DE PT BE FR IT UK
Source: own calculations assuming an annual mileage of 12,305km
values from Table 4.
2,500
Table 5 shows the total of registration, ownership
2,000
and fuel taxes in the first year of registration. Coun-
tries are sorted by the amount payable for the Mer-
1,500 cedes-Benz GLE 350d.
1,000 very low even for luxurious high-emission vehicles.
In all other seven countries, the tax systems put a
500 significantly higher burden on such cars, discourag-
ing the acquisition of expensive, high-emission vehi-
0 cles. The differences in taxation between the C-
ES FR DE UK IT PT BE NL segment VW Golf VII and the D-segment Audi A4
Source: own calculations are however much less pronounced in most coun-
tries. Portugal and the Netherlands are notable
Fuel taxes exceptions.
The UK is the only country under consideration Table 5: Taxes in the first year of registration
without a tax gap between diesel and gasoline. Also,
its diesel tax rate is highest in this group of countries
and even within the EU28.
In all other seven countries, road fuel taxes favour
diesel. This can be seen most clearly when compar-
ing the VW Golf VII (gasoline) to the Audi A4 (die-
-
sel). Although both models emit 109 gCO2/km, fuel
taxes are significantly lower for the diesel car.
-
The tax gap in the Netherlands is so large that annu-
al fuel taxes are higher for the VW Golf than the
Mercedes-Benz GLE350d (199 gCO2/km). The Source: own calculations based on ACEA (2017a), PwC (2016),
share of diesel cars is nevertheless very low. The Agenzia delle Entrate (2016), Government Digital Services
(n.d.), HMRC (2018), Indicator (2017), Belastingdienst
Dutch registration tax puts a hefty surcharge on (2018), Grant Thornton (2018); see Annex A, Table 6Table
r gram of CO2 above 63 g/km in 5 for more details.
of the Mercedes. The level of taxation seems to have a real impact. A
Electricity tax rates vary from zero (UK) higher first-year tax level for the high-emission vehi-
MWh (NL). The annual tax thus amounts to zero to cle is associated with a lower average CO2 emission
value. Figure 8 compares the tax amount payable in
the operating cost advantage of electric vehicles. the first year of registration for the Mercedes-Benz
GLE 350d (as an example for a high-emission vehi-
Forum Ökologisch-Soziale Marktwirtschaft e.V. • Green Budget GermanyFair & Low Carbon Vehicle Taxation in Europe 15 / 24
cle) with the average CO2 emission value of new Figure 9: Taxable benefit in kind (Euro)
registrations in 2016. This very simple correlation, of Renault VW Audi Mercedes
course, does not imply causation, but it is line with 30,000
the findings of many studies on the effectiveness of
such tax instruments. 25,000
Figure 8: Total first year taxes (Mercedes-Benz)
and average CO2 emission values 20,000
50,000 NL
Euro
15,000
40,000
PT 10,000
30,000
5,000
20,000
FR
0
10,000 ES BE
UK FR IT DE BE ES PT NL UK
IT DE
Source: own calculations
0
100 110 120 130
gCO2/km
Source: own graph based on Table 3 and Table 5
Taxable benefit in kind
The taxable benefit in kind (BIK) of each car is high-
est in the UK. The applicable rates for the calculation
of the BIK are differentiated by CO2 bands and vary
from 13% to 37%. In the Netherlands, the rate is 4%
for zero emissions vehicles and 22% for all others,
also resulting in high and differentiated BIK. Portu-
gal is the only country with a 0% rate for purely elec-
tric cars.
France is on the last rank, because the total BIK and
its differentiation are comparatively low. It is also the
only country where the Renault Zoe has a higher BIK
than the VW Golf. It has to be taken into account
though that France has an additional ownership tax
for company cars, which is highly differentiated by
CO2.
Forum Ökologisch-Soziale Marktwirtschaft e.V. • Green Budget GermanyFair & Low Carbon Vehicle Taxation in Europe 16 / 24
4 Case Studies Figure 11: Ø gCO2/km for new passenger cars
(Portugal)
g/km Portugal
Best practice examples 210 other countries
The most striking feature of countries with very low 190
average CO2 emission values is a graduated and 170
high taxation upon registration or acquisition. In 150
Norway (Ø 100.5 gCO2/km in 2015), every gram of
130
CO2 per kilometre can add between 100 and
370 to the registration tax bill. 110
In the Netherlands (Ø 105.9 gCO2/km in 2016), the 90
2012
2016
2014
2010
2011
2013
2015
2004
2000
2001
2002
2003
2006
2008
2009
2005
2007
registration tax is also quickly increasing with every
gram of CO2. As shown in Figure 10, the CO2-based
component of the tax is flat up to and including Source: graph based on Eurostat (2017); FleetNews (2016); Statista
80 g/km, but rises quickly thereafter. The tax curve is (2017)
very steep after 175 g/km and every additional gram
Taxes on the registration or acquisition of vehicles
gram above 67 g/km applies to diesel cars). This are so effective, because they are a clear price signal
makes high-emission cars substantially more expen- and fiscal incentive to consumers. The relevant tax
sive. rates in Norway, the Netherlands and Portugal are
so high that fuel-efficient, low-emission vehicles
have a significant price advantage already upon
Figure 10: CO2-
acquisition. The recurring savings at the filling sta-
related tax amount payable
tion are more difficult to evaluate upfront.
Euro
Ø105.9g/km Registration taxes, of course, need to be well-
140,000
designed. Visualizing the tax curves (see Figure 10
120,000 and Figure 12) is a useful way to understand its in-
100,000 centive structure. Some design characteristics are
80,000 more effective and others may lead to unintended
consequences (see next chapter). Decisions about
60,000
these characteristics have to be made consciously.
40,000
20,000
Examples of bad practice
0
The registration tax in Spain is actually not a bad
practice example, but it is a good case to illustrate
g CO2/km
how an inadequate tax design can create a weak
Source: graph and calculation based on ACEA (2017a), Belasting-
incentive structure with unintended consequences.
dienst (2017), FÖS (2018)
The tax rate (applied to the car price) is 0%, 4.75%,
9.75% or 14.75% depending on the CO2 emission
In Portugal (Ø 104.7 gCO2/km in 2016), the registra-
value (see Figure 12). The tax amount payable hence
tion tax (Imposto Sobre Vehículos) is also highly
increases significantly at certain thresholds.
graduated according to CO2, but not as heavily as in
the case of Norway or the Netherlands. The maxi- The sudden tax increase at 121 g/km has a visible
g/km. effect. The number of new passenger car registra-
tions drops markedly from 120 to 121 g/km, which is
The tax was introduced in 1998, but has been
also apparent in Figure 12 (grey bars). The same
changed frequently. Until 2006, the tax had been
holds for the next two thresholds. There are some
based on cylinder capacity (in cubic centimetres)
indications that manufacturers optimize a car s last
only. The CO2 component was added in 2006 and
digit for CO2 emissions in order to benefit from such
the according rates were increased steadily over the
incentive points in taxation schemes (Mock 2015).
following years. The continuous development of the
instrument might be one reason why Portugal has
been among the top countries (in terms of average
CO2 emissions) for many years, as shown in Figure 11.
The introduction of the CO2 component also seems
to have had a visible effect on new car registrations.
Forum Ökologisch-Soziale Marktwirtschaft e.V. • Green Budget GermanyFair & Low Carbon Vehicle Taxation in Europe 17 / 24
Figure 12: Spanish registration tax rates and Policy impacts
number of new registrations
new passenger car Historically, Sweden had been among the worst
registrations performing countries under consideration for many
registr. Special Tax tax rate years (see Figure 13). Its average CO2 emission value
75,000 20% for new passenger cars (123.1 g/km in 2016) is still
way above the unweighted average of all countries
60,000 14.75% 16% (118.8 g/km). But Sweden made significant progress
in the years following the introduction of a CO2
45,000 9.75%
12%
component in its annual vehicle tax in 2005 (see e.g.
30,000 8% Transport & Environment 2013). Between 2005 and
4.75% 2016, the average CO2 emission value fell from
15,000 4% 193.8 g/km to 123.1 g/km (-71 g/km) the highest
0% absolute reduction in any country.
0 0%
120
160
180
220
260
280
40
0
300
140
240
20
60
80
100
200
Figure 13: Ø gCO2/km for new passenger cars
g CO2/km (Sweden and Netherlands)
Source: graph and calculation based on ACEA (2017a), EEA (2017),
g/km Sweden
FÖS (2018)
210 Netherlands
The tax effectively incentivizes people to stay just 190
below these emission thresholds, but there is no 170
dynamic incentive to reduce emissions any further. 150
Additionally, the limits are somewhat random, and 130
the abrupt but steep hikes in taxation do not seem
110
fair or logical. A more continuous tax curve (see e.g.
Figure 10 for the Netherlands) has many advantages 90
2012
2016
2014
2010
2011
2013
2015
2004
2000
2001
2002
2003
2006
2008
2009
2005
2007
over stepwise design chosen in Spain.
The suboptimal tax in Spain is, of course, better than
having no or no CO2-related registration tax at all. Source: graph based on Eurostat (2017), FleetNews (2016), Statista
(2017)
Figure 2 indicates the importance of such taxes as a
likely determining factor of CO2 emission values of The highest relative reduction for the same period of
new cars. Czech Republic, Sweden, Luxembourg, time can be found in the Netherlands (-38%). An
Slovakia, Germany, Poland, Lithuania, Bulgaria, interesting anomaly is the trend reversal in 2016
Switzerland, Latvia and Estonia do not levy any though, which is most probably due to the expiration
registration tax, and they all have comparably high of a tax incentive for company car drivers in 2015.
average CO2 values. This indication is supported by The tax break was worth several thousand euros per
the literature (see e.g. Adamou et al. 2014, Brand et year and its expiration supposedly led to increased
e et al. 2014, Gerlagh et al. sales of plug-in hybrid vehicles (Automotive News
2016, Kok 2015). Tax competition between neigh- Europe 2015).
bouring countries may impair the effectiveness, if
Similar incentives for electric and/or plug-in hybrid
registration abroad is easy.
vehicles have helped to bring down emission values
over the last years. An overview of purchase and tax
incentives for EU countries is frequently prepared
e.g. by the European Automobile Manufacturers
Association (ACEA 2017b).
Such incentives can be effective in general as long
as they are in place. However, they are costly to the
tax payer and often socially unjust, because a privi-
leged group of people benefits at the expense of the
society. Rather than subsidizing road transport,
which has negative environmental effects beyond
CO2, well-designed vehicle taxation is usually more
efficient, technologically neutral and in line with the
user pays principle and fair taxation.
Forum Ökologisch-Soziale Marktwirtschaft e.V. • Green Budget GermanyFair & Low Carbon Vehicle Taxation in Europe 18 / 24
5 Policy Recommendations neutral playing field. Preferably, taxation should
be harmonized as widely as possibly to avoid
The previous chapters reveal ample room for better adverse tax competition and fuel tourism within
taxation of passenger cars in European countries. the EU and beyond its external borders.
The different taxes create price incentives that need Only in the UK are diesel and gasoline being
to be well-designed and thought out in order to taxed at the same rate. Countries like Belgium
create a coherent system. and France have high diesel shares (as a per-
1. First of all, it is of high importance to close the centage of new registration), but they have be-
emissions gap between type-approval and real gun closing the gap. The largest gap can be
word emission values by sharpening the regula- found in the Netherlands, but the diesel share is
tory framework. Taxation based on CO2 emis- rather low (19%) due to a hefty diesel surcharge
sion values can only be effective if these values in the registration tax.
are reliable and realistic. The huge gap has been In most European countries, the gap is so large
impairing taxation in many European countries that owning and using a diesel car is still benefi-
on a massive scale (see FÖS 2018). Some pro- cial from a tax perspective (see also Kunert
gress is to be expected with the introduction of 2018).
WLTP and RDE, but further improvements will 4. The taxation of vehicles needs to be prepared
be needed (see e.g. Stewart et al. 2015). for the electrification of transport and the use
2. Another key recommendation is to implement of alternative fuels and technologies. Many
or reform registration taxes, as they appear to questions e.g. regarding the taxation of electric-
be the main instrument regarding the reduction ity as an alternative fuel remain unanswered. So
of average CO2 emission values. But their effec- far there seem to be many temporary solutions
tiveness depends on a clever tax design, which in place that will have to be adjusted eventually.
includes, among other things, conscious deci- Intelligent road pricing schemes are an obvi-
sions about the tax base, tax rates, tax calcula- ous choice, because they can address vehicle
tions and continuous adjustments to keep up attributes and actual vehicle use as well as con-
with technological advances. This is of course gestion, air pollution and other externalities
true for all policy instruments. from road transport. Technological advances
One of the most rigorous registration taxes can have made it easier to set up such systems. They
be found in the Netherlands (see chapter 4.1). can also be limited to certain areas, e.g. cities or
The tax amount is quickly increasing with every city centres, is the case in London and Stock-
gCO2/km and already starts at low levels holm. Fuel taxes, in contrast, put a price signal
(80 g/km). The country also raises CO2-based on every litre of fuel (and hence CO2 emitted),
ownership and company car taxes and has the but their impact on buying decisions seems to
highest score in our ranking of car taxation in be limited. Other local instruments include en-
chapter 3. vironmental zones or improved parking man-
Other countries also have CO2-based registra- agement and pricing, which proved to be effec-
tion taxes, but they are often less effective be- tive for example in San Francisco.
cause of their less rigorous tax thresholds. In the 5. The taxation of company cars is in need for
case of Spain, steep tax thresholds have unin- reform, too. The benefit of driving a company
tended consequences, because buyers and car for private purposes is not adequately cov-
manufacturers appear to be optimizing the tax ered by taxation. The current undertaxation in
burden (see 4.2). virtually all countries constitutes an environ-
3. Closing the diesel tax gap is a time-critical and mentally harmful and socially unfair subsidy.
opportune measure. The issue has been getting Ireland has one of the most elaborate systems in
a lot of attention during the diesel scandal. The the EU. The benefit in kind is calculated as 6-40%
scandal has created much momentum and per year of original market value, depending on
changed the public perception. Fuels should be CO2 thresholds and business mileage.
taxed according to their energy and carbon
content to create a fair and technologically
Forum Ökologisch-Soziale Marktwirtschaft e.V. • Green Budget GermanyYou can also read