An Analysis of Consumer Incentives in Support of Electric Vehicle Uptake: An Australian Case Study
←
→
Page content transcription
If your browser does not render page correctly, please read the page content below
Article
An Analysis of Consumer Incentives in Support of
Electric Vehicle Uptake: An Australian Case Study
Gail Helen Broadbent 1, * , Graciela Metternicht 1 and Danielle Drozdzewski 2, *
 1    School of Biological, Earth and Environmental Sciences, University of New South Wales, Sydney NSW 2052,
      Australia; g.metternicht@unsw.edu.au
 2    Department of Human Geography, Stockholm University, SE-106 91 Stockholm, Sweden
 *    Correspondence: ghbroadbent@gmail.com (G.H.B.); danielle.drozdzewski@humangeo.su.se (D.D.)

 Received: 22 December 2018; Accepted: 22 February 2019; Published: 4 March 2019

 Abstract: Transitioning from internal combustion engine vehicles (ICEVs) to innovative technologies,
 including electric vehicles (EVs), can be a crucial pathway to reducing Greenhouse Gas (GHG)
 emissions and other negative externalities arising from fossil-fueled cars used for personal transport.
 Government action to correct insufficient market incentives has been essential in countries working
 to enhance EV acceptance; however, to date in Australia, there has been little government support to
 enact EV uptake. This paper identifies barriers and incentives to EV adoption in Australia through a
 survey of pro-environmental motorists, including an experimental component to test information
 provision influences on attitude change. Results evidence that wide ranging factors influence vehicle
 choice including EVs. Purchase barriers are focused on lack of a comprehensive recharge network
 and high EV purchase price. Factors encouraging fully EV uptake showed affordable price (56%)
 increased vehicle range (26%) and an adequate recharge network (28%) were mentioned most often;
 only 13% specifically indicated environmental regard as influential. Information provided about
 EVs increased the likelihood of positive attitudes towards EV purchase and decreased uncertainty
 about the technology. Recommendations arising from this research could be considered by laggard
 countries that, like Australia, have yet to take significant action to encourage transition to EVs.

 Keywords: electric vehicle; EV adoption; public policy; implementation; consumer choice survey;
 Australia

1. Introduction
      Burning fossil fuels for energy has a pivotal role in global warming, which left unchecked
could lead to catastrophic climate change [1]. Not only does oil consumed for transport via internal
combustion engine vehicles (ICEVs) result in Greenhouse Gas (GHG) emissions, a wide range of
other negative externalities also impact the environment, economy, and society [2]. Transitioning to
alternative transport energy sources is critical for Australia to reach its GHG emissions target and
reduce its reliance on imported oil; with existing technologies presenting some of the lowest cost
options [3]. The following literature survey provides background information about the ever-changing
field of research into consumer attitudes on EVs and government actions to remedy market failures.
      Policy methods designed to increase the attractiveness of EVs have been reported elsewhere
(for example, [2,4,5]). Analyses of strategies employed in various industrialized markets demonstrate
that government action is essential to encourage individuals to buy EVs, hence the need for
governments to support the roll-out of fast recharge infrastructure, among other initiatives. Such
actions can be a crucial path to rapidly reduce transport-related oil consumption; however, to date,
Australian government action to facilitate the transition to EVs has been very limited [2]. Compared
to other mature car markets (for example, Norway, the Netherlands, California), Australia has a

World Electric Vehicle Journal 2019, 10, 11; doi:10.3390/wevj10010011             www.mdpi.com/journal/wevj
World Electric Vehicle Journal 2019, 10, 11 2 of 15
low consumer acceptance of EVs, with negligible uptake [6]; thus it could be considered a laggard
country. There has been limited recent research conducted on Australian consumer purchase intentions
with emphasis on the barriers and incentives that influence attitude to purchase more advanced EVs
(with improved batteries and greater range), and with the assumption of a not-distant future where
EVs achieve price parity with ICEVs [7–9]. With 17% of total Australian GHG emissions arising from
the transport sector, and light vehicles (Light vehicles: all road vehicles in Australia under 3.5 tonnes
gross vehicle mass, including passenger vehicles, sports utility vehicles (SUVs) and light commercial
vehicles, but excluding motorcycles) contributing 10% of all emissions [10], EVs appear a suitable
alternative to ICEVs for a country like Australia, where 67% of its population are concentrated in
capital cities [11] and most driving is done at the local level. Indeed, the daily average travel distance
for passenger vehicles is 35 km [12]. A Western Australian survey [13] on single vehicle households
with off-street parking found that a 60 km driving range for a BEV could satisfy 90% of their driving
days, but a range of 170 km was more appropriate to reduce inconvenience for longer trips away
from home.
Existing Australian research shows that people who are pro-environmental, better educated [14]
and live in urban areas [15] are more likely than other Australians to be sympathetic to EVs as a
suitable alternative to ICEVs, as a means to reduce environmental harm from private motor vehicle
transport. Other more recent Australian research [16] using a Best-Worst stated choice survey also
found that people with environmental concerns were most likely to indicate that they would buy an
EV while those with the lowest environmental concerns would not buy an EV.
Other influences on consumer behavior gathered from overseas research include: demographic
factors, particularly gender; external factors including culture and economics; and internal factors such
as knowledge, values and priorities [17]. When investigating car purchase behavior, researchers [18]
found there was an attitude-action gap, which describes the behavior observed in many people who
generally have positive attitudes towards taking actions to reduce environmental impacts but limited
undertaking of such actions.
In this context, the purpose of this research was to identify the significant barriers and incentives
to EV adoption in Australia for private motor vehicle customers, including whether providing targeted
information influences attitude change. A case study was used to this end, with the premise that
urbanized, pro-environmental and well-educated Australian motorists may be more pre-disposed
to favor EV purchase over conventional vehicles. To increase understanding of the motivations of
consumers to buy EVs, this paper investigates two hypotheses:
1. The provision of incentives positively influences the likelihood that private motor vehicle
customers will buy an EV the next time they buy a car.
2. There is a relationship between provision of information about current model EVs and the
likelihood to buy; people who receive information are more likely to buy an EV than those who
do not.
The paper seeks to recommend actions that could encourage uptake and help bridge
attitude–action gaps for people demonstrating pro-environmental attitudes but with low levels of EV
ownership. The remainder of the paper describes the methods applied in Section 2; Section 3 presents
and discusses the results and outlines implications of the findings; and finally, Section 4 presents
the conclusions.
2. Methods
This research was undertaken to provide insight into factors that may affect motorists’ transition
from a more polluting technology to one that is innovative and less polluting. Interactions of two key
concepts underlying the research were market failure [19] and diffusion of innovations theory [20],
and where government actions, such as the application of subsidies, influence the rate at which an
innovation is adopted.World Electric Vehicle Journal 2019, 10, 11 3 of 15
The research adopted a mixed-method approach that collected quantitative and qualitative data
for analysis and interpretation [21] to survey, via two online questionnaires, a cohort of mainly urban
motorists on their attitude towards EV purchase over conventional vehicles. Prior research revealed
that most consumers lack adequate, accurate information about EVs [22]; hence, an experimental
component was included in the first questionnaire to enhance understanding of the influence that
information provision may have on decision making. The methodological framework took into account
incentives shown to encourage EV uptake in markets where EVs are more popular (as reported in [2]).
This research used a sequential design, as outcomes from the first questionnaire were used to influence
design aspects of the second questionnaire [23]. Hereafter follows a more detailed description of the
main research components.
2.1. Questionnaires
The two online questionnaires, being a mix of open and closed response questions, were designed
and administered 10 months apart in 2015 and 2016, via the online platform Survey Monkey [24].
The questionnaires aimed to gather quantitative and qualitative data (see Tables 1–4, and the
Supplementary Information) to enable cross-tabulation of a range of independent variables with
the dependent variables of how likely respondents were to buy fully electric vehicles (BEV) or plug-in
hybrid electric vehicles (PHEV). Both questionnaires were self-reporting and cross-sectional, and
were pre-tested as pilot studies to help refine the questions, which were subsequently modified prior
to delivery to reduce risk of question ambiguity [25]. This research had UNSW ethics approval,
number 155078.
Recruitment for the first questionnaire was by convenience sampling and snowballing [26],
with contact mainly by email, word of mouth or Facebook; the contacts included many groups with an
environmental bias (number and identity of members was unknown) with the pre-conception that
such respondents would be sympathetic to taking actions to reduce environmental impacts. A total of
330 useable responses were collected for Questionnaire 1.
To investigate the research’s experimental component, Survey Monkey randomly allocated half
the respondents to the Test group (n = 164), who received a page of information about current EV
models relating to: EV range, batteries, rechargability, vehicle operational costs, and environmental
and health benefits of EVs compared to ICEVs. The remaining Control group (n = 166) did not receive
the information.
The second questionnaire was designed and undertaken after analyzing results of the first
questionnaire. Respondents from Questionnaire 2 were a subset of the first, consisting of those who
voluntarily provided contact details and agreed to this second phase, providing 102 usable responses.
To probe thoughts about EVs with price removed as a potential barrier, Questionnaire 2 respondents
were asked to assume that new EVs were the same price as similar conventional cars, given the rapid
decline of EV battery prices [8], and were also queried about incentives that might appeal to them.
2.2. Data Analysis Techniques
Information obtained from the two questionnaires was analyzed to provide insights about
demographic characteristics of potential car purchasers and their car, dwelling, parking circumstances
(independent variables); their attitudes to EVs; perceived barriers to purchase; and incentives that
could encourage purchase (dependent variables).
For closed response questions, frequencies were calculated for each available answer.
As respondents were not randomly selected, and with a sample size of 330, for those questions with
Likert (scaled 1–5) response options, the weighted average response (WAR) (Equation (1)) was used:
Weighted mean = [(1 × n1 ) + (2 × n2 ) + (3 × n3 ) + (4 × n4 ) + (5 × n5 )]/N (1)World Electric Vehicle Journal 2019, 10, 11 4 of 15
where n1 + n2 + n3 + n4 + n5 = N; N = number of respondents in a particular category e.g., New car
buyers; n = number of respondents in each of the Likert scale values for that particular factor, including
1 = least likely, 3 = neutral, and 5 = most likely.
Individual responses to qualitative open questions were coded into thematic categories to find
patterns and commonality [27]; for example: vehicle price, vehicle range, environmental issues.
Category results were calculated as percentages. Manual coding was undertaken to avoid inaccuracies
that could occur through automatic coding, where terms and phrases could be taken out of context.
Test and Control group results from the experiment conducted in Questionnaire 1 were compared
and contrasted to seek evidence that providing relevant information about new products such as EVs
may be a suitable policy intervention to foster uptake.
3. Results and Discussion
A total of 330 useable responses from Australian motorists were collected from the first online
questionnaire, few of whom were PHEV (1.8%) or BEV (0.3%) owners. Analysis of spatial distribution,
based on postcode data, showed Questionnaire 1 respondents were concentrated in the capital cities
(82%), a higher proportion than the 67% of all Australians who live in the capitals. Ten months later,
102 of these motorists provided additional data via a second follow-up online questionnaire. The key
results, including those derived from the experimental component testing the utility of presenting
information about EVs to motorists, are presented and discussed in this section, and compared and
contrasted with prior relevant research.
3.1. Impact of Variables on the Likelihood to Buy an EV
Overall, respondents showed they were moderately predisposed to buy a BEV (WAR = 2.94/5)
and slightly more likely to prefer a PHEV (WAR = 3.1/5). Table 1 evidences that the independent
variables exhibiting the closest relationship with respondents’ attitudes towards buying an EV were
gender, and car condition at purchase (new or used).
Table 1. Key variables that were more strongly associated with likelihood to buy an EV by Australian
pro-environmental motorists from Questionnaire 1 (n = 330).
Weighted Average Response (Scale 1–5) to Dependent
Independent Variable Variable
Likelihood of Buying BEV Likelihood of Buying PHEV
Gender Female 3 3.22
Male 2.8 2.89
Age 18–24 2.6 2.8
25–34 2.79 2.85
35–44 2.98 3.15
45–54 3.1 3.1
55–64 3.04 3.1
65–74 2.82 2.95
75 or older 2.67 3.05
Car condition at purchase New 3.09 3.09
Used 2.68 2.91
Vehicle price willingness to pay $50 k 3.2 2.9
Size of vehicle Small 3.05 3.17
Medium 2.9 3.05
Large 2.6 2.6World Electric Vehicle Journal 2019, 10, 11 5 of 15
Table 1 shows that respondents with a greater preference for EVs were: female, middle aged, and
those willing to spend more than AUD 40,000 on their next car, which is more likely to be small in
size and new at purchase. Table 1 also shows people aged 75+ (WAR = 2.67) and the youngest group
(18–24) (WAR = 2.6) were least likely to consider buying an EV, whereas those aged 45–54 appeared
most likely (WAR = 3.1). Other factors not tabled, such as type of dwelling and home ownership
status, appeared to have no impact on preferences for EVs. The significance of age aligns with a prior
Norwegian survey that reported older people were less likely to express an interest in buying EVs [28].
Policy makers interested in promoting EVs may find the above characteristics useful for targeted
marketing campaigns.
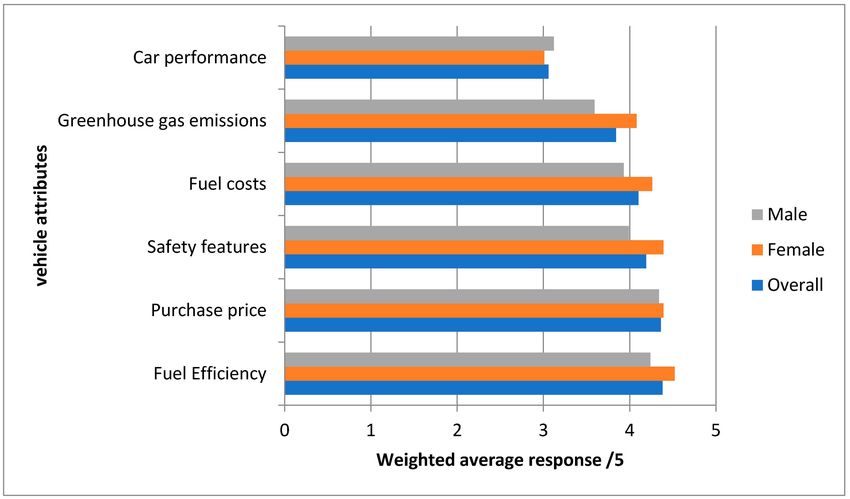
Table 2 (and the graphical representation in Figure 1) provides a perspective about barriers
and incentives that influence motorists’ thinking about potential EV purchase; it lists issues that
respondents considered important when buying any car. Fuel efficiency and purchase price appear to
be the most decisive issues when buying any car, suggesting that an individual’s personal budget is
paramount for such decisions. Other factors such as country of car manufacture and car brand were
regarded as of low importance. Some factors in Table 2 were influential for all respondents, with safety
features, fuel costs and GHG emissions achieving high scores; however, these factors showed marked
differences between genders, scoring more highly for females than males. However, car performance
was only moderately relevant overall; it scored slightly higher for men than women.
Figure 1. Importance of key vehicle attributes when buying any car shown as Weighted Average
Responses with 5 as a maximum value.
Table 2. Importance of key vehicle attributes when buying any car (Questionnaire 1: Question 26)
(n = 330).
Weighted Average Response (Scale 1–5)
Variable
All Respondents Female (n = 166) Male (n = 164)
Fuel Efficiency 4.38 4.52 4.24
Purchase price 4.36 4.39 4.34
Safety features 4.19 4.39 3.99
Fuel costs 4.1 4.26 3.93
Greenhouse gas emissions 3.84 4.08 3.59
Car performance 3.06 3.01 3.12World Electric Vehicle Journal 2019, 10, 11 6 of 15
The number of cars owned by respondents was recorded, though analysis showed it had little
impact on EV preferences. However, it should be noted that this sample was more likely to be
pro-environmental than typical Australians, and were more likely to own one car (47.3%) rather than
multiple cars (44.6%). In this survey, single car owners favored EVs the same as multi-car owners,
whereas prior studies in Norway [29] and Denmark [30] show that EVs have been preferred by
wealthier multicar households.
3.2. Exposure to EVs, Travel Profiles and Preferred Vehicle Fuel Sources
Questionnaire 1 assessed respondents’ level of EV driving experience as a proxy for exposure to
EVs. Results show that most respondents drove petrol vehicles (79%); followed by diesel (15%); 2.7%
drove a hybrid vehicle; 1.8% drove a plug-in hybrid (PHEV); and only 0.3% drove a fully electric car
(BEV). Hence, it evidences low levels of EV driving experience for the cohort surveyed.
Respondents were asked how often they would drive more than a total of 100 km per day. Half
of the respondents (49.7%) only drove more than 100 km on a day on occasion during the year, and
a further 27.3% drove that far once or twice a month. This data tallies with data [12] showing that
the average daily distance driven by Australians is just 35 km; much less than the range of current
model EVs. It is worth noting that half of these respondents only travelled more than 100 km/day on
occasion throughout the year, and yet they were only moderately inclined to buy an EV (WAR 3.07).
For example, one respondent noted, ‘I would only consider electric if I needed a vehicle solely for local use’
(Respondent 48, Questionnaire 1, Q27).
Despite the suitability of BEVs for most day-to-day driving, survey respondents who never drove
more than a total of 100 km in a day (7.3%) were the least amenable to buying a BEV (WAR = 2.75) or
PHEV (WAR = 2.71). For example, the main factor impacting EV purchase for one respondent was:
Fear of the car running out of energy before one could get to an electricity source for recharging
particularly in busy traffic and/or on a motorway, harbour tunnel or harbour bridge where there are
hefty fines for running out of ‘juice’. (Respondent 21, Questionnaire 2, Q10)
Earlier research [31] found that that 87% of vehicle-driving days could be satisfied by a 2013
model Nissan Leaf in cities such as New York and Houston, without requiring a top up charge during
the day. Nevertheless, the fears about EV range held by ICEV motorists should not be discounted if
seeking to assure them of the suitability of EVs for their needs. A British national survey [32] revealed
that EV technology is viewed by many consumers as disruptive to routine tasks and therefore inferior
to ICEVs. Such a finding is compatible with Rogers’ Diffusion of Innovation theory [20] that states that
for an innovation’s acceptance, it needs to have a clear relative advantage over the incumbent.
3.3. Barriers to EV Purchase
Several questions dealt specifically with barriers to EV purchase. Responses to open questions in
Questionnaire 1 (Table S3) showed that the most salient purchase barriers were: high EV purchase price
(44%), followed by perceived recharging issues (29%). However, when respondents were subsequently
asked to rank statements about EV ownership (Table S4), results reveal that lack of rechargers on long
distance trips (WAR = 4.24) was the most significant issue, then difficulties in locating public rechargers
(WAR = 3.85) whereas purchase price (WAR = 3.53) was less concerning). By contrast, respondents
agreed much less with other listed statements; for example, ‘The total cost of ownership of an electric
vehicle is too high on a per kilometre basis compared to conventional cars’ (WAR = 2.34), which was a
deliberately false statement.
The revelation that Australian motorists were most anxious about running out of charge (an effect
of vehicle range and recharging inconveniences), which the data showed influenced EV purchase
preferences, is not surprising for this cohort, which predominantly owned ICEVs. For example, these
concerns were exemplified by one respondent wanting a ‘fully established network of fast charging stations’
(Respondent 12, Questionnaire 1, Q27) and another who would be encouraged by the ‘easy availabilityWorld Electric Vehicle Journal 2019, 10, 11 7 of 15
of electrical outlets and fast recharging’ (Respondent 104, Questionnaire 1, Q27). Many earlier studies
(for example, [33]) also noted this concern, and later studies [34,35], have validated these findings.
This survey’s results are also consistent with a more recent UK survey [32], mainly of people unfamiliar
with EVs, which revealed recharging and vehicle range as the most relevant factors deterring EV
purchase. Even in Norway, with high levels of EV ownership, such factors were three times more
worrying for drivers unfamiliar with EVs than for EV owners [28].
That high EV purchase price was perceived as a major barrier could be expected, given cost
was the chief consideration when buying any car (Table 2). EVs are in the upper price range for any
particular segment of the market [36] and in Australia this is compounded by the limited number of
EV models available, which are also in the more expensive segments. This finding agrees with prior
international research [37] that showed 80% of Norwegian EV owners considered incentives to reduce
EVs’ up-front purchase price critical to their decision to go electric. The value of Norwegian subsidies
for EV purchase resulted in price equivalency with ICEVs, and this factor along with other incentives
has enabled EVs to become increasingly popular [38]. Recent research [39] suggests that EVs will only
become more popular generally, when they reach purchase price equivalency with ICEVs.
In the second questionnaire, respondents were asked to assume price equivalence between an EV
and an ICEV. With this assumption, respondents ranked (Table S7) the most significant factors affecting
EV purchase decisions were vehicle driving range (41%) followed by availability of recharge stations
(26%). Car model features were valued by 19% of respondents; environment was the most pertinent
consideration for 9% of respondents, and the second most important consideration for another 14%
of respondents.
Questionnaire 1 responses (Table 2) demonstrated that consideration of GHG emissions scored
much lower than fuel efficiency; yet, they are proxy measures for each other [40], which suggests that
operating costs outweigh emissions in consumers’ preferences when thinking about car purchase.
By contrast, also in Questionnaire 1 (question 36), respondents showed a high level of agreement (83%)
with a statement that EVs are worth government investment with only 3.4% disagreeing while 13.4%
were unsure; half of all respondents (52%) explained this was to effect pollution reduction from cars
(Table S5). Despite the desire to reduce environmental harm, for this research’s pro-environmental
sample it can be deduced that when buying and operating a car, the environment was less influential
than other considerations. Analysis suggests that other factors such as personal budget, convenience
and lower operating costs ranked more highly than environmental concern, and appears to evidence
an attitude-action gap for these respondents when making vehicle purchase decisions.
3.4. Incentives Increasing the Likelihood of EV Adoption
When questioned about what would encourage BEV purchase (Questionnaire 1, Q27: Table S1),
open responses showed that affordable price (56%), an increased vehicle range (26%) and an adequate
recharge network (28%) were significant criteria, while 13% specifically mentioned the importance of
their environmental regard (respondents could mention multiple factors). An affordable price would
appear to encourage PHEV purchase for 61% of the respondents (Table S2) while, understandably
for PHEVs, recharging issues were less vital. The data from Tables S1 and S2 are represented in
graphical form in Figure S1. Analysis of Question 38 (Questionnaire 1: Table S6), which asked about a
list of incentives, reported that the availability of recharge stations in every town and on highways
(WAR = 4.2) was much more important than subsidies to make EVs’ price equivalent to ICEVs
(WAR = 3.64), or to allow total cost of ownership equivalent after 10 years (WAR = 3.5). The least
popular incentives overall were free parking (WAR = 2.68), and access to transit [HOV] lanes regardless
of passenger numbers (WAR = 2.7).
The second questionnaire asked further questions about incentives, assuming price parity between
EVs and similar ICEV models. Respondents were asked to choose and rank their three most desirable
incentives from a list of 13, selected from incentives offered in EV markets more successful than
Australia (Table S8). The most popular overall (63% of respondents put it in their top three choices)World Electric Vehicle Journal 2019, 10, 11 8 of 15
was ‘Government support for the roll out of a fast recharger network every 50 km on highways and in
country towns’; followed by 43% nominating ‘No annual registration fees for EVs’; and thirdly 32%
chose ‘Legislation to ensure you can use a credit/debit card to pay for your recharging away from home,
rather than requiring paid membership of privately owned recharger network’. Government support
to install rechargers at hotels, motels and other tourist destinations was the least appealing incentive
(8%). These results suggest that motorists travelling away from home need assurances about recharger
accessibility en route, and in towns. The aforementioned results evidence that these Australian
motorists displayed characteristics similar to ICEV motorists from other countries, illustrated in
international analyses focused on incentives and motivations for purchasing EVs (for example, [5,41]).
The importance of user convenience appears well understood in other markets where EV uptake
has been more successful, such as the State of California. Through Executive Orders, it fosters initiatives
for zero emission vehicle uptake including open recharger access [42] enacted through legislation,
the Interoperability Electric Vehicle Charging Stations Open Access Act [43]. EVs can be recharged
at any publicly accessible recharge station using credit card payment rather than requiring network
membership. Such actions assist a more streamlined roll out of EV charging stations and enhance
user-friendliness. Further, the California Assembly [44] has enabled 40% of Californians who are
tenants, including in multi-unit residential buildings, as well as business tenants, to install a recharger
in car parks [45]. Legislation goes hand in hand with technological developments that enable electricity
consumed by rechargers installed in multi-tenanted buildings to be billed separately [46]. The former
has made Californian cities among the leading US cities adopting EVs [5].
3.5. Access to Information: Impact on Preferences
The experimental component of this research aimed to test how useful targeted information was
to influence attitudes of the Test group (n = 164), as compared to the Control group (n = 166), who did
not receive any additional information. Survey output (Table 3) indicated that a relationship existed
between information provision about current model EVs and likelihood to buy; people who received
information appeared more likely to buy an EV than those who did not. The popularity of various
incentives was also collated for the Test and Control groups.
Table 3. Likelihood of buying a BEV or PHEV, and variables for Test and Control groups.
Weighted Average Response (Scale 1–5)
Variable
Overall (n = 330) Test (n = 164) Control (n = 166)
Qu 30 Likelihood to buy BEV 2.94 3.02 2.85
Gender
Female (n = 166) 3 3.14 2.8
Male (n = 164) 2.8 2.87 2.88
Car condition at purchase
New (n = 140) 3.1 3.3 2.85
Used (n = 154) 2.68 2.74 2.62
Willingness to spend on next car
Less than $20,000 (n = 109) 2.64 2.75 2.6
$20 k–$30 k (n = 79) 2.99 3.2 2.75
$30 k–$40 k (n = 46) 2.74 2.7 2.75
$40 k–$50 k (n = 39) 3.26 3.3 3.1
$50 k or more (n = 30) 3.2 3.6 2.73
Size of car
Small (n = 123) 3.05 3.1 3
Medium (n = 164) 2.9 3.0 2.8
Large (n = 43) 2.6 2.75 2.4World Electric Vehicle Journal 2019, 10, 11 9 of 15
Table 3. Cont.
Weighted Average Response (Scale 1–5)
Variable
Overall (n = 330) Test (n = 164) Control (n = 166)
Qu 31 Likelihood to buy PHEV 3.1 3.1 3
Gender
Female (n = 166) 3.22 3.27 3.15
Male (n = 164) 2.89 2.93 2.86
Car condition at purchase
New (n = 140) 3.1 3.12 2.98
Used (n = 154) 2.91 3.03 2.87
Willingness to spend on next car
Less than $20,000 2.84 2.9 2.8
$20 k–$30 k 3.09 3.2 3
$30 k–$40 k 3.11 2.9 3.25
$40 k–$50 k 3.26 3.3 3.1
$50 k or more 2.9 3.1 2.6
Size of car
Small 3.2 3.25 3.1
Medium 3.05 3.1 3
Large 2.6 2.75 2.4
Table 3 shows the likelihood of the whole sample (overall) buying BEVs and PHEVs, and then
lists the results for the Test and Control groups. The results were analyzed further for comparative
purposes. The effectiveness of access to additional information is apparent when comparing sub-sets
of the independent variables. Test respondents appeared more likely to have been influenced by the
information if they were female, wanted to buy a new car next time and were in the AUD 40,000–50,000
vehicle price cohort. Buyers of large cars, while less likely to buy an EV, were more influenced by the
information than buyers of small or medium cars. Other variables, such as type of dwelling and home
ownership status, were not associated with the efficacy of additional information.
The results show that Test females were far more likely to buy a BEV than Control females, whereas
males were unaffected by access to additional information (Table 3). Extensive prior research has
established that gender differences are significant for advertising and marketing [47], with differences
in customer response mechanisms [48], and in particular with care for the environment [49], thus
gender considerations appear to be relevant for campaigns designed to promote EVs.
Respondents in the Test group, with access to additional information, were more certain about
their answers. Control respondents recorded higher uncertainty in their responses, up to 45% of the
group, and in some cases about three times more than the Test group. For example, for Question
35 (Table S4) ‘Distance EV can travel on one charge (range) is adequate for my day to day needs’,
4.4% of Test respondents listed that they were uncertain about the statement, compared to 11.1% of
Control respondents; and Test respondents were more positive about vehicle range, scoring WAR = 3.6,
compared to Control respondents scoring WAR = 3.3. These findings align with prior research [22]
(p. 439) arguing that up-to-date knowledge should help consumers make more informed purchase
decisions as ‘most consumers are either uninformed or misinformed’ about EVs, inflating personal cost
estimates and reducing the likelihood of purchase. Our results (Table S8) evidences that, for instance,
providing online information about the location of rechargers could assist EV owners, thus helping
potential buyers overcome significant apprehension about locating rechargers.
Further, the second questionnaire explored preferred information sources (Table 4), asking
respondents to rank the importance of each source on a 1–5 Likert scale. Taking a ‘Test drive’ was
reported as the most valued source of information, for males and females, followed by formal sources
of information such as print and electronic media (Table 4). Males (WAR = 3.73) relied more on
their ‘Prior knowledge about cars’ than did females (WAR = 3.5); whereas ‘Family and friends’ wereWorld Electric Vehicle Journal 2019, 10, 11 10 of 15
valued more highly as an information source by females (WAR = 3.28) than males (WAR = 2.76).
The importance of test drives highlights the value of heuristics learning.
Prior research demonstrates the importance of pre-sale experiences [50], including ride and
drive events and dealer programs [51] in the process of diffusing an innovation, and it underlines
the importance of field days in helping promote EVs in less-pressured settings than car dealerships.
Such experiential knowledge can allow car customers to familiarize themselves with EVs before they
shop, help normalize EVs in the community and improve consumers’ prior knowledge about EVs,
a meaningful source of information for car buyers, especially men (see Table 4). This proposition is
supported by previous research [52] that concluded that access to information and personal experiences
helped potential car customers overcome their fears and doubts about the technical and practical
aspects relating to new technology.
Table 4. Importance of information sources (Questionnaire 2: Question 6) (n = 102).
Weighted Average Response (Scale 1–5)
Source of Information
Overall Female Male
Prior knowledge about particular car models 3.63 3.50 3.73
Family and friends 3.0 3.28 2.76
Car sales person 2.24 2.57 1.96
Formal information sources (e.g., magazine articles, car brand
3.9 3.93 3.87
websites, articles written by motoring journalists, TV shows)
Advertisements about specific car models 2.22 2.15 2.27
Test drive 4.1 4.15 4.05
Results from Questionnaire 1 (Question 22) show that online sources of information (for 41.2% of
respondents) and print media (20.6%), followed by word of mouth (16.4%) were more influential for this
sample of Australians than other sources. These preferences align with prior research in Norway [28]
that found for EV owners, the media (inclusive of all types) was the most regarded information source,
followed by family and friends. Social influence is another relevant driver for sales [53] and our results
reveal that family and friends were well regarded as a source of information for female respondents.
Interestingly, in Norway, only 1% of BEV owners would not buy an EV again [29], further evidencing
that incentives and education, about potential benefits of EV ownership and ease of use, are policies
that could help allay motorists’ fears, enabling EVs to be the preferred choice.
3.6. Implications of the Results
Results from this research support the two hypotheses investigated. Analysis of the results
revealed that particular measures, especially the provision of a comprehensive recharge network and
enabling legislation, could act as pull factors to incentivize EV acquisition. Similarly the hypothesis
that information provision positively affects buyer attitudes was supported by the research. Supplying
relevant, up-to-date information, especially about operational costs, vehicle range and providing
experiential information well before point of sale, is likely to increase EV uptake.
Motorists’ attitudes and intentions revealed by this research fit the situation described by the
theory on market failure [19], where the sum of individual actions—in this case choice of car energy
source—would not provide the most effective result for society, by failing to reduce the use of fossil
fuels for transport. The survey respondents were less concerned about the ‘public good’ (for example
in reducing environmental harm), when making car buying decisions and were more concerned about
EV purchase price and running out of charge while on long trips away from home. These respondents
displayed positive attitudes towards the environment and explicitly favored government support for
EVs because it would result in environmental improvements (Questionnaire 1, Questions 36 and 37:World Electric Vehicle Journal 2019, 10, 11 11 of 15
Tables S6 and S7), but individually, respondents were less enthusiastic about buying an EV because of
personal inconveniences as previously discussed.
Range anxiety can be addressed by increasing vehicle range and/or increasing the supply of
publicly available rechargers. However, to enable journeys longer than the vehicle range to be taken
in one day, away from home, a comprehensive network of rechargers, particularly fast chargers on
major routes and in country towns, would be required as individual motorists have unique trajectories,
even if their vehicles have a longer range than earlier models.
Our results demonstrate that Australian motorists’ preferences were similar to other people
around the world with limited experiences of EVs. Table S9 provides a convenient comparison for
concerns of motorists from Norway, UK, California and Australia when considering EV uptake.
Importantly, the personal budget of Australian consumers impacted their car-buying decisions.
While the initial cost of EVs is high compared to ICEVs, there are limited EV models available,
particularly in the lower price segments, and with few EVs in the second-hand market, it will be
difficult to persuade motorists, apart from those who can afford upper price bracket cars, to change
from ICEVs to EVs. Indeed, even though the expressed interest in EVs by these respondents was only
moderate (Table 3), any interest has not converted into actual sales [6]; overturning this trend will
require action. Providing access to additional information appears to be an effective strategy, including
more information about EVs’ environmental superiority to ICEVs, which could be significant for those
with pro-environmental attitudes who lack details that might encourage EV adoption.
4. Conclusions
This research provides evidence to support recommendations that policy makers could consider
to foster a transition to fossil-free driving in a country such as Australia, where to date governments
have not undertaken any significant action to encourage EV sales. This paper drew from the car buying
preferences of urbanized, well-educated Australian motorists with pro-environmental tendencies and
to test if providing information could increase the potential for EV uptake. The research revealed there
are major hurdles to overcome before pro-environmental consumers would actually buy an EV.
Our results indicate that infrastructure investment would incentivize motorists to buy an EV
more than lowering vehicle price would. Thus, one recommendation arising from this research
is that government supports the rollout of this essential market co-condition. The full potential
of investment to support increased EV adoption may not be realized if customer anxieties are not
primary considerations when designing and implementing policy initiatives. It is recommended that
infrastructure investments occur before price parity of EVs with ICEVs is reached, as it is at that
point when the EV market will likely accelerate and appeal to the masses. Motorists would benefit
from actions that could increase their familiarity with an innovation such as EVs well before their
next motor vehicle purchase. Information about vehicle range and assurances they would be able to
easily reach distant destinations because there is an adequate recharger network would help overcome
range anxiety.
A second recommendation concerns the need for centralized data collection about infrastructure
location and recharger type. Such data would be useful to ensure that applications, such as smartphone
apps, are up-to-date and accurate, serving to dispel motorists’ fears about reaching their destination
without running out of charge, thus encouraging uptake. To increase user convenience, it is suggested
that infrastructure networks would benefit by being open access, that is, no need to join a network
and with credit/debit card payment options, potentially boosting EV uptake and more custom for
the networks.
A third recommendation underpinned by our results is the need to address lack of information
about EV ownership and operation. Increasing experiential learning for potential EV owners with ride
and drive events is one example of an inexpensive tool for governments to foster uptake in countries
with low consumer acceptance of EVs. The results from this research, combined with additional
evidence from international studies, indicate that supplying up-to-date and relevant information canWorld Electric Vehicle Journal 2019, 10, 11 12 of 15
help demystify EVs. Accurate information about operational costs and vehicle range, and providing EV
experiential information well before people arrive at the point of sale is likely to increase EV adoption.
Funding the dissemination of appropriate information via popular platforms could be considered as
an appropriate government policy if the aim is to increase EV acceptance by individual consumers
in Australia. Consideration of this research’s results could enhance the design of social marketing to
promote EVs.
Lastly, our results illustrate the heterogeneity of the car market, emphasizing the need to account
for the preferences of different niches when trying to improve EV sales. Implementing a range of
incentives with consideration of the variables shown to be more influential, should yield better results
than use of a single incentive helping to expedite the transition to a lower carbon economy. To maximize
outcomes, investment to disseminate information would be enhanced by simultaneous deployment of
infrastructure rollout. The recommendations could be applied to other countries that, like Australia,
have yet to take significant action to encourage the transition to EVs.
Further research could include investigations into the actions that could usefully be taken at
the local government level, as this could help maximize any investments made and reduce any
costs associated with poor planning and execution of programs intended to increase EV acceptance
and uptake.
Supplementary Materials: The following are available online at http://www.mdpi.com/2032-6653/10/1/11/s1,
Figure S1: Factors that would encourage purchase of BEVs and PHEVs, Table S1: Questionnaire 1, question 27,
Table S2: Questionnaire 1, question 28, Table S3: Questionnaire 1, question 32, Table S4: Questionnaire 1, question
35, Table S5: Questionnaire 1, question 37, Table S6: Questionnaire 1, question 38, Table S7: Questionnaire 2,
question 10, Table S8: Questionnaire 2, question 14, Table S9: Concerns about EV uptake by ICEV motorists in
selected regions.
Author Contributions: Conceptualization, G.H.B., D.D., G.M.; Methodology, G.H.B., G.M. and D.D.;
Validation, G.H.B.; Formal Analysis, G.H.B.; Investigation, G.H.B.; Resources, G.H.B.; Data Curation, G.H.B.;
Writing—Original Draft Preparation, G.H.B.; Writing—Review & Editing G.H.B., G.M. and D.D.; Visualization,
G.H.B.; Supervision, G.M.; Project Administration, G.H.B.; Funding Acquisition, Not applicable.
Funding: This research received no external funding.
Acknowledgments: This research did not receive any specific grant from funding agencies in the public,
commercial, or not-for-profit sectors.
Conflicts of Interest: The authors declare there is no conflict of interest.
Nomenclature/Acronyms
AUD Australian Dollar
BEV Battery Electric Vehicle (relies only on mains electricity for battery recharge)
EV Electric vehicle (includes all types of plug-in electric cars)
GHG greenhouse gas emissions
HOV High Occupancy Vehicle (or transit) lanes
ICEV Internal combustion engine vehicle
plug-in hybrid electric vehicle uses mains electricity to recharge the battery, as well as
PHEV
petrol/diesel to generate additional energy for propulsion
References
1. UNFCCC. Report of the Conference of the Parties on Its Fifteenth Session, Held in Copenhagen from 7 to 19
December 2009, Addendum, Part Two: Action Taken by the Conference of the Parties at Its Fifteenth Session.
UNFCCC 2010. [CrossRef]
2. Broadbent, G.H.; Drozdzewski, D.; Metternicht, G. Electric Vehicle Adoption: An Analysis of Best Practice
and Pitfalls for Policy Making from Experiences of Europe and the US. Geogr. Compass 2017. [CrossRef]World Electric Vehicle Journal 2019, 10, 11 13 of 15
3. CCA. Opportunities to Reduce Light Vehicle Emissions in Australia; Climate Change Authority, Australian
Government: Melbourne, Australia, 2015. Available online: http://www.climatechangeauthority.gov.
au/reviews/light-vehicle-emissions-standards-australia/opportunities-reduce-light-vehicle-emissions
(accessed on 22 December 2018).
4. Nilsson, M.; Nykvist, B. Governing the Electric Vehicle Transition: Near Term Interventions to Support a
Green Energy Economy. Appl. Energy 2016, 179, 1360–1371. [CrossRef]
5. Lutsey, N.; Searle, S.; Chambliss, S.; Bandivadekar, A. Assessment of Leading Electric Vehicle Promotion
Activities in United States Cities. Washington DC. 2015. Available online: http://www.theicct.org/sites/
default/files/publications/ICCT_EV-promotion-US-cities_20150729.pdf (accessed on 22 December 2018).
6. FCAI. FCAI Sales Cars. Federal Chamber of Automotive Industries VFACTS, 2017. Available online:
http://www.fcai.com.au/sales/cars (accessed on 3 February 2018).
7. Berckmans, G.; Messagie, M.; Smekens, J.; Omar, N.; Vanhaverbeke, L.; van Mierlo, J. Cost Projection of State
of the Art Lithium-Ion Batteries for Electric Vehicles up to 2030. Energies 2017, 10, 1314. [CrossRef]
8. Nykvist, N.; Nilsson, M. Rapidly Falling Costs of Battery Packs for Electric Vehicles. Nat. Clim. Chang. 2015,
5, 329–332. [CrossRef]
9. Shankleman, J. The Electric Car Revolution Is Accelerating. Bloomberg Businessweek. 6 July 2017. Available
online: https://www.bloomberg.com/news/articles/2017-07-06/the-electric-car-revolution-is-accelerating
(accessed on 22 December 2018).
10. Department of Environment and Energy. Australian Emissions Projections. Canberra, ACT; 2016. Available
online: https://www.environment.gov.au/system/files/resources/9437fe27-64f4-4d16-b3f1-4e03c2f7b0d7/
files/aust-emissions-projections-2016.pdf (accessed on 7 July 2017).
11. Australian Bureau of Statistics. 3218.0—Regional Population Growth, Australia, 2016–17. Canberra, ACT; 2018.
Available online: http://www.abs.gov.au/ausstats/abs@.nsf/mf/3218.0 (accessed on 22 December 2018).
12. Australian Bureau of Statistics. 9208.0—Survey of Motor Vehicle Use, Australia, 12 Months Ended 30 June
2016. Canberra; 2017. Available online: http://www.abs.gov.au/AUSSTATS/abs@.nsf/DetailsPage/9208.
012monthsended30June2016?OpenDocument (accessed on 22 December 2018).
13. Greaves, S.; Backman, H.; Ellison, A.B. An Empirical Assessment of the Feasibility of Battery Electric Vehicles
for Day-to-Day Driving. Transp. Res. Part A Policy Pract. 2014, 66, 226–237. [CrossRef]
14. Gardner, J.; Quezada, G.; Paevere, P. Social Study on Attitudes, Drivers and Barriers to the Uptake of Electric
Vehicles, (An Electric Driveway Project Report); Commonwealth Scientific and Industrial Research Organisation
(CSIRO): Canberra, Australia; Report Number: EP113815; Australia; 2011. Available online: https://
publications.csiro.au/rpr/download?pid=csiro:EP113815&dsid=DS3 (accessed on 22 December 2018).
15. Higgins, A.; Paevere, P. Diffusion Modelling of Electric Vehicle Uptake: Methodology and Case Study
for Victoria. Australian Commonwealth Scientific and Industrial Research Organisation (CSIRO), 2011.
Available online: https://www.researchgate.net/publication/283539744_Spatial_Modelling_of_Electric_
Vehicle_Uptake_and_Electricity_Grid_Impacts_in_Australia (accessed on 22 December 2018).
16. Smith, B.; Olaru, D.; Jabeen, F.; Greaves, S. Electric Vehicles Adoption: Environmental Enthusiast Bias in
Discrete Choice Models. Transp. Res. Part D Transp. Environ. 2017, 51, 290–303. [CrossRef]
17. Kollmuss, A.; Agyeman, J. Mind the Gap: Why Do People Act Environmentally and What Are the Barriers
to. Environ. Educ. Res. 2002, 8, 239–260. [CrossRef]
18. Lane, B.; Potter, S. The Adoption of Cleaner Vehicles in the UK: Exploring the Consumer Attitude-Action
Gap. J. Clean. Prod. 2007, 15, 1085–1092. [CrossRef]
19. Bator, F.M. The Anatomy of Market Failures. Q. J. Econ. 1958, 72, 351–379. Available online: https://courses.cit.
cornell.edu/econ335/out/bator_qje.pdf (accessed on 22 December 2018). [CrossRef]
20. Rogers, E.M. Diffusion of Innovations, 5th ed.; The Free Press: New York, NY, USA, 2003.
21. Leech, N.L.; Onwuegbuzie, A.J. A Typology of Mixed Methods Research Designs. Qual. Quant. 2009, 43,
265–275. [CrossRef]
22. Krause, R.M.; Carley, S.R.; Lane, B.W.; Graham, J.D. Perception and Reality: Public Knowledge of Plug-in
Electric Vehicles in 21 U.S. Cities. Energy Policy 2013, 63, 433–440. [CrossRef]
23. Bergman, M.M. 5 Methodological Issues in Conducting Mixed Methods Research; Sage Publishing: Thousand Oaks,
CA, USA, 2008; pp. 66–83.
24. Survey Monkey. 2015. Available online: https://www.surveymonkey.com/ (accessed on 3 July 2015).World Electric Vehicle Journal 2019, 10, 11 14 of 15
25. Winchester, H.P.M. Ethical Issues in Interviewing as a Research Method in Human Geography. Aust. Geogr.
1996, 27, 117–131. [CrossRef]
26. Bryman, A. Social Research Methods, 4th ed.; Oxford University Press: Oxford, UK, 2012.
27. Hay, I. (Ed.) Qualitative Research Methods in Human Geography, 2nd ed.; Oxford University Press: Melbourne,
Australia, 2005.
28. Figenbaum, E.; Kolbenstvedt, M.; Elvebakk, B. Electric Vehicles—Environmental, Economic and Practical
Aspects—As Seen by Current and Potential Users TØI Report 1329/2014. Oslo. 2014. Available
online: https://www.toi.no/getfile.php/Publikasjoner/T\T1\OIrapporter/2014/1329-2014/1329-2014-
el.pdf (accessed on 22 December 2018).
29. Figenbaum, E.; Kolbenstvedt, M. Learning from Norwegian Battery Electric and Plug-in Hybrid Vehicle
Users Report 1492/2016. Oslo. 2016. Available online: https://www.toi.no/getfile.php?mmfileid=43161
(accessed on 22 December 2018).
30. Jensen, A.F.; Cherchi, E.; Mabit, S.L. On the Stability of Preferences and Attitudes before and after
Experiencing an Electric Vehicle. Transp. Res. Part D Transp. Environ. 2013, 25, 24–32. [CrossRef]
31. Needell, Z.A.; McNerney, J.; Chang, M.T.; Trancik, J.E. Potential for Widespread Electrification of Personal
Vehicle Travel in the United States. Nat. Energy 2016, 16112. [CrossRef]
32. UK DfT. Public Attitudes towards Electric Vehicles: 2016 (Revised). 2016. Available online: https://www.gov.
uk/government/statistics/public-attitudes-towards-electric-vehicles-2016 (accessed on 22 December 2018).
33. Egbue, O.; Long, S. Barriers to Widespread Adoption of Electric Vehicles: An Analysis of Consumer Attitudes
and Perceptions. Energy Policy 2012, 48, 717–729. [CrossRef]
34. Lieven, T. Policy Measures to Promote Electric Mobility—A Global Perspective. Transp. Res. Part A Policy
Pract. 2015, 82, 78–93. [CrossRef]
35. Sierzchula, W.; Bakker, S.; Maat, K.; van Wee, B. The Influence of Financial Incentives and Other
Socio-Economic Factors on Electric Vehicle Adoption. Energy Policy 2014, 68, 183–194. [CrossRef]
36. Fulton, L.; Tal, G.; Tarrantine, T. Can We Achieve 100 Million Plug-in Cars by 2030? Research Report
UCD-ITS-RR-16-07. Davis. 2016. Available online: https://its.ucdavis.edu/research/publications/
(accessed on 2 July 2017).
37. Bjerkan, K.Y.; Nørbech, T.E.; Nordtømme, M.E. Incentives for Promoting Battery Electric Vehicle (BEV)
Adoption in Norway. Transp. Res. Part D Transp. Environ. 2016, 43, 169–180. [CrossRef]
38. Figenbaum, E. Perspectives on Norway’s Supercharged Electric Vehicle Policy. Environ. Innov. Soc. Transit.
2017, 25, 14–34. [CrossRef]
39. Lévay, P.Z.; Drossinos, Y.; Thiel, C. The Effect of Fiscal Incentives on Market Penetration of Electric Vehicles:
A Pairwise Comparison of Total Cost of Ownership. Energy Policy 2017, 105, 524–533. [CrossRef]
40. Tietge, U.; Diaz, S.; Mock, P.; German, J.; Bandivadekar, A.; Ligterink, N. From Laboratory to Road—A 2016
Update of Official and ‘Real-World’ Fuel Consumption and CO2 Values for Passenger Cars in Europe; International
Council on Clean Transportation: Berlin, Germany, 2016; Available online: https://www.theicct.org/
publications/laboratory-road-2016-update (accessed on 22 December 2018).
41. Mersky, A.C.; Sprei, F.; Samaras, C.; Qian, Z. Effectiveness of Incentives on Electric Vehicle Adoption in
Norway. Transp. Res. Part D Transp. Environ. 2016, 46, 56–68. [CrossRef]
42. Brown, G.E.G., Jr. EXECUTIVE ORDER B-16-2012. USA; 2012. Available online: https://www.gov.ca.gov/
news.php?id=17472 (accessed on 22 December 2018).
43. California Senate. Electric Vehicle Charging Stations Open Access Act. 2013. Available online: http://leginfo.
legislature.ca.gov/faces/billNavClient.xhtml?bill_id=201320140SB454 (accessed on 22 December 2018).
44. California Assembly. AB 2565, Muratsuchi. Rental Property: Electric Vehicle Charging Stations. USA; 2014.
Available online: https://leginfo.legislature.ca.gov/faces/billNavClient.xhtml?bill_id=201320140AB2565
(accessed on 22 December 2018).
45. Shahan, C. California Bill Allows Renters to Install Electric-Car Charging Stations. Clean Technica. 31 August
2014. Available online: http://cleantechnica.com/2014/08/31/california-bill-renters-install-electric-car-
charging-stations/ (accessed on 22 December 2018).
46. Simpson, C. Car Tech Living in an Apartment Block? You Can Finally Charge Your Electric Car. Gizmodo
Australia. May 2015. Available online: http://www.gizmodo.com.au/2015/05/jet-charge-makes-buying-
an-electric-car-easy-for-apartment-owners/ (accessed on 22 December 2018).World Electric Vehicle Journal 2019, 10, 11 15 of 15
47. Wolin, L.D. Gender Issues in Advertising—An Oversight Synthesis of Research: 1970–2002. J. Adv. Res. 2003,
43, 111–129. [CrossRef]
48. Kempf, D.S.; Laczniak, R.N.; Smith, R.E. The Effects of Gender on Processing Advertising and Product Trial
Information. Mark. Lett. 2006, 17, 5–16. [CrossRef]
49. McCright, A.M. The Effects of Gender on Climate Change Knowledge and Concern in the American Public.
Popul. Environ. 2010, 32, 66–87. [CrossRef]
50. Cahill, E.; Davies-Shawhyde, J.; Turrentine, T.S. New Car Dealers and Retail Innovation in California’s Plug-In
Electric Vehicle Market. Davis. 2014. Available online: https://merritt.cdlib.org/d/ark:%252F13030%
252Fm5xp8k5z/1/producer%252F894403654.pdf (accessed on 22 December 2018).
51. Cahill, C. Plug In America Blazes a Trail to Market for PEVs. Plug in America. 2016. Available online:
https://pluginamerica.org/plug-america-blazes-trail-market-pevs/ (accessed on 22 December 2018).
52. Nayum, A.; Klockner, C.A. A Comprehensive Socio-Psychological Approach to Car Type Choice.
J. Environ. Psychol. 2014, 40, 401–411. [CrossRef]
53. Jansson, J.; Pettersson, T.; Mannberg, A.; Brännlund, R.; Lindgren, U. Adoption of Alternative Fuel Vehicles:
Influence from Neighbors, Family and Coworkers. Transp. Res. Part D Transp. Environ. 2017, 54, 61–73.
[CrossRef]
© 2019 by the authors. Licensee MDPI, Basel, Switzerland. This article is an open access
article distributed under the terms and conditions of the Creative Commons Attribution
(CC BY) license (http://creativecommons.org/licenses/by/4.0/).You can also read