The future of motor insurance - How car connectivity and ADAS are impacting the market A joint whitepaper by HERE and Swiss Re - The Digital Insurer
←
→
Page content transcription
If your browser does not render page correctly, please read the page content below

The future of
motor insurance
How car connectivity and ADAS
are impacting the market

A joint whitepaper by HERE and Swiss Re

                                          1
Contents

    Introduction                                                     5

    The motor insurance market today                                 6

    The growth of car connectivity                                   9

    The growth of ADAS                                              10

    Consumer interest in car connectivity and ADAS                  12

    Case study: the implications of car connectivity and ADAS       13

    Business opportunities arising from car connectivity and ADAS   18

    Context-aware Vehicle Behavior Analytics (VBA)                  22

2                                      3
Introduction
    For the automotive industry, relatively little has
    changed over the past three decades – until now.
    New driver assistance technologies and connected
    services are ushering in a whole new world of mo-
    toring. In this new world, the driver hands over ever
    greater responsibility for his or her driving decisions
    to the vehicle. On the road today there are already
    cars with advanced driver assistance systems (ADAS)
    such as lane-keeping assist or emergency braking that
    are edging us closer to an autonomous future.

    Our relationship with the car is changing, too. Car
    ownership is on the decline, particularly among urban
    millennials and other city dwellers, as people factor
    in the perceived high cost of car ownership as well
    as alternatives such as ride hailing and car sharing.
    Seemingly, the car is becoming but one node in a
    broader network of available transport options.

    For both insurers and automakers, this upheaval in the
    automotive industry and broader mobility ecosystem
    presents both challenges and opportunities. In this
    whitepaper, HERE and Swiss Re have teamed up to
    take a look at how two important developments in
    particular – the growth of car connectivity and ADAS
    take-rate – could impact the market for and distribu-
    tion of motor insurance. We focus on the potential
    implications of improved road safety and discuss how
    car connectivity could create a system of engagement
    around the car where the vehicle is not merely a means
    of getting from A to B but a conduit for new per-
    sonalized services for car owners and mobility users
    alike, in turn creating new business opportunities for
    automakers and the insurance sector.

4                                                             5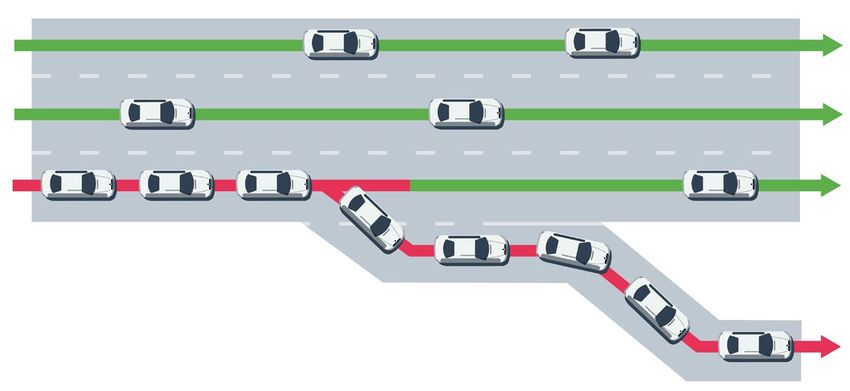
The motor insurance
market today
Figure 1 Figure 2
Motor insurance business is the most important Motor insurance Motor insurance penetration
Motor insurance Motor insurance
line of business globally in global markets in emerging markets in developed markets
Motor insurance Motor insurance Motor insurance
Motor insurance represents 42% of all non-life gross premium of Motor insurance penetration
in global markets in emerging markets in developed markets
total Property and Casualty insurance market (premiums as a % of GDP)
Motor insurance penetration (premiums as a % of GDP)
42% 38%
(Swiss Re Economic Research & Consulting)
700B USD
42% 500B USD
Motor insurance
Motor insurance
Motor insurance Motor insurance
Motor insurance
Motor insurance Motor insurance
Motor 42%
insurance
Motor insurance 58% 38%
58% 42% 200B USD 1.4%
62%
n global markets
in globalinmarkets
global markets in emerging
in emerging
markets
in emerging
marketsmarkets in developed
in developed
markets
in
700Bdeveloped
marketsmarkets
USD 500B USD Canada
58%
58% 200B USD 62% 1.2%
United States
South Africa Italy
1.0% Japan Luxembourg
France Switzerland
42% 42% 42% 38% 38% 38% Motor insurance Other P&C China
700B USD 700B USD700B USD
42% 42% 42% 500B USD 500B USD500B USD 0.8%
United Kingdom
Brazil Poland Germany Australia
58% 58% 58%
58% 58% 58% 200B USD 200B USD200B USD 62% 62% 62%
Motor insurance Other P&C
0.6%
Colombia
Russia
0.4% Mexico
India United Arab Emirates
Saudi Arabia
0.2% Hong Kong
Indonesia
Motor insurance
Motor insurance Motor insurance
Other P&C Other P&C
Other P&C Nigeria
0.0%
0.1 1 10 100 1000
Growth in % 2015-2016E 2016E-2026E
World 3.5% 6.8% GDP per capita in 1000 USD
Advanced markets 1.0% 4.1%
Emerging markets 14.0% 11.2% Source: Swiss Re, 2015 Source: Swiss Re, 2015
The World Health Organization (WHO) estimates that Considering the above, the role of insurance is hard Motor insurance is highly correlated with the eco- loss frequency and severity at the same time. The
road traffic accidents kill 1.2 million people every year, to ignore. Motor insurance premium growth has been nomic performance of countries (Figure 2). Although impact on motor insurance will grow as cars evolve
costing economies between 1%–3% of their gross diverging in advanced and developing markets over advanced economies are showing signs of recovery, and move up in the level of technological automation,
national product1. The cost derives from: the last decade (Figure 1). While motor insurance motor insurance premiums will remain under pres- from limited and partial automation to highly and fully
has expanded rapidly in emerging markets, premium sure, not least from disruptive technologies, which automated functionality.
• Treatment for people injured and/or rendered dis- growth in the more mature advanced markets has drive changes in motor vehicle safety and impact both
abled by accidents stagnated. The outlook for advanced economies,
• Reduced productivity of family members who work however, is improving, and is expected to pick up in
fewer hours to take care of the victims line with economic growth over the forecast horizon.
• Replacing or repairing vehicles Emerging markets, meanwhile, will slow slightly, but
• Costs of incident investigation still outperform.
• Cost of road maintenance, such as road infrastruc-
ture repairs after serious accidents and the associa- 1
Source: Global Status Report on Road Safety. World Health
ted labor costs Organization, 2015
6 7The growth of car
connectivity
Number of connected cars sold annually by connectivity type(M)
Figure 3 Figure 4: Number of connected cars sold annually by connectivity type (Millions)
Forecast of motor insurance premium, taking
into account impact of technology (not taking 90 CE Device Telematics
into account inflation and assuming 100% ADAS 80
adoption rate) 70 Embedded Telematics
60
HybridTelematics
50
Premium
(US bn) 40 Total
30
1400.00 20
10
0 Source: IHS Trax, 2014
1200.00
2014 2015 2016E 2017E 2018E 2019E 2020E 2021E 2022E
Effect of AV
technology
1000.00
800.00
Even though cars have turned into complex comput- to enhance ADAS functionality. In the long-term, cars
ing environments, for the most part, they still remain will link to the Internet of Things (IoT) , communicating
600.00
unconnected. With car manufacturers now racing to with other vehicles (vehicle-to-vehicle, or V2V, com-
equip their vehicles with connectivity options, that is munication) and to the surrounding infrastructure
400.00 changing. The ‘connected car’ is very much part of our (vehicle-to-infrastructure, or V2I).
vocabulary, but while the vast majority of the general
2015 2020E 2025E 2030E 2035E Year
public has heard about connected cars, in 2014 only We expect that by 2020, more than two-thirds of cars
Total Motor Premium (taking into account AV technology) Total Motor Premium without AV impact 15% knew what they can actually do, according to a sold worldwide will have some form of connectivity.
survey co-conducted by Nielsen and SBD2. The adoption of hybrid telematics solutions (which
14 largest motor markets: Brazil, Canada, China, Egypt, France, Source: Swiss Re, 2015 feature both embedded and Consumer Electronics
Germany, India, Indonesia, Italy, Japan, Mexico, Russia, UK, US
Connectivity comes in two shapes: embedded and Device tethered connectivity) will grow the fastest,
tethered. If embedded, the connectivity is enabled with a compound annual growth rate (CAGR) of about
by a receiver unit built into the vehicle itself. Sub- 88%. The fast proliferation of hybrid telematics may
scription models, similar to prepaid cards for mobile partly be a consequence of drivers wanting to bring
We have compiled a forecast of the market for motor market would be worth an estimated USD 594 billion. phone, are the typical business model offered by car familiar smartphone interfaces into the car or simply
insurance over the long term in the fourteen largest This suggests that within a six-year period just over manufacturers. If tethered, the car gets connected via a reluctance to use new or different interfaces.
automobile markets, factoring in the anticipated im- USD 20 billion would be trimmed from annual premi- a third-party system, such as smartphones or other
pact of vehicle automation technology. As Figure 3 ums as a result of increased road safety enabled by consumer electronic devices. In this case, to access the As shown in Figure 4, the number of cars with embed-
shows, premiums are expected to grow from USD 510 automated car technology. This reduction would be Internet, the driver uses the data plan of the device. ded and tethered connectivity will be growing with a
billion in 2015 to USD 616 billion in 2020, if vehicle greater were it not for global car sales growth, mainly CAGR of 20%.
automation technology would be held constant at fueled by growth in emerging Asia, in China and India Basic car connectivity, provided by mobile phones
2015 levels and inflation effects were excluded. Taking in particular, which will become the largest markets for allows for connected services, such as real-time nav- By 2020, approximately 260 million connected cars will
into account technological development, in 2020 the motor insurance by 2025 in terms of volume. igation or usage-based insurance. With embedded be on the roads worldwide. Since modern upscale cars
connectivity, it becomes possible for the vehicle to are equipped with dozens of sophisticated sensors,
transmit data generated by its on-board sensors to there are vast streams of driver data that could be
the cloud, enabling for more sophisticated connected aggregated, processed, analyzed and harnessed for
services, such as live contextual data from the cloud different purposes.
2
Re-defining Success, SBD and Nielsen, Mobility Telematics
Autonomous, Automotive Detroit, June 3/4, 2015
8 9The growth of ADAS
Figure 5 Figure 6
ADAS units production by regions (M) ADAS Application Production - Percentage of Total
100% Overall, the market for
Adaptive Cruise Control
ADAS units production by region (M) ADAS could grow to
Automatic High Beam Control more than $20 Billion in
2020.
200 Autonomous Park Assist
90 80%
Blind Spot Information
80
Driver Monitoring
70
60 Forward Collision Warning
60%
50
40 Front Lighting
30
Lane Departure Warning
20 Night Vision
40%
10
0
2015 2016E 2017E 2018E 2019E 2020E
Park Assist
North America Europe China Japan South Korea Rest of the World Total
20%
Surround-view Park Assist
Traffic Sign Recognition
0%
Source: IHS Trax, 2015 Source: IHS Trax, 2015
2015 2016E 2017E 2018E 2019E 2020E
Compared to their older counterparts, modern cars According to research company IHS, the number of Park Assist remains the most popular type of ADAS
are not only connected but also smart. One of the vehicles manufactured annually will reach 105 million (Figure 6). Its share of production, however, will di-
technologies underpinning this trend is Advanced by 2020. However, the number of ADAS units produced minish as other ADAS increase at a faster rate. These
Driver Assistance Systems (ADAS). ADAS are designed in 2020 is expected to be significantly higher – approx- include lane departure warning, forward collision
to automate and adapt vehicle systems, as well as in- imately 180 million. These estimates assume that on warning, and traffic sign recognition.
crease road safety. The most common types of ADAS average there will be 1.7 ADAS installed per car. How-
on the market are currently focused on collision avoid- ever, the distribution of production will not be equal:
ance, such as forward collision warning and blind spot
information, as well as driver aids, such as park assist, Figure 5 shows how the market is expected to evolve
adaptive cruise control and automatic high beam con- in the next four years.
trol. Car connectivity is expected to further enhance
ADAS by enabling the delivery of real-time data to • In 2020, North America, Europe, China and Japan
the driver. This has become known in the industry as are forecast to account for 92% of the global ADAS
‘connected ADAS’, and is regarded as a key step on production and for 93% of the global ADAS revenue
the path to highly automated and, ultimately, fully of USD 20.5 billion
automated driving. • The rates of ADAS production growth are projected
to be the highest in Europe and North America – with
a CAGR of 22%
10 11Consumer interest
in car connectivity
and ADAS
Figure 7
Raw year-over-year difference in consumer interest
in purchasing each ADAS feature (2014-2015)
Case study:
Lane departure warning
-5% 0% 5% 10% 15%
the implications
of car connectivity
US
Speed alert
Europe
Night vision
China
Fully autonomous driving
and ADAS
Autonomous park assist
Autonomous highway driving
Adaptive front lights
Driver monitoring
Adaptive cruise control
Blind spot detection
Forward collision warning
Autonomous driving
-5% 0% 5% 10% 15%
Source:
n=4400; USA, Western Europe, China Strategy Analytics, 2015
Unsurprisingly, consumer interest in car connectivity is interest in ADAS features as well as the willingness
growing. McKinsey’s Connected Car Consumer Survey to pay for them rose significantly from the previous
2015 found that “over the past year, the share of year (see Figure 7). Blind spot detection and night
customers willing to switch their car brand for better vision were the top two features for which consumers
connectivity has almost doubled from 20 percent in are ready to pay. On the other hand, the willingness
2014 to 37 percent in 2015”. to pay for highly automated driving features remains
relatively low. The reason for this may be that consum-
Interest in ADAS features is also on the rise. A 2015 ers are unfamiliar with the technology. We anticipate
consumer study which Strategy Analytics conducted this would change as consumer awareness of ADAS
revealed that in Europe, the U.S. and China the overall benefits grows.
12 13Figure 8 Figure 9
10 major contributory factors for road accidents, Accident reduction rate by selected features,
by road class (the percentages do not add up to assuming 100% adoption and usage rate for each
10 major100% as an accident
contributory factorscan
forhave
roadmore than one
accidents, by road class feature in 2020
contributory factor) 3
Driver failed to look properly
Driver failed to judge other driver‘s path/speed
Accident reduction rates by selected features, assuming
Driver careless, reckless or in a hurry 100% adoption and usage rate for each feature in 2020
Loss of control Basic ADAS Sophisticated ADAS Advanced ADAS
0%
Poor turn or manoeuvre -10%
-11.6%
-20%
-16.3%
Pedestrian failed to look properly -30%
-27.5% -25.7% -27.5%
-40%
Slippery road (due to weather)
-50% -45.4%
Travelling too fast for conditions
Other Roads Motorway
Sudden braking
Following too close
0% 5% 10% 15% 20% 25% 30% 35% 40% 45%
Total Other Roads Motorway
Source: UK
Department for
Transport, 2013-2015 Source: Swiss Re, 2015
To better understand the extent to which car con- jor contributory factors for road accidents are shown Our study analyzed each accident category and the sophisticated or advanced ADAS features, assuming
nectivity and ADAS might reduce the frequency of in Figure 8. The driver’s failure to look properly or potential impact of selected ADAS features on the that they are fully utilized at all times possible:
accidents, Swiss Re looked at statistics from the UK to judge another person’s path/speed are the most frequency of accidents in these categories, differen-
Department for Transport, which included insights into common cause of accidents on both urban roads and tiating between motorways and other roads. • Basic ADAS would reduce accidents on motorways
why and how traffic accidents happen. The ten ma- motorways. by 16.3% and by 11.6% on other roads
The impact of the following technologies were esti- • Sophisticated ADAS would reduce accidents on
mated: motorways by 25.7% and on other roads by 27.5%
• Advanced ADAS would reduce accidents on
• Basic ADAS: including forward collision warning, motorways by 45.4% and on other roads by 27.5%
blind-spot detection and lane-departure warning
• Sophisticated ADAS: lane keeping assistant, Based on these estimates, there would be a clear ben-
emergency braking assistant, night vision efit from all levels of ADAS functionality - notably the
• Advanced ADAS: highway pilot potential to cut motorway accidents nearly by half
using advanced ADAS.
The results in Figure 9 show how many accidents could
3
The statistics only cover accidents that were reported to the
be reduced by driving a car equipped with either basic,
police. Minor accidents, such as parking accidents, are not
reflected in the statistics.
14 15Figure 10
2020 scenario for accident frequency reduction,
taking into account ADAS technology adoption rates
2020 Scenario for accident frequency reduction, taking into account ADAS technology adoption rates
Other roads Motorway Total
0.00%
-0.2% -0.3% -0.2%
-1.00%
-2.00%
-3.6% -3.4% -3.6%
-3.00%
-4.00%
-0.5% -0.6% -0.5%
-5.00%
Basic ADAS Sophisticated ADAS Advanced ADAS
Source: Swiss Re, 2015
We developed a scenario for 2020 that takes into con- assist will help reduce this. Furthermore, connect-
sideration different adoption rates for each feature ed car services, such as mobility management, will
(Figure 10). While it is assumed that the accident cate- contribute to the reduction of accidents occurring
gories and frequencies will be similar as in 2009-2013, during parking and maneuvering as well simply by
we estimated the adoption rates of each feature based virtue of reducing the amount of time drivers spend
on the data from Highway Loss Data Institute (HLDI)4. looking for a parking spot.
By 2020, basic, sophisticated and advanced ADAS is ADAS also plays a critical role in mitigating the se-
expected to reduce accidents by 4.3%. The advanced verity of road traffic accidents. The utility of, for ex-
ADAS (highway pilot) reduces accidents by just 0.2%, ample, forward collision and lane-departure warning
as the adoption rate is expected to still be rather low. functionalities, for example, has been shown in an
If the accident reduction effects of car connectivity IIHS study on the Honda Accord to reduce the im-
are also taken into account, the reduction rate would pact of collisions, leading to less severe injuries,
be approximately 6%. lower repair costs and consequently lower insur-
ance claims6.
This forecast is informed by historical data that re-
flects only accidents reported to the police. A signi-
ficant share of vehicle accidents occur during park- 4
Highway Loss Data Institute. 2014. Predicted availability
ing or maneuvering, for which a police report often of safety features on registered vehicles – an update.
Loss Bulletin. Vol. 31, No. 15. Arlington, VA
is not filed. Allianz estimated that 40% of vehicle
accidents incurring physical loss or damage occur 5
https://www.allianz.com/en/press/news/commitment/
community/150505_a-sudden-bang-when-parking.html/
during parking or maneuvering5. Undoubtedly, ADAS
features such as park assist or autonomous park 6
http://www.iihs.org/iihs/sr/statusreport/article/49/4/2
16 17$ = Billion dollars
$9.79
Business opportunities Figure 11
This chart represents an interesting example of big
data analytics growth taken from the Telecom industry
$3.57
for insurance arising Big data analytics market size by business category
$8.55
from car connectivity $ = Billion dollars
$2.27
Customer experience
and ADAS $9.79
enhancement
$3.57
$6.84
$1.62
$8.55 $1.19 $1.32
$2.27
Innovative business
$5.26 Customer experience model
enhancement
$1.20 $0.85
$1.68
$1.92
$6.84
$1.62 $1.20
$3.95
It is conventional to think that the development of from adjacent industries and especially software-cen- $0.63 Operation efficiency
$0.92
driverless cars will proceed in a linear fashion with au- tric companies which have been honing their capabili- $1.19 $1.32
tomation progressively replacing human control. In all ties in big data processing and analytics. Furthermore,
$0.90 $2.29
likelihood, progress will depend on both the success in where disruptive innovations may have once taken $3.01 $2.34 Innovative business
$5.26 $0.50
model
developing core technical capabilities and on consum- many years to transform an industry, some researchers $0.75 $1.58
$1.20 $0.85
er comfort with new in-car automated driving features. highlight that new digital capabilities have compressed $2.35 $1.68
$0.70 $1.89
While Capgemini’s found that 65% of customers would the adjustment time considerably10. $0.63 $1.92
$0.42 Precise marketing
$1.95
let insurers monitor their driving behavior in exchange
$0.55 $1.20
$1.30
for lower premiums, there are also serious personal The list of potential competitors is long, ranging from $0.37
$3.95 $0.57
$0.63 Operation efficiency
privacy issues surrounding driver data which could established and emerging software and IT companies $0.92 $1.40
$0.33 $0.49
$0.84
prompt additional regulatory and legal barriers7. to traditional auto (parts) manufacturers. Automak- $1.12
$0.45 $0.90
ers may choose not to share the data they collect $3.01 $0.47 $2.29
$0.83 Real-time analysis
$2.34
Despite recent breakthroughs and signs of increased but rather use it to issue their own policies. KPMG’s $0.27 $0.64 & decision making
$0.75 $0.50 $0.53 $1.58
$0.39 $0.43
take-up of telematics or usage-based insurance (UBI) recent survey suggested that 58% of insurers believe $0.35
$2.35
policies the speed and scale of the impact of vehicle that original equipment manufacturers (OEMs) will be- $0.70 $1.89
$0.63 2013 2014 2015 2016E 2017E 2018E 2019E marketing
Precise 2020E
$0.42
connectivity on the insurance sector remains uncer- come a major distributor of vehicle insurance in the $1.95
tain. According to a survey by KPMG, the majority of future, while close to 40% believe that established $0.55
$0.37 $0.57 $1.30 Source: Heavy Reading, 2013
personal and commercial auto insurers do not antic- technology companies will also become direct sellers
$0.33 $0.49 $1.40
ipate a significant change to the market for at least of insurance11. $0.84
$1.12
another decade8. While insurers recognize the IOT is $0.45
$0.47
$0.83 Real-time analysis
an important factor in shaping their future prospects, 7
World Insurance Report, Capgemeni, 2015 $0.27
The biggest opportunity for insurers
$0.64 related to car The opportunity for making
& decision insurers also extends beyond the
$0.53
at least a quarter of executives believe it is too early $0.35 connectivity
$0.39 is
$0.43 usage-based insurance (UBI). Products vehicle. By combining vehicle data with information
to say what the impact will be9. 8
Automobile insurance in the era of autonomus vehicles, KPMG, based on how often, where and how people drive en- from other sources, such as smartphones or public
June 2015. 2013 2014 insurers
2015
able to price2016E
the risks 2017E 2018E which
more accurately, 2019E 2020Esystems, an insurer could build a more com-
transit
Despite the uncertain outlook, doing nothing is not a 9
Are insurers ready for the Internet of Things?, Celent, can result in lower premiums for the insured taking plete picture of a driver’s usage of mobility services
October 2014.
viable option: insurers must take strategic decisions less risk. The demand for insurance policies based irrespective of the type of transportation they use.
now about how to thrive in an era of data-driven in- 10
Big Bang Disruption, Harvard Business Review, March 2013. on vehicle-based telematics has been growing and This paves the way for insurers to develop new types
surance. Delays in adapting business models may leave we expect the variety of policies available to increase. of policies that insure a user for their broader mobility
11
Automobile insurance in the era of autonomus vehicles, KPMG,
insurers vulnerable to competition from new entrants June 2015. and not just driving.
18 19Figure 12
Figure 12 shows the components of an insurer’s com-
An insurer’s combined ratio
The combined ratio is the sum of the expenses and the incurred bined ratio. The impact of ADAS on these components
losses (+loss adjustment expenses) divided by the premiums
is discussed in the following sections:
earned. It measures an insurer’s profitability in its underwriting
operations. A combined ratio < 100% indicates that an
underwriting profit is generated, whereas a combined ratio >
1. Acquiring
100% suggests an underwriting loss, as the insurance company
pays out more claims than it earns in premiums. However, even Increased car connectivity and the creation of a vehicle-to-infrastructure (V2I) data transmission will
with a combined ratio >100%, an insurer can still make profit, as
system of engagement around the car, opens new inform drivers of hazards and dangerous situations
the combined ratio does not include investment returns.
distribution channels for selling motor insurance they would not normally notice, prompting them to
or cross-selling different insurance products to the take evasive action. According to a US Department of
driver. By exploiting in-car telematics, insurers can Transportation report, combined V2V and V2I systems
learn more about their customers to identify potential potentially address about 81% of all-vehicle target
opportunities to cross- and up-sell supplementary crashes; 83% of all light-vehicle target crashes; and
products and policy features. Furthermore, car man- 72% of all heavy-truck target crashes annually14.
ufacturers are becoming more interested in entering
the insurance value chain and distributing insurance. 5. Premiums
They understand that being the hub that collects As car connectivity and ADAS in principle lead to a
driver and vehicle data from embedded telematics reduction in expected losses for insurers, overall
devices in vehicles gives them an excellent position insurance premiums for drivers should decrease15. In
to distribute insurance or sell data to insurers12. Some a recent survey, 45% of insurance executives indicated
( Expenses + Losses ) / Premium = Combined ratio
manufacturers are already equipping vehicles with that as driverless vehicles enter the marketplace they
telematics devices and partnering with insurers. expect to reduce premiums on personal auto insur-
ance16. However, in judging the impact of the transition
2. Writing towards highly automated vehicles insurers need to
Connected cars generate vast quantities of data be alert to the potential for large unexpected loss-
which can enable insurers to select and price risks es that cannot be addressed simply by pooling risks
more accurately. over a large number of policyholders (and investing
the associated premiums in available financial assets).
3. Servicing Greater autonomy in motoring changes the nature of
Car connectivity simplifies the servicing of insurance insured risks with the result that overall aggregate loss
policies. By exploiting in-car telematics, insurers can outcomes may not become any more predictable and
offer additional services such as vehicle theft track- may indeed become more variable.
ing, automated emergency calls, vehicle diagnostics,
1. Acquiring 4. Claims 5. Premiums
breakdown notification, fuel efficiency, safe driving
2. Writing
tips and so on. These product features help an insurer
3. Servicing
12
For example, Renault-Nissan in cooperation with the Floow
to differentiate itself from other auto insurance pro- Insurance Telematics scoring platform has started to sell
viders and encourage customer loyalty in an increas- insurance policies.
ingly commoditized market place. Taken together with 13
In 2014, fraudsters attempted to defraud UK insurer, Aviva, out
the cost savings that new technology might bring, of £20,000 by fabricating personal injury claims related to a
motor accident. But on-board telematics devices showed that
such as the reduced potential for fraud13 and more the car was in fact nowhere near the alleged location of the
efficient claims handling, this can help support un- incident.
derwriting profitability even in the face of enhanced 14
The US Department of Transportation claims V2V
competition. communications could prevent up to 76% of all driving
collisions – see http://www.its.dot.gov/connected_vehicle/
connected_vehicle_research.htm#sthash.uebqPpqL.dpuf
4. Claims
15
In theory, a risk-neutral insurer will set actuarially fair
Car connectivity and the introduction of increas- premiums equal to the expected losses associated with the
ingly sophisticated driver-assist technologies and insurance contract.
autonomous driving will lead to significantly im- 16
Automobile insurance in the era of autonomous vehicles,
Swiss Re, 2015 proved road safety. Vehicle-to-vehicle (V2V) and KPMG, June 2015.
20 21Context-aware Figure 13
An illustration of Split Lane Traffic, a new feature
in HERE’s traffic product
Vehicle Behavior
Analytics (VBA)
Free-flowing Traffic
Congested Traffic
Source: HERE, 2015
A moving car generates a vast amount of data, yet the probe data points from large populations of vehicles, When seeking the context for a vehicle’s behavior, it Other data and technology-driven
potential value of this data has not been fully lever- which it then processes on its map. The result is a large is also useful to be able to examine what traffic con- insurance models
aged. Whether captured by embedded vehicle systems database of data points precisely assigned to different ditions were like on the road at a particular point in
or smartphones, most telematics or usage-based in- roadways, enabling HERE to understand better how time. This comparison with actual traffic conditions Insurers can also utilize databases of driver behavior
surance programs are fairly rudimentary, allowing for the broader population drives on almost any road. This allows us to understand the context in which a driver to offer a data-driven policy without having access to
the analysis of a limited array of data such as time, data is used to create comparative analytics popula- was traveling. For instance, a driver may have been data specifically taken from the customer’s car. Using
driving speeds and the amount of hard braking during tion models. A given driver’s data is then matched to traveling at 60 Kmh in a 50 Kmh zone, but if the major- its database of vehicle accident data, HERE is also able
an accident. the same roadway sections and normalized against ity of the traffic around him or her was also moving at to allocate a ‘safety score’ to each roadway to reflect
this population model to create a ‘driver score’ for the same speed this driver might have been behaving the estimated likelihood of an accident per given num-
Understanding driver behavior in the each roadway section. in the most appropriate and responsible manner. Sim- ber of vehicles. With this, HERE is identifying roadways
real world ilarly, by fusing data on driver behavior with weather where accidents are more likely than average – data
data, it could be determined that, while a driver was that can then be used to better assess the risk of a
Usage-based insurance programs could benefit from driving the speed limit, his speed was inappropriate driver’s typical routes, for example, to and from his
much deeper data analysis. It is possible to obtain given heavy rain had reduced visibility and increased or her place of work.
greater understanding and insight into vehicle when the risk of his tires slipping.
vehicle data is examined and understood alongside As more vehicles get connected, there are more op-
other data, such as location information and driver be- Figure 13 offers an illustration of the granularity portunities for insurers and automakers to analyze
havior. By utilizing a combination of different datasets, possible when you are able to layer driver data on individual driving behavior in the context of other dri-
insurers could find previously hidden or non-obvious a detailed model of the road that includes lane in- vers and other data not just retroactively, but in near
patterns and insights. With this, we enter the realm of formation. Current commercially available real-time real-time. Car connectivity enables them to establish
context-aware Vehicle Behavior Analytics (VBA). traffic products provide only the harmonic weighted regular touch points with drivers by using VBA as an
average speed of all roads, but the reality often is that early warning alert system that can also better predict
VBA offers opportunities for new underwriting models traffic moves at different speeds in individual lanes, new risks. An insurer could potentially issue targeted
that evaluate individual driving behavior in the context particularly at major junctions and road splits. The notifications directly to a customer’s dashboard to
of other drivers. This can be done in various ways. additional data precision enabled by features such as advise them, for example, that they should change
For example, as a provider of navigation and traffic Split Lane Traffic gives insurers increased confidence to winter tires a little earlier than usual due to an
services, HERE every day collects data from billions of in their risk calculations. anticipated cold snap.
22 23Possibilities for automakers tion and analysis. This will enable the entire industry to
benefit from the processing of data at scale to create
About us
For automakers specifically, being potentially able to more accurate and precise traffic services and road
offer data-driven insurance at the point of sale enables hazard warning systems. UBI and its offshoot VBA will
them to broaden their portfolios of financial services meanwhile enable insurers to tap into this rich pool of
and reposition themselves along the insurance value data to entirely rethink their existing risk calculation
chain, as well as delivering value-added services to processes. HERE, the location cloud company, enables rich, The Swiss Re Group is a leading wholesale provider
support their brand differentiation. Managing UBI sub- real-time location applications and experiences for of reinsurance, insurance and other insurance-based
scriptions in-house will grant automakers a chance to Currently, insurers have different approaches in tack- consumers, vehicles, enterprises and governments. forms of risk transfer. Dealing direct and working
keep in touch with customers, improving their custom- ling the transition towards the fully self-driving car. Backed by a consortium consisting of AUDI AG, BMW through brokers, its global client base consists of insur-
er relationship management programs. Drivers’ posi- Much effort is being expended in order to understand Group and Daimler AG, HERE believes that location ance companies, mid-to-large-sized corporations and
tive experiences with automakers as insurers will also how liability and policies will change. Some are moving technology will play a critical role in making our roads public sector clients. From standard products to tai-
affect the consumer preference towards a particular faster than others in building the capabilities needed safer, reducing traffic congestion, and improving the lor-made coverage across all lines of business, Swiss Re
car brand. And finally, a direct access to customers and to assess the automated features in vehicles and to quality of life of people living in cities. To learn more deploys its capital strength, expertise and innovation
their cars would create huge databases for delivering develop data-driven approaches to risk calculation. about HERE, including its work in the areas of connect- power to enable the risk-taking upon which enterprise
personalized recommendations. ed and automated driving, visit http://360.here.com. and progress in society depend. Founded in Zurich,
Going forward, differentiation and embedding new Switzerland, in 1863, Swiss Re serves clients through
Contextual data as the next frontier technologies will become key for insurers to prosper Authors a network of around 70 offices globally and is rated
for insurers amid this change. Clearly, UBI and, increasingly, VBA “AA-” by Standard & Poor’s, “Aa3” by Moody’s and “A+”
will provide opportunities for insurers to harness the Bernd Fastenrath – Product Marketing, by A.M. Best. Registered shares in the Swiss Re Group
Motor insurance is on the cusp of a transformation as power of driver data in order to offer more person- Digital Transportation Infrastructure holding company, Swiss Re Ltd, are listed in accordance
new technologies such as telematics pave the way to alized, customer-centric products to drivers. At the With a background that spans automotive and tele- with the International Reporting Standard on the SIX
safer roads and enable insurers to pursue data-driven same time, insurers must also prepare for a world communications, Bernd is exploring ways we can con- Swiss Exchange and trade under the symbol SREN. For
business models. Notwithstanding the emergence of where vehicle ownership is becoming less important nect our vehicles and road networks to enable new more information about Swiss Re Group, please visit:
new risks around data and software security within the for some. As myriad of changing mobility options be- kinds of services for consumers, enterprises and www.swissre.com or follow us on Twitter @SwissRe.
car, we expect that the growth of car connectivity and come available, insurers must consider how they might cities. These include automated driving, advanced
ADAS in the long run will reduce the overall risk and insure someone not just for use of a vehicle but for traffic management and more efficient business lo- Authors
accidents. This will in turn reduce the need for personal all risks associated with their mobility. gistics. Bernd is also supporting the work of HERE in
line motor insurance while increasing the importance the emerging area of analytics of vehicle data, which Andrea Keller – Business Development Manager,
of product liability covers. is harnessing location cloud technology to develop Swiss Re Automotive Solutions
data-driven business models in telematics. Andrea works in the newly set up Automotive Solutions
The big opportunity for insurers lies in harnessing data team within Swiss Re’s Casualty division. The team
from vehicles and other sources to more accurate- bernd.fastenrath@here.com explores re/insurance business opportunities around
ly price the risks of insuring drivers. How rapidly da- telematics and self-driving cars. Swiss Re aims to be
ta-driven models can be deployed of course depends Contributors a thought leader on this topic and wants to help its
on our ability to capture, process and harness data. clients navigate the challenging environment by of-
Today, data for the most part exists in siloes. However, Semira Martirosyan – Product Marketing Manager, HERE fering innovative solutions in this area.
efforts are underway to change this fragmented pic- Dora Heinkel - Marketing Intelligence Manager, HERE
ture. As a first critical step, the automotive industry is James Etheridge – Head of Media Relations, HERE andrea_keller@swissre.com
already working to agree on a standard way for vehicle Chuck Smolich – Sr. Manager Solution Development, HERE
sensor data to be transmitted to the cloud for aggrega- Contributors
Sebastiaan Bongers – Head Automotive Solutions, Swiss Re
Finn Krüger – Junior Economist, Swiss Re Economic Research
& Consulting
Darren Lee Pain – Senior Economist, Swiss Re Economic
Research & Consulting
Cheuk On Li – Intern, Swiss Re Group Strategy & Development
24 25About HERE
HERE, the location cloud company, enables rich, real-time location applications and experiences for consumers, vehicles, enterprises
and governments. Backed by a consor tium consisting of AUDI AG, BMW Group and Daimler AG, HERE believes that location technology
will play a critical role in making our roads safer, reducing traffic congestion, and improving the quality of life of people living in
cities. To learn more about HERE, including its work in the areas of connected and automated driving, visit http://360.here.com.
HERE Deutschland GmbH HERE Deutschland GmbH Geschäftsfürer:
Invalidenstr. 116 Sitz der Gesellschaft: Berlin Michael Bültmann
10115 Berlin, Germany Amtsgericht Charlottenburg, Berlin Rober tus A. J. Houben
T +49 0 30 28 873 304 HRB 106443 B here.com
© 2016 Swiss Re. All rights reserved.
The entire content of this white paper is subject to copyright with all rights reserved. The information may be used for private or
internal purposes, provided that any copyright or other proprietary notices are not removed. Electronic reuse of the data published
in sigma is prohibited.
Reproduction in whole or in par t or use for any public purpose is permitted only with the prior written approval and if the source
reference “The future of motor insurance, How in-car connectivity and ADAS are impacting the market” is indicated. Cour tesy copies
are appreciated.
Although all the information used in this study was taken from reliable sources, Swiss Re does not accept any responsibility for
the accuracy or comprehensiveness of the information given or forward looking statements made. The information provided and
for ward-looking statements made are is for informational purposes only and in no way constitutes or should be taken to reflect
Swiss Re’s position, in par ticular in relation to any ongoing or future dispute. In no event shall Swiss Re be liable for any financial or
consequential loss or damage arising in connection with the use of this information and readers are cautioned not to place undue
reliance on forward-looking statements. Swiss Re under takes no obligation to publicly revise or update any for ward-looking state-
ments, whether as a result of new information, future events or otherwise. The information and opinions contained in this document
are provided as at the date of the document and are subject to change without notice. This document does not constitute or form
par t of, and should not be construed as, an advice and the reader is requested to obtain its own advisors. Fur thermore the document
does not constitute or form par t of, and should not be construed as an offer for sale or subscription of, or solicitation of any offer
or invitation to subscribe for, underwrite or otherwise acquire or dispose of any securities and it does not constitute an invitation or
inducement to engage in investment activity.
27For more information please visit
company.here.com
28You can also read