Modularity and composite diversity affect the collective gathering of information online
←
→
Page content transcription
If your browser does not render page correctly, please read the page content below
ARTICLE
                  https://doi.org/10.1038/s41467-021-23424-1                 OPEN

                  Modularity and composite diversity affect the
                  collective gathering of information online
                  Niccolò Pescetelli          1,2 ✉,   Alex Rutherford1,2 & Iyad Rahwan                   1,2

                  Many modern interactions happen in a digital space, where automated recommendations and
                  homophily can shape the composition of groups interacting together and the knowledge that
1234567890():,;

                  groups are able to tap into when operating online. Digital interactions are also characterized
                  by different scales, from small interest groups to large online communities. Here, we
                  manipulate the composition of groups based on a large multi-trait profiling space (including
                  demographic, professional, psychological and relational variables) to explore the causal link
                  between group composition and performance as a function of group size. We asked volun-
                  teers to search news online under time pressure and measured individual and group per-
                  formance in forecasting real geo-political events. Our manipulation affected the correlation of
                  forecasts made by people after online searches. Group composition interacted with group
                  size so that composite diversity benefited individual and group performance proportionally to
                  group size. Aggregating opinions of modular crowds composed of small independent groups
                  achieved better forecasts than aggregating a similar number of forecasts from non-modular
                  ones. Finally, we show differences existing among groups in terms of disagreement, speed of
                  convergence to consensus forecasts and within-group variability in performance. The present
                  work sheds light on the mechanisms underlying effective online information gathering in
                  digital environments.

                  1 Center for Humans and Machines, Max Planck Institute for Human Development, Berlin, Germany. 2 Media Lab, Massachusetts Institute of Technology,

                  Cambridge, MA, USA. ✉email: Pescetelli@mpib-berlin.mpg.de

                  NATURE COMMUNICATIONS | (2021)12:3195 | https://doi.org/10.1038/s41467-021-23424-1 | www.nature.com/naturecommunications                         1
ARTICLE NATURE COMMUNICATIONS | https://doi.org/10.1038/s41467-021-23424-1
U
nderstanding how people collect information about world visited in the past 6 months), as well as relational variables (e.g.,
events and discuss this knowledge with others online to political orientation of your average friend), and cognitive indi-
form shared opinions is a crucial and timely research cators (e.g., cognitive reflective test32). Many of the features used
question. In the past decade, there have been widespread con- in this study—such as demographics, political orientation, and
cerns that search engines and news filtering algorithms may personality traits—can be easily inferred from digital traces, and
contribute to the formation of clusters of individuals with highly used to customize searches and recommend content33–36.
correlated information and poorly diversified news sources1–3. Although some of these features (like demographics) are known
Little is known about the exact mechanisms underlying algo- to psychologists not to affect information diversity per se in an
rithmic personalization, but content is often provided by clus- offline setting37,38, they may do so in an online environment that
tering users on highly dimensional feature spaces, along shared maps interindividual differences into information access. Argu-
variables (demographics, geo-location, social network, tastes, and ably, the more distant two people are on an arbitrarily large
past behavior)4–8. Furthermore, people sharing traits are more profiling space, the less likely it is they belong to the same
likely to voluntarily cluster together in online communities, a online information bubble. Given the difficulty of disentangling
phenomenon known as homophily9,10. One question is whether the causal contributions of group composition on performance,
recommendation algorithms and homophily can impact the we here employ an experimental design23,25,26,30 to create groups
ability of online groups to collectively search and use online of people who were close or distant to each other along our multi-
information to form accurate representations of future events, trait profiling space. To manipulate our composite measure of
especially under high time pressure and uncertainty—namely diversity, we used a data-driven clustering algorithm (DBSCAN)
when the opportunities for rational debates are scarce11,12. that segmented participants based on their Euclidean distance on
In this paper, we manipulate the size/modularity of online the profiling space. Half of the participants (core segment) cor-
groups and their composition along a heterogeneous profiling responding to the center of the distribution was randomly
space (including demographic, professional, political, relational, assigned to interact with the rest 25% most similar (inner seg-
and psychological features, see Supplementary Information §1 ment) or 25% most dissimilar (outer segment) individuals in the
and 2). Both factors are expected to affect the amount and sample (Fig. 1B, C). Euclidean distance was strongly correlated
independence of information that a group can tap into13–15. We with standard deviance, another popular measure of diversity
tested people’s ability to collectively retrieve task-relevant infor- with multidimensional input (r:0.92, p < 0.001; Supplementary
mation online to form accurate representation of the world. We Fig. 13), suggesting robustness across alternative measures.
measure individual and group performance as Brier errors in As the scale of online collaboration widely varies (from small
forecasting real geo-political events (Supplementary Table 1). interest groups to large online communities), we wanted to
This task has high ecological validity. Forecasting problems were characterize the effects of group composition as a function of
independently selected as part of a national forecasting tourna- group size. Orthogonally to diversity, we randomized the size and
ment and were representative of challenges commonly facing modularity of the online collective. Manipulating group size or
experts and professional intelligence analysts. These forecasting the number of groups interrogated can have positive effects on
problems are characterized by high degrees of uncertainty and group performance, by reducing error cascades14,15,39–42. Smaller
correlated information between respondents, dependence on groups are more likely to maximize accuracy in environments
multiple indicators (e.g., economics, politics, social unrest, etc.), characterized by inter-judgment correlations thanks to their
and, importantly, time criticality (i.e.,there are huge costs asso- inherent noise and greater exploratory behavior41,43–47. Fur-
ciated with making the correct prediction too late). Importantly, thermore, aggregating information from multiple smaller inter-
the difficulty and specificity of the forecasting problems ensured acting groups performs better than traditional wisdom-of-crowd
that individual and group forecasts in our study were driven by because it insulates the aggregate from correlated errors14. In
the information participants could retrieve online in a short other words, rather than interrogating one single large crowd
amount of time, rather than domain-specific information already (M = 1), greater accuracy is obtained by dividing the large crowd
possessed by the participant before the experiment. General into smaller, but independent (i.e., noncommunicating) groups
knowledge questions or more familiar forecasting problems (M > 1). We call this feature modularity. Modularity maintains
would have confounded participants’ prior knowledge and information diversity (across groups) in spite of herding (within
information they retrieved online. For this reason, we expected groups). However, prior studies14 were performed on estimation
our composite measure of diversity to affect a group’s ability to tasks, where crowds are known to perform well48. Whether the
effectively search relevant information online. same results generalize to more complex real-world problems are
Diversity is a highly heterogeneous construct touching several unknown.
disciplines16–19. From an informational standpoint, psychologists After sorting people into groups of different sizes and com-
have recognized the importance of group diversity for informa- position, participants were asked to give for each forecasting
tion independence, group performance, resilience to group biases, problem an initial guess (initial forecast). Then they were asked to
complex thinking, creativity, and exploration of large solution revise it after privately browsing online (revised forecast), and
spaces20–30. The approach used in psychology is aimed at after debating with others online (private final forecast and group
studying single dimensions of diversity (e.g., skill, age, and consensus forecast). A preregistration of our hypotheses is
race25,30,31). Contrary to this, we are here interested in the effects available via OSF. At the individual level, we expected alignment
that sorting people based on a large multi-trait space (Fig. 1A) of opinions and improved accuracy due to online browsing and
can have on the information diversity that a group can forage social influence. At the aggregate level, we expected group
online. During the pretest phase, we surveyed participants along diversity and modularity to positively affect aggregate perfor-
29 dimensions (see Supplementary Information for a full list of mance. No predictions were made regarding the direction of their
features considered). Each participant represented a data point interaction. Exact analyses were not preregistered. Aggregation
along this profiling space based on their responses to the survey. followed the same procedure described in ref. 14. Small groups
Questions included demographic indicators (such as age, sex and (~5 people) were approximately the square root of large groups
education, and race), professional indicators (e.g., hours a day (~25 people; cf. ref. 15).
spent working with things, ideas, people, or data), political pre- Our findings show that the closer (more similar) individuals
ferences (left/right-wing), geographic indicators (e.g., countries were on the profiling space the more correlated their forecasts
2 NATURE COMMUNICATIONS | (2021)12:3195 | https://doi.org/10.1038/s41467-021-23424-1 | www.nature.com/naturecommunicationsNATURE COMMUNICATIONS | https://doi.org/10.1038/s41467-021-23424-1 ARTICLE
:
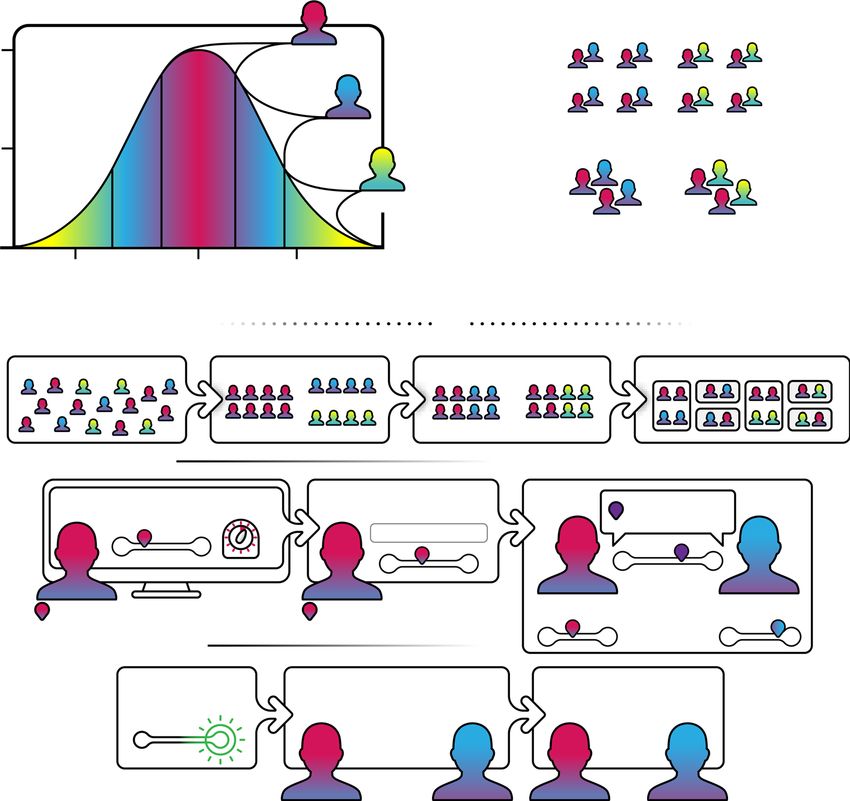
Fig. 1 Experimental design. A One-dimensional representation of the partitioning of the Θ space by the DBSCAN algorithm. In reality, Θ 2 RD , where D is
the number of dimensions considered (D = 29). B 2 × 2 design with factors: diversity (low vs. high) × modularity (low vs. high). Low vs. high diversity
manipulation was achieved by matching the core participants to either the inner segment participants (low diversity condition) or the outer segment (high
diversity condition). C Experimental procedure. At pretest time (upper row), participants were administered a battery of surveys that were used to cluster
them into a core, inner, and outer segments (DBSCAN). Core participants were then randomized to a diversity and modularity condition. At test time, they
answered eight forecasting problems first alone (stages 1 and 2) and then within their groups (stage 3).
became after online searches. Group diversity benefited individual A principal component analysis was ran to characterize post
and aggregated performance and interacted with group size so hoc the participants’ response distribution during the pretest
that large groups benefited from it more than smaller ones. phase. Trait variation in our population was highly structured,
Analysis of forecasts distributions and exploratory linguistic about five components explained ~90% of the variance
analysis of chat data showed slower consensus building, greater (Supplementary Fig. 13), suggesting most trait dimensions were
disagreement, and greater variance in group members’ perfor- redundant or showed little variation. Principal components
mance impacting large groups with higher composite diversity correlated with ethnic-cultural and socio-political variability in
score less negatively than small ones. We also find that forcing our sample (Supplementary Figs. 14–16). A parallel analysis
individuals to reach a consensus as opposed to simply being (Supplementary Fig. 17) showed eight principal components,
exposed to social information benefits their ability to forecast reported in Supplementary Information. Participants segmenta-
future events. These findings inform how social interaction online tion into core, inner, and outer segments was already visible on a
can affect real-life problem solving in complex information low-dimensional principal component projection (Supplementary
environments. We discuss these results in light of the recent lit- Fig. 18), confirming that core participants were more similar
erature on collective behavior in ecology and social science. (along the principal components) to participants belonging to the
inner segment than to participants belonging to the outer
Results segment. Finally, we checked that no principal component was
Multidimensional profiling. Exploratory analyses were ran to trivially related with opinion diversity or performance (Supple-
characterize our composite diversity measure. Trait diversity mentary Figs. 22 and 23).
correlated with information diversity only after (but not prior)
online browsing. After browsing, larger Euclidean distance along Individual-level performance. For each forecast, a Brier error
the profiling space Θ between pairs of individuals was inversely score (range [0, 2]) was computed according to Eq. (1) in the
related to the correlation coefficient of the forecasts made by the “Methods” section. Distributions of individual and aggregated
same two individuals (initial: r = 0.12 p = 0.38; revised: r = errors are reported in Supplementary Fig. 2. Errors were larger
−0.39, p = 0.006; final: −0.056, p < 0.001). This indicates that (worse performance) for initial (β = 0.62, SE = 0.09, t = 6.88, p <
online browsing produced greater alignment of beliefs pro- 5.81e − 12), revised (β = 0.69, SE = 0.08, t = 7.77, p < 7.73e − 15),
portionally to individual similarity. and final (β = 0.23, SE = 0.09, t = 2.39, p = 0.01) forecasts
NATURE COMMUNICATIONS | (2021)12:3195 | https://doi.org/10.1038/s41467-021-23424-1 | www.nature.com/naturecommunications 3ARTICLE NATURE COMMUNICATIONS | https://doi.org/10.1038/s41467-021-23424-1
compared to consensus forecasts (Fig. 2A), indicating an overall modularity and an interaction between the two provided better fit
forecast improvement over repeated judgments (Table 1A and than one without interaction (d.f. = 7, χ2 = 6.10, p = 0.01). As
Supplementary Table 4). Against our preregistered hypotheses, predicted, aggregate forecasts from groups higher on composite
initial forecasts were numerically, but nonsignificantly better than diversity were better than aggregate forecasts from homogeneous
revised forecasts. Both initial and revised forecasts however were groups (β = −0.56, SE = 0.23, t = −2.39, p = 0.01; baseline: large,
worse than following forecasts (βs < −0.38, SEs < 0.09, ts < −5.12, Table 1D and Supplementary Table 10). Also as predicted,
ps < 2.94e − 07), confirming our preregistered hypothesis of an aggregated forecasts obtained from smaller/modular groups were
accuracy improvement due to social interaction49. Final and better than from larger/non-modular groups (β = −0.82, SE =
consensus forecasts contained the same socially acquired infor- 0.26, t = −3.10, p = 0.001; baseline: homogeneous). Finally, we
mation and were made in random order. Surprisingly, errors were found an interaction between composite diversity and modularity
smaller for the consensus than the final forecast, suggesting that whose direction we did not predict (β = 0.93, SE = 0.38, t = 2.43,
forcing consensus (rather than simple social exposure) improved p = 0.01), indicating that the beneficial effect of composite
individual forecasting accuracy. diversity on aggregate forecasting accuracy was significantly
We conducted an exploratory analysis on the effects that our greater in large groups over smaller groups (Fig. 3B).
composite measure of diversity (reference: lower composite
diversity score) and group size (reference: large groups) assign-
ment had on individual forecasting accuracy (Table 1B and Disagreement, consensus reaching, and performance varia-
Supplementary Table 5). Initial and revised forecasts were not bility. To understand why diversity interacted with group size, we
affected by our manipulation and were thus excluded from this performed three main exploratory analyses. First, we analyzed the
analysis. Notice that at the individual level, we can only test distribution of forecasts produced by each group in different
whether interacting in small or larger groups has an effect on questions (Supplementary Fig. 2). In particular, we were inter-
forecasting error, given that modularity is a group-level feature ested in the disagreement between participants’ estimates
(see Supplementary Information §2). A model with an interaction (diversity of opinions in ref. 50), namely the dispersion (standard
term was superior to one without, notwithstanding the added deviation) of the forecast distribution within a group. A greater
complexity (d.f. = 8, χ2 = 7.63, χ2d.f. = 1, p = 0.005). Working in standard deviation suggests more conflicting views and thus more
groups with higher composite diversity score marginally conflicting evidence for the group to resolve, when trying to reach
predicted better individual performance (β = −0.37, SE = 0.20, a consensus under time pressure. Compared to initial forecasts,
t = −1.83, p = 0.06). Participants in homogeneous small groups disagreement was lower in final forecasts (β = −4.41, SE = 1.18,
performed nonsignificantly worse their counterparts in homo- t = −3.72, p < 0.001) and higher in revised forecasts (β = 5.06,
geneous larger groups (β = −0.20, SE = 0.20, t = −0.99, p = SE = 1.18, t = 4.27, p < 0.001), suggesting (surprisingly) an
0.31). The beneficial effect of composite diversity on individual increase in the spread of opinions after online information search
performance was positively affected by group size, suggesting that and (unsurprisingly) opinion alignment after social interaction
individual interaction with diverse peers was more beneficial in (Supplementary Table 15). We found no main effects of diversity
large than small groups (β = 0.82, SE = 0.29, t = 2.85, p = 0.004; (β = −0.48, SE = 2.36, t = −0.20, p > 0.8) or group size (β =
Fig. 2B). The same interaction was found when using average −3.51, SE = 1.80, t = −1.94, p > 0.05). However, diversity inter-
profiling distance (continuous) rather than diversity treatment acted with group size suggesting that it had a smaller effect on
(categorical) as a measure of diversity (Supplementary Table 6 disagreement in large groups compared to small ones (β = 7.11,
and Supplementary Fig. 3). Similar conclusions were reached SE = 2.60, t = 2.73, p = 0.006). Residual disagreement remained
when limiting our analysis to final forecasts only, but not to even after people had the chance to come to a consensus, as
consensus forecasts only (Supplementary Tables 7–8), suggesting observed in final forecasts (Fig. 4A).
that these results were likely driven by final individual beliefs Our second analysis suggests that online information
rather than collective ones. gathering affected within-group variability in performance.
Larger performance variability indicates that a group contains
members who are very accurate (on average across the eight
Group-level performance. In forecasting like in democratic individual forecasting problems (IFPs)) and members who are
decisions, aggregated individual judgments are more informative quite poor. Performance variability is typically associated with
than individual ones. At the aggregate level, we can now ask reduced collective intelligence51,52. In the initial stage people’s
whether modularity and hierarchical aggregation can improve accuracy was similar to each other (~0.1–0.2 standard devia-
forecasting accuracy in our online information gathering task14,15. tions of Brier scores), but variability increased in small diverse
For each group, we computed an aggregate forecast by taking the groups after online information gathering. This effect was not
median forecast in the group for each forecast type. By definition, as nearly as pronounced for small homogeneous groups and
we have only one group per diversity treatment in the non- large groups (Fig. 4B), suggesting that browsing selectively
modular condition (M = 1), but multiple subgroups in the mod- negatively impacted small groups scoring higher on our
ular condition (M > 1). Thus, aggregating judgments in the high composite diversity measure.
modularity condition proceeded by aggregating forecasts in each A third factor we investigated was whether our manipulation
group first, and then aggregating aggregates14. An exploratory affected the process of consensus reaching through online
analysis on aggregate forecasts, showed that consensus forecasting deliberation (see Supplementary Information §5 and 6). We
errors were lower than both initial (β = 0.68, SE = 0.22, t = 2.97, manually labeled forecast estimates mentioned by participants
p = 0.002) and revised (β = 0.59, SE = 0.23, t = 2.60, p = 0.009) during the deliberation phase and fitted a model representing
errors, suggesting a benefit of social interaction (Table 1C and convergence of these estimates to the consensus forecast. Group
Supplementary Table 9). The advantage of consensus over final composite diversity decreased consensus reaching times (β = −0.31,
forecasts disappeared at the aggregate level (β = −0.12, SE = 0.29, SE = 0.12, t = −2.55, p = 0.01, baseline: large). Also small groups
t = −0.43, p = 0.66; Fig. 3A). showed quicker consensus reaching than large ones (β = −0.46,
Our main hypotheses consisted in analyzing the effect of group SE = 0.10, t = −4.68, p < 0.001, baseline: homogeneous; Supple-
assignment on aggregated forecasting errors during the social mentary Table 16). A positive interaction between the two factors
exchange. A model with fixed effects for composite diversity, indicated that speed in consensus reaching observed in diverse
4 NATURE COMMUNICATIONS | (2021)12:3195 | https://doi.org/10.1038/s41467-021-23424-1 | www.nature.com/naturecommunicationsNATURE COMMUNICATIONS | https://doi.org/10.1038/s41467-021-23424-1 ARTICLE Table 1 Generalized mixed-effects models on individual and aggregated errors. Effect Estimate Fitted Brier score SE t p (A) Individual forecasting error as a function of forecast type Intercept −2.14224 0.1173915 0.24230 −8.841
ARTICLE                                                                     NATURE COMMUNICATIONS | https://doi.org/10.1038/s41467-021-23424-1

Fig. 3 Group-level analysis. Individual forecasts were aggregated for each forecast type, first within each group and then across groups in each treatment.
A Partial residuals plot showing the effect of forecast type on aggregated forecasting error (measured in Brier scores). Lower numbers represent higher
accuracy. Solid lines represent model fit. B Partial residuals plot showing the effect of diversity and modularity on aggregated forecasting error. Solid lines
represent model fit. Notice that the graphs have been plotted onto the original error scale. See Supplementary Fig. 11 when using a logit link. Source data are
provided as a Source data file.

similar characteristics is thought to create insulated online                   imagine asking a group of scientists this question: “Is Variola
information bubbles. There is growing concern that this tendency                major likely to become a more life-threatening virus than Cor-
might have negative long-term consequences on political and                     onavirus before 2030?”. If we select a discipline at random, and
democratic institutions, as citizens form partial or inaccurate                 then make large or small groups they would be unlikely to know
representations of the world. Although we cannot answer these                   what Variola major is and would guess Yes with some probability
important questions with our study, we tried to characterize the                greater than zero. If we randomly choose scientists across dis-
effect that interacting with peers who differ along an arbitrary                ciplines to create groups, small groups do not do much better
large profiling space has on the forecasting accuracy achieved by                than groups from a single discipline because the likelihood of
in-expectation-identical people (core segment participants) as a                containing a virologist is small. However, the chances of finding a
function of group size. We provided preliminary evidence that the               virologist increase with group size and a finite number of aca-
ability of an online collective to rapidly gather information to                demic disciplines. If there happens to be a virologist, they can
predict difficult geo-political events may be coupled with their                 trivially identify the answer to this question as No (this virus
digital ecosystem. People’s shared traits did not predict a priori              causes small pox, a disease that the World Health Organization
how correlated their beliefs about world events were. Instead,                  declared eradicated in 1980). Similarly for political questions,
belief coupling happened only after they interacted with their                  imagine we have a set of questions from across a large range of
unique information silos via their web browsers. Forecasts                      countries or cultures, all of which are obviously unlikely to any-
became correlated only after online browsing, and proportionally                one with domain knowledge. Diversity would improve forecasting
to people’s similarity on our multi-trait profiling space. In other              in large, but not small groups, because large groups have an
words, our operationalization of trait similarity had measurable                increased chance of containing an expert. Critically, because the
effects on the online information a group could tap into. This is in            base rate probability of the events is low (Supplementary Table 1),
contrast with offline settings, where trait diversity does not                   Brier error will be high in anyone without domain knowledge that
directly impact information diversity23,25,26,29,37,38. The use of an           assumes the events have closer to equal probability of occurring.
experimental methodology bypasses the limitations of observa-                   Although this logic nicely explains the beneficial effect of diversity
tional approaches, strengthening causal inference25,26,30,53. Trait             observed in large groups, it lacks explanatory power in other
similarity in our experiment largely captured participants’ varia-
                                                                                respects. First, it does not explain why we observed a symmetrical
bility along interpretable ethnic-cultural and socio-political vari-
                                                                                effect in small groups instead of no effect at all (Figs. 2B and 3B).
ables (Supplementary Figs. 13–18). Arguably, these features affect
                                                                                Second, it does not explain why differences among groups largely
political judgments and the type of content that a person is likely
                                                                                emerged after the revision and social stages rather than during
to retrieve online. Our findings raise worries that these features
                                                                                initial guesses. Finally, it is unclear why performance variability
may be used by search engines to skew information retrieval
during online searches, with measurable effects on collective                   remained similar between large diverse and homogeneous groups,
performance. This effect was not among our preregistered                        notwithstanding a supposedly different concentration of domain
hypotheses so we warn caution in overinterpreting this finding.                  experts (Fig. 4). Thus, although these statistical considerations are
Future studies should attempt a replication.                                    certainly relevant, technological (individuals interacting with their
   Our findings also suggest the importance of diversity in online               search engines), and social (individuals interacting with each
settings characterized by large collectives. Given the difficulty and            other) aspects are also an important part of the story. Impor-
domain specificity of the questions in our experiment, increasing                tantly, alternative measures of diversity and more theory-driven
                                                                                profiling should be considered in the future to address these
diversity may have increased the chance that at least one of the
                                                                                concerns. For the scope of our paper, however, the specific
participants in a group could, for example, recall what a Loya                  implementation of composite group diversity was not as impor-
Jirga is and make an informed guess. This effect would be more                  tant as its functional value in influencing information foraging
pronounced in a large group than a small group. To illustrate this,             and error distributions in online groups. Characterizing measures

6                   NATURE COMMUNICATIONS | (2021)12:3195 | https://doi.org/10.1038/s41467-021-23424-1 | www.nature.com/naturecommunications
NATURE COMMUNICATIONS | https://doi.org/10.1038/s41467-021-23424-1 ARTICLE Fig. 4 Disagreement and variability in performance. A Distributions of opinion disagreement as a function of forecasting stage, group trait diversity and group size. Opinion disagreement is calculated as the standard deviation over group members' forecasts. B Performance variability as a function of forecasting stage, group trait diversity, and group size. Performance variability is the standard deviation over average individual performance in a group. Larger values indicate that a group contains members who are very good and members who are quite poor (on average across the eight IFPs). Notice that a single value of performance variability exists for large groups, but not for small groups (m = 6 and m = 4 for small low and high diversity groups, respectively). Notice also that for both panels consensus forecasts were removed because, by definition, they did not produce meaningful variation in these measures. Box areas correspond to distribution ideal tail areas of 0.50, 0.25, 0.125, 0.0625 (ref. 65). Source data are provided as a Source data file. of group diversity is a research field in its own right. We recognize content. The ability of a group to collectively search relevant that our method is not perfect and caution should be used when information in parallel was thus, arguably, more important than trying to generalize our results. the ability of each individual to search any piece of information Investigating collective decisions under extreme conditions is thoroughly. Finally, another thing to notice is that most events highly informative. Many decisions faced by intelligence analysts, did not occur (Supplementary Table 1). This is not uncommon in as well as normal people everyday are characterized by weak forecasting. Rare events are often the most consequential and signal, uncertainty, time pressure, or short collective attention, difficult to predict, as the covid-19 pandemic shows. Being able to namely all conditions under which rational deliberation is least predict rare events resides at the heart of accurate forecasting49,55. effective11,12,54. The specific forecasting problems asked in the In these circumstances, an unspecific bias toward deeming events task were a random subsample of forecasting problems that were unlikely to occur would generally pay off (in the short term), and selected by a national forecasting tournament (Hybrid Forecast- generate few highly consequential mistakes. To rule out the ing Competition) to be a representative sample of professional confound of an unspecific bias, we ran a signal detection analysis geo-political forecasting. They required domain knowledge that that indicated that people did not show any bias toward uncri- participants were unlikely to possess prior to online browsing. tically deeming events as rare during their initial forecasts (Sup- This feature served a precise design purpose. The specificity of the plementary Fig. 9). In later forecast stages, it is unclear why an forecasting problems ensured that group discussions were driven unspecific tendency toward answer low probability (confidently by the content that was collectively retrieved online rather than believing the events were unlikely) would emerge from online biased by what participants knew in advance. Group members browsing or social interaction. Social interaction is known to had only a short amount of time to forage for relevant online extremize initially held individual opinions, a phenomenon NATURE COMMUNICATIONS | (2021)12:3195 | https://doi.org/10.1038/s41467-021-23424-1 | www.nature.com/naturecommunications 7
ARTICLE                                                                             NATURE COMMUNICATIONS | https://doi.org/10.1038/s41467-021-23424-1

known in psychology as risky-shift56. Thus, if anything one would                        consecutive stages. During stage one, participants answered a binary forecasting
expect social interaction in our experiment to pull initial pre-                         problem (Supplementary Table 1) and had to enter an initial private forecast off the
                                                                                         top of their heads (initial forecast). During stage two, they had to search relevant
dictions toward 0 and 100% symmetrically. Instead, group dis-                            information online, using their browser, and enter a revised private forecast
cussions seemed to adjust initial predictions intentionally toward                       (revised forecast). Finally, during the third and last stage, participants discussed in
the correct response. Furthermore, the unspecific bias explanation                        real time their views using an inbuilt chat (Fig. 1C). During this stage, participants
does not account for the interaction between group diversity and                         had to agree on a joint forecast (consensus forecast), as well as giving their final
group size observed. Manual labeling of chat conversations                               private forecast (final forecast). Notice that although consensus forecasts in a group
                                                                                         had to be the same final forecasts could differ, thus allowing us to capture residual
revealed that about half of people in each group had at least some                       disagreement existing between group members after interaction had taken place.
knowledge about each topic, and conversations mainly revolved                            Participants were rewarded both for their time and—~6 months later (post-test)
around evidence in favor or against each option. Although it is                          when the ground truths were revealed—for accurate predictions. Performance was
difficult to disentangle whether domain-specific knowledge was                             evaluated using Brier scores, a quadratic error score used in forecasting for its
                                                                                         proper scoring properties, i.e., a scoring rule incentivizing honest responding. For a
due to prior beliefs or online browsing, the former explanation is                       binary question, a Brier score is computed as:
unlikely given that initial forecasts were distributed around
                                                                                                                       b ¼ ðo  pÞ2 þ ðo  pÞ2                            ð1Þ
chance level (Supplementary Fig. 9). We thus conclude that the
observed accuracy improvement was more likely due to online                              where p represents the predicted event probability (range [0, 1]) and o is the
                                                                                         indicator variable for the observed event (0: the event happened; 1: the event did
browsing and group deliberation, rather than an unspecific bias                           not happen). p and o represent complementary probabilities. A Brier score of 0
toward reducing probability.                                                             represent a fully predicted event (i.e., no uncertainty), while a Brier score of 2
   In line with recent work in collective behavior, we find that                          represents a gross forecasting error (the forecaster predicted with absolute
when decision makers are not independent (as in this task) group                         confidence the event would occur and it did not, or viceversa). Notice that Brier
                                                                                         scores measure second-order accuracy, meaning that they punish over- (and
accuracy can benefit from a reduced group size and increased                              under-)confidence rather than number of incorrect binary judgments. An
modularity15,41,43,44,57. Research in social learning58 has shown                        improvement in Brier score represents a more precise probabilistic forecast, which
that group outcomes are affected by a complex interplay among                            might not necessarily reflect how often a participant is right (first-order accuracy).
several factors, including learning strategies, task complexity,                         For these reasons, Brier scores represent the standard in forecasting49,61,62.
modularity, and network structure. The present study showed
how two factors that independently reduce correlated errors,                             Analyses. Errors were fitted with multilevel generalized linear mixed-effects
                                                                                         models (GLMM) with Gaussian log link function. The results are robust across
namely group composition and modularity, can interact in                                 alternative link functions, like probit and logit (Supplementary Table 17, and
unexpected ways14,15,20. To characterize this novel interaction, we                      Supplementary Figs. 10 and 11). All analyses, unless specified, were limited only to
described information aggregation using a range of exploratory                           participants who fell in the core segment (i.e., test participants), as these were the
analyses, such as within-group disagreement (Fig. 4A), con-                              only ones to whom the randomization procedure applied. This allows us to draw
                                                                                         causal inferences on the effect of our manipulation, as all core participants were
vergence speed to consensus forecast (Supplementary Material                             equal in expectation. Our main analyses corresponding to our preregistered
§6) and performance variability among group members (Fig. 4B).                           hypotheses are reported in Table 1A and D. They included at the individual level
Among these variables, performance variability—often a pre-                              the effect of forecast type, and the aggregate level the effect of composite diversity
requisite for good group performance in the literature on col-                           and size assignment. To provide a full picture, we complement the main analyses
lective intelligence51,52,59—may help understand how our                                 with the effect of the manipulation on individual errors (Table 1B) and the effect of
                                                                                         forecast type on aggregate errors (Table 1C).
treatment influenced information aggregation in our task.                                     Also according to our preregistered hypotheses, we analyzed within-group
   Notwithstanding the value of these results, we would like to                          disagreement at each stage of the experiment (Supplementary Table 15).
raise a word of caution. In particular, as specified in our pre-                          Disagreement was defined as the standard deviation of the forecast within a group,
registration, we had no expectations on the direction of the                             broken down by forecast type and condition. We also run a set of exploratory
                                                                                         analyses on chat data, aimed at understanding how individuals integrated private
interaction between group composition and group size before                              information to reach a consensus within their group (see Supplementary material
testing our model. Similarly, some analyses were exploratory in                          §5-6).
nature and cannot be used to draw definitive conclusions. Future
studies will need to address whether the result can be replicated. If                    Statistics and reproducibility. The experiment was repeated only once. A pilot
so, our results suggest that, given the difficulty in reducing the                        experiment had been previously discarded (data never analyzed) due to a bug in the
impact of homophily and self-assortativity on the Internet,                              web application.
decision makers may try instead to increase its modularity.
Addressing the ethical considerations in this debate is beyond the                       Preregistration material. Preregistration material is available via AsPredicted.org:
                                                                                         https://aspredicted.org/9m6df.pdf.
scope of this paper, but an equally important avenue of
investigation60.
                                                                                         Reporting summary. Further information on research design is available in the Nature
                                                                                         Research Reporting Summary linked to this article.
Methods
Procedure. The study was approved by MIT Institutional Review Board. Partici-            Data availability
pants (N = 193, Supplementary Tables 2 and 3) gave informed consent before               Research data supporting the findings of this study have been deposited in Open Science
joining the study. Three days before test (pretest), participants answered a battery     Framework. N.P., A.R., and I.R. (July 6, 2020). Modularity and composite diversity affect
of demographic, cognitive, and personality questions that was used to map them on        the collective gathering of information online. Data can be retrieved using the permanent
a multidimensional space Θ. We used an unsupervised clustering algorithm                 link: osf.io/wb538. A Reporting summary for this article is available as a Supplementary
(DBSCAN) to label participants as belonging to the center mass of the distribution       Information. Source data are provided with this paper.
(core segment) or its tail (inner and outer segments, Fig. 1A). This structure was
already visible on a low-dimensional projection of participants on the first two
principal components of the data (Supplementary Fig. 18).                                Code availability
    We manipulated group composite diversity (low vs. high) and crowd                    Code to replicate analysis and figures supporting the findings of this study have been
modularity (low vs. high; Fig. 1B). Core participants (~50% of our initial sample)       deposited in Open Science Framework. N.P., A.R., and I.R. (July 6, 2020). Modularity and
were randomly assigned (a) to work with either close (inner segment,~25% of our          composite diversity affect the collective gathering of information online. Data can be
sample) or distant (outer segment, ~25% of our sample) participants on the feature       retrieved using the permanent link: osf.io/wb538.
space, and (b) to work in small (~5 people) or large (~25 people) groups (Fig. 1C).
During the experiment (test phase), participants answered eight IFPs, randomly
selected from a larger pool of binary real geo-political forecasting problems released   Received: 30 December 2019; Accepted: 19 April 2021;
within IARPA’s Hybrid Forecasting Competition and unresolved (i.e., whose
solution was unknown) at the time of the experiment. The exact problems selected
were not preregistered. For each IFP, participants went through three timed

8                     NATURE COMMUNICATIONS | (2021)12:3195 | https://doi.org/10.1038/s41467-021-23424-1 | www.nature.com/naturecommunications
NATURE COMMUNICATIONS | https://doi.org/10.1038/s41467-021-23424-1 ARTICLE
References 31. Wegge, J., Roth, C., Neubach, B., Schmidt, K.-H. & Kanfer, R. Age and gender
1. Pariser, E. The Filter Bubble: What The Internet Is Hiding From You (Penguin, diversity as determinants of performance and health in a public organization:
2011). the role of task complexity and group size. J. Appl. Psychol. 93, 1301–1313
2. Robertson, R. E., Lazer, D. & Wilson, C. Auditing the personalization and (2008).
composition of politically-related search engine results pages. In Proceedings of 32. Frederick, S. Cognitive reflection and decision making. J. Econ. Perspect. 19,
the 2018 World Wide Web Conference on World Wide Web - WWW ’18, 25–42 (2005).
955–965 (ACM Press, 2018). 33. Kosinski, M., Stillwell, D. & Graepel, T. Private traits and attributes are
3. Epstein, R. & Robertson, R. E. The search engine manipulation effect (SEME) predictable from digital records of human behavior. Proc. Natl. Acad. Sci. USA
and its possible impact on the outcomes of elections. Proc. Natl. Acad. Sci. 112, 110, 5802–5805 (2013).
E4512–E4521 (2015). 34. Lazer, D. et al. Computational Social Science. Science 323, 721–723 (2009).
4. Das, A., Datar, M., Garg, A. & Rajaram, S. Google news personalization: 35. Hannák, A. et al. Measuring personalization of web search. Preprint at https://
scalable online collaborative filtering. In Proc. of the 16th Int.Conf. on World doi.org/10.1145/2488388.2488435 (2017).
Wide Web, 271–280 (2007). 36. Granville, K. Facebook and Cambridge analytica: what you need to know as
5. Shapira, B. & Zabar, B. Personalized search: integrating collaboration and fallout widens https://www.nytimes.com/2018/03/19/technology/facebook-
social networks. J. Am. Soc. Inf. Sci. Technol. 62, 146–160 (2011). cambridge-analytica-explained.html (2018).
6. Mei, Q. & Church, K. Entropy of search logs. In Proceedings of the 37. de Oliveira, S. & Nisbett, R. E. Demographically diverse crowds are typically
International Conference on Web Search and Web Data Mining - WSDM ’08, not much wiser than homogeneous crowds. Proc. Natl. Acad. Sci. USA 115,
45 (ACM Press, 2008). 2066–2071 (2018).
7. Joshi, A., Bagherjeiran, A. & Ratnaparkhi, A. User demographic and 38. van Dijk, H., van Engen, M. L. & van Knippenberg, D. Defying conventional
behavioral targeting for ContentMatch advertising. In Data Mining and wisdom: a meta-analytical examination of the differences between
Audience Intelligence for Advertising(ADKDD 2011) in Conjunction with demographic and job-related diversity relationships with performance. Organ.
SIGKDD’11, 57 (2011). Behav. Hum. Decis. Process. 119, 38–53 (2012).
8. Mellor, M. Why is TikTok creating filter bubbles based on your race? Wired 39. Lazer, D. & Friedman, A. The network structure of exploration and
https://www.wired.co.uk/article/tiktok-filter-bubbles (2020). exploitation. Adm. Sci. Q. 52, 667–694 (2007).
9. Gillani, N., Yuan, A., Saveski, M., Vosoughi, S. & Roy, D. Me, My Echo 40. Barkoczi, D. & Galesic, M. Social learning strategies modify the effect of
Chamber, and I. In Proceedings of the 2018 World Wide Web Conference on network structure on group performance. Nat. Commun. 7, 13109 (2016).
World Wide Web - WWW ’18, 823–831 (ACM Press, 2018). 41. Toyokawa, W., Whalen, A. & Laland, K. N. Social learning strategies regulate
10. McPherson, M., Smith-Lovin, L. & Cook, J. M. Birds of a feather: homophily the wisdom and madness of interactive crowds. Nat. Hum. Behav. 3, 183–193
in social networks. Annu. Rev. Sociol. 27, 415–444 (2001). (2019).
11. Mercier, H. The argumentative theory: predictions and empirical evidence. 42. Bernstein, E., Shore, J. & Lazer, D. How intermittent breaks in interaction
Trends Cogn. Sci. 20, 689–700 (2016). improve collective intelligence. Proc. Natl. Acad. Sci. USA 115, 8734–8739
12. Landemore, H. Democratic Reason: Politics, Collective Intelligence, and the (2018).
Rule of the Many (Princeton University Press, 2013). 43. Galesic, M., Barkoczi, D. & Katsikopoulos, K. Smaller crowds outperform
13. Hong, L. & Page, S. E. Groups of diverse problem solvers can outperform larger crowds and individuals in realistic task conditions. Decision 5, 1–15
groups of high-ability problem solvers. Proc. Natl. Acad. Sci. USA 101, (2018).
16385–16389 (2004). 44. Kao, A. B. & Couzin, I. D. Decision accuracy in complex environments is
14. Navajas, J., Niella, T., Garbulsky, G., Bahrami, B. & Sigman, M. Aggregated often maximized by small group sizes. Proc. R. Soc. B Biol. Sci. 281, 20133305
knowledge from a small number of debates outperforms the wisdom of large (2014).
crowds. Nat. Hum. Behav. 2, 126–132 (2018). 45. Wu, L., Wang, D. & Evans, J. A. Large teams develop and small teams disrupt
15. Kao, A. B. & Couzin, I. D. Modular structure within groups causes science and technology. Nature 566, 378–382 (2019).
information loss but can improve decision accuracy. Philos. Trans. R. Soc. B 46. Fay, N., De Kleine, N., Walker, B. & Caldwell, C. A. Increasing population size
Biol. Sci. 374, 20180378 (2019). can inhibit cumulative cultural evolution. Proc. Natl Acad. Sci. USA 116,
16. Portes, A. & Vickstrom, E. Diversity, social capital, and cohesion. Annu. Rev. 6726–6731 (2019).
Sociol. 37, 461–479 (2011). 47. Kline, M. A. & Boyd, R. Population size predicts technological complexity in
17. DiTomaso, N., Post, C. & Parks-Yancy, R. Workforce diversity and inequality: Oceania. Proc. R. Soc. B Biol. Sci. 277, 2559–2564 (2010).
power, status, and numbers. Annu. Rev. Sociol. 33, 473–501 (2007). 48. Krause, J., Ruxton, G. D. & Krause, S. Swarm intelligence in animals and
18. van Knippenberg, D. & Schippers, M. C. Work group diversity. Annu. Rev. humans. Trends Ecol. Evol. 25, 28–34 (2010).
Psychol. 58, 515–541 (2007). 49. Tetlock, P. E. & Gardner, D. Superforecasting: The Art and Science of
19. Habyarimana, J., Humphreys, M., Posner, D. N., Jeremy, M. & Weinstein, J. Prediction (Crown Publishers, 2015).
M. Why does ethnic diversity undermine public goods provision ? Am. 50. Lorenz, J., Rauhut, H., Schweitzer, F. & Helbing, D. How social influence can
Political Sci. Rev. 101, 709–725 (2007). undermine the wisdom of crowd effect. Proc. Natl. Acad. Sci. USA 108,
20. Page, S. E. The Difference How the Power of Diversity Creates Better Groups, 9020–9025 (2011).
Firms, Schools, and Societies (Princeton University Press, 2007). 51. Bahrami, B. et al. Optimally interacting minds. Science 329, 1081–5 (2010).
21. Krause, S., James, R., Fariac, J. J., Ruxtond, G. D. & Krause, J. Swarm 52. Kruger, J. & Dunning, D. Unskilled and unaware of it: how difficulties in
intelligence in humans: diversity can trump ability. Anim. Behav. 81, 941–948 recognizing one’s own incompetence lead to inflated self-assessments. J.
(2011). Personal. Soc. Psychol. 77, 1121–1134 (1999).
22. Surowiecki, J. The Wisdom of Crowds. Why the Many are Smarter than the 53. Sommers, S. R., Warp, L. S. & Mahoney, C. C. Cognitive effects of racial
Few (Little, Brown Book Group, 2004). diversity: White individuals’ information processing in heterogeneous groups.
23. Sommers, S. R. On racial diversity and group decision making: identifying J. Exp. Soc. Psychol. 44, 1129–1136 (2008).
multiple effects of racial composition on jury deliberations. J. Personal. Soc. 54. Lorenz-Spreen, P., Mønsted, B., Hövel, P. & Lehmann, S. Accelerating
Psychol. 90, 597–612 (2006). dynamics of collective attention. Nat. Commun. 10, 1759 (2019).
24. Kerr, N. L. & Tindale, R. S. Group performance and decision making. Annu. 55. Taleb, N. N. The Black Swan: The Impact of the Highly Improbable (Penguin,
Rev. Psychol. 55, 623–655 (2004). 2008).
25. Loyd, D. L., Wang, C. S., Phillips, K. W. & Lount, R. B. Social category 56. Moscovici, S. & Zavalloni, M. The group as a polarizer of attitudes. J. Personal.
diversity promotes premeeting elaboration: the role of relationship focus. Soc. Psychol. 12, 125–135 (1969).
Organ. Sci. 24, 757–772 (2013). 57. Wisdom, T. N. Social learning strategies in networked groups. Cogn. Sci. 37,
26. Levine, S. S. et al. Ethnic diversity deflates price bubbles. Proc. Natl. Acad. Sci. 1383–1425 (2013).
USA 111, 18524–18529 (2014). 58. Kendal, R. L. et al. Social learning strategies: bridge-building between fields.
27. Yaniv, I. Group diversity and decision quality: amplification and attenuation Trends Cogn. Sci. 22, 651–665 (2018).
of the framing effect. Int. J. Forecast. 27, 41–49 (2011). 59. Kurvers, R. H. J. M. et al. Boosting medical diagnostics by pooling
28. Woolley, A. W., Chabris, C. F., Pentland, A., Hashmi, N. & Malone, T. W. independent judgments. Proc. Natl Acad. Sci. USA 113, 8777–8782 (2016).
Evidence for a collective intelligence factor in the performance of human 60. van Dijk, H., van Engen, M. & Paauwe, J. Reframing the business case for
groups. Science 330, 686–688 (2010). diversity: a values and virtues perspective. J. Bus. Ethics 111, 73–84 (2012).
29. Mannix, E. & Neale, M. A. What differences make a difference? Psychol. Sci. 61. Tetlock, P. E. Expert Political Judgment: How Good Is It? How Can We Know?
Public Interest 6, 31–55 (2005). (Princeton University Press, 2006).
30. Antonio, A. L. et al. Effects of racial diversity on complex thinking in college 62. Fleming, Stephen M. & Hakwan C. Lau. How to measure metacognition. Front.
students. Psychol. Sci. 15, 507–510 (2004). Hum. Neurosci. 8, 443 (2014).
NATURE COMMUNICATIONS | (2021)12:3195 | https://doi.org/10.1038/s41467-021-23424-1 | www.nature.com/naturecommunications 9ARTICLE NATURE COMMUNICATIONS | https://doi.org/10.1038/s41467-021-23424-1
63. Kuznetsova, A., Brockhoff, P. B. & Christensen, R. H. B. lmerTest Package: Additional information
tests in linear mixed effects models. J. Stat. Softw. 82, 1–26 (2017). Supplementary information The online version contains supplementary material
64. Breheny, P. & Burchett, W. Visualization of regression models using visreg. R. available at https://doi.org/10.1038/s41467-021-23424-1.
J. 9, 56–71 (2017).
65. Hofmann, H., Wickham, H. & Kafadar, K. Letter-value plots: boxplots for Correspondence and requests for materials should be addressed to N.P.
large data. J. Comput. Graph. Stat. 26, 469–477 (2017).
Peer review information Nature Communications thanks thanks Joaquin Navajas and
the other, anonymous, reviewer(s) for their contribution to the peer review of this work.
Acknowledgements Peer reviewer reports are available.
This research is based upon work supported in part by the Office of the Director of
National Intelligence (ODNI), Intelligence Advanced Research Projects Activity Reprints and permission information is available at http://www.nature.com/reprints
(IARPA), via contract number 2017-17061500006. The views and conclusions contained
herein are those of the authors and should not be interpreted as necessarily representing Publisher’s note Springer Nature remains neutral with regard to jurisdictional claims in
the official policies, either expressed or implied, of ODNI, IARPA, or the U.S. Govern- published maps and institutional affiliations.
ment. The U.S. Government is authorized to reproduce and distribute reprints for
governmental purposes notwithstanding any copyright annotation therein. The authors
would like to thank Zhaozheng Alice Jin for her contribution to the development of the
Open Access This article is licensed under a Creative Commons
experimental web application; Dr. Nick Obradovich for his support throughout this
Attribution 4.0 International License, which permits use, sharing,
work; and Dr. Hans van Dijk for sharing his data and insights.
adaptation, distribution and reproduction in any medium or format, as long as you give
appropriate credit to the original author(s) and the source, provide a link to the Creative
Author contributions Commons license, and indicate if changes were made. The images or other third party
Conceptualization, data curation, investigation, methodology, and project administra- material in this article are included in the article’s Creative Commons license, unless
tion: N.P.; formal analysis, software, validation, visualization, writing—original draft : indicated otherwise in a credit line to the material. If material is not included in the
N.P. and A.R.; funding acquisition: IR; resources and writing—review and editing: N.P., article’s Creative Commons license and your intended use is not permitted by statutory
A.R. and I.R.; and supervision: A.R. and I.R. regulation or exceeds the permitted use, you will need to obtain permission directly from
the copyright holder. To view a copy of this license, visit http://creativecommons.org/
Funding licenses/by/4.0/.
Open Access funding enabled and organized by Projekt DEAL.
© The Author(s) 2021
Competing interests
The authors declare no competing interests.
10 NATURE COMMUNICATIONS | (2021)12:3195 | https://doi.org/10.1038/s41467-021-23424-1 | www.nature.com/naturecommunicationsYou can also read