High-throughput metabarcoding reveals the effect of physicochemical soil properties on soil and litter biodiversity and community turnover across ...
←
→
Page content transcription
If your browser does not render page correctly, please read the page content below
High-throughput metabarcoding reveals
                                             the effect of physicochemical soil
                                             properties on soil and litter biodiversity
                                             and community turnover across
                                             Amazonia
                                             Camila D. Ritter1 ,2 , Alexander Zizka1 ,2 , Fabian Roger3 , Hanna Tuomisto4 ,
                                             Christopher Barnes5 , R. Henrik Nilsson1 ,2 ,* and Alexandre Antonelli1 ,2 ,6 ,7 ,*
                                         1
                                           Gothenburg Global Biodiversity Centre, Göteborg, Sweden
                                         2
                                           Department of Biological and Environmental Sciences, University of Gothenburg, Gothenburg, Sweden
                                         3
                                           Centre for Environmental and Climate Research, Lund University, Lund, Sweden
                                         4
                                           Department of Biology, University of Turku, Turku, Finland
                                         5
                                           Natural History Museum of Denmark, University of Copenhagen, Denmark, Copenhagen, Denmark
                                         6
                                           Gothenburg Botanical Garden, Göteborg, Sweden, Gothenburg, Sweden
                                         7
                                           Department of Organismic and Evolutionary Biology, Harvard University, Cambridge,
                                           United States of America
                                         *
                                           These authors contributed equally to this work.

                                                 ABSTRACT
                                                 Background. Knowledge on the globally outstanding Amazonian biodiversity and its
                                                 environmental determinants stems almost exclusively from aboveground organisms,
                                                 notably plants. In contrast, the environmental factors and habitat preferences that drive
                                                 diversity patterns for micro-organisms in the ground remain elusive, despite the fact
                                                 that micro-organisms constitute the overwhelming majority of life forms in any given
                                                 location, in terms of both diversity and abundance. Here we address how the diversity
                                                 and community turnover of operational taxonomic units (OTU) of organisms in soil
                                                 and litter respond to soil physicochemical properties; whether OTU diversities and
Submitted 13 March 2018                          community composition in soil and litter are correlated with each other; and whether
Accepted 29 August 2018                          they respond in a similar way to soil properties.
Published 25 September 2018
                                                 Methods. We used recently inferred OTUs from high-throughput metabarcoding of
Corresponding author                             the 16S (prokaryotes) and 18S (eukaryotes) genes to estimate OTU diversity (OTU
Camila D. Ritter, camila.ritter@gu.se,
kmicaduarre@gmail.com                            richness and effective number of OTUs) and community composition for prokaryotes
                                                 and eukaryotes in soil and litter across four localities in Brazilian Amazonia. All analyses
Academic editor
Jorge Curiel Yuste                               were run separately for prokaryote and eukaryote OTUs, and for each group using
                                                 both presence-absence and abundance data. Combining these with novel data on
Additional Information and
Declarations can be found on                     soil chemical and physical properties, we identify abiotic correlates of soil and litter
page 18                                          organism diversity and community structure using regression, ordination, and variance
DOI 10.7717/peerj.5661                           partitioning analysis.
                                                 Results. Soil organic carbon content was the strongest factor explaining OTU diversity
    Copyright                                    (negative correlation) and pH was the strongest factor explaining community turnover
2018 Ritter et al.
                                                 for prokaryotes and eukaryotes in both soil and litter. We found significant effects also
Distributed under                                for other soil variables, including both chemical and physical properties. The correlation
Creative Commons CC-BY 4.0                       between OTU diversity in litter and in soil was non-significant for eukaryotes and weak
OPEN ACCESS

                                             How to cite this article Ritter et al. (2018), High-throughput metabarcoding reveals the effect of physicochemical soil properties on soil
                                             and litter biodiversity and community turnover across Amazonia. PeerJ 6:e5661; DOI 10.7717/peerj.5661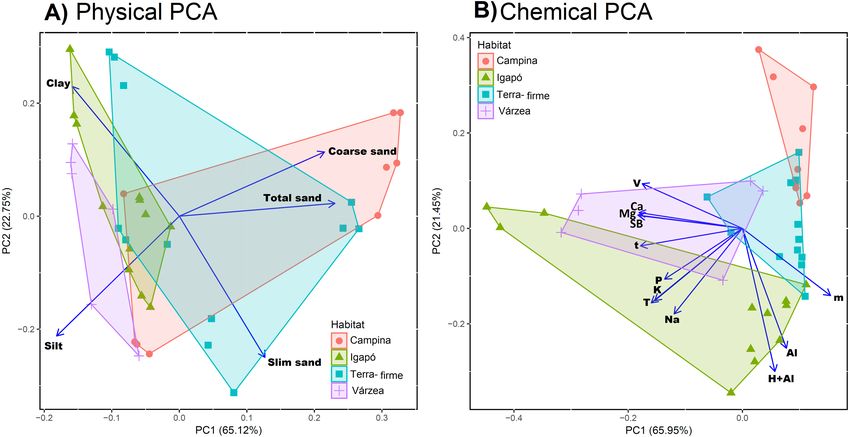
for prokaryotes. The community compositions of both prokaryotes and eukaryotes
                                       were more separated among habitat types (terra-firme, várzea, igapó and campina)
                                       than between substrates (soil and litter).
                                       Discussion. In spite of the limited sampling (four localities, 39 plots), our results
                                       provide a broad-scale view of the physical and chemical correlations of soil and
                                       litter biodiversity in a longitudinal transect across the world’s largest rainforest. Our
                                       methods help to understand links between soil properties, OTU diversity patterns,
                                       and community composition and turnover. The lack of strong correlation between
                                       OTU diversity in litter and in soil suggests independence of diversity drives of these
                                       substrates and highlights the importance of including both measures in biodiversity
                                       assessments. Massive sequencing of soil and litter samples holds the potential to
                                       complement traditional biological inventories in advancing our understanding of the
                                       factors affecting tropical diversity.

                                    Subjects Biodiversity, Ecology, Ecosystem Science, Microbiology, Soil Science
                                    Keywords Brazil, Operational Taxonomic Units (OTUs), Rainforest, Eukaryotes,
                                    Soil microorganisms, Prokaryotes

                                    INTRODUCTION
                                    Tropical rainforests are mega-diverse and environmentally heterogeneous biomes, and
                                    their biodiversity has been shown to vary considerably over space. In Amazonia, the
                                    world’s largest rainforest that covers most of northern South America, geology and soil
                                    physicochemical properties are often considered crucial in regulating the biotic dynamics,
                                    vegetation, and diversity patterns at local to regional scales (Vogel et al., 2009; Laurance et
                                    al., 2010; Higgins et al., 2011; Friesen et al., 2011; Tuomisto et al., 2016).
                                        For instance, diversity and community composition of plants are influenced by
                                    geology and physicochemical soil properties (e.g., Vogel et al., 2009; Laurance et al., 2010;
                                    Higgins et al., 2011; Friesen et al., 2011; Tuomisto, Zuquim & Cárdenas, 2014; Tuomisto et
                                    al., 2016; Tedersoo et al., 2016). In particular, the availability of soil nutrients and soil
                                    cation concentration are important factors determining plant species composition and
                                    turnover (Tuomisto et al., 2003; Laurance et al., 2010; Higgins et al., 2011; Baldeck et al.,
                                    2016; Tuomisto et al., 2016; Cámara-Leret et al., 2017). Additionally, soil properties, in
                                    particular phosphorus, can affect the taxonomic composition of microbial communities
                                    (Buckley & Schmidt, 2001; Faoro et al., 2010; Navarrete et al., 2013). In addition, pH is
                                    known to shape microbial diversity (e.g., Osborne et al., 2011; Kuramae et al., 2012; Bates
                                    et al., 2013; Barnes et al., 2016).
                                        Different soil layers may show different patterns of biodiversity (Hinsinger et al., 2009).
                                    For instance, the taxonomic composition of nematode species clustered in six trophic guilds
                                    (bacterial feeders, fungal feeders, root associates, plant parasites, omnivores, and predators)
                                    has been found to vary between the mineral soil layer and the organic matter layer (litter)
                                    above it (Porazinska et al., 2012). In Amazonia, litter layers vary with habitat type and the
                                    length of the inundation period. Unflooded forests (terra-firme) are particularly rich in
                                    litter. In addition, flooded forests are also rich in litter and the litter layer increases with

Ritter et al. (2018), PeerJ, DOI 10.7717/peerj.5661                                                                            2/24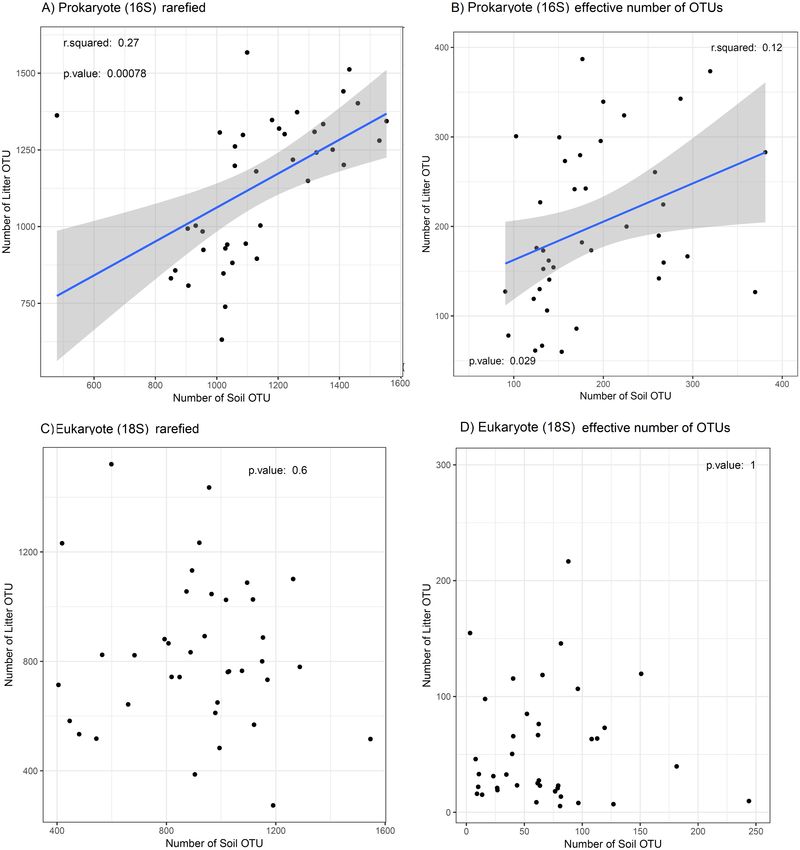
increasing length of the inundation period (Myster, 2017). Besides inundation, several other
                                    factors influence litter accumulation and thereby decomposition rates and nutrient cycling.
                                    These include leaf abscission and species composition (e.g., Gregorich et al., 2017), which
                                    have implications for the diversity and community structure of soil and litter-inhabiting
                                    organisms. However, the strength of soil-litter interactions varies, and a study conducted in
                                    Canada reported no influence of soil physicochemical properties on litter decomposition
                                    (Gregorich et al., 2017). This may indicate a difference in biodiversity patterns (due to
                                    different drivers and biomass) between soil and litter layers.
                                       The diversity and composition of Amazonian soil and litter communities remain poorly
                                    understood, despite recent studies on soil micro-organismic communities (e.g., Basset
                                    et al., 2012; Mahé et al., 2017; Ritter et al., 2018). This lack of knowledge, especially in
                                    taxonomic groups such as fungi, protists, nematodes, and bacteria, is problematic given the
                                    important roles of these groups in a wide range of biotic processes (Falkowski, Fenchel &
                                    Delong, 2008; Stajich et al., 2009; Friesen et al., 2011). To tackle his lack of knowledge, high-
                                    throughput amplicon-based sequencing analyses such as DNA metabarcoding (Taberlet
                                    et al., 2012) now allow examination of soil diversity patterns (Bardgett & Van Der Putten,
                                    2014). However, most studies so far have been focused on one or a few taxonomic
                                    groups, which renders general conclusions on the effects of soil properties on biodiversity
                                    difficult (e.g., Faoro et al., 2010; Laurance et al., 2010; Navarrete et al., 2013; Barnes et al.,
                                    2016). Understanding microbial diversity and communities and their relation to soil
                                    physicochemical properties on a broad taxonomic scale is therefore crucial in any location,
                                    but particularly so in mega-diverse regions such as Amazonia to access general conclusion
                                    about the abiotic drivers of diversity.
                                       In this study, we test the effect of physicochemical soil properties on soil and litter
                                    biodiversity and community turnover at four localities along a west-to-east transect across
                                    Brazilian Amazonia. We base diversity estimates on operational taxonomic units (OTUs)
                                    from environmental DNA of the ribosomal 16S (prokaryote) and nuclear ribosomal
                                    18S (eukaryote) genes. Specifically, we seek to answer the following questions: Are OTU
                                    diversity and turnover related to physical and chemical soil properties? If so, what are the
                                    most important soil properties? Are OTU diversity and community composition correlated
                                    when quantified for the litter layer vs. the underlying soil? All questions are addressed
                                    separately for eukaryotes (18S) and prokaryotes (16S) using both presence-absence and
                                    abundance data.

                                    MATERIALS AND METHODS
                                    Sampling design and localities
                                    We sampled four localities along the Amazon River (Fig. 1) following the sampling design
                                    of Tedersoo et al. (2014). Detailed locality descriptions are available in Ritter et al. (2018).
                                    Briefly, we sampled all depths of the litter layer above the mineral soil (all organic matter,
                                    including leaves, roots, and animal debris) and the top 5 cm of the mineral soil in a total of
                                    39 circular plots, each with a radius of 28 m. We chose 20 random trees inside each plot and
                                    collected litter and soil on both sides of each tree. We then pooled the samples by substrate

Ritter et al. (2018), PeerJ, DOI 10.7717/peerj.5661                                                                              3/24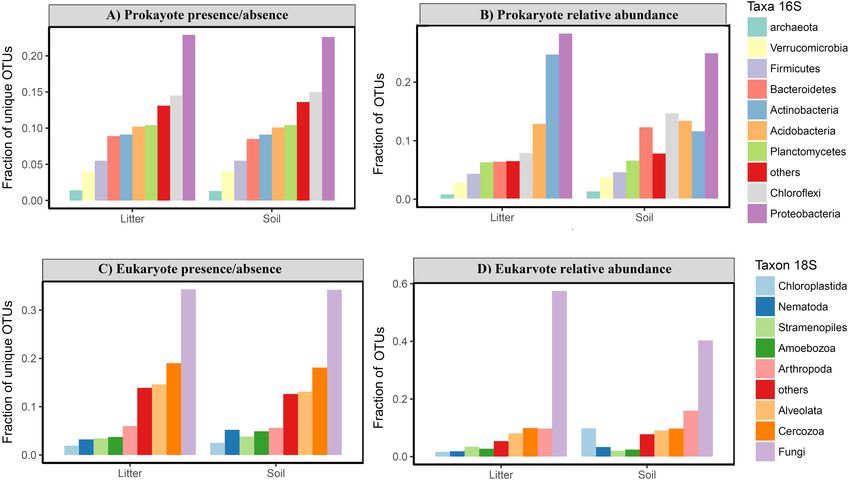
Figure 1 Study area and sampling locations. Inset panels show details of each locality. A, Benjamin Con-
                                      stant; B, Jaú; C, Jaú, naturally open areas; D, Cuieras; E, Cuieras, naturally open areas; and F, Caxiuanã.
                                      The symbols in A–F represent different vegetation types that are linked with different soil properties: cir-
                                      cles, open areas; triangles, forest seasonally flooded by black water rivers; squares, unflooded forest; and
                                      crosses, forest seasonally flooded by white water rivers. The sampling strategy was designed to cover a wide
                                      longitudinal range in Amazonia. The map was constructed using QGIS (2012).
                                                                                                          Full-size DOI: 10.7717/peerj.5661/fig-1

                                    to obtain one soil and one litter sample per plot. Each sample was stored in a plastic bag
                                    with the same weight than soil/litter samples of sterilized white silica gel of 1–4 mm grain
                                    size, pre-treated for two minutes of microwave heating (800 W) and 15 min of UV light.
                                    The bags were stored at room temperature (around 30 ◦ C) in a dark box to avoid exposure
                                    to light. Once they arrived in Sweden, a period between 7–30 days, the samples were frozen
                                    (−20 ◦ C). We sampled in different habitat types, which can be summarized as terra-firme,
                                    várzeas, igapós, and campinas. These are four of the commonly recognised main Amazonian
                                    environments. Terra-firme is characterised by not being inundated during the annual flood
                                    season, and terra-firme forests generally have tall stature and complex canopy structure
                                    (IBGE, 2004). In contrast, várzeas and igapós are seasonally flooded and remain submerged
                                    during parts of the year. Várzeas are flooded by white-water rivers, which carry a large load
                                    of suspended sediments, whereas igapós are flooded by black-water rivers, which bring a
                                    small load of suspended sediments but a high concentration of organic acids (Junk et al.,
                                    2011). Finally, campinas have nutrient-impoverished sandy soils and forests with a reduced
                                    stature and relatively simple canopy structure (Prance, 1996; IBGE, 2004).
                                       Our sampling was carried out in four areas: Benjamin Constant (9 plots covering
                                    terra-firme, várzea and igapó), our westernmost locality, approximately 1,100 km west
                                    of Manaus in the upper Amazonas River (4.383◦ S, 70.017◦ W; Fig. 1A); Jaú national park
                                    (6 plots covering terra-firme and igapó; 1.850◦ S, 61.616◦ W; Fig. 1B) and Novo Airão (3

Ritter et al. (2018), PeerJ, DOI 10.7717/peerj.5661                                                                                           4/24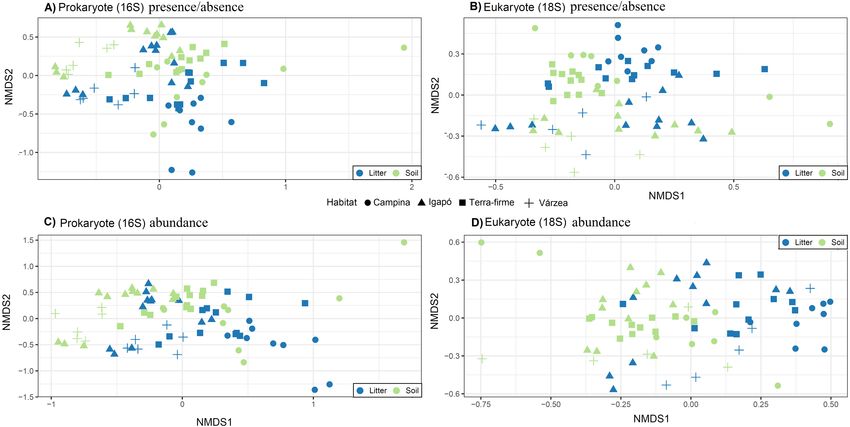
plots covering campinas; 2.620◦ S, 60.944◦ W; Fig. 1C), on the west side of the Negro River;
                                    Reserva do Cuieras (six plots covering terra-firme and igapó; 2.609◦ S, 60.217◦ W; Fig. 1D)
                                    and Reserva da Campina (three plots covering campinas; 2.592◦ S, 60.030◦ W; Fig. 1E), on
                                    the east side of the Negro River; and Caxiaunã (12 plots covering campinas, terra-firme,
                                    várzea, and igapó), a national forest located 350 km west of Belém (1.7352◦ S, 51,463◦ W;
                                    Fig. 1F), which constitutes our easternmost locality. The sample collection was authorized
                                    by Brazilian authorities: ICMBio (registration number 48185-2) and IBAMA (registration
                                    number 127341).

                                    Physicochemical soil analyses
                                    We determined the physicochemical soil properties of each plot from three soil samples
                                    per plot, totalling 117 samples. The pH was measured in water (soil: water ratio 1:2.5).
                                    The exchangeable concentrations were measured for sodium (Na), potassium (K), and
                                    phosphorus (P) using Mehlich-1 extraction (unit mg/dm3 ) and for calcium and magnesium
                                    (Ca, Mg) using KCl (1 mol/L) extraction (unit cmolc /dm3 ). The sum of all exchangeable
                                    bases (SB; which comprises K+ , Ca2+ , Mg2+ , and Na+ ; unit cmolc /dm3 ) was then
                                    calculated. We also estimated exchangeable aluminium (Al and H+Al unit cmolc /dm3 )
                                    extracted with calcium acetate (0.5 mol/L at pH 7.0), aluminium saturation index (m; unit
                                    %), and Base Saturation Index (V; unit %). The effective cation exchange capacity (t) as
                                    well as the cation exchange capacity (T) were measured at pH 7.0 (unit cmolc /dm3 ). The
                                    organic matter (O.M) was quantified (unit g/kg) and the organic carbon (C) was estimated
                                    from the organic matter as: C = O.M/1.724—Walkley-Black (unit g/kg). Soil texture was
                                    characterized by quantifying the fractions of clay (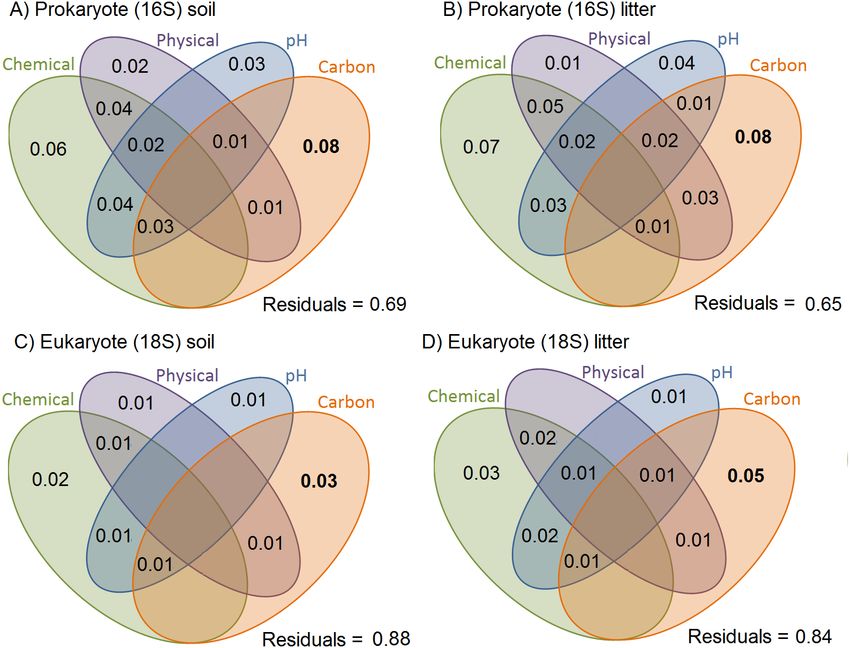
singletons. We inferred operational taxonomic units (OTU) at the 97% sequence similarity
                                    level as usually used for OTU clustering (meaning that sequences differing by more than
                                    3% are considered to belong to different OTUs; Stackebrandt and Goebel, 1994; Blaxter
                                    et al., 2005). We used the SINA v1.2.10 for ARB SVN (revision 21,008; Pruesse, Peplies &
                                    Glöckner, 2012) taxonomic reference dataset for both markers and used SILVAngs 1.3 for
                                    taxonomic assignments (Quast et al., 2012).

                                    Construction of corrected OTU tables
                                    Presence/absence analyses
                                    PCR biases, variation in the copy number of 16S/18S genes per cell/genome, as well
                                    as differences in size and biomass across the targeted organisms can compromise a
                                    straightforward interpretation of OTU reads as an abundance measure (Elbrecht & Leese,
                                    2015; Pawluczyk et al., 2015). Since the number of observed OTUs is dependent on the
                                    number of reads, we first rarefied all samples to the lowest number of reads obtained from
                                    any one plot (22,209 for 16S and 25,144 for 18S; Fig. S1). One sample containing only
                                    1,359 reads was excluded from the 18S data analysis prior to rarefaction to avoid having to
                                    downsize the other samples to such a low number of reads (McMurdie & Holmes, 2014).
                                    The OTU richness of each plot was computed after rarefaction using the function ‘‘rarefy’’
                                    in the package vegan v. 2.4-3 (Oksanen et al., 2007) in R v3.3.2 (R Development Core Team,
                                    2017). We subsequently transformed the rarefied OTU tables to presence/absence for both
                                    prokaryote (16S) and eukaryote (18S) data.

                                    Abundance analyses
                                    Despite known limitations of methods, read abundances can be meaningful, especially for
                                    16S. Therefore, we carried out analyses also using abundance data. We calculated true OTU
                                    diversity of order q = 1, which is equivalent to the exponential of the Shannon entropy (Jost,
                                    2006). It can be interpreted as the effective number of OTUs, i.e., the number of OTUs in
                                    an idealised community where the geometric mean of the proportional OTU abundances
                                    is the same as in the original sample, but all OTUs are equally abundant (Tuomisto, 2010).
                                    The effective number of OTUs is more robust against biases arising from uneven sampling
                                    depth than the simple number of OTUs, so for diversity we used the unrarefied read counts
                                    as OTU abundance. However, the results were virtually identical when we used the rarefied
                                    OTU table (correlation = 1 for both 16S and 18S). For the remaining abundance-based
                                    analyses, we transformed read counts using the ‘‘varianceStabilizingTransformation’’
                                    function in DESeq2 (Love, Huber & Anders, 2014) as suggested by McMurdie & Holmes
                                    (2014). This transformation normalizes the count data with respect to sample size (number
                                    of reads in each sample) and variances, based on fitted dispersion-mean relationships
                                    (Love, Huber & Anders, 2014).

                                    Statistical analyses
                                    Preparation of environmental data
                                    We first normalised all soil variables to zero mean and unit variance using the ‘‘scale’’
                                    function of vegan. We then performed two principal component analyses (PCAs) to
                                    reduce the number of variables. The first PCA used the chemical soil properties, i.e., all

Ritter et al. (2018), PeerJ, DOI 10.7717/peerj.5661                                                                          6/24
variables based on concentrations of elements. The second PCA used the physical soil
properties, i.e., grain size classes. We input missing sand, silt, and clay information for
three plots, based on regression weights from the observed data using the mice v. 2.30
R package (Buuren & Groothuis-Oudshoorn, 2011) before performing the PCAs. We used
the first axis of each PCA (explaining 66% and 65% of the total variation, respectively)
in the subsequent analyses. Given the expected importance of soil organic carbon content
(Nielsen et al., 2011) and pH (Lauber et al., 2009), we used these as independent variables.
Hypothesis testing
For all analyses we used pH, organic carbon, chemical PC1, and physical PC1 as explanatory
variables. All analyses were carried out using presence-absence data and relative abundance
data in parallel: in the case of diversity, richness corresponds to presence-absence data
and effective number of OTUs to relative abundance data. Overall, each kind of analysis
was carried out eight times: one for each of the eight possible combinations of organism
group (prokaryote or 16S, eukaryote or 18S), substrate (soil, litter) and abundance measure
(presence-absence, proportional abundance).
Do OTU diversities reflect physical or chemical soil properties?
To address the first question, we performed Bayesian general linear models (GLM),
as implemented in the R-INLA v. 17.6.20 R package (Rue et al., 2009). The response
variables were the eight different variants of OTU diversity in turn, and in each case the
soil properties were used as explanatory variables. We tested the effect of spatial auto-
correlation by comparing analyses of standard GLMs with GLM analysis using stochastic
partial differential equations (SPDE) that explicitly consider spatial correlation.
Do OTU community turnovers reflect differences in physical and chemical
soil properties?
To address the second question, we performed multiple regressions on dissimilarity matrices
(MRM), as implemented in the function ‘‘MRM’’ of the R package ecodist v.2.0.1 (Goslee
& Urban, 2007). The response variables were dissimilarity matrices based on the eight
different variants of OTU turnover (as calculated using the Jaccard dissimilarity) in turn.
In each case, the explanatory variables were four distance matrices based on soil properties
and one geographical distance matrix (all calculated using Euclidean distances). Statistical
significance of the regression coefficients was determined with 10,000 permutations.
Additionally, we used variance partitioning analysis based in dissimilarity matrixes to
quantify the unique and shared contributions of each of the explanatory variables to
explaining variance in the response distance matrix (Tuomisto & Ruokolainen, 2006).
Does OTU diversity of the litter layer predict the OTU diversity of the
underlying soil?
To address the third question, we analysed the relationship between litter and soil OTU
richness and diversity for prokaryotes (16S) and eukaryotes (18S) using a linear regression
model (the lm function in R).
Ritter et al. (2018), PeerJ, DOI 10.7717/peerj.5661 7/24Are OTU community turnover patterns in the litter layer similar to those in
the underlying soil?
To address the fourth question, we first performed non-metric multidimensional scaling
(NMDS) ordinations as implemented in the metaMDS function in the R package
vegan. Compositional dissimilarity was quantified with the Jaccard dissimilarity index.
Ordinations based on the same organism group and abundance data type but different
substrates were then compared. Next, we used the Permutational Analysis of Variance
(PERMANOVA) to assess whether substrate type has an effect on community composition.
Finally, we illustrated which were the dominant taxonomic groups (phyla or kingdom)
with bar-plots. As with the other questions, all analyses were repeated for all possible
combinations of organism group (prokaryotes or 16S and eukaryotes or 18S) and
abundance data type (presence-absence and proportional abundance, in the bar-plots
we used the rarefied abundance data).
Additional R packages we used for data curation and visualization were tidyverse v.
1.1.1 (Wickham, 2017), Hmisc v. 4.0-3 (Harrell Jr & Dupont, 2008), ggfortify v. 0.1.0
(Tang, Horikoshi & Li, 2016), gridExtra v. 2.2.1 (Auguie, Antonov & Auguie, 2016), ggplot2
(Wickham, 2016), entropart (Marcon & Hérault, 2015), broom v.0.4.4 (Robinson, 2017),
and viridis v. 0.4.0 (Garnier, 2016). Scripts for all analyses are provided in the supplementary
material.
RESULTS
OTU diversity and turnover in relation to soil properties (research 1
and 2)
In the physical soil data PCA, large values on the first PC were associated with coarse texture
(coarse sand fraction loading 0.52, total sand fraction loading 0.55) and small values with
fine texture (silt loading −0.45, clay loading −0.38; Table S2). The flooded forests (igapós
and várzeas) generally had fine-textured soils (negative values of PC1). The unflooded
forests (terra-firme and campinas) were more widely distributed along PC1, with some
plots having similar values with várzeas and igapós (Fig. 2A). In the chemical soil data PCA,
large values on the first PC were associated with poor soils. The most negative loading was
−0.35 for the sum of exchangeable bases (SB), and the largest positive loading was 0.29 for
aluminium saturation index (Table S3). The habitat types were not well separated along
the first axis of the chemical PCA, as most plots of all habitat types had poor soils (large
values of PC1) and just a few scattered várzea and igapó plots had more cation-rich soils
(small values of PC1; Fig. 2B).
In general, organic carbon and pH had the strongest effects on OTU diversity. This
was the case both for prokaryotes and eukaryotes, for richness and effective number of
OTUs and for soil and litter (Table 1). In addition, PC1 of chemical soil properties was
an important predictor for prokaryotic OTU richness in the soil and litter, with stronger
effect in soil than in litter, and for prokaryotic effective number of OTUs just in soil. For
eukaryotes, soil texture had an important effect on OTU diversity, albeit different on each
substrate: positive for soil and negative for litter (Table 1). Overall, soil properties had
strong effects on OTU diversity in litter.
Ritter et al. (2018), PeerJ, DOI 10.7717/peerj.5661 8/24Figure 2 Physical and chemical soil similarity of sample sites across Amazonia. The figure shows the
study sites—coloured by habitat type—on the first two axes of a Principle Component Analysis for (A)
physical properties (silt, clay and fine, coarse, and total sand fraction) and (B) chemical proprieties (phos-
phorus (P), exchangeable bases (Na, K, Ca, and Mg), the sum of all exchangeable bases (SB), exchangeable
aluminium (Al and H+Al), saturation index by aluminium (m), base saturation index (V), effective cation
exchange capacity (t), and cation exchange capacity (T)). The blue rows show the values of each variable
loadings in the two firs PCs. For physical PCA we can observe that flooded forest (igapós and várzeas)
are associated with negative values in the first PC axis and a more spread distribution of terra-firme and
campinas. For chemical PCA there is no separation of flooded forest, but campinas group in most positive
values in the first PCA axis followed by terra-firmes.
Full-size DOI: 10.7717/peerj.5661/fig-2
OTU community turnover was significantly associated with soil properties, especially
with organic carbon and pH, which were significant for all communities. The pH effect
was strong for all prokaryote (16S) datasets and for eukaryotes (18S) in soil when
relative abundance data were used (Table 2). Organic carbon had the strongest effect
for eukaryotes in soil when presence/absence data were used and for eukaryotes in litter
with both presence/absence and relative abundance data. Chemical PC1 was significant
for prokaryotes in soil (both presence/absence and relative abundance) and for eukaryotes
in litter when presence/absence data were used. Texture PC1 was significant only for
eukaryotes in litter (both presence/absence and relative abundance; Table 2). Geographical
distance was a significant explanatory factor for all datasets, but as closer places usually are
more environmentally similar, we cannot separate the effect of spatial correlation from soil
property effects.
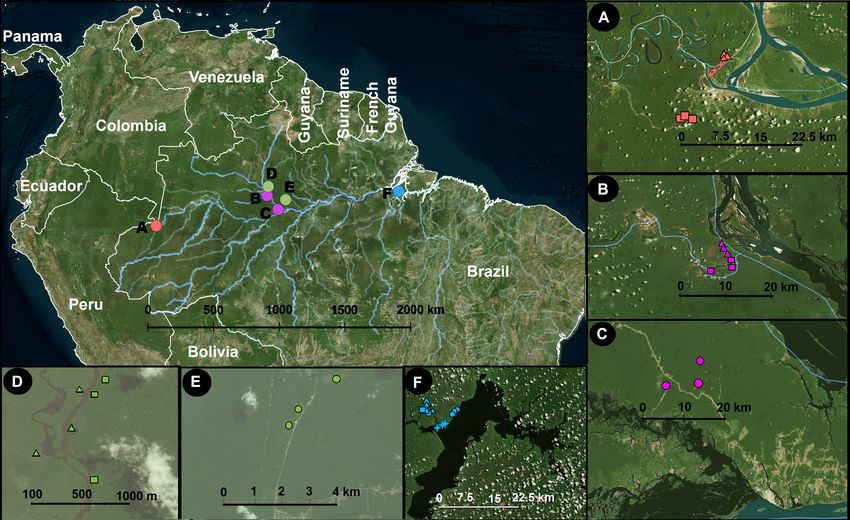
A moderate percentage of the variation in Jaccard dissimilarities was explained by soil
physicochemical properties in the presence/absence data, for prokaryotes (31% in soil and
35% in litter; Fig. 3). For eukaryotes, the total explanatory power of soil physicochemical
properties was smaller (12% in soil and 16% in litter). For prokaryotes and eukaryotes,
the litter communities were more structured by soil characteristics than were the soil
communities. All variables explained small but significant proportions of the variance
Ritter et al. (2018), PeerJ, DOI 10.7717/peerj.5661 9/24Table 1 Soil effects on OTU richness and Shannon diversity. The importance of soil properties differed between taxon, substrate and diversity
metrics. Carbon content and pH were important in most of the cases. The table shows the coefficients of each predictor in four Bayesian general
multivariate regression model using Stochastic Partial Differential Equations (SPDE) that explicitly consider spatial correlation, modelling OTU
richness and effective number of OTUs dependent on soil properties for eukaryotes and prokaryotes in litter and soil, respectively. As the organic
carbon content and pH are important variables for soil biota, we use them as independent variables. Bold indicates important predictor variables
(credible intervals not crossing zero).
OTU richness Effective number of OTUs
Taxon Substrate Predictor Mean 0.025 0.975 Mean 0.025 0.975
quantile quantile quantile quantile
Intercept 6.14 2.31 9.95 6.07 2.03 10.43
pH 0.22 0.16 0.27 0.22 0.17 0.27
Soil Carbon −0.13 −0.19 −0.08 −0.15 −0.20 −0.10
Chemical −0.08 −0.14 −0.02 −0.08 −0.14 −0.02
Prokaryotes Physical 0.02 0.00 0.04 0.02 −0.01 0.04
Intercept 4.14 −4.78 12.65 5.04 −3.97 13.71
pH 0.03 −0.03 0.08 0.05 0.00 0.10
Litter Carbon −0.23 −0.28 −0.17 −0.21 −0.26 −0.16
Chemical −0.07 −0.12 −0.01 −0.05 −0.11 0.01
Physical 0.13 0.10 0.15 0.12 0.10 0.15
Intercept 3.28 −7.36 13.39 3.22 −6.49 13.22
pH 0.30 0.22 0.38 0.33 0.25 0.41
Soil Carbon −0.36 −0.46 −0.26 −0.36 −0.46 −0.27
Chemical −0.08 −0.20 0.04 −0.05 −0.17 0.06
Eukaryotes Physical 0.11 0.07 0.15 0.10 0.07 0.14
Intercept 4.93 −10.81 19.82 6.07 −10.14 21.34
pH 0.24 0.15 0.34 0.26 0.16 0.35
Litter Carbon −0.22 −0.32 −0.13 −0.23 −0.32 −0.14
Chemical −0.01 −0.12 0.10 0.00 −0.10 0.11
Physical −0.14 −0.19 −0.09 −0.15 −0.20 −0.10
in all communities and showed some weak but significant interactions considering
presence/absence matrices (Fig. 3) and a similar, strong proportion of the variance in
abundance data (Fig. S2). Organic carbon had the strongest effect in all substrates and for
both organism groups (ranging from 0.03 for eukaryotes in soil through 0.05 for eukaryotes
in litter to 0.08 for prokaryotes in both soil and litter).
Similarities in OTU diversity and turnover patterns between litter and
soil (research 3–4)
We found a weak positive regression between OTU richness of prokaryotes in litter
and in soil (adj. R2 = 0.25, p < 0.001; Fig. 4A) and between the effective number of
prokaryote OTUs in litter and in soil (adj. R2 = 0.1, p = 0.03; Fig. 4B). For eukaryotes, the
corresponding correlations were not significant (Figs. 4C and 4D). The plot ‘‘CXNCAMP3’’
had very low soil OTU richness, and excluding this data point strengthened the correlation
of OTU richness between soil and litter for prokaryotes (to adj. R2 = 0.46, p < 0.001;
Fig. S3A), but not for eukaryotes (Fig. S3B).
Ritter et al. (2018), PeerJ, DOI 10.7717/peerj.5661 10/24Table 2 Association between environmental distance and community turnover. Community dissim-
ilarity is significantly associated with geographical and soil environmental distance for eukaryote and
prokaryote communities in soil and litter. The Multiple Regressions were based on the geographical dis-
tance, Euclidean distance matrices of soil properties and community Jaccard dissimilarity indexes. Geo-
graphic distances were significant for all communities turnover; however, as geographical closest places are
usually more environmental similar, we cannot separate the effect of soil properties from the spatial corre-
lation. All community turnovers were significant with 10,000 permutations (p < 0.001) with the follow R2 :
prokaryote soil (R2 = 0.36 for presence/absence and R2 = 0.36 for relative abundance), prokaryote litter
(R2 = 0.39 for presence/absence and R2 = 0.35 for relative abundance), eukaryote soil (R2 = 0.21 for pres-
ence/absence and R2 = 0.20 for relative abundance) and eukaryote litter (R2 = 0.32 for presence/absence
and R2 = 0.30 for relative abundance).
Presence/absence Relative abundance
Taxon Substrate Predictor Coefficients p value Coefficients p value
Intercept −24.28 1.00 −8.63 1.00
Geo_dist 0.15 0.00 0.15 0.00
Chemical 0.23 0.00 0.21 0.01
Soil
Physical 0.18 0.01 0.17 0.01
pH 0.30 0.00 0.34 0.00
Prokaryotes Carbon 0.20 0.01 0.16 0.03
Intercept −60.59 1.00 −37.45 1.00
Geo_dist 0.19 0.00 0.20 0.00
Chemical 0.18 0.00 0.11 0.09
Litter
Physical 0.16 0.00 0.19 0.00
pH 0.32 0.00 0.33 0.00
Carbon 0.32 0.00 0.28 0.00
Intercept 43.54 1.00 59.63 1.00
Geo_dist 0.09 0.06 0.10 0.03
Chemical 0.12 0.16 0.11 0.21
Soil
Physical 0.15 0.04 0.16 0.03
pH 0.22 0.00 0.24 0.00
Eukaryotes Carbon 0.29 0.00 0.23 0.01
Intercept −8.86 1.00 10.65 1.00
Geo_dist 0.15 0.00 0.17 0.00
Chemical 0.26 0.00 0.22 0.00
Litter
Physical 0.09 0.13 0.05 0.40
pH 0.19 0.00 0.24 0.00
Carbon 0.33 0.00 0.29 0.00
The OTU communities in litter and in soil tended to be separated in the NMDS
ordination space, although there was some overlap especially for the igapó plots (Fig. 5).
The PERMANOVA test indicated weak but significant effects (all p < 0.001) of substrate
type on compositional dissimilarities of both prokaryotes (R2 = 0.06, F = 5.83, for
presence/absence data and R2 = 0.07, F = 6.7, for abundance data) and eukaryotes
(R2 = 0.03, F = 2.8 for presence/absence data and R2 = 0.04, F = 3.74, for abundance
data). Habitat type had an even stronger effect on the compositional dissimilarities of both
prokaryotes (R2 = 0.17, F = 5.48, for presence/absence data and R2 = 0.18, F = 5.68, for
abundance data) and eukaryotes (R2 = 0.1, F = 2.8, for presence/absence data and R2 = 0.1,
Ritter et al. (2018), PeerJ, DOI 10.7717/peerj.5661 11/24Figure 3 Variation in OTU community composition in Amazonian soil samples explained by soil
characteristics. Results of the variance partition analysis based on Jaccard dissimilarity distance-based
analysis. Small but significant proportions of soil and litter communities vary with soil variables, and a
small but significant proportion shows variation shared by soil variables. All values represent the propor-
tion of variation explained by the factor/interaction. Chemical variables are shown in green (based on the
first PCA of chemical variables, see Table S3 for details), physical variables in purple (based on first PCA
axis of soil texture, see Table S2 for details), pH in blue, and carbon content in orange. The prokaryote
communities are more structured by soil characteristics than are the eukaryote ones. Inside each taxo-
nomic group, the litter communities are more structured by soil characteristics than are the soil commu-
nities.
Full-size DOI: 10.7717/peerj.5661/fig-3
F = 2.98, for abundance data). Taxonomic composition at the phylum and kingdom (for
fungi) level was similar in litter and in soil both for prokaryotes and for eukaryotes (Fig. 6).
However, in prokaryotes Actinobacteria is the second most abundant phylum in litter
when taking into account the relative abundances (Fig. 6).
DISCUSSION
Soil predictors of OTU diversity and community turnover
In this study, we tested the impact of physicochemical soil properties on the OTU diversity
(richness and effective number of OTUs) and community turnover of prokaryotes and
eukaryotes in soil and litter across Brazilian Amazonia. We found that that the soil properties
we quantified had variable effects on OTU diversity and community turnover for litter
and soil, and the effect varied between prokaryotic and eukaryotic organisms. The variable
Ritter et al. (2018), PeerJ, DOI 10.7717/peerj.5661 12/24Figure 4 Relation between OTU diversity in soil and litter. Prokaryotes (16S) are showed in (A) OTU
richness and (B) effective number of OTUs; eukaryotes (18S) are showed in (C) OTU richness and (D) ef-
fective number of OTUs in the Amazonian soil samples. The blue line shows a linear regression with stan-
dard error indicated by the shaded area for significant correlations. The relationship between soil layers
(litter vs soil) is weak and differs between taxa, with only prokaryotes showing a significant correlation for
richness and effective number of OTUs. This result suggests that it OTU diversity in litter is unsuitable as
proxy for the OTU diversity in the soil and vice versa.
Full-size DOI: 10.7717/peerj.5661/fig-4
with the highest explanatory power was overall organic carbon for both prokaryotes
and eukaryotes. OTU diversity and community turnover were better explained by soil
properties in litter than in soil.
Considering the results from the linear models, in general organic carbon and pH were
the strongest factors in explaining soil prokaryotic and litter and soil eukaryotic diversity.
Our results show a positive correlation between soil pH and OTU diversity, which is
Ritter et al. (2018), PeerJ, DOI 10.7717/peerj.5661 13/24Figure 5 Community structure related to substrate type (litter and soil) and habitat types. Visualiza-
tion of differences in OTU composition (measured with the presence/absence matrixes using Jaccard dis-
similarity index in A and B; and measured with relative abundance matrixes using Bray-Curtis dissimi-
larity index) using non-metric multidimensional scaling (NMDS) for (A) and (C) prokaryotes (16S) and
(B) and (D) eukaryotes (18S). Symbols represent different habitats. Blue represent litter samples and green
soil samples. A small but statistically significant (PERMANOVA test) separation between the substrates
can be observed along the second ordination axis for both groups of organisms. The strongest and most
significant separation is observed between habitat types.
Full-size DOI: 10.7717/peerj.5661/fig-5
expected since much of the soils in Amazonia are acidic. For instance, for soil samples,
Lauber et al. (2009) found pH to be the main factor in explaining bacterial phylogenetic
diversity and phylogenetic composition, where soils with pH between 4.5 and 8 had the
highest bacterial diversity. Tropical forests with high macro-organismic diversity had soil
with pH < 4.5 and had the lowest bacterial diversity (Lauber et al., 2009). In our samples,
pH was overall low and its variation was moderate, from 3.65 to 5.14, thereby in less acid
soil we found highest OTU diversity considering both richness and effective number of
OTUs.
We also found that variation in pH was significant for all community turnovers, and
that it was the strongest variable in explaining community turnover for prokaryotes (in
both soil and litter) and for eukaryotes in soil (Table 2). However, we found that pH had no
effect on prokaryote richness in litter (Table 1). The consistent effect of pH for prokaryotes
and eukaryotes in the soil, with significant effect in community turnover and diversity, but
inconsistent effect in litter support the findings of Gregorich et al. (2017), who found no
correlation of soil properties and litter decomposition. This points to the independence of
the environmental factors regulating each substrate.
We found significant effects of variation in organic carbon on all community turnovers
with the strongest effect for eukaryotes in litter (Table 2). Additionally, we found a
negative correlation of soil organic carbon with OTU diversity for all groups (Table 1). Soil
biodiversity has previously been found to have an effect on carbon sequestration (Wagg
Ritter et al. (2018), PeerJ, DOI 10.7717/peerj.5661 14/24Figure 6 Taxonomic composition of Amazonian soil and litter micro-organismic communities. The
plots show the fraction of OTUs divided by taxonomic group for (A) relative frequency of OTU pres-
ence for prokaryotes; (B) relative abundance of OTU for prokaryotes; (C) relative frequency of OTU pres-
ence for eukaryotes; (D) relative abundance of OTU for eukaryotes. There is no clear taxonomic variation
among groups in litter vs soil, in either the prokaryote or the eukaryote data for presence/absence. The rel-
ative abundance data shows a higher frequency of Actinobacteria in litter compared with soil and a higher
abundance of Chloroflexi and Bacterioides in soil sample for prokaryotes. For eukaryotes is possible ob-
serve a highest relative abundance of Arthropoda and Chloroplastida in soil than litter samples.
Full-size DOI: 10.7717/peerj.5661/fig-6
et al., 2014). However, the relationship between soil biodiversity and carbon has varied
across studies (Nielsen et al., 2011). Furthermore, Fierer et al. (2012) and De Lima Brossi et
al. (2014) found that soil organic matter was related to microbial community composition
in several different vegetation types. The negative correlation between soil organic carbon
content and OTU diversity reported here might be related to high nutrient turnover in
high-diversity soil/litter, keeping the carbon stock locked in aboveground biomass. Our
results support the findings of Wall et al. (2008), who found a positive influence of the
richness of soil biota on decomposition rates in wet tropical environments. Along the same
line, Wagg et al. (2014) found that soil diversity and soil community composition are related
through nutrient cycling. Decreases in soil diversity and the related changes in community
composition alter the communities’ capacity to break down organic matter and recycle
nutrients, slowing down the return of nutrients to the above-ground communities (Wardle
et al., 2004). These findings stress the complex nature of carbon-diversity dynamics and the
plant–soil feedback loop mediated by soil biota (Mangan et al., 2010). They furthermore
highlight a connection between decomposition rates and biodiversity in Amazonia that
should be better explored.
We found that prokaryotic community turnover is more strongly related with
environmental distance than eukaryotic community turnover which is mostly dominated
by fungi (fungi correspond to 35% of OTU richness and 50% of OTU relative abundance
Ritter et al. (2018), PeerJ, DOI 10.7717/peerj.5661 15/24in our eukaryotic data; Figs. 6C and 6D). This is in agreement with the results from a global
bacterial and fungi soil sampling (Bahram et al., 2018). In our results, environmental
distances explained only a limited percentage of OTU community turnover (31–35% for
prokaryotes and 12–16% for eukaryotes; Fig. 3). This suggests that other factors, such as
precipitation and bacterial-fungal antagonistic interactions (Bahram et al., 2018), also need
to be considered to better understand the community turnover these organisms.
Biotic and abiotic interactions jointly determine soil properties, making it important
to consider environmental and biological interactions between variables. Indeed, our
variance analysis reveals several co-variances between soil properties, such as pH and
organic carbon and physical and chemical properties. Although these interactions were
weak, this analysis is important for providing a better understanding of the study system.
Considering physicochemical soil properties, we had a partial separation of the major
environmental types by the properties of their soils. It is in agreement with previous
studies, which report an association of soil types and habitats in Amazonia (e.g., Falesi,
1984; Prance, 1996). The soil texture (first axis of the physical PCA) was well separated
by the habitat types of flooded forests (igapós and várzeas), whereas terra-firme and
campinas were more spread in physical properties. On the other hand, the first axis of
chemical PCA was less well separated for flooded areas (igapós and várzeas). This result was
expected since there is a variation within habitat types, especially flooded forests (Kalliola et
al., 1993; Tuomisto, Ruokolainen & Yli-Halla, 2003; Tuomisto, Zuquim & Cárdenas, 2014;
Tuomisto et al., 2016). Furthermore, terra-firme forests have been reported to vary in soil
nutrients (e.g., Tuomisto, Ruokolainen & Yli-Halla, 2003; Tuomisto, Zuquim & Cárdenas,
2014; Tuomisto et al., 2016; Fine et al., 2005), consistent with the variation observed in our
plots. However, due to the limited sampling in our studies, the variation we detected was
small (Fig. 2B). Our finding that soil texture is similar among the flooded environments
(várzeas and igapós) and that soil texture was an important factor for eukaryote diversity
(both soil and litter) is consistent with the previously reported community similarity
among these environmental types based on the data from the same samples (Ritter et al.,
2018).
Contrasting litter and soil diversity
The correlations between soil and litter OTU diversity (richness and the effective number
of OTUs) were significant for prokaryotes but not for eukaryotes. This is congruent with
previous reports that showed the independence of litter accumulation from properties of
the underlying soils (Gregorich et al., 2017).
We expected a difference in taxonomic composition between litter and soil communities,
with microbes dominating the soil (e.g., Bates et al., 2013; Mahé et al., 2017) and plant and
nematode OTUs dominating the litter due to it mainly being composed of leaves and
roots. However, we found the highest plant (Chloroplastida) richness and abundance in
the soil samples. Furthermore, unlike Porazinska et al. (2012) who found a dominance of
nematodes in the litter of tropical forests, we found very similar proportions of nematode
OTUs in soil and litter, with the highest richness and abundance in the soil (Figs. 6C
and 6D). This pattern of no clear taxonomic differences between soil and litter layers is
Ritter et al. (2018), PeerJ, DOI 10.7717/peerj.5661 16/24consistent with respect to all dominant groups at the phylum and kingdom levels (Fig. 6).
This suggests that, on the Amazon basin scale, the taxonomic composition at higher
levels (phylum and kingdom) is consistent between litter and soil with some variation in
abundance for some groups, such as Arthropoda and Chloroplastida for eukaryotes and
Actinobacteria, Bacterioides and Chloroflexi for prokaryotes (Fig. 6).
Interestingly, the prokaryotic phyla that dominated our samples were only partly
the same as those found dominant in a large global dataset (Figs. 6A and 6B; Delgado-
Baquerizo et al., 2018). While we also found Proteobacteria to be the most frequent phylum
considering both presence/absence and relative abundance, the second most frequent
phylum was Chloroflexi in presence/absence data for soil and litter and abundance for soil
in our samples, while this Chloroflexi was only the 5th most abundant in the global dataset.
Actinobacteria, the second most abundant phylum in the global database, was in our data
the second most abundant phylum just for abundance in litter samples. Moreover, the
rank-abundance distribution of the most dominant phyla was more even in our tropical
sample than in the global sample, with Proteobacteria accounting for just over 20% of
all reads (versus almost 40% in the global dataset) and eight phyla representing more
than 5% of relative frequency each (>70% of relative frequency) versus only four phyla
in Delgado-Baquerizo et al. (2018). Taken together, these differences highlight the need for
more studies across the Amazon basin to better characterize the taxonomic composition.
The OTU community compositions of both prokaryotes and eukaryotes were better
explained by habitat type (terra firme, várzea, igapó, campina) than they were by substrate
type (soil, litter), which was expected since both substrates should share a large number of
organisms. The substrate types were weakly differentiated at the OTU level, but we could
not observe any difference at the phylum or kingdom levels for presence-absence and only a
small difference for abundance data (Fig. 6). For instance, fungi usually dominate eukaryotic
soil communities in any environment, including tropical forests (Tedersoo et al., 2017),
but the dominant fungal taxa (OTU) may vary considerably even at local and sub-local
scales (Urbanová, Šnajdr & Baldrian, 2015). In a study conducted in the western parts of
the Czech Republic, similar results for bacteria and fungi were found: the phylum level
indicated the same taxonomic groups as dominant in soils and litter, but there were striking
differences at the OTU level in these substrates (Urbanová, Šnajdr & Baldrian, 2015).
CONCLUSIONS
In this study, we found OTU diversities to be related between soil and litter in prokaryotes,
but not in eukaryotes. We also found that physicochemical soil properties can predict soil
and litter diversity in Amazonia to some extent. In particular, we found a positive correlation
for pH and a negative correlation for soil organic carbon content with respect to prokaryotic
and eukaryotic OTU diversity. Furthermore, we found a significant effect of variation in
soil organic carbon content on community turnover. In general, our results stress the
complexity of soil-biodiversity relationships, and hence the importance of considering
multiple factors and their interactions in the characterization of biodiversity patterns. Soil
biodiversity is crucial for carbon cycling in terrestrial ecosystems, and our results suggest
Ritter et al. (2018), PeerJ, DOI 10.7717/peerj.5661 17/24that additional studies to better understand the relationship between diversity (above and
belowground) and carbon cycles may help modelling carbon deposition and biodiversity
patterns.
ACKNOWLEDGEMENTS
We thank Anna Ansebo, Sven Toresson, and Ylva Heed for laboratory and administrative
assistance; Mats Töpel for help with bioinformatics; and Quiterie Haenel for help with the
DNA extractions and fruitful discussions. We thank Hans ter Steege for advice on sampling
localities and experimental design. We are grateful to members of our research group for
discussions and suggestions. Additional computational analyses were run at the University
of Gothenburg bioinformatics cluster at the Department of Biological and Environmental
Sciences (http://albiorix.bioenv.gu.se/).
ADDITIONAL INFORMATION AND DECLARATIONS
Funding
This study had primary financial support from CNPq (Conselho Nacional de
Desenvolvimento Científico e Tecnológico - Brazil: 249064/2013-8) and the Swedish
Research Council (B0569601). Antonelli is further supported by the European Research
Council under the European Union’s Seventh Framework Programme (FP/2007-2013,
ERC Grant Agreement n. 331024), the Swedish Foundation for Strategic Research, a
Wallenberg Academy Fellowship, the Faculty of Sciences at the University of Gothenburg,
and the David Rockefeller Center for Latin American Studies at Harvard University. There
was no additional external funding received for this study. The funders had no role in study
design, data collection and analysis, decision to publish, or preparation of the manuscript.
Grant Disclosures
The following grant information was disclosed by the authors:
CNPq (Conselho Nacional de Desenvolvimento Científico e Tecnológico - Brazil):
249064/2013-8.
Swedish Research Council: B0569601.
European Research Council: 331024.
Swedish Foundation for Strategic Research.
David Rockefeller Center for Latin American Studies at Harvard University.
Competing Interests
The authors declare that they have no competing interests.
Author Contributions
• Camila D. Ritter conceived and designed the experiments, performed the experiments,
analyzed the data, contributed reagents/materials/analysis tools, prepared figures and/or
tables, authored or reviewed drafts of the paper, approved the final draft.
• Alexander Zizka and Fabian Roger analyzed the data, contributed reagents/materials/-
analysis tools, authored or reviewed drafts of the paper, approved the final draft.
Ritter et al. (2018), PeerJ, DOI 10.7717/peerj.5661 18/24• Hanna Tuomisto and Christopher Barnes authored or reviewed drafts of the paper,
approved the final draft.
• R. Henrik Nilsson conceived and designed the experiments, analyzed the data,
contributed reagents/materials/analysis tools, authored or reviewed drafts of the paper,
approved the final draft.
• Alexandre Antonelli conceived and designed the experiments, contributed
reagents/materials/analysis tools, authored or reviewed drafts of the paper, approved the
final draft.
Field Study Permissions
The following information was supplied relating to field study approvals (i.e., approving
body and any reference numbers):
The sample collection was authorized by Brazilian authorities: ICMBio (registration
number 48185-2) and IBAMA (registration number 127341).
Data Availability
The following information was supplied regarding data availability:
The raw data are provided in the Supplemental Files.
Supplemental Information
Supplemental information for this article can be found online at http://dx.doi.org/10.7717/
peerj.5661#supplemental-information.
REFERENCES
Auguie B, Antonov A, Auguie MB. 2016. Package ‘gridExtra’. Available at https:// cran.r-
project.org/ web/ packages/ gridExtra/ index.html.
Bahram M, Hildebrand F, Forslund SK, Anderson JL, Soudzilovskaia NA, Bodegom
PM, Bengtsson-Palme J, Anslan S, Coelho LP, Harend H, Huerta-Cepas J, Medema
MH, Maltz MR, Mundra S, Olsson PA, Pent M, Põlme S, Sunagawa S, Ryberg M,
Tedersoo L, Bork P. 2018. Structure and function of the global topsoil microbiome.
Nature 560:233–237 DOI 10.1038/s41586-018-0386-6.
Baldeck CA, Tupayachi R, Sinca F, Jaramillo N, Asner GP. 2016. Environmental
drivers of tree community turnover in western Amazonian forests. Ecography
39(11):1089–1099 DOI 10.1111/ecog.01575.
Bardgett RD, Van Der Putten WH. 2014. Belowground biodiversity and ecosystem
functioning. Nature 515(7528):505–511 DOI 10.1038/nature13855.
Barnes CJ, Maldonado C, Frøslev TG, Antonelli A, Rønsted N. 2016. Unexpectedly high
beta-diversity of root-associated fungal communities in the Bolivian Andes. Frontiers
in Microbiology 7:1377 DOI 10.3389/fmicb.2016.0137.
Basset Y, Cizek L, Cuénoud P, Didham RK, Guilhaumon F, Missa O, Novotny V,
Ødegaard F, Roslin T, Schmidl J, Tishechkin AK. 2012. Arthropod diversity in a
tropical forest. Science 338(6113):1481–1484 DOI 10.1126/science.1226727.
Ritter et al. (2018), PeerJ, DOI 10.7717/peerj.5661 19/24Bates ST, Clemente JC, Flores GE, Walters WA, Parfrey LW, Knight R, Fierer N. 2013.
Global biogeography of highly diverse protistan communities in soil. The ISME
Journal 7(3):652–659 DOI 10.1038/ismej.2012.147.
Blaxter M, Mann J, Chapman T, Thomas F, Whitton C, Floyd R, Abebe E. 2005.
Defining operational taxonomic units using DNA barcode data. Philosophical
Transactions of the Royal Society B: Biological Sciences 360(1462):1935–1943
DOI 10.1098/rstb.2005.1725.
Buckley DH, Schmidt TM. 2001. Environmental factors influencing the distribution of
rRNA from Verrucomicrobia in soil. FEMS Microbiology Ecology 35(1):105–112
DOI 10.1111/j.1574-6941.2001.tb00793.x.
Buuren S, Groothuis-Oudshoorn K. 2011. mice: multivariate imputation by chained
equations in R. Journal of Statistical Software 45(3):1–68.
Cámara-Leret R, Tuomisto H, Ruokolainen K, Balslev H, Munch Kristiansen S. 2017.
Modelling responses of western Amazonian palms to soil nutrients. Journal of Ecology
105(2):367–381 DOI 10.1111/1365-2745.12708.
De Lima Brossi MJ, Mendes LW, Germano MG, Lima AB, Tsai SM. 2014. Assessment
of bacterial bph gene in Amazonian Dark Earth and their adjacent soils. PLOS ONE
9(6):e99597 DOI 10.1371/journal.pone.0099597.
Delgado-Baquerizo M, Oliverio AM, Brewer TE, Benavent-González A, Eldridge DJ,
Bardgett RD, Maestre FT, Singh BK, Fierer N. 2018. A global atlas of the dominant
bacteria found in soil. Science 359(6373):320–325 DOI 10.1126/science.aap9516.
Donagema GK, De Campos DB, Calderano SB, Teixeira WG, Viana JM. 2011. Manual
de métodos de análise de solo. Embrapa Solos-Documentos (INFOTECA-E).
Available at https:// www.infoteca.cnptia.embrapa.br/ handle/ doc/ 990374.
Edgar RC. 2013. UPARSE: highly accurate OTU sequences from microbial amplicon
reads. Nature Methods 10(10):996–998 DOI 10.1038/nmeth.2604.
Elbrecht V, Leese F. 2015. Can DNA-based ecosystem assessments quantify species
abundance? Testing primer bias and biomass—sequence relationships with an
innovative metabarcoding protocol. PLOS ONE 10(7):e0130324
DOI 10.1371/journal.pone.0130324.
Falesi IC. 1984. Estado atual de conhecimento dos solos da Amazônia Brasileira.—
In: Simpósio do Trópico Umido, Belém, 1984. Embrapa—CPATU, Documentos
36:168–191.
Falkowski PG, Fenchel T, Delong EF. 2008. The microbial engines that drive Earth’s
biogeochemical cycles. Science 320(5879):1034–1039 DOI 10.1126/science.1153213.
Faoro H, Alves AC, Souza EM, Rigo LU, Cruz LM, Al-Janabi SM, Monteiro RA, Baura
VA, Pedrosa FO. 2010. Influence of soil properties on the diversity of bacteria in
the Southern Brazilian Atlantic Forest. Applied and Environmental Microbiology
76(14):4744–4749 DOI 10.1128/AEM.03025-09.
Fierer N, Leff JW, Adams BJ, Nielsen UN, Bates ST, Lauber CL, Owens S, Gilbert JA,
Wall DH, Caporaso JG. 2012. Cross-biome metagenomic analyses of soil microbial
communities and their functional attributes. Proceedings of the National Academy of
Sciences 109(52):21390–21395 DOI 10.1073/pnas.1215210110.
Ritter et al. (2018), PeerJ, DOI 10.7717/peerj.5661 20/24Fine PV, Daly DC, Muñoz GV, Mesones I, Cameron KM. 2005. The contribution of
edaphic heterogeneity to the evolution and diversity of Burseraceae trees in the
western Amazon. Evolution 59(7):1464–1478 DOI 10.1554/04-745.
Friesen ML, Porter SS, Stark SC, Von Wettberg EJ, Sachs JL, Martinez-Romero E. 2011.
Microbially mediated plant functional traits. Annual Review of Ecology, Evolution,
and Systematics 42:23–46 DOI 10.1146/annurev-ecolsys-102710-145039.
Garnier S. 2016. viridis: Default color maps from ‘matplotlib’[Software]. Available at
https:// cran.r-project.org/ web/ packages/ viridis/ index.html.
Goslee SC, Urban DL. 2007. The ecodist package for dissimilarity-based analysis of
ecological data. Journal of Statistical Software 22(7):1–19.
Gregorich EG, Janzen H, Ellert BH, Helgason BL, Qian B, Zebarth BJ, Angers DA,
Beyaert RP, Drury CF, Duguid SD, May WE. 2017. Litter decay controlled by
temperature, not soil properties, affecting future soil carbon. Global Change Biology
23(4):1725–1734 DOI 10.1111/gcb.13502.
Harrell Jr FE, Dupont C. 2008. Hmisc: harrell miscellaneous. R package version 3.2.
Higgins MA, Ruokolainen K, Tuomisto H, Llerena N, Cardenas G, Phillips OL,
Vásquez R, Räsänen M. 2011. Geological control of floristic composition in
Amazonian forests. Journal of Biogeography 38(11):2136–2149
DOI 10.1111/j.1365-2699.2011.02585.x.
Hinsinger P, Bengough AG, Vetterlein D, Young IM. 2009. Rhizosphere: biophysics,
biogeochemistry and ecological relevance. Plant and Soil 321(1–2):117–152
DOI 10.1007/s11104-008-9885-9.
IBGE. 2004. Mapa de Vegetação do Brasil 1:5,000,000. IBGE—Instituto Brasileiro de
Geografia e Estatística. Available at https:// ww2.ibge.gov.br/ home/ presidencia/
noticias/ 21052004biomashtml.shtm.
Jost L. 2006. Entropy and diversity. Oikos 113(2):363–375
DOI 10.1111/j.2006.0030-1299.14714.x.
Junk WJ, Piedade MTF, Schöngart J, Cohn-Haft M, Adeney JM, Wittmann F. 2011. A
classification of major naturally-occurring Amazonian lowland wetlands. Wetlands
31(4):623–640 DOI 10.1007/s13157-011-0190-7.
Kalliola R, Puhakka M, Salo J, Linna A, Räsänen M. 1993. Mineral nutrients in fluvial
sediments from the Peruvian Amazon. Catena 20(3):333–349
DOI 10.1016/0341-8162(93)90009-E.
Kuramae EE, Yergeau E, Wong LC, Pijl AS, Van Veen JA, Kowalchuk GA. 2012. Soil
properties more strongly influence soil bacterial communities than land-use type.
FEMS Microbiology Ecology 79(1):12–24 DOI 10.1111/j.1574-6941.2011.01192.x.
Lauber CL, Hamady M, Knight R, Fierer N. 2009. Pyrosequencing-based assess-
ment of soil pH as a predictor of soil bacterial community structure at the
continental scale. Applied and Environmental Microbiology 75(15):5111–5120
DOI 10.1128/AEM.00335-09.
Ritter et al. (2018), PeerJ, DOI 10.7717/peerj.5661 21/24You can also read