COASTWATCH AUTUMN 2019 SURVEY RESULTS - Marine Litter All Ireland - Coastwatch Europe
←
→
Page content transcription
If your browser does not render page correctly, please read the page content below
COASTWATCH AUTUMN 2019 SURVEY RESULTS
                         All Ireland
                        Marine Litter

                              Coastwatch
                            February 2020

     Department of Civil, Structural and Environmental Engineering,
          Museum Building, Trinity College Dublin, Dublin 2,
                          www.coastwatch.org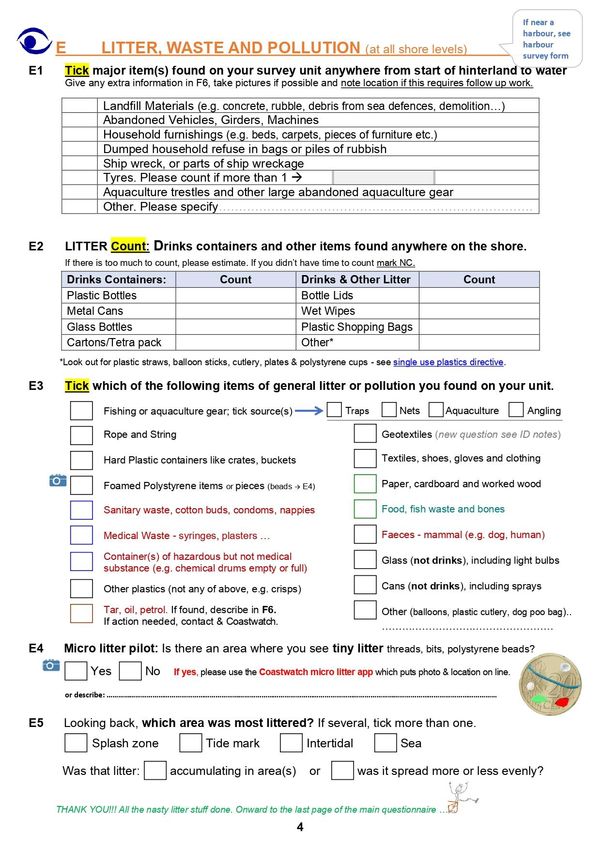
Coastwatch Autumn 2019 Annual Survey Results
                                                 All Ireland

                                                 Marine Litter
                             As reported by volunteer citizen scientists

                 Overall survey planning, coordination, verification and reporting
    Karin Dubsky and Ángel Duarte Campos with Michael Walsh and regional coordinators

                                   Data management and GIS mapping
                                            Ángel Duarte Campos

                                                 February 2020

                                                   Coastwatch

                 Department of Civil, Structural and Environmental Engineering,
                      Museum Building, Trinity College Dublin, Dublin 2,
                                      www.coastwatch.org

                                     Printed on 100% recycled paper.

This publication may be reproduced in whole or in part and in any form for educational and non-profit, non-commercial
purposes without special permission from Coastwatch, provided acknowledgement of the source is made. Coastwatch
would appreciate receiving a link to or copy of any publication that uses this publication as a source.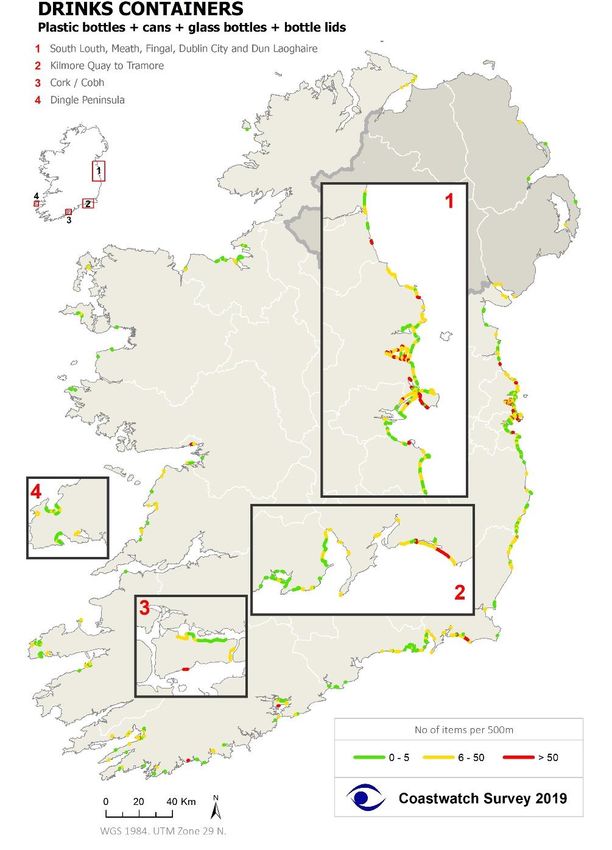
Acknowledgements

                                     Surveyors
We would like to thank our approximately 1100 volunteers who gave their time, effort,
and observations for this latest Coastwatch survey. Group leaders and surveyors who
agreed to be listed in public acknowledgment are recorded overleaf.

                              Regional Coordinators
A big thank you to our regional coordinators from Coastwatch groups, universities and
local authorities who informed others, went out to survey themselves and trained new
comers: In Louth Brendan McSherry (Louth CoCo), in Meath Frank O’Reilly
(Coastwatch), in Dublin Fingal Michael Walsh (Coastwatch), in Dublin City Adam
Horgan (Coastwatch), in Dun Laoghaire Roslyn Shaw (Coastwatch), in Wicklow Deirdre
Burns (Wicklow CoCo), in Wexford South Karin Dubsky and Mick Barry (Coastwatch),
in Waterford Paddy Houlihan and Alan Walshe (Coastwatch), in Cork Bernie Connolly
(CEF) and Dolf D’hondt (Save Bantry Bay), in Kerry Darach Ó Murchú (Element Outdoor
Training), in Clare Frances Galloway (Coastwatch), in Galway Sabine Springer
(Coastwatch), in Mayo Leo Brogan and Pamela Bergin (Mayo CoCo), in Sligo Aisa
Cooper (Patagonia), in Donegal East Dr. Trish Murphy.

  Thank you too for core team support in the survey and producing this report
             Michael Walsh and Tyko Kirsner; Emily Fair and Rita Hagan.

                                   Sponsorship

 We would like to thank the Marine Environmental Policy Unit of the Dept. of Housing,
Planning and Local Government for support and the indirect sponsorship from regional
          coordinators who hosted training sessions and travelled to shores.

                     Karin Dubsky and Ángel Duarte Campos
                 Overall Survey planning, coordination and reporting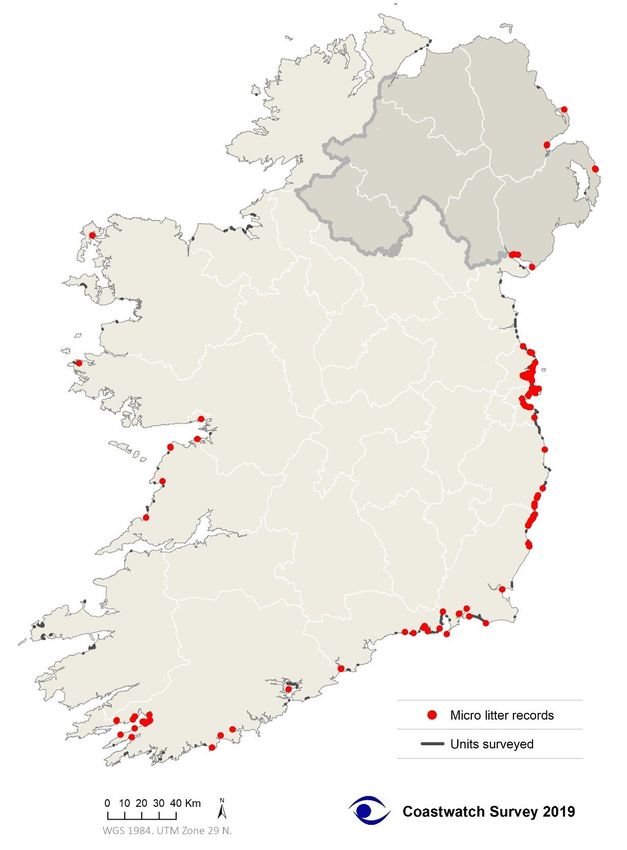
Coastwatch Surveyors Autumn 2019

 Names are only included where permission to publish was granted. The space for names on
             the form is limited, so one name represents groups and schools.

Adam Horgan                 Dympna Dunworth          Louise Farrell         Rita Hagan
Aine Walsh                  Eamonn Kavanagh          Love Your Lough        Robert Anthony
Aisa Cooper                 Eithne Hamill            Lynda Sheahy           Robert Kennedy
Alison Adamson              Elisabeth Pendergrass    Malahide Sea Scouts    Robert Nicholson
Andrew Cox                  Elizabeth Ewing          Malcom Starmar         Rosemary Watkins
Andy Kelly                  Ella O’Reilly            Maria McGuinness       Roslyn Shaw
Anita Clarke                Emily Fair               Mark Daly              S. N. Na Naomh Uile
Anita Daly                  Emily Shakespeare        Martina                Sabine Springer
Ann Maguire PCA             Enok Nagy Ferenc         Martyn Simpson         Sanja Budinski
Anna Aherne                 Eoin Mooney              Mary Cassidy           Sarah Hegarty
Anna Connelly               Erasmus group            Mary Grimes            Save this beach Group
Anne McGill                 Eva Reilly               Mary Looby             Seán Barry
Anthony Knott               Eva West                 Mary McDonald          Séan Jordan
Anthony Walsh               Fegan family             Matty Maddocks         Senan O’Reilly
Aoife Ní Rathaille          Ferenc Enok Nagy         Maura O'Shea           Sharon Nallen
Ardscoil Ris                Fergal O’Dowd            Maurice Murphy         Shay Horan PCA
Arklow Rowing Club          Fergus McCaffery         Megan Lee              Shem Berry
Arthur Healy PCA            Fran Sheahy              Michael Bloor          St Francis’ School
Athena Michaelides          Frank O’Reilly           Michael Cox            Susan Enticknap
Belmullet VTOS              Freddie Drohan           Michael Glynn          TCD Envir. Society
Bernadette Connolly         Friends of The Raven     Michael McGovern       Terry
Bethan Goodridge            Friends of The Wren      Michael Walsh          Timoleague National
Blackrock Tidy Towns        Gemma Hooper-Jones       Michele O’Connor-      School
Brendan McSherry            Glenarm Wildlife Group   Connolly               Tommy Breen
Brian Curran                Grace O’Sullivan         Mick Berry             Trish Murphy
Carlingford Tidy Towns      Grania Glynn             Molly O'Shea           Val Freeman
Caroline Crowley            Heidi Bedell             Nancy Quinn            Veryan Scott-Hayward
Cathal Copeland             Helen Deacon             Noel McKeown           Vicky White
Cathal Kelly                Ian Beaney               O'Brien Family         Wicklow School
Catherine Walsh             Iona Crawford Topp       Olivia McCartan        Wild Bunch
Cathy Lee                   Iseult Cummins           Paddy Houlihan         YouthTrain Ctc
Christine Simpson           Jack Berry               Pat Healy PCA
Ciara Connelly              James Cassidy            Patricia Goodbody
Ciara O’Brien               Jeanette Bloor           Patrick Doyle
Cilian Roden                Jim Shealy               Patrick Jackson
Colm Maguire                Joe Aherne               Paul Dubsky
Conor McMahon               John Bociek              Paul Inglis
Cordula Maguire             Jonathan Mason           Paul Quigley
Cormac Nolan                Jonnie Goyer             Paul Woodlock
D’hondt family              Julia Dubsky             PCA Beach Committee
Darach Ó Murchú             Julien Beuken            Pearson family
David Costello              Karen Meikle             Peta Taafe
David Flynn                 Karin Dubsky             Phil O’Callaghan PCA
David West                  Katie Houlihan           Philomena Cahill
Debbie Doyle                Liam MacNamara           Prim Duplessis
Debbie Reid                 Lily Grimes              Pringle family
Derek Harrington            Linda O’Dwyer            Rebecca Stokes
Diane Orr                   Liz O’Brien              Rigney grandchildren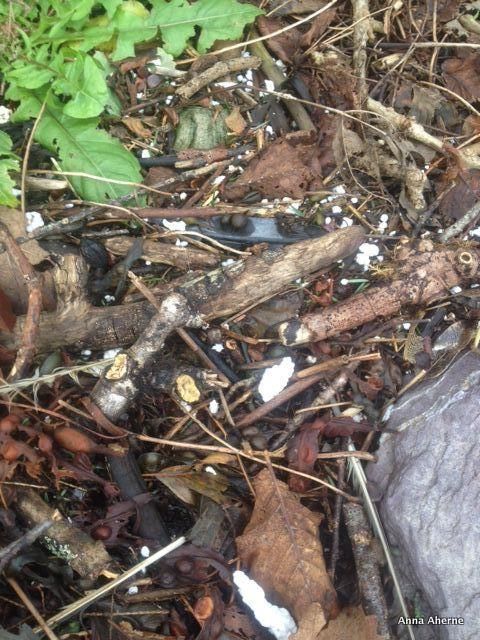
Content

1.      Introduction .................................................................................................................................... 1
2.      Data gathered and used .................................................................................................................. 1
3.      Large Waste and Shipwrecks ........................................................................................................... 2
     3.1. Shipwrecks.................................................................................................................................... 3
     3.2. Dumped household refuse ........................................................................................................... 4
     3.3. Large Aquaculture Waste and Abandoned Gear .......................................................................... 5
     3.4. Abandoned vehicles, girders and machines ................................................................................. 6
     3.5. Landfill materials .......................................................................................................................... 6
     3.6. Tyres ............................................................................................................................................. 7
     3.7. Comparing the Fingal (N=111) and Cork (N=62) county surveys with the national average. ....... 9
4.      Litter Counts - Drinks Containers, Plastic Bags and Wet wipes ..................................................... 10
     4.1 Drinks Container Counts .............................................................................................................. 10
     4.2 Mapping drinks container density ............................................................................................... 12
     4.3 Wet Wipes ................................................................................................................................... 15
     4.4        Other Counts ......................................................................................................................... 16
5.      Small Litter Recorded .................................................................................................................... 19
     5.1 Rope and string ........................................................................................................................... 20
     5.2 Fishing, Angling and Aquaculture litter ....................................................................................... 20
     5.3. Foamed Polystyrene ................................................................................................................... 22
     5.4.       Sanitary Waste ...................................................................................................................... 22
     5.5.       Other Small Litter and Other Counts ..................................................................................... 24
6.      Micro litter .................................................................................................................................... 24
7.      Littering in Context ........................................................................................................................ 26
8.      Way Forward ................................................................................................................................. 27
Glossary ................................................................................................................................................. 28
Annex I................................................................................................................................................... 29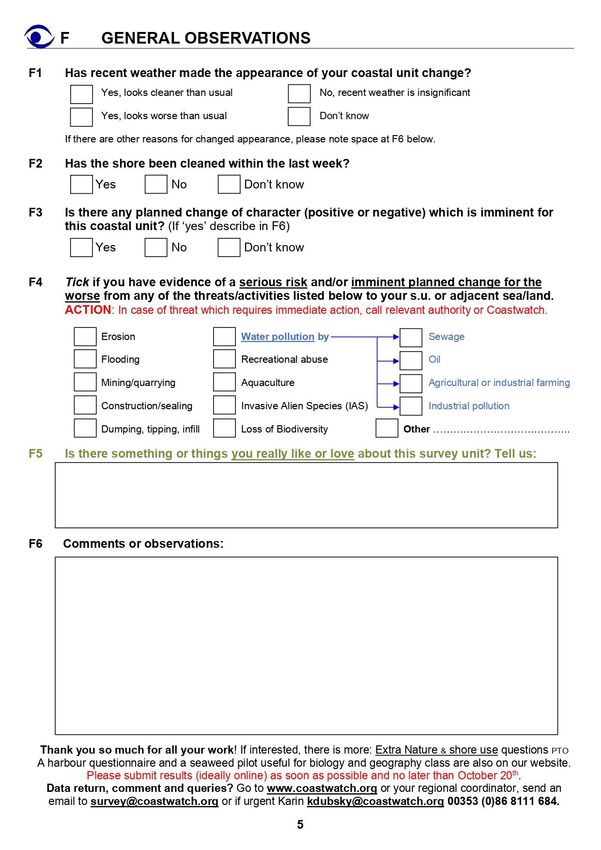
1. Introduction
The Coastwatch survey involves volunteers going out to any shore they have booked online or
with regional coordinators and completing a survey form per 500 m of shore around low tide.
This is referred to as a survey unit or s.u. in the report.
The citizen scientists then return their results online, or by post to the Coastwatch office in
Trinity College Dublin, augmented by photos and video clips giving a snapshot of the coast of
Ireland North and South in the September 15th to October 15th survey period.
For detailed method and full survey form please see www.coastwatch.org and review survey
materials. The Marine litter and context questions are provided in Annex 1.
For new surveyors training is provided. Training typically focusses on shore functioning, tides
and biodiversity in layman’s language - who might live or visit what habitat or area and what
they need. Regarding marine litter the more unusual or less obvious materials are pointed out
– such as wet wipe ropes, geotextiles, mussel rope.

   2. Data gathered and used
Data was organised and cleaned, duplicates used for cross checks and the form with more
detailed information used. Inaccessible sites were separated out.
In the autumn 2019 survey over 570 survey units were returned by surveyors in Ireland North
and South. After eliminating inaccessible and duplicate sites, 540 survey units were used in the
marine litter analyses presented in these results. Other reports cover biodiversity, shore
character and water quality.
Results are presented starting with largest waste items, followed by select litter counts, then
smaller litter found and finally presence/absence of micro litter. Context of how this compares
to previous shore visits, whether the shore was recently cleaned, and threat of dumping were
also included.
When comparing results with those from recent years, it should be noted that the number of
survey sites is similar to 2016 and 2017 and marginally below 2018. There was a slight shift
towards urban and East coast sites in 2019. The largest number of returns came from Fingal,
then Wexford, Cork, Waterford, Kerry and Sligo as figure 1 shows.

                                               1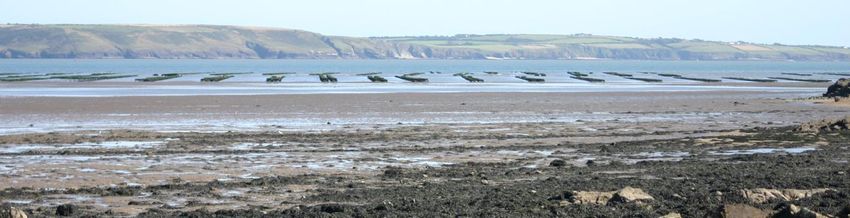
120               112
 100
  80                                      70
                                                       63
  60                                           50           47
                         30         33                                                        36
  40    20                    23                                         18              18
  20          3                                                               9      3                    7            5    8
                                                                 0                                    0            0
   0

 Figure 1. Number of survey unit surveyed per county in the All Ireland in Coastwatch 2019 results, presented in clockwise
                                           direction from Co Louth. (N = 540)

    3. Large Waste and Shipwrecks
Q: Tick which large waste types you found in your 500 m survey unit and if it doesn’t fit into any
of the 7 categories, tick ‘other’ and describe.
Results are shown in figure 2 as percentage of survey units where the category of waste was
recorded. The bars are colour coded as improvement (green), worsening by 2 or more % points
(orange) or no change ± 1 % (grey) in comparison with 2018 data.
Surveyor reports of large waste show an improvement of 2 or more % for all categories except
abandoned machinery, compared to the previous year.

                                               Tyres

                                 Landfill Materials

        Abandoned Vehicles, Girders, Machines

 Aquaculture trestles & other aquaculture gear

                           Household furnishings

        Dumped household refuse (bags / piles)

                                         Ship Wreck

                                                       0             5             10          15             20           25
                                                                                  % of survey units

Figure 2. Large Waste recorded on the shore in the autumn 2019 Coastwatch survey expressed as percentage of 500m s.u.
with waste. Green indicates a decrease in waste recorded from previous years and orange a slight increase (of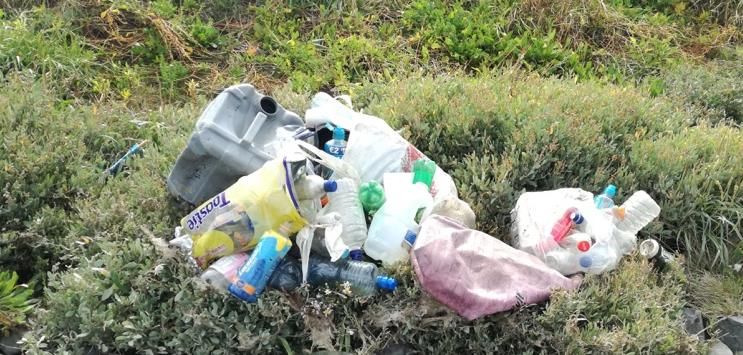
Other: Land-based                                                                                 35
   Construction/demolition waste                                                                           33
              Other: Water-based                                  10
   Fishing gear, nets, lobster pots                          9
         Water-based recreation                          7
                             Rope                 4
            Picnic/camping waste              3
                    Plastic fencing       2

                                      0           5          10        15      20        25       30        35        40

     Figure 3. Type of 'Other' large waste surveyors found on the shore (N=540) 2019 Coastwatch autumn survey.

3.1. Shipwrecks
Shipwrecks were observed in 4%
of survey units and included
historic fishing boats which are
now part of heritage. Surveyors
noted modern abandoned kayaks,
broken plastic dinghies and
paddles under ‘Other’ and not as
shipwreck. In Figure 3 above,
these were grouped as waste
from water-based recreation.
Where the ghost ship MV Alta,
which Storm Dennis brought, will
                                                      Picture 1. MV Alta Merchant ship stranded on rocks near Ballycotton Feb
be in our Coastwatch data in                                               16th 2020. Photo Mary Looby
autumn 2020 remains to be seen.

                                                                   3
3.2. Dumped household refuse
Bags, boxes and even loose heaps
of household refuse were recorded
in 5% of surveyed sites. This
frequently overlaps with areas
where household furnishings were
recorded and         areas where
surveyors noted that there was a
threat of dumping. The threat map
(figure 4) suggests that coastal
dumping is worst in inlets. In
several site comments and
observations from previous years
highlight that there is an ongoing
dumping problem in one spot or
along a short stretch of coast with
easy but secluded car access.

  Picture 2. Dumped large waste in Inner
 Malahide estuary. Photo Gemma Hooper.

                                           Figure 4. Sites mapped where on surveyor opinion, there is a threat of
                                                   dumping or landfilling in the survey unit. 2019 survey.

                                                    4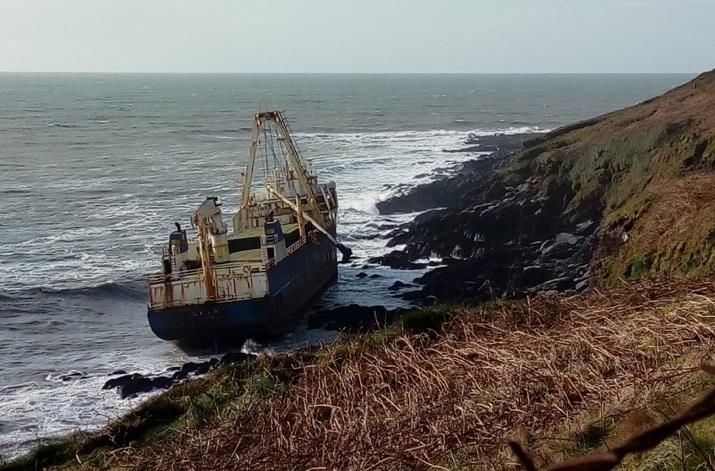
3.3. Large Aquaculture Waste and Abandoned Gear
This waste was found in 8.5% of the sites surveyed in 2019. While this appears to be a decrease
over the peak year of 2018, GIS mapping of results showed that the 2019 survey does not
include several aquaculture areas surveyed previously in 2018 in Cork, Wexford and Donegal.
Once that is taken into account there is no improvement. As a general observation, large
aquaculture waste typically stays very near to, or in the aquaculture operation areas and is
often accompanied by small aquaculture waste – see map figure 6.
Several surveyors suggested that where there is shellfish aquaculture you are likely to find large
waste as in abandoned, broken trestles, long line floats or sorting equipment on shores nearby,
along with smaller plastic waste like netlon bags and hooks. There is no independent study of
this and no annual license compliance reports to use as crosscheck for this observation.
                       12
                       10                                                                             11,7
   % of survey units

                        8
                                                                                                                       8,5
                        6                                           7,0
                                                    6,9
                        4          5,4                                               4,7
                        2
                        0
                                  2014            2015             2016             2017             2018             2019
Figure 5. Presence of large aquaculture gear on the shore over the last 6 annual Coastwatch surveys (N= 500 – 600 s.u. per
                                  survey, with less aquaculture areas included in 2019)

                       Figure 6. Map of Aquaculture Waste- large and small - found on the Shore in the 2019 Coastwatch survey.

                                                                          5
3.4. Abandoned vehicles, girders and machines
This waste category which also included large machine parts was noted on 9.2% of shores and
was the only waste category which had risen slightly. Some cases are linked to erosion, where
an old dump is being washed out as beside Bray harbour and at least one is linked to part of a
building falling down onto the shore at Kilmichael Point Co Wexford. Others are linked to
aquaculture and lost vehicles.
3.5. Landfill materials
Landfill materials were recorded on 16.3% of shores. The map of locations where Landfill materials
were reported (figure 7 below) shows this is widespread. The majority
of infill or infill surface is made up of earth, stones and vegetation.
One 2019 oddity being followed up was reported in Courtown
harbour, where earth appears to be dredge spoil piled onto land
adjacent to the shore the previous year and is now eroding, revealing
some waste but also fine harbour silt (see photo).
In 33 sites (6.6% of shores) surveyors noted that the earth and stone
landfill included construction/demolition waste, or appeared to
Picture 3. Sea eroding dredge
consist mainly of construction/demolition waste as mapped in spoil placed on shore as
figures 7 and 8 below. Surveyor photos include lumps of tarmac, beneficial reuse. Courtown.
walls with polystyrene insultation and wiring.
Figure 7. Landfill materials, including C&D waste recorded Figure 8. Sites with land fill materials mapped with sites
on the shore Coastwatch survey 2019. deemed threatened by erosion in opinion of surveyors.
Coastwatch autumn survey 2019
6Ireland does not have an erosion management policy. With climate change awareness of
potential and real coastal erosion and flood risk is growing, earth and stones appear to be a
simple benign mitigation method, also used by some authorities. While permission is required
to tackle erosion in this way, it is not easy to establish whether a foreshore license and/or
planning permission are required or indeed should have been sought when the material arrives
without permit. Law enforcement is difficult and there is no central register of what is licensed
under the Foreshore Act or granted planning permission, or granted retention with conditions.
In figure 8 above, the surveyor report of imminent threat of erosion is overlaid onto the map
where landfill was recorded. The map highlights that in Fingal, south Wexford and Cork
surveyors often recorded both a threat of erosion and presence of landfill materials, while
elsewhere this was rare.
3.6. Tyres
Tyres were found on 19% of shores and surveyors counted 877 tyres with distribution shown
in figure 9. Areas with less than 5 tyres are typically associated with either dumping, or lost
boat or harbour fenders. Larger clusters of tyres are strongly related to areas where they are
placed in lines into the intertidal close to seaweed as shown in photo below. This is to catch
peeler crabs for sale. None of these tyre traps are authorised. Most are in Natura 2000 sites.
Figure 9. Waste tyre distribution on the shore, grouped as 1-5 tyres, 6-10 tyres and > 10 tyres/su. Coastwatch survey 2019
7TYRE TRAPS
When crabs moult, they are very vulnerable to predation and normally hide under seaweed or stones.
If tyres are offered, they appear to prefer these perhaps as warmer or perceived save. It is much easier
for gatherers to collect the peeler crabs by sweeping a hand around the inner rim of the car tyre than
to look under stones and seaweed.
It is unauthorised and unsightly and the lack of limit to the number of tyres set and frequency of
collection appears to reduce the local crab population. In some areas, like Wexford harbour, we also
see tyres sinking into soft mud and in the past as they disappear, new ones were added.
Action:
In Cobh, Co Cork, a substantial number of tyres were removed by the local Coastwatchers
under direction of Anna Ahern and with help of a farmer’s tractor; then collected by Cork
county council.
In 2019 only some of the core tyre trap areas were surveyed. A map with 4 years of counts
(figure 10), however covers the known hotspots: The tyre trap problem appears to be
concentrated in the south of the country. Coastwatch is asking readers for information on
further trap lines which we may not be including in our survey areas (figure 10 below) at
present as government is set to now tackle the problem with us in spring and summer 2020.
Picture 4. Photo of Tractor tyre and
other gear in Castlemain harbour
protected site.
Figure 10. Composite map showing the tyre hotspots from 2016 to 2019.
83.7. Comparing the Fingal (N=111) and Cork (N=62) county surveys with the national
average.
Tyres are the most frequently reported large waste in both counties, which is in-keeping with
the national picture. While in Fingal the tyres were reported in small numbers, most likely
associated with dumping and loss from vessels, in Cork some large clusters of tyres were
reported, which were used as tyre traps. Landfill materials were the next highest reported in
Fingal, where much more urbanised coast was included in the survey. It ranked fourth in Cork.
Aquaculture waste ranked third in Cork, but did not feature at all in Fingal. Dumped household
refuse was more frequent on the more urbanised Fingal coast (8%) while keeping to the
national average (5%) in Cork.
Large Waste and Ship Wrecks 2019 in Fingal ( N=111)
Tyres 47
Landfill Materials 30
Abandoned Vehicles, Girders, Machines 15
Household Furnishings 10
Other 10
Ship Wreck 9
Dumped household refuse (bags / piles) 8
Aquaculture trestles & other gear 0
0 10 20 30 40 50
% of survey units
Figure 11. Large Waste recorded on the Fingal shore in the autumn 2019 Coastwatch survey expressed as percentage of
500m s.u. with waste.( N=111)
Large Waste and Ship wrecks recorded in Cork 2019
Tyres 34
Other 31
Aquaculture gear: 19
Landfill 19
Household furnishings: 11
Abandoned Vehicles: 8
Shipwreck: 5
Dumped refuse/bags: 5
0 10 20 30 40
% of survey units
Figure 12. Large Waste recorded on the Cork shore in the autumn 2019 Coastwatch survey expressed as percentage of
500m s.u. with waste.
94. Litter Counts - Drinks Containers, Plastic Bags and Wet wipes
In question E 2 surveyors were asked to look out for and count a selection of drinks containers.
Plastic drinks container litter was still the most widespread macro litter found around Ireland
with plastic bottles recorded on 73% of survey sites as peak litter item, metal cans recorded
on 60% and bottle lids on 52% of surveyed shores. However, all categories of drinks container
litter were less widespread this year than last, continuing a welcome downward trend which
started 4 years ago.
The only category which increased was ‘Other’ which is comprised of items which surveyors
chose to count. Here single use cups were picked out for counting in 6% of survey units,
followed by cotton bud plastic sticks seen in (5%) followed closely by cigarette butts and
wrappers. Balloons, golf balls, farm plastic and full dog pooh bags also featured in several
survey units.
In 2018 single use cups had been counted separately but as there had been considerable
sewage issues in 2019, the cups were substituted for wet wipes in 2019 and surveyors were
told where to look and how to identify them.
80,0 73,0
70,0
60,0 51,6
% of survey units
50,0
40,0 35,5 35,3
30,5
30,0
17,7
20,0 12,2
10,0
0,0
Plastic Metal cans Bottle lids Plastic Other Glass Carton / Wet wipes
bottles shopping counts bottles Tetrapack
bags
Figure 13. Percentage of shores surveyed in 2019 where drinks container litter, plastic shopping bag and wet wipe litter were
recorded (Coastwatch autumn survey N = 540).
The drinks container spread varied as expected. Surveyors reported plastic bottles on 78% of
the more urbanised and accessible Fingal coast surveyed and only 69% of the more rural
remote Cork coast.
4.1. Drinks Container Counts
As shown in figure 14 below, the average number of plastic drinks bottles on the shore was 6.2
per 500m survey unit, with a lid count of 5.2 /s.u. and 3.6 /s.u. metal cans.
All other counted items averaged at 1 or less per survey unit. In figure 14 and 15 the results
for 2018 can be compare with those of 2019.
107 6,2
average no of items per 500m
6 5,2
2019
5
4 3,6
3
2 1,3 1,1
1 0,6 0,4
0
Plastic Bottle lids Metal cans Plastic Glass bottles Wet Wipes Carton /
bottles shopping Tetrapack
bags
Figure 14 Average number of counted small litter per 500m of shore 2019 survey colour coded with red = plastic, orange is
metal and green glass
14 12,90
12
2018
average no of items per s.u.
10,04
10
8
6,40
6
4
2,29 1,85
2 1,08 1,02
0
Plastic Bottle lids Metal cans Glass bottles Plastic Single use Carton /
bottles shopping cups Tetrapack
bags
Figure 15. Average number of counted small litter per 500m of shore 2018 survey colour coded with red = plastic, orange is
metal and green glass
The most dramatic change in the Coastwatch survey results 2019 were seen in the drinks
container counts which halved in one year.
3500 3333
No of items counted
3000 2831
2500
1963
2000
1500
1000 701 615
500 300 227
0
Plastic Bottle lids Metal cans Plastic Glass Wet Wipes Carton /
bottles shopping bottles Tetrapack
bags
Figure 16. Number of items recorded in small litter counts. Coastwatch 2019 survey (N=540 su)
11While this is the biggest reduction ever over a year and bringing us the lowest plastic bottle
counts since surveys started, the actual counts shown in figure 16, with 3333 bottles, 2831 lids
and 227 tetra packs is still a lot of drinks related plastic. It must also be borne in mind that
count is only a one visit in 541 survey units. It is a fraction of what is collected in weekly and
daily shore cleans all over the island on over 7300 km. Sadly no counts are available for these
collections.
Picture 5. Photo Paddy Houlihan with surveyor Robert Troy finishing a Coastwatch survey with a litter clean up.
4.2. Mapping drinks container density
The map below (figure 17) combines all drinks container related litter counts in each survey
unit and shows the drinks litter density in colour coded categories comparable to those of
recent years. Green is used for up to 10 items, yellow for 11 to 150 and red for >150 items.
The map shows that the drinks container litter reduction is island wide with only a few
deposition or dump hotspots. Green dominates on the West coast with only one red s.u.
Good Status
When we asked a small group of Coastwatchers what would they consider clean or ‘good
status’ in terms of shore drinks container litter, the majority agreed on no more than 1 drinks
container item including lid per 100m of shore or 5 items in our 500m s.u. There was less
agreement on what would be a ‘needs action but not awful’ orange band. Given this initial
feedback the data was remapped reserving green for 0-5 drinks items per 500m survey unit,
orange for 6 to 50 and red for more than 50 drinks items. This higher shore cleanliness ambition
map (figure 18) suggests that considerable litter problems remain along the East and South
coast, but elsewhere the majority maintains its green status or has only just slipped into
orange.
This exploratory data mapping using different thresholds brings us to EC law including the
MSFD and what is ‘Good Status’ for the Marine Litter Descriptor? The latest official marine
litter expert group suggests 13 macro litter items/100m of shore. Neither Coastwatch nor the
12marine litter expert group have yet tested public views on how much litter is acceptable in
100m to still deem a shore ‘clean’ to settle on internationally useful cleanliness categories for
various types of litter.
Figure 17. Drinks Litter density map created using a low ambition of cleanliness traffic light system. Drinks container and lid
counts in three litter level categories (0 to 10, 11 to 150 and more than 150 items). Coastwatch survey 2019
13Figure 18. Drinks litter density map using a high cleanliness ambition traffic light system. Drinks container and lid counts in
three litter level categories (0 to 5, 6 to 50 and more than 50 items). Coastwatch survey 2019
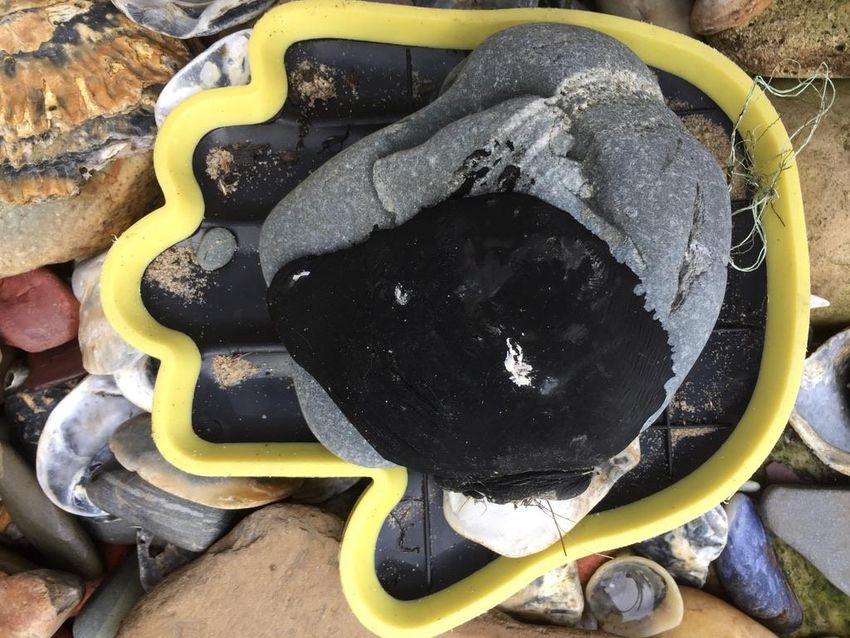
Picture 6. Drinks container litter
144.3. Wet Wipes
Wet wipes are not easy to find if mixed up in seaweed. So finding one or more on 12.2 % of
surveyed sites (Figure 13) is of concern. The sites where they were reported were concentrated
around Dublin, but also found in almost every other county – see figure 19 below.
Surveyors were also asked to count wet wipes in 2019 as a new pilot initiative. The result was
judged unreliable from surveyor feedback and almost certainly a significant underestimate.
Once wet wipes form ropes, it is impossible to count them, while those released onto a beach
as free floating wipes tend to lie down flat like a plaster on the sand and then get quickly
covered by more sediment. A different measure of density will have to be found to be useful.
Judging by shelf space now allocated to wet wipes, they are the latest single use plastic success
story. A popular alternative to traditional soap and water, or cloth for many cleaning jobs from
car to dog paws. Those used in the bathroom, replacing or augmenting toilet paper are the
most problematic as an unknown number get flushed down the toilet. The increase in sewer
blockages, stormwater overflows and treatment plant breakdowns are a consequence which
explains the frequent overlap with presence of other sewage indicators.
A recent study exploring the potential for certain materials to be considered as exempt from the Single Use
Plastics Directive, focussed on man-made cellulosic fibres, on the definition of plastics, exemptions to the new
Single Use Plastics (SUP) Directive and a series of loopholes and material substitutions which could significantly
undermine its goal.
In the case of wet wipes they flagged the potential of substitution with alternative materials (lyocell and viscose),
focuses on polymers covered, or not, by the term ‘plastic’. They noted that ‘Exempting materials with similar
environmental impacts from the Directive’s scope, could incentivise manufacturers to opt for material
substitutions which would absolve them from having to finance the cost of litter clean-up, transport and
treatment, and the cost of awareness-raising activities. (Eunomia Research & Consulting: What is plastic?)
Picture 7. It doesn’t help that
some wet wipes are sold as
flushable. The Aldi sample
pictured, carries a tiny font that
is not suitable for septic tanks.
Picture 8.: (L) pipe has spewed sewage including
wet wipes into a shellfish rich area and (R) wet
wipes mixed with green algae on a bathing Figure 19. Shores where Wet wipes were recorded during
beach. the Coastwatch survey 2019.
154.4. Other Counts
Annually 20-30% of surveyors count some other macro
litter item or items of concern, while the occasional group
like the sea scouts in Malahide in 2019 carries out an entire
shore macro litter count.
Both the full sweep where everything found is counted and
the more frequent small number of chosen items counted
provide valuable insight into litter and what annoys or
concerns surveyors. Occasionally it is only a single item like
Picture 9.
the tar on this stone.
A list of own choice litter count items was made, and this list condensed to those which at least
5 other surveyors had counted. In some cases, the counts were grouped. – e.g. plastic forks
added to plastic cutlery. The own choice litter categories were then ranked by number of
survey sites where they were counted. Figure 20 shows the top 15 own choice litter items. The
vast majority were plastic and dominated by items listed in the new Single Use Plastic EU law,
commonly referred to as the SUP Directive https://eur-lex.europa.eu/eli/dir/2019/904/oj .
Number of Sites where the item was counted
Dog pooh bags 7
Plastic sacks 8
Shoes 9
Fishing gloves 10
Balls inc golfballs 11
Balloons 15
Polystyrne pieces 16
Cup lids 16
Plastic toys 16
Cigarette butts 16
Plastic cutlery 16
Disposable cups 28
Rope /twine 34
Wrappers food, sweets 34
Cotton bud sticks + straws 35
0 5 10 15 20 25 30 35 40
Figure 20. The top ten items which surveyors counted as own initiative extra. Coastwatch 2019 survey.
In first position with 35 s.u. were cotton bud sticks. However, this figure may
be an exaggeration due to an occasional misuse of the word ‘straw’. Some
surveyors listed cotton bud sticks as ‘cotton bud straws’ and there were
several > 20 and > 50 ‘straws’, which on contacting surveyors turned out to
be cotton bud sticks, not drinks straws. In up to 5 of these sites where we did
not check, 1 or 2 real drink straws were counted rather than cotton bud sticks
and hence the category is named cotton bud sticks and straws.
Food wrappers and Rope/twine came second, both counted in 34su and both
seen as broad categories including all kinds of sweet and sandwich wrappers
and in the case of rope/twine anything from several m length to the frequently Picture 10. Twine.
16counted and more numerous twin/rope/net pieces a few cm long. Disposable cups ranked
third, counted in 28 s.u. with a total count of only 71disposable cups and most surveyors
reporting 2 cups/s.u. We do not know how many of these cups had lids. Separate cup lids were
counted in 16 s.u.
Picture 11. single use cup with lid and straw as well as food wrapper all carefully placed just at the beach entrance about 20
m from a bin.
Also tied for 16 sites were polystyrene items or pieces, plastic toys and cigarette buds.
Polystyrene is of particular concern as it breaks into bird bite size beads. As Alison Mc Kenna
put it on the Fingal coast:
“I counted 168 small ±5cmx5cm/8x8 cm square pieces of polystyrene, probably broken up
from one box or crate, but each piece will eventually break into a 100 more small pieces. I
picked up as much as I could.”
Toys such as sand baking forms and little spades are easy to see and almost like a trophy, with
a maximum count of 6 found. If intact they are often taken home for reuse or left at the beach
entrance. In contrast the cigarette butts are easily missed unless seen in a cluster. In 13 of the
16 su were cigarette butt counts were recorded, 6 or more butts were counted and in 9 of
these sites there were over 20 butts.
Balloons were counted in 15 sites and tend to come with string presenting a choking and
entanglement hazard. See Coastwatch balloon position paper www.coastwatch.org
Balls were counted in 11 su, with golf balls in three of these and occurring in large numbers –
80-100 in one site Dublin Bay below Elm park stream. Like toys intact balls tend to be picked
up and reused.
The heavy duty gloves used mainly in the fishing and aquaculture industry were counted in 10
sites. All other own initiative counts occurred in < 10 survey units including shoes (9su) plastic
fertiliser and coal bags (8su), dog poo bags (7su), syringes (4su) etc.
17The items counted most frequently may be included in the next Coastwatch survey as a named
count category. Wet wipes were included in the 2019 survey after turning up more frequently
than coffee cups in own choice counts and comments in the previous 2 years.
4.5. Litter Level Mapping – A Coastwatch proposal
A grand total of counted macro litter items can be produced for each 500m survey unit by
adding all items surveyors reported in the set counts, as well as the items counted as own
initiative - see table 1 below.
Count Type Actual Count Comment Mapping:
Tyres Tyres Simple to count large Mapping the counts
Drinks Bottles + Lids + Cans + At core to reduce in the in traffic light code
related Tetrapacks SUP Directive categories of:
Plastic shop. Covered by Irish eco tax
Plastic shopping bags
bags and in EU law 0-10 items green
Covered in SUP Directive 11- 50 items orange
Wet Wipes Wet Wipes only by label and producer >50 red
responsibility
Wild Card: Typical beach litter, This provides flexibility to
Other own polystyrene, cigarette count as many different
initiative - butts, fishing and items as are of concern in
dominant or aquaculture related present wording. But most
of concern waste, count only 1 or 2 items.
Table 1. An overview of items counted per 500m of shore.
These litter counts can then be mapped as shown below (Figure 21), where litter counts of up
to 10 litter items are deemed clean and shown in green, some littering is flagged when
surveyors found 11-50 items, marked orange and the shore was deemed littered at > 50 items)
and marked in red.
These litter counts can then be mapped as shown below (Figure 21), where litter counts of up
to 10 litter items are deemed clean and shown in green, some littering is flagged when
surveyors found 11-50 items, marked orange and the shore was deemed littered at > 50 items)
and marked in red.
185. Small Litter Recorded
Question E 3 asks Tick which of the following items of general litter or pollution you found
Surveyors then checked the shore from splashzone to water’s edge and placed a tick where
they saw one or more items of fishing gear, rope, hard plastic containers etc.
While drinks container litter improvements are significant, the results picture is much more
mixed when one looks at presence/absence of many other small litter categories in figure 20
below. Here 7 litter categories coloured yellow were found more frequently than in 2018, six
remained the same (±1 % difference) while only 3 – other plastic, glass and non-drinks cans –
were found less frequently than the previous year.
Rope and string were found most frequently followed by ‘other plastic’ and a large textile
clothing and shoes category.
Rope and String 70,8
Other plastics 49,0
Textiles, shoes, gloves and clothing 47,3
Fishing or aquaculture gear 47,3
Hard plastic containers 43,4
Foamed polystyrene 39,4
Paper, cardboard and worked wood 33,1
Sanitary waste, condoms, nappies 17,9
Faeces - mammal 17,0
Glass (not drinks), including light bulbs 12,6
Cans (not drinks), including sprays 12,4
Food, fish waste and bones 10,2
Tar, oil, petrol 5,5
Containers of hazardous (not medical) 5,5
Geotextile 4,8
Medical waste, syringes, plasters 4,6
0,0 20,0 40,0 60,0 80,0
% of survey units
Figure 21. Small litter found on the shore - presence in percentage of survey units and colour coded by increase, decrease or
remain the same as in 2018.
195.1 Rope and string
As figure 21 below shows, rope and string litter have increased over the last 6 years. Recorded
on 59% of shores in 2014 to 70% ± 2 in the last 4 years. Rope and string have only been set into
a category on their own in 2014. Before that they were pooled with fishing and aquaculture
gear, even if at times the source may have been agriculture or other marine sources.
100
72,3
70,8
69,7
68,2
64,3
80
% of survey units
59,1
60
40
20
0
Fishing or aquaculture gear Rope and String
Figure 22, Fishing litter (including rope/string) or aquaculture gear and Rope/string over the years.
5.2 Fishing, Angling and Aquaculture litter
There were 397 records of fishing, aquaculture and/or angling gear litter on the shore,
distributed over 256 s.u. From surveyor information and comments, fishing and angling waste
are still most frequent around harbours and piers, while aquaculture gear is concentrated
around aquaculture areas as noted for large waste above.
When we look at the relative contribution of the 3 litter sources as depicted in the pi chart
below (figure 22) fishing nets and net pieces were most frequent (38%) followed by
aquaculture waste, with traps making up 24% and angling waste least frequent, but still
accounting for 18% of the litter records.
The source may be clear as in a bag of salmon feed in Connemara, but less clear for some
netting which we here assume to be fishing related.
Angling Traps
gear 20%
18%
Aquaculture
gear…
Nets
38%
Figure 23. Contribution of different fishing and aquaculture litter
sources to the fishing aquaculture load. Coastwatch survey 2019
20Figure 24.(a) Distribution of fishing waste on the shore 2019 and (b) Aquaculture waste Coastwatch 2019 survey
The
2019 reduction in aquaculture areas covered, is likely to be the reason for a slight reduction in
aquaculture waste. The GIS maps highlight this shift. Dungarvan spit, Woodstown beach
Waterford and Lough Foyle Donegal coast - known as aquaculture litter hotspots in the past -
were badly littered once more from surveyor comments. Metal hooks, rubber gloves, netlon
bags and rubber with hooks are typical for areas of trestle grown Gigas oysters.
Picture 12. Photo of Gigas aquaculture in the low intertidal and sublittoral with trestle ties washed up on the shore.
In Lough Foyle the use of plastic in aquaculture appears higher than elsewhere as surveyors
posted in plastic hooks and plastic cable ties used as netlon bag closures and securement,
which appears to be simply cut open when needed and either discarded or lost. The density
reported south of Quigley’s point was around 1 per metre of tide mark. None of the Lough
Foyle farms have licenses, so enforcement by license review is not applicable.
215.3. Foamed Polystyrene
Polystyrene objects and more frequently pieces were recorded on 39.4 % of shores surveyed
which is an increase over 2018 and the second highest record in the last 7 years since
polystyrene was recorded as a separate litter material (moving polyurethane into ‘other’)
Single polystyrene beads are recorded separately as micro litter and are of particular concern
as picked up by birds presumably mistaking it for food.
Surveyors are not asked to note the polystyrene source, but polystyrene packaging especially
boxes appear on several photos and in comments take away packaging is also mentioned.
When drawing up recommendations (May 2019) some uses like pontoon floats were deemed
to be particularly high risk.
49,2
60
47,9
44,6
43,5
41,7
41,6
41,6
41,3
39,3
50
38,4
38,3
37,6
37,3
37,2
% of survey units
35,1
33,3
32,7
40
26,9
30
20
10
0
Foamed polystyrene Foamed polystyrene or polyurethane
Figure 25. Polystyrene and polyurethane macro litter on the shore as reported in Coastwatch survey 1991 to 2019
Picture 13. Photos of Polystyrene block and pieces, breaking down to beads – bite size for birds to pick up.
5.4. Sanitary Waste
In the 1980s and 90s sanitary waste found on the shore comprised of the expected toilet flush
material with additives like tampons, sanitary pads, cotton bud sticks and the odd condom
which really belong into a bathroom bin.
State and volume of this tide line litter gave recreational sea users an indication of sewer outfall
locations and where recent wind/tide/current had brought sewage. With massive investments
in sewage treatment this type of litter sewage indicator became less frequent.
22In the 2012-14 Coastwatch surveys sanitary litter was reported on 12-14 % of shores. However,
despite of even further treatment plant improvements – there has been increase in sanitary
material reported in the last 5 years as depicted in Figure 25. In 2019 surveyors recorded it
on the same number of shores as in 2018 - 17.9% of s.u.
The state of our small inflows as carriers of sewage has also disapproved. There is growing
evidence that wet wipes play a key role in this deterioration. Action options are presented in
the Coastwatch recommendations document – www.coastwatch.com.
25
23,6
% of survey units
20
21,3
21,0
20,6
20,1
19,8
18,4
18,2
18,0
17,9
15
17,6
17,4
17,0
15,2
15,1
14,8
13,9
10
12,2
11,9
5
0
Figure 26. Sanitary waste on the shore over time 1991 to 2019
Figure 27. Sanitary Waste found on the shore and in small inflows in the 2019 Coastwatch survey.
235.5. Other Small Litter and Other Counts
Picture 14.
6. Micro litter
Surveyors were asked to look out for micro litter visible to the naked eye and also had the
option of using the Coastwatch micro litter app to record type and volume plus location.
The two data sets are still in the process of being merged.
Half of the surveyors (278 out of 541) answered this question, with more saying that they did
not see any – see map figure 27. If all the others who did not respond to this question also
didn’t see any micro litter, then in this best case scenario, micro litter was seen on 20% of
shores surveyed.
Picture 15
24Depending on material form and weight polystyrene beads for example tend to fly high up into
the splashzone/hinterland interphase, while heavy nurdles stay on the tideline. Micro litter
tends to accumulate in certain areas often the corner of a beach which may be missed by a
surveyor zig zagging the 500m of shore. We are beginning to understand micro litter better
with some shores between Tramore and Dunmore East in Co Waterford for example reporting
nurdles more frequently than many others.
More work has to be done on surveyor guidance.
Figure 28. Map showing survey units where micro litter was found on the shore. Coastwatch 2019 survey.
257. Littering in Context
Surveyors are asked in questions E5, F1 and F2 to provide context to the litter levels found on
the day.
In E 5 surveyors were asked to look back and say which area was most littered. In 69% of
answers, surveyors found most litter in the splashzone, followed by the tidemark (26%) and
only 5% intertidal see chart figure 28 below. Surveyors also described the litter as accumulating
in pockets or areas in 41 % of the shores, while in 59% it appeared to be spread evenly.
0%
5%
Splash zone
Accumulati
Tide mark 26% ng in areas 41%
Intertidal 69% Spread
evenly 59%
Sea
Figure 29. Which area is most littered at time of survey? Figure 30. How is the litter distributed
Question F1 seeks to establish whether recent weather has made the shore look cleaner, worse
or similar to other times visited. Surveyors who know the shore are asked to respond.
Figure 30 shows that 47% did not think it
Yes, looks
looked differently, while 29% answered that 15%
cleaner than
they did not know, 15% thought it looked usual 29%
cleaner and 9% that recent weather added to Yes, looks worse 9%
the litter load. That is a slight increase in the than usual
number saying that it looked cleaner than No, recent
usual which is in keeping with the good weather is
47%
weather which we enjoyed over most of the insignificant
survey period Sept 15th to Oct 15th.
Figure 31. Has weather changed the appearance of your s.u.?
Question F 2 asked whether the shore had
been cleaned within the last week.
Yes
Surprisingly, only 15% said that it had been 15%
Don't
cleaned (Figure 31) but then many more than Yes know
previously commented that cleaning is now a 43%
No
daily year round activity. Also some of those
who said no, did comment that there was a Don't know No
recent clean up, but not within the last week. 42%
So while there appears to be an increase in
cleaning effort in comments, our question
Figure 32. Has the Shore been cleaned in the last week?
does not give a good representation of that
increase in cleaning effort.
268. Way Forward
The excellent improvements in drinks container litter observed gives us new impetus to follow
up action on this and many other types of litter.
The Single Use Plastics Directive came into law in June 2019 and now governments are
introducing legal and economic measures to prevent and manage plastic consumer waste as
well as addressing fishing and aquaculture waste. Ten single use consumer items will be
banned and others controlled.
Among the full page of marine litter questions in the Coastwatch survey, we have some which
relate directly to these items and which will now be addressed by member states including
Ireland as they implement the Directive. Additionally, monitoring of marine litter as a
Descriptor of Ocean state under the Marine Strategy Framework Directive is being reviewed.
Coastwatchers prepared a litter recommendations document in workshops hosted in spring
2019 and will now revisit that document and update same in light of new findings with view
to producing a joint Coastwatch Europe report and recommendations on litter monitoring,
waste and material management and new law for an international exhibition in the European
Parliament in May 2020 hosted by Grace O’Sullivan MEP.
Additionally, we are participating in EC and international NGO work to tackle particular waste
streams such as fishing and aquaculture waste.
_______________________________
27Glossary
Co – County
EC – European Commission
EU – European Union
GIS – Geographic Information System ( the way your data is now mapped)
Good Status –
MEP - Member of the European Parliament
MSFD – Marine Strategy Framework Directive – see
N 2000 – Protected areas under the EU Habitats and/or Birds Directive
NGO – Non Government Organisation (eNGO specifies environmental NGO
s.u. – Survey unit or 500 m of shore as estimated along high water .
28Annex I
2930
Coastwatch Survey All Ireland 31
You can also read