Measuring Canopy Structure and Condition Using Multi-Spectral UAS Imagery in a Horticultural Environment - MDPI

Page created by Shirley Norris
 
CONTINUE READING
Measuring Canopy Structure and Condition Using Multi-Spectral UAS Imagery in a Horticultural Environment - MDPI
remote sensing
Technical Note
Measuring Canopy Structure and Condition Using
Multi-Spectral UAS Imagery in a
Horticultural Environment
Yu-Hsuan Tu 1,2, * , Kasper Johansen 1,3 , Stuart Phinn 1,2        and Andrew Robson 2,4
 1   Remote Sensing Research Centre, School of Earth and Environmental Sciences,
     The University of Queensland, St Lucia 4072, QLD, Australia; kasper.johansen@kaust.edu.sa (K.J.);
     s.phinn@uq.edu.au (S.P.)
 2   Joint Remote Sensing Research Program, The University of Queensland, St Lucia 4072, QLD, Australia
 3   Hydrology, Agriculture and Land Observation Group, Water Desalination and Reuse Center,
     King Abdullah University of Science and Technology, Thuwal 23955-6900, Saudi Arabia
 4   Precision Agriculture Research Group, School of Science and Technology, University of New England,
     Armidale 2351, NSW, Australia; andrew.robson@une.edu.au
 *   Correspondence: y.tu@uq.edu.au; Tel.: +61-7-3346-7023
                                                                                                   
 Received: 20 December 2018; Accepted: 28 January 2019; Published: 30 January 2019                 

 Abstract: Tree condition, pruning and orchard management practices within intensive horticultural
 tree crop systems can be determined via measurements of tree structure. Multi-spectral imagery
 acquired from an unmanned aerial system (UAS) has been demonstrated as an accurate and efficient
 platform for measuring various tree structural attributes, but research in complex horticultural
 environments has been limited. This research established a methodology for accurately estimating tree
 crown height, extent, plant projective cover (PPC) and condition of avocado tree crops, from a UAS
 platform. Individual tree crowns were delineated using object-based image analysis. In comparison
 to field measured canopy heights, an image-derived canopy height model provided a coefficient
 of determination (R2 ) of 0.65 and relative root mean squared error of 6%. Tree crown length
 perpendicular to the hedgerow was accurately mapped. PPC was measured using spectral and
 textural image information and produced an R2 value of 0.62 against field data. A random forest
 classifier was applied to assign tree condition into four categories in accordance with industry
 standards, producing out-of-bag accuracies >96%. Our results demonstrate the potential of
 UAS-based mapping for the provision of information to support the horticulture industry and
 facilitate orchard-based assessment and management.

 Keywords: unmanned aerial system; horticulture; avocado; canopy structure; tree condition

1. Introduction
      Genetic variation, phenological growth stage and abiotic and biotic constraints can all influence
tree structural parameters such as height, canopy extent and foliage density [1–12]. For instance,
vigorous trees usually result in tall and dense canopies that influence the productivity [9–11]. As such,
measurements of these parameters can provide growers with a strong indication of plant health or
vigour, photosynthetic capacity and yield potential [13,14]. In most Australian horticultural industries,
such assessment is usually conducted by on-ground visual evaluation, which is time-consuming,
labour-intensive, subjective and often inconsistent [7,15–17]. Therefore, there is a demand for more
efficient, accurate and quantitative alternatives for such assessments.
      Remote sensing has been used to estimate tree canopy structural attributes, such as tree
height, canopy extent, and plant projective cover (PPC), for decades [18–22]. Conventionally,

Remote Sens. 2019, 11, 269; doi:10.3390/rs11030269                      www.mdpi.com/journal/remotesensing
Measuring Canopy Structure and Condition Using Multi-Spectral UAS Imagery in a Horticultural Environment - MDPI
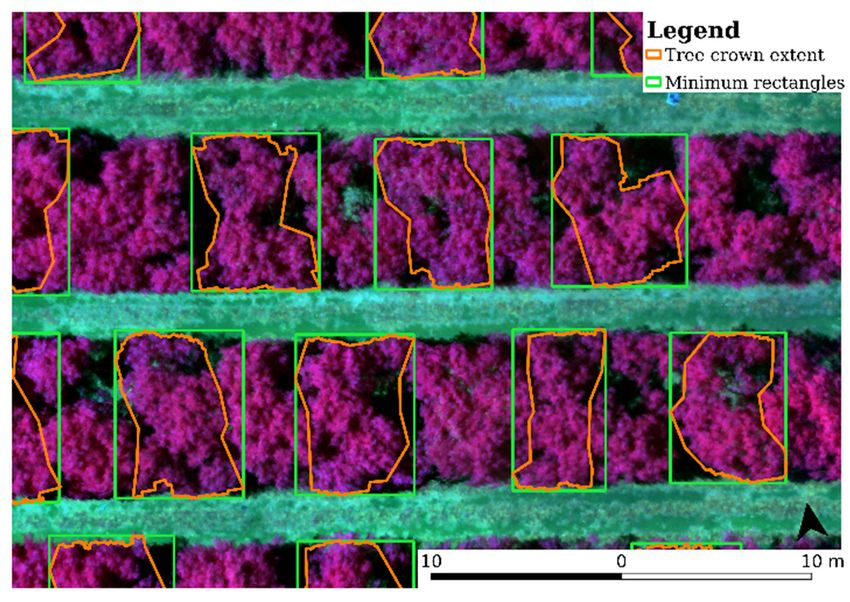
Remote Sens. 2019, 11, 269                                                                            2 of 19

 these types of data were acquired by either satellites or aircrafts, which are time and weather
 constrained. In the case of satellite data, it is difficult to acquire data with on-demand spatial,
 spectral, and temporal specifications that is tailored for specific sites, products, and delivery times
 for horticultural applications [23]. More recently, UAS have been considered as a useful platform to
 acquire suitable remotely sensed data for measuring horticultural tree crop structure, as it provides both
 higher spatial and temporal resolution and the flexibility of operations [6–8,18]. Airborne image data,
 initially stereo-photography, were analyzed using soft-copy photogrammetry to provide information
 for extracting ground and canopy heights [2–7,24], while more recently this has been done by collection
 and processing of LiDAR point clouds [1,25–28]. Similar products are now generated from UAS
 multi-band image data using multiple forms of softcopy photogrammetry, such as structure from
 motion (SfM). As SfM algorithms have become part of the standard procedure of UAS image processing
workflows, UAS imagery has the potential to become a more accepted method for measuring tree
 structure, providing a similar degree of accuracy and better spectral fusion compared to LiDAR
 systems [6,29].
       Canopy structural dimensions can be expressed by the tree height and the tree crown extent [4],
while the canopy density can be expressed by the PPC [21]. PPC is defined as the vertically projected
 fraction of leaves and branches in relation to sky, which is often referred to as canopy cover or crown
 cover [20–22]. It has been proved to be a good indicator of biomass [20,21]. Previous studies have
 estimated PPC at the site scale [22,30]. However, for tree crop managers, the plant-scale condition of
 individual trees is more relevant when applying agricultural inputs at the tree level [16]. Plant-scale
 PPC estimation using near-infrared (NIR) brightness from multi-spectral UAS imagery has proved to
 be an accurate approach for lychee trees [7]. As the canopy structure of lychee trees is considered to be
‘rhythmic’ [31], little is known about whether such plant-scale PPC estimation techniques are feasible
 for other tree crops such as avocado trees, as the architecture of avocado trees is significantly different
 to lychee trees [32]. Although Salgadoe, et al. [33] suggested that photo-derived PPC is also a good
 indicator of avocado tree condition, the difference of canopy density is not significant to differentiate
 trees between moderate and poor condition [33]. Hence, combining the canopy structural dimension
 for tree vigour estimation may be beneficial [13]. The estimated tree height and canopy extent derived
 from UAS imagery are now considered highly accurate in comparison to ground measurements [4–8],
yet limited research has integrated the dimension and PPC to express tree condition.
       Tree condition evaluation methods are generally conducted by classifying trees into condition
 categories based on visual assessment of tree canopy structure. This assessment is based on tree canopy
 structure, and hence should be quantifiable from the aforementioned structural attributes that derived
 from UAS imagery. Johansen, Duan, Tu, Searle, Wu, Phinn and Robson [15] used near-infrared (NIR)
 brightness as the input feature of a random forest classifier to predict the condition of macadamia
 trees. Different growing stages and levels of stress for avocado trees produce changes in overall
 canopy form [33], and the amount of leaf, stem and trunk biomass, these resulted in different NIR
 reflectance levels [34–36] which were detected by the classifier in the study. The results indicated a
 moderate accuracy, hypothesised to be attributed to the very high spatial resolution of the UAS imagery,
 combined with the complex NIR scattering properties of the tree crop leaf and canopy structures.
 Based on this foundation, we explored methods that use all the available image-derived structural
 attributes and linked these with the field-derived structural measurements for condition assessment.
       The objectives of this work were to:

1.    use multi-spectral UAS imagery to map and assess the accuracy of tree height, canopy width and
      length, and PPC estimates for avocado trees, and
2.    use the highly correlated image-derived structural attribute maps to produce a tree condition
      ranking matched to on-round observer techniques.

     This study explores a novel and innovative approach to assess horticultural tree crop condition
directly related to canopy structural attributes estimated from UAS image data and used to rank
Measuring Canopy Structure and Condition Using Multi-Spectral UAS Imagery in a Horticultural Environment - MDPI
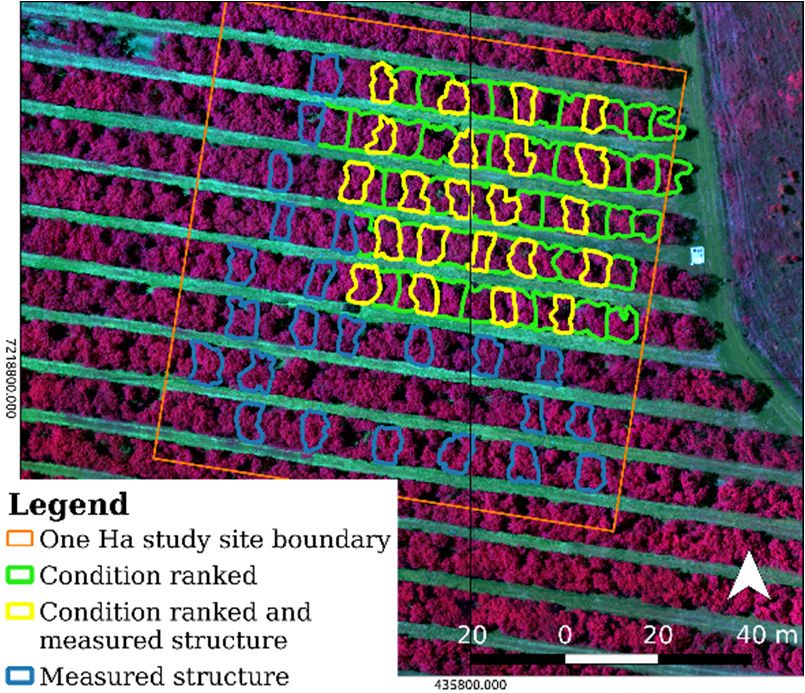
Remote Sens. 2019, 11, 269                                                                                             3 of 19

Remote Sens. 2018, 10, x FOR PEER REVIEW                                                                               3 of 19
avocado tree condition. Such a condition ranking strategy could play a role to bridge the gap between
the remote sensing expertise and farmers’ knowledge of their tree crops, delivering information able
to be used immediately as part of on farm management practices.

   Materials and
2. Materials and Methods
                 Methods

2.1. Study
2.1. Study Sites
           Sites
      The study
      The  study site
                   site is
                        is one
                           one ofof the
                                     the main
                                         mainHassHassavocado
                                                      avocado producing
                                                                 producing orchards
                                                                               orchards in in Australia,
                                                                                              Australia, which
                                                                                                         which isis located
                                                                                                                    located
to the
to  thesouth
         southofofBundaberg,
                    Bundaberg,Queensland,
                                      Queensland,     Australia.
                                                    Australia. TheThe    region
                                                                     region         experiences
                                                                               experiences         a subtropical
                                                                                              a subtropical  climateclimate
                                                                                                                       with
with   long  hot  summers      and    mild  winters.   The  post-harvest      pruning   usually
long hot summers and mild winters. The post-harvest pruning usually occurs in late Austral winter  occurs in  late Austral
winter (August)
(August)    or earlyorspring
                          early (September),
                                 spring (September),       wherelimbs
                                                   where major     majorare limbs   are removed
                                                                                removed             to maintain
                                                                                            to maintain   orchardorchard
                                                                                                                     access
access   between    rows    and    enhance     light interception.    Flowering      occurs
between rows and enhance light interception. Flowering occurs between early September and mid-between   early   September
and mid-October,
October,   followed by followed
                           two fruit bydrop
                                         two fruit
                                               eventsdrop  events
                                                       usually      usually
                                                                between    latebetween
                                                                                  Octoberlate
                                                                                            andOctober
                                                                                                 Januaryand    January for
                                                                                                          for readjusting
readjusting   fruit  load   to fit the  tree ecological  resources    [37].  Harvesting     of avocado
fruit load to fit the tree ecological resources [37]. Harvesting of avocado normally occurs in May.      normally    occurs
                                                                                                                        The
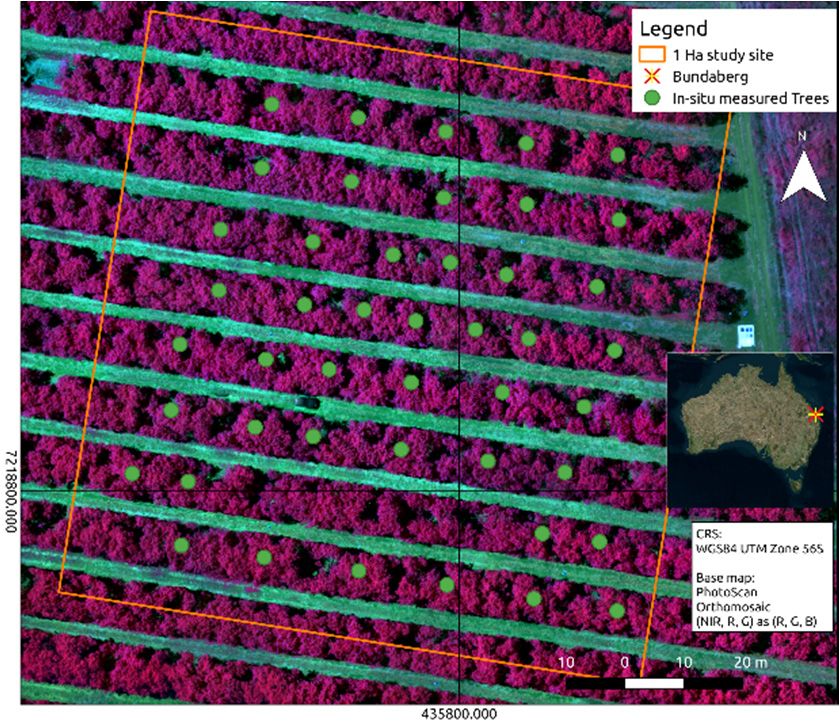
in May.   The  UAS    based    focus   areas  encompassed      a 1 ha  patch    of the avocado
UAS based focus areas encompassed a 1 ha patch of the avocado orchard, within which structural    orchard,   within  which
structural parameters
parameters     of 45 avocadoof 45 trees
                                   avocadowere trees wereselected
                                                  evenly   evenly selected     and measured
                                                                     and measured       (Figure(Figure
                                                                                                  1). The1).avocado
                                                                                                             The avocado
                                                                                                                       trees
trees planted
were   were planted
                 in 2005 inwith
                            2005awith     a 5 m spacing.
                                     5 m spacing.           The average
                                                     The average    elevation elevation   for the avocado
                                                                                 for the avocado    orchardorchard
                                                                                                              was aroundwas
around    60 m   above    sea  level,  and   it had  relatively  flat terrain   with   an  average
60 m above sea level, and it had relatively flat terrain with an average downward slope of 4 degrees downward      slope  of
4 degrees   towards
towards east.          east.

                             (a)                                                           (b)
                 The (a)
      Figure 1. The  (a) outline
                          outline of
                                  of the
                                      the study
                                           study area
                                                 area and
                                                      and (b)
                                                           (b) aerial
                                                               aerial view
                                                                      view of
                                                                           of the
                                                                              the avocado
                                                                                  avocado orchard
                                                                                            orchard in
                                                                                                     in Bundaberg,
                                                                                                        Bundaberg,
      Australia. The green
                      green dots
                              dots in
                                    in(a)
                                       (a)represent
                                           representthe
                                                     theselected
                                                         selectedin-situ
                                                                  in-situmeasured
                                                                          measuredtrees. The
                                                                                    trees. TheAustralia
                                                                                               Australiabasemap in
                                                                                                          basemap
      (a)(a)
      in  uses imagery
             uses imageryfrom  World-View
                            from  World-View  2 provided  by by
                                                 2 provided   DigitalGlobe.
                                                                 DigitalGlobe.

 2.2. Field
2.2.  Field Data
             Data
       Field measurements
       Field  measurements were   were collected
                                         collected between
                                                      between 22 andand 66 February
                                                                           February 2017,
                                                                                       2017, where
                                                                                             where the
                                                                                                     the canopy
                                                                                                          canopy becomes
                                                                                                                    becomes
 dense at
dense    at the
            the end
                 end ofof summer
                          summer leaveleave flush
                                              flush [38].
                                                     [38]. Tree
                                                            Tree height
                                                                   height was
                                                                           was measured
                                                                                measured using
                                                                                            using aa TruPulse
                                                                                                      TruPulse 360B
                                                                                                                  360B laser
                                                                                                                         laser
 rangefinder     (Laser   Technology      Inc,  Centennial,     USA)   from   the ground   to  the
rangefinder (Laser Technology Inc, Centennial, USA) from the ground to the tree apex at a distance tree apex   at a  distance
 greater than
greater    than 1010 m
                     m from
                         from the
                                the trunk
                                     trunk to to reduce
                                                 reduce thethe effect
                                                                 effect of
                                                                        of tree
                                                                           tree inclination
                                                                                inclination [39].   Canopy widths
                                                                                              [39]. Canopy    widths werewere
 measured, in
measured,      inthe
                   thedirection
                        directionalong
                                     alongthethe
                                               hedgerow,
                                                  hedgerow,  as the
                                                                  as horizontal   distance
                                                                     the horizontal        between
                                                                                       distance       the two
                                                                                                  between   thestaffs
                                                                                                                  twoplaced
                                                                                                                        staffs
 at the  outermost    edge   of  each  side   of the  tree crown.
placed at the outermost edge of each side of the tree crown.
       PPC for
       PPC   for individual
                  individual trees
                               trees was
                                       was estimated
                                            estimated viavia aa digital
                                                                 digital cover
                                                                         cover photography
                                                                                photography (DCP)
                                                                                                (DCP) method
                                                                                                        method [21][21] using
                                                                                                                        using
aa Nikon
    Nikon Coolpix
            Coolpix AW120
                        AW120 digital
                                  digital camera
                                            camera (Nikon
                                                       (Nikon Corporation,
                                                                  Corporation, Tokyo,
                                                                                   Tokyo, Japan).    Eight representative
                                                                                           Japan). Eight    representative
 cover   images    were   taken   at various    locations    at approximately      half
cover images were taken at various locations at approximately half way between the trunkway  between    the  trunk andand the
                                                                                                                           the
 outer edge
outer   edge ofof the
                   the tree
                       tree crown
                            crown of  of each
                                         each tree
                                                tree during
                                                     during dusk.
                                                                dusk. These
                                                                       These images
                                                                               images were
                                                                                        were imported
                                                                                              imported into
                                                                                                         into the
                                                                                                               the Can-Eye
                                                                                                                    Can-Eye
software (French National Institute of Agronomical research, Paris, France) to estimate gap fraction
to calculate PPC.
     A total of 66 trees, selected based on their variability in condition, were visually assessed by an
avocado tree expert and classified into four condition categories: (1) Excellent, (2) Good, (3) Moderate,
Measuring Canopy Structure and Condition Using Multi-Spectral UAS Imagery in a Horticultural Environment - MDPI
Remote Sens. 2019, 11, 269                                                                                             4 of 19

software (French National Institute of Agronomical research, Paris, France) to estimate gap fraction to
calculate PPC.
      A total of 66 trees, selected based on their variability in condition, were visually assessed by an
Remote Sens. 2018, 10, x FOR PEER REVIEW                                                                  4 of 19
avocado tree expert and classified into four condition categories: (1) Excellent, (2) Good, (3) Moderate,
and (4)
and  (4) Fair
         Fair (Figure
               (Figure 2),2), based
                              based on
                                     on the
                                         the modified
                                              modified Ciba-Geigy
                                                        Ciba-Geigy scale
                                                                    scale method
                                                                          method for
                                                                                  for the
                                                                                       the Australian
                                                                                           Australian avocado
                                                                                                       avocado
industry    [33].   Twenty-two     of the  66  assessed  trees were part of the selected  45  trees, which
industry [33]. Twenty-two of the 66 assessed trees were part of the selected 45 trees, which had their      had
their structural    properties   measured    for validation purposes. The  number   of trees for
structural properties measured for validation purposes. The number of trees for each condition   each condition
category can
category   can be
                be found
                     found inin Table
                                Table1.1.

              (a)                            (b)                             (c)                            (d)
      Figure 2.2. The
                   Thecondition
                         conditionranking
                                     ranking
                                           for for avocado
                                                avocado  treestrees
                                                                basedbased  on farmers’
                                                                      on farmers’          knowledge.
                                                                                    knowledge.          The standard
                                                                                                The standard  ranking
      ranking   method classifies
      method classifies    the trees the
                                      intotrees  into four categories:
                                           four categories:              (a) where
                                                              (a) Excellent, Excellent,  where
                                                                                     there      there
                                                                                           was no  signwas  no sign of
                                                                                                        of defoliation;
      defoliation;
      (b) Good, with (b) few
                         Good,  with leaves
                             wilting   few wilting  leaves
                                             occurring;   (c)occurring;
                                                              Moderate,(c)  Moderate,
                                                                          where         where approximate
                                                                                 approximate                 oneof
                                                                                               one third to half third
                                                                                                                    the
      to halfleaf
      green   of the   green
                   tissues   leafwilted;
                           were    tissuesand
                                            were
                                               (d) wilted; and more
                                                   Fair, where   (d) Fair,
                                                                       thanwhere
                                                                            half ofmore  than half
                                                                                    the leaves wereofdead.
                                                                                                      the leaves were
      dead.
               Table 1. Number of avocado trees classified in situ into respective condition rankings.

              Table 1. Number of avocado
                        Ranking          trees classified
                                    1- Excellent          in situ into
                                                     2- Good           respective condition
                                                                    3- Moderate      4- Fair rankings.
                            Count
                           Ranking               8
                                          1- Excellent            21
                                                             2- Good               32
                                                                           3- Moderate             5
                                                                                              4- Fair
                            Count                8                21              32             5
2.3. UAS Data Acquisition
      The multi-spectral UAS imagery was captured with a Parrot Sequoia®multi-spectral camera
      TheDrone
(Parrot     multi-spectral
                  SAS, Paris,  UAS     imagery
                                 France)    mountedwas captured
                                                         on a 3DR withSolo a(3DParrot   Sequoia®
                                                                                  Robotics,          multi-spectral
                                                                                               Berkeley,              camera
                                                                                                          USA) quadcopter
(Parrot  Drone
under clear    skySAS,   Paris, France)
                     conditions.            mounted
                                     The camera          on a 3DR
                                                     acquires         Solo (3D
                                                                  imagery         Robotics,
                                                                             in the           Berkeley,
                                                                                     green (550    nm, 40USA)    quadcopter
                                                                                                           nm bandwidth),
under
red (660clear
           nm,sky40 conditions.
                      nm bandwidth), The camera
                                            red edge acquires    imagery
                                                          (735 nm,    10 nm in bandwidth),
                                                                                the green (550and nm,NIR40 nm
                                                                                                           (790bandwidth),
                                                                                                                  nm, 40 nm
red  (660 nm,part
bandwidth)       40 nm     bandwidth),
                      of the spectrum with  red its
                                                  edge     × 3.6nm,
                                                      4.8(735      mm10(1280    × 960 pixels) and
                                                                          nm bandwidth),         CMOS NIRsensor.
                                                                                                           (790 nm,
                                                                                                                  The 40   nm
                                                                                                                        image
bandwidth)      part of the spectrum
acquisition parameters,       i.e., flight with
                                            height,its sidelap,
                                                       4.8 × 3.6andmmflight
                                                                        (1280speed,
                                                                                × 960 pixels)   CMOS
                                                                                        etc., were       sensor.
                                                                                                     designed     The on
                                                                                                               based    image
                                                                                                                           the
acquisition
suggestionsparameters,
               from previous  i.e.,studies
                                     flight height,
                                            [7,40,41]. sidelap,   and was
                                                          The flight   flightconducted
                                                                               speed, etc.,
                                                                                          in were    designed based
                                                                                              an along-tree-row         on the
                                                                                                                    pattern at
suggestions
75 m AGL onfrom   2 Febprevious     studies2:11-2:17
                          2017 between        [7,40,41].PM The(60  ◦ solar
                                                                 flight  was   conducted
                                                                            elevation).   Thein sidelap
                                                                                                an along-tree-row
                                                                                                         of the imagespattern
                                                                                                                          was
at 75 m
80%,  theAGL
           imageoncapture
                     2 Feb 2017    between
                              interval    was2:11-2:17     PM (60°
                                                set to 1 second       solar
                                                                    (92%     elevation).
                                                                           forward         The sidelap
                                                                                      overlap),   and theofflight
                                                                                                             the images
                                                                                                                   speed was
80%,
5 m/s.the image capture interval was set to 1 second (92% forward overlap), and the flight speed was
5 m/s.Ten AeroPoints®(Propeller Aerobotics Pty Ltd, Surry Hills, Australia) and eight gradient
panelsTen
        inAeroPoints®
            greyscale were  (Propeller
                                deployed   Aerobotics     Pty Ltd,
                                              for geometric      andSurry   Hills, Australia)
                                                                      radiometric      correctionand  eight gradient
                                                                                                    purposes,          panels
                                                                                                                respectively.
in greyscale
The  locations were
                 of the deployed
                        AeroPointsfor      geometric
                                         were  recordedand      radiometric
                                                           for five  hours andcorrection
                                                                                  subsequentlypurposes,   respectively.
                                                                                                  post-processed     usingThe
                                                                                                                           the
locations   of the AeroPoints
Propeller®network        correction were   recorded
                                        based  on the for   five base
                                                        nearest    hoursstation,
                                                                          and subsequently
                                                                                  located within post-processed     using site.
                                                                                                     26 km of the study    the
Propeller®
The           network
     calibration   panelscorrection
                            were designedbasedbased
                                                 on theonnearest     base station,
                                                            the suggestion            located
                                                                                of Wang   and within    26 km
                                                                                                Myint [42].     ofreflectance
                                                                                                              The   the study
site. The calibration panels were designed based on the suggestion of Wang and Myint [42]. The
reflectance values of the calibration panels were measured with an ASD FieldSpec® 3 spectrometer
(Malvern Panalytical Ltd, Malvern, UK) and ranged from 4% to 92% in all spectral bands,
corresponding with the four bands of the Sequoia® camera (Figure 3).
Measuring Canopy Structure and Condition Using Multi-Spectral UAS Imagery in a Horticultural Environment - MDPI
Remote Sens. 2019, 11, 269                                                                                            5 of 19

values of the calibration panels were measured with an ASD FieldSpec®3 spectrometer (Malvern
Panalytical Ltd, Malvern, UK) and ranged from 4% to 92% in all spectral bands, corresponding with
the four
Remote    bands
       Sens.        of xthe
             2018, 10,   FORSequoia®camera
                             PEER REVIEW   (Figure 3).                                      5 of 19

      Figure 3. Spectral
                 Spectral reflectance of the eight greyscale radiometric calibration panels measured in-situ
      with a field spectrometer and resampled
                                      resampled to
                                                 to match
                                                    match the
                                                           the four
                                                               four Parrot
                                                                    Parrot Sequoia®multi-spectral
                                                                           Sequoia® multi-spectralbands.
                                                                                                   bands.

2.4. Image
2.4. Image Pre-Processing
           Pre-Processing
       Agisoft PhotoScan
      Agisoft    PhotoScanPro    Pro(Agisoft
                                      (AgisoftLLC,   St. St.
                                                  LLC,   Petersburg,    Russia)
                                                              Petersburg,        was used
                                                                            Russia)         to process
                                                                                      was used          the multi-spectral
                                                                                                   to process    the multi-
UAS     data  with   the   aid of an  in-house    Python     script to optimise   and   automate
spectral UAS data with the aid of an in-house Python script to optimise and automate the process.   the  process.   The key
point   and  tie point   limits  were  set as  40,000  and   10,000  respectively  for photo   alignment.
The key point and tie point limits were set as 40,000 and 10,000 respectively for photo alignment. The        The measured
ground control
measured       groundpoints   (GCPs)points
                            control    derived(GCPs)
                                                  from thederived
                                                              AeroPoints®were
                                                                       from the imported
                                                                                    AeroPoints®to geometrically
                                                                                                      were importedcalibrate
                                                                                                                           to
and   geo-reference      the  images.   The   geo-referencing     root-mean-square      error  (RMSE)
geometrically calibrate and geo-reference the images. The geo-referencing root-mean-square error         of  the GCPs    was
0.07 m. The
(RMSE)          overall
           of the   GCPsprojection
                             was 0.07 error
                                         m. The wasoverall
                                                     0.6 pixel   based onerror
                                                              projection    the bundle-adjustment
                                                                                 was 0.6 pixel basederror       assessment
                                                                                                           on the   bundle-
report. The error
adjustment      projection     errors of
                        assessment        tie points
                                       report.         were takenerrors
                                                 The projection       into account   to eliminate
                                                                            of tie points            poor-quality
                                                                                            were taken                points,
                                                                                                           into account    to
and   a  noise  filter  was  also  applied   to  assure  the   quality  of the final products.    A
eliminate poor-quality points, and a noise filter was also applied to assure the quality of the finalmild  noise  filter was
applied during
products.    A mild   thenoise
                           pointfilter
                                   cloud  densification
                                        was  applied during process
                                                                  the to keepcloud
                                                                       point    as many    details onprocess
                                                                                     densification      the treetostructure
                                                                                                                    keep as
as possible.     The    densified    photogrammetric         point  clouds   were  then   classified
many details on the tree structure as possible. The densified photogrammetric point clouds were       to  identify   ground
                                                                                                                        then
points   before   generating     both  a digital   surface   model   (DSM)   and  digital  terrain  model
classified to identify ground points before generating both a digital surface model (DSM) and digital        (DTM).   Before
ortho-rectifying
terrain   model (DTM). images,   colour
                              Before      correction wasimages,
                                       ortho-rectifying       enabled   to calibrate
                                                                      colour          the vignetting
                                                                              correction   was enabled  effect  and reduce
                                                                                                            to calibrate  the
brightness     variation    caused   by  variations   in  photographic     parameters    (e.g. ISO
vignetting effect and reduce brightness variation caused by variations in photographic parameters    value,   shutter speed,
etc.), ISO
(e.g.   which   cannot
            value,         be set
                      shutter     to a constant
                                speed,             valuecannot
                                         etc.), which     for thebeParrot
                                                                      set toSequoia  camera.
                                                                             a constant   valueOrthomosaics
                                                                                                  for the Parrotwere     also
                                                                                                                    Sequoia
produced
camera.      with the colour
           Orthomosaics           balance
                               were         option disabled
                                      also produced      with theto preserve   the pixel
                                                                    colour balance        values
                                                                                       option      as closetotopreserve
                                                                                                disabled        the original
                                                                                                                          the
images    as  possible    [41,43]  (Figure  4).
pixel values as close to the original images as possible [41,43] (Figure 4).
2.5. Producing Analysis Ready Data
     In order to estimate the tree height, we derived a canopy height model (CHM) by subtracting
the DTM from the DSM. For PPC, we used the brightness of red edge and NIR bands and a range of
vegetation indices based on the at-surface reflectance imagery from the orthomosaic. The brightness
is the direct output of image pre-processing, which was recorded in digital number (DN) and had
a strong causality with at-surface reflectance. At-surface reflectance imagery was created using a
simplified empirical correction based on the radiometric calibration panels, which was suggested by
previous studies [7,41,42], with the aid of an in-house Python script. However, the initial corrected
at-surface reflectance imagery appeared with some negative reflectance values due to shaded leaves
and perhaps inaccurate reflectance estimations from the panel [41]. Therefore, we manually delineated
the tree rows and calculated the zonal statistics within these regions to get the minimum value for
each band of each mosaic. These negative values were applied for dark feature subtraction [35] to
                         (a)                                               (b)
      Figure 4. The orthomosaics of the red edge band (a) without colour-balancing and (b) with colour-
      balancing. The south part of the mosaic in (a) is darker than the north part, while such brightness
      variation is less pronounced in (b). This phenomenon was caused by dynamic photographic
      parameters and only occurred in the green and red edge bands in this case.
Measuring Canopy Structure and Condition Using Multi-Spectral UAS Imagery in a Horticultural Environment - MDPI
spectral UAS data with the aid of an in-house Python script to optimise and automate the process.
The key point and tie point limits were set as 40,000 and 10,000 respectively for photo alignment. The
measured ground control points (GCPs) derived from the AeroPoints® were imported to
geometrically calibrate and geo-reference the images. The geo-referencing root-mean-square error
(RMSE) of the GCPs was 0.07 m. The overall projection error was 0.6 pixel based on the bundle-
 Remote Sens. 2019, 11, 269                                                                                          6 of 19
adjustment error assessment report. The projection errors of tie points were taken into account to
eliminate poor-quality points, and a noise filter was also applied to assure the quality of the final
 offset the A
products.     pixel
                 mildvalues
                         noiseinfilter
                                  the reflectance
                                        was applied  images
                                                        duringto the
                                                                  make  surecloud
                                                                      point   that most    of the at-surface
                                                                                    densification    process toreflectance
                                                                                                                  keep as
 valuesdetails
many     withinonthe thetree
                          treerows   were as
                                structure   positive   andThe
                                                possible.   thedensified
                                                                spectral signature    fitted thepoint
                                                                          photogrammetric         spectral  characteristic
                                                                                                       clouds   were then
 of vegetation.
classified          Subsequently,
            to identify                the two
                            ground points         at-surface
                                              before          reflectance
                                                       generating   both a orthomosaics
                                                                            digital surfacewere
                                                                                              modelused   to generate
                                                                                                      (DSM)             the
                                                                                                               and digital
 following
terrain  modelvegetation
                  (DTM). indices:       (1) Normalisedimages,
                              Before ortho-rectifying       Difference   Vegetation
                                                                     colour  correctionIndex
                                                                                          was (NDVI),
                                                                                               enabled (2)    Normalised
                                                                                                         to calibrate  the
 Difference effect
vignetting     Red Edgeand Index
                             reduce(NDRE),
                                       brightness(3) variation
                                                     green NDVI    (g-NDVI),
                                                                caused          (3) Red in
                                                                         by variations    Edge  Normalisedparameters
                                                                                             photographic       Difference
 Vegetation
(e.g.          Index
      ISO value,        (RENDVI),
                     shutter    speed,and    (5)which
                                         etc.),   Greencannot
                                                         Chlorophyll
                                                                 be set Index  (ClGE) (Table
                                                                        to a constant            2). the
                                                                                         value for   These   indices
                                                                                                         Parrot      were
                                                                                                                  Sequoia
 selected Orthomosaics
camera.    because they are      commonly
                               were             used in precision
                                     also produced                 agricultural
                                                        with the colour          applications
                                                                           balance              and have
                                                                                     option disabled     to proven
                                                                                                            preserveuseful
                                                                                                                       the
 for estimating
pixel  values as theclosebiomass    and productivity
                            to the original   images aswith    a specific
                                                          possible        degree
                                                                     [41,43]       of accuracy
                                                                             (Figure   4).        [12,18,36,44,45].

                            (a)                                                            (b)
                  The
     Figure 4.4.The
     Figure             orthomosaics
                    orthomosaics          of red
                                     of the  the edge
                                                 red edge
                                                        band band    (a) without
                                                               (a) without           colour-balancing
                                                                             colour-balancing  and (b)and
                                                                                                        with(b) with
                                                                                                             colour-
     colour-balancing.
     balancing.  The south The   south
                              part       part
                                    of the    of theinmosaic
                                            mosaic              in (a) than
                                                       (a) is darker    is darker  than part,
                                                                             the north   the north
                                                                                              while part,
                                                                                                    such while  such
                                                                                                          brightness
     brightnessisvariation
     variation              is less pronounced
                   less pronounced       in (b). in  (b). phenomenon
                                                  This    This phenomenon was was   caused
                                                                                caused   byby dynamicphotographic
                                                                                             dynamic    photographic
     parameters and
     parameters   and only
                       only occurred
                             occurred inin the
                                           the green
                                               green and red edge bands in this case.

                       Table 2. Formulae of vegetation indices which were used in this study.

                                         Vegetation Index                                     Formula
                                                                                              R N IR − R Red
                       Normalised Difference Vegetation Index (NDVI)                          R N IR + R Red
                                                                                             R N IR − RGreen
                    Green Normalised Difference Vegetation Index (gNDVI)                     R N IR + RGreen
                                                                                            R Red edge − R Red
                 Red Edge Normalised Difference Vegetation Index (RENDVI)                   R Red edge + R Red
                                                                                            R N IR − R Red edge
                         Normalised Difference Red Edge Index (NDRE)                        R N IR + R Red edge
                                                                                               R N IR
                                  Green Chlorophyll Index (ClGE)                              RGreen − 1
                                     Rband represents the reflectance of specific bands.

2.6. Individual Tree Crown Delineation and Structural Attribute Estimation
     To delineate individual trees, tree rows were first delineated with geographic object-based image
analysis (GEOBIA) using the eCognition Developer software (Trimble, Munich, Germany). The initial
segmentation was conducted using the multiresolution segmentation algorithm [46] based on the
CHM, NDVI, NIR and red bands (Figure 5). The NDVI and NIR bands are commonly used to delineate
vegetation [7,47,48]. The reason we also selected the red band as one of the inputs was that the ground
material is mostly red dirt, creating contrast between trees and the ground. Initially, parts of the tree
crowns were distinguished with segments that had CHM values greater than 3 m. Those segments were
then grown progressively outwards until CHM ≤ 0.3 m and NDVI ≤ 0.1. At this stage, the delineated
tree crown extent excluded significant within-crown gaps and left them as unclassified segments
which were enclosed by tree crown segments. For gap fraction analysis purposes, such unclassified
segments were included as part of the tree crown, if they were surrounded by already classified tree
Measuring Canopy Structure and Condition Using Multi-Spectral UAS Imagery in a Horticultural Environment - MDPI
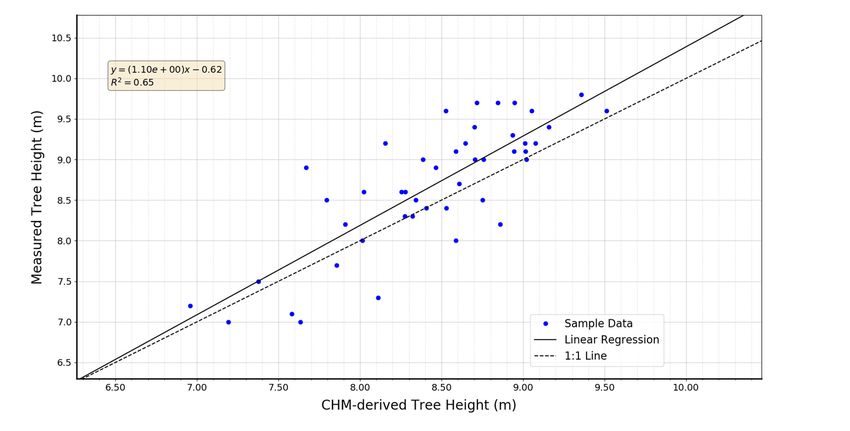
Remote Sens. 2019, 11, 269                                                                                              7 of 19

crown objects. All the tree segments were eventually merged to create the extent shapefile of tree rows
(Figure 5).
 Remote Sens. 2018, 10, x FOR PEER REVIEW                                                                              7 of 19

                   Figure 5.
                   Figure 5. The workflow of individual
                                             individual tree
                                                        tree delineation
                                                             delineationand
                                                                         andattribute
                                                                             attributeextraction.
                                                                                       extraction.

      Once
       Oncethethetree
                   treerows
                        rowshadhadbeen
                                    beendelineated,
                                          delineated,thethenext
                                                            nextstep
                                                                   stepwas
                                                                         was totoidentify individual
                                                                                   identify  individual  tree  crowns
                                                                                                            tree crowns forfor
                                                                                                                             the
 theselected
45    45 selected
              trees,trees,
                      whichwhich    had measured
                              had been    been measured      in theasfield,
                                                      in the field,      well asas well astrees
                                                                                   the 66   the 66thattrees
                                                                                                        had that
                                                                                                              theirhad   their
                                                                                                                    condition
 condition
ranked.       ranked.the
           Because       Because   thebeen
                           trees had    treespruned
                                               had been    pruned mechanically
                                                       mechanically       and many and  of themany
                                                                                                tree of    the tree
                                                                                                       crowns         crowns
                                                                                                                 overlapped
 overlapped
with            with tree
      the adjacent     the adjacent
                            crowns, ittree
                                        wascrowns,   it wasto
                                              not possible   not   possiblethem
                                                                separate       to separate   them automatically
                                                                                    automatically      based on height  based
                                                                                                                            and
 on height
spectral      and spectral
           information.       information.
                           Therefore,        Therefore,
                                        we visually       we visually
                                                       delineated          delineated
                                                                      the 45  individualthetree
                                                                                              45 individual
                                                                                                  crowns based  treeoncrowns
                                                                                                                         visual
 based on visual
interpretation        interpretation
                  of the  orthomosaics  of and
                                            the knowledge
                                                 orthomosaics     and location
                                                              of tree    knowledge  and of  tree location
                                                                                        planting    distance.  and  planting
                                                                                                                 Some    of the
 distance. Some
overlapping     crownof the   overlapping
                          areas  were split crown
                                              in halfareas
                                                      whenwere       splitextents
                                                              the real      in halfwere
                                                                                      when notthe  real extents
                                                                                                visually            were not
                                                                                                            distinguishable.
 visually distinguishable.
Nevertheless,     this methodNevertheless,       this method
                                  kept the majority             kept the
                                                        of the extent    of majority
                                                                             individualof the
                                                                                           treeextent
                                                                                                crowns,  of individual    tree
                                                                                                             hence reducing
 crowns,    hence   reducing    bias in  the  comparison    with    field-derived     PPC   information.
bias in the comparison with field-derived PPC information. Although the proposed GEOBIA method                Although     the
 proposed
could         GEOBIA
        not further       methodindividual
                       delineate    could not neighbouring
                                                 further delineate treesindividual
                                                                          within tree neighbouring
                                                                                         rows, it reducedtrees the
                                                                                                                 within   tree
                                                                                                                     potential
 rows,  it  reduced    the potential   error  and  processing    time   caused
error and processing time caused by manual delineation of tree row extent.         by manual    delineation      of tree  row
 extent.
       The semi-automatically delineated individual tree crown extents were used as the final objects
 to extract individual tree crown parameters. Tree height was estimated by the maximum CHM value
 within each object to correspond to field measurements. Crown width and length, which represented
 the horizontal diameter of the tree crown in the direction along and perpendicular to the hedgerows,
Measuring Canopy Structure and Condition Using Multi-Spectral UAS Imagery in a Horticultural Environment - MDPI
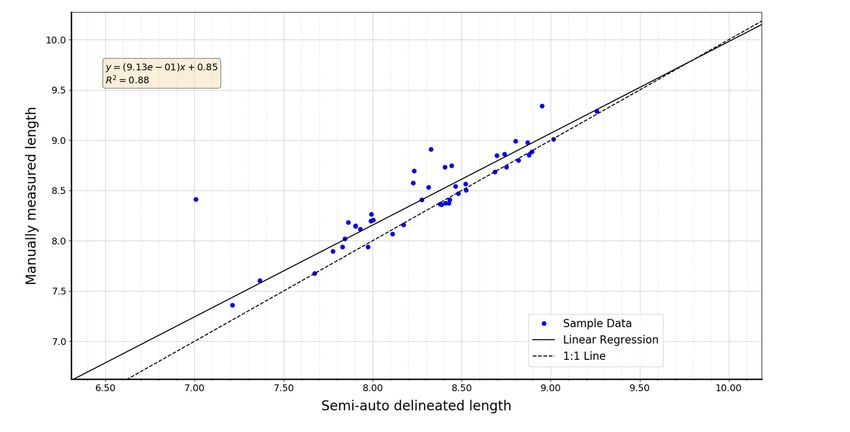
Remote Sens. 2019, 11, 269                                                                                                8 of 19

       The semi-automatically delineated individual tree crown extents were used as the final objects to
 extract individual tree crown parameters. Tree height was estimated by the maximum CHM value
 within each object to correspond to field measurements. Crown width and length, which represented
Remote Sens. 2018, 10, x FOR PEER REVIEW                                                                            8 of 19
 the horizontal diameter of the tree crown in the direction along and perpendicular to the hedgerows,
 respectively,was
respectively,    wascalculated
                        calculatedusing
                                     usingthethewidth
                                                  widthandandlength
                                                                lengthofofthe
                                                                           theminimum
                                                                               minimumrectangle
                                                                                           rectanglethat
                                                                                                      thatcovered
                                                                                                           coveredeacheach
 crown extent
crown    extent (Figure
                   (Figure6a).  Crown
                              6a).  Crown length   for each
                                               length   for tree
                                                            eachwas    also
                                                                    tree    manually
                                                                          was          measuredmeasured
                                                                                also manually     from the orthomosaic
                                                                                                               from the
 for comparison       with  the calculated    length   using  the  GEOBIA
orthomosaic for comparison with the calculated length using the GEOBIA method.method.   The  mean,  standard Thedeviation,
                                                                                                                   mean,
 and Haralick
standard           textureand
             deviation,      greyHaralick
                                   level co-occurrence
                                              texture greymatrix
                                                               level (GLCM)     [7,46,49–52],
                                                                      co-occurrence    matrix including
                                                                                                (GLCM) homogeneity,
                                                                                                           [7,46,49–52],
 dissimilarity,
including           contrast, and
             homogeneity,            standard contrast,
                               dissimilarity,      deviation,and were  extracted
                                                                   standard        for thewere
                                                                              deviation,    red edge   brightness,
                                                                                                 extracted             NIR
                                                                                                             for the red
 brightness,   and   five  vegetation  indices    (Table 2) and   exported  for further analysis.
edge brightness, NIR brightness, and five vegetation indices (Table 2) and exported for further    These  image-derived
 parameters     were    then compared      to field measurements,       and their to
                                                                                   coefficient of determination        2 ) of
analysis.   These    image-derived      parameters      were then compared           field measurements,       and (Rtheir
 linear regressions
coefficient              and RMSE (R
              of determination       were
                                        2) ofcalculated   to assess their
                                                linear regressions     andcorrelation
                                                                             RMSE were  andcalculated
                                                                                             accuracy attothe  tree crown
                                                                                                            assess   their
 object  level.
correlation and accuracy at the tree crown object level.

                                (a)                                                              (b)
     Figure
      Figure6.6.The
                 Thedelineated
                      delineatedtreetreeextent
                                         extentfor
                                                forthe
                                                    the4545selected
                                                             selectedtrees
                                                                       treesthat
                                                                             thathad
                                                                                  hadin-situ
                                                                                        in-situstructural
                                                                                                 structuralmeasurements
                                                                                                            measurements
     and
      andthe
           the6666trees
                   treesthat
                         thathadhadon-ground
                                     on-groundcondition
                                                  conditionevaluation.
                                                               evaluation.The Therectangles
                                                                                   rectangleswhich
                                                                                                whicharearehighlighted
                                                                                                            highlightedinin
      greeninin(a)
     green      (a)represent
                    representthe theminimum
                                     minimumrectangle
                                                 rectangletotomeasure
                                                                measurecrown
                                                                           crownwidth
                                                                                    widthand
                                                                                           andlength,
                                                                                                  length,representing
                                                                                                          representingthethe
      horizontaldistance
     horizontal    distance in the
                                 the direction
                                      directionalong
                                                 alongandandperpendicular
                                                               perpendicular to the
                                                                                 to hedgerow,
                                                                                     the hedgerow, respectively. The yellow
                                                                                                        respectively. The
      highlighted
     yellow         trees intrees
             highlighted      (b) include  the 22 trees
                                   in (b) include       fortrees
                                                   the 22    which
                                                                 fortree  crown
                                                                      which   treewere
                                                                                    crowncondition   ranked and
                                                                                            were condition        measured
                                                                                                              ranked  and
      structure structure
     measured    in field. in field.

 2.7. Canopy Condition Ranking
2.7. Canopy Condition Ranking
       After finishing the accuracy assessment of the extracted structural attributes, only the variables
      After finishing the accuracy assessment of the extracted structural attributes, only the variables
 such as the maximum CHM value, average pixel value and texture from spectral bands and vegetation
such as the maximum CHM value, average pixel value and texture from spectral bands and
 indices, which were highly correlated with the field measurements, were selected for the condition
vegetation indices, which were highly correlated with the field measurements, were selected for the
 ranking classification of the 66 field assessed trees (Figure 6b), using a parallel random forest
condition ranking classification of the 66 field assessed trees (Figure 6b), using a parallel random
 classifier [53] with the aid of an in-house Python script. For the random forest classification, 80% of
forest classifier [53] with the aid of an in-house Python script. For the random forest classification,
 the 66 avocado trees were selected randomly to train the classifier with the aforementioned selected
80% of the 66 avocado trees were selected randomly to train the classifier with the aforementioned
 variables as training features and the condition ranking as training labels. Every time the classifier was
selected variables as training features and the condition ranking as training labels. Every time the
 trained, it randomly picked a number of training features that equalled the square root of total number
classifier was trained, it randomly picked a number of training features that equalled the square root
 of features to grow the tree. The accuracy of the trained classifier was estimated using out-of-bag
of total number of features to grow the tree. The accuracy of the trained classifier was estimated using
 error that was calculated by the bootstrap aggregating (bagging) predictor, which is the method for
out-of-bag error that was calculated by the bootstrap aggregating (bagging) predictor, which is the
 generating random subsets that have a uniform probability of each label and with replacement for
method for generating random subsets that have a uniform probability of each label and with
 prediction [53,54]. The classifier was trained repeatedly 300 times with different random subsets to
replacement for prediction [53,54]. The classifier was trained repeatedly 300 times with different
 allow nodes to grow until the out-of-bag error was stable [55]. The trained random forest classifier
random subsets to allow nodes to grow until the out-of-bag error was stable [55]. The trained random
 was then used to predict the condition ranking for all 66 trees based on the extracted variable sets.
forest classifier was then used to predict the condition ranking for all 66 trees based on the extracted
 The prediction was compared with the in-field condition ranking to generate a confusion matrix
variable sets. The prediction was compared with the in-field condition ranking to generate a
confusion matrix to assess the model accuracy. The relative importance of the features used as
decision nodes was calculated by averaging the probabilistic predictions, which were estimated by
the mean decrease impurity method, to decrease the variance as well as bias [56,57].
Measuring Canopy Structure and Condition Using Multi-Spectral UAS Imagery in a Horticultural Environment - MDPI
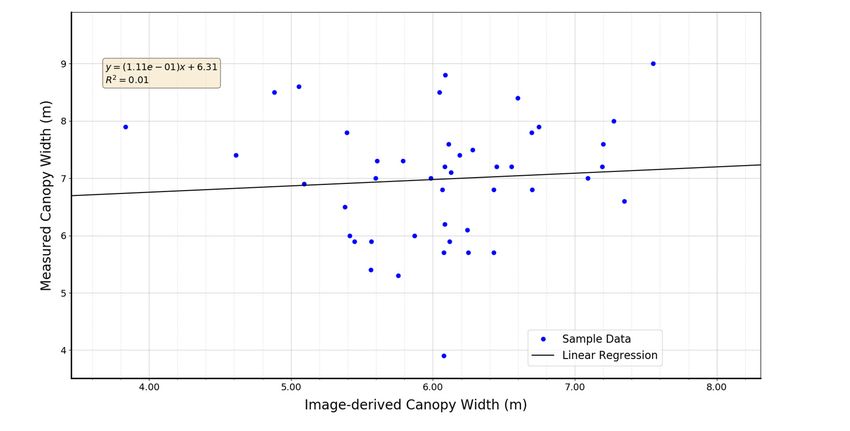
Remote Sens. 2019, 11, 269                                                                                             9 of 19

to assess the model accuracy. The relative importance of the features used as decision nodes was
calculated by averaging the probabilistic predictions, which were estimated by the mean decrease
    Remote Sens. 2018, 10, x FOR PEER REVIEW                                                  9 of 19
impurity   method, to decrease the variance as well as bias [56,57].

    3. Results
3. Results

3.1. 3.1. Accuracy
      Accuracy     of CHM-Derived
               of CHM-Derived TreeTree Height
                                   Height
      TheThe   maximum
           maximum           value
                         value       of the
                                 of the       UAS-derived
                                         UAS-derived       CHM  CHM waswas   extracted
                                                                         extracted   for for
                                                                                          the the  individual
                                                                                               individual       trees
                                                                                                            trees  andand
compared against the field-based tree height measurements. The result shows that the CHM hadhad
    compared     against  the  field-based   tree  height   measurements.     The   result shows    that the CHM      a a
    positive
positive      correlation
         correlation   withwith    the field-derived
                             the field-derived          tree height
                                                  tree height          and produced
                                                                and produced            a coefficient
                                                                                a coefficient                        2
                                                                                                        of determination
                                                                                                of determination   (R )
    (R2)using
of 0.65  of 0.65  using model
               a linear  a linear(Figure
                                   model7).(Figure
                                              Of the7).
                                                      45Of   themeasured,
                                                          trees   45 trees measured,
                                                                             the averagethefield-derived
                                                                                             average field-derived
                                                                                                           tree heighttree
washeight   was
     8.7 m (n     8.7 m
               = 45),    (n =the
                       while  45),average
                                    while the   average CHM-derived
                                            CHM-derived                     tree8.4
                                                              tree height was    height   was
                                                                                     m. The     8.4 m.
                                                                                             RMSE    of The  RMSE of the
                                                                                                        the estimated
treeestimated
     height was tree
                   0.5height
                       m. Thewas   0.5 m. The
                                average   tree average
                                               height wastreeslightly
                                                               height was   slightly underestimated
                                                                        underestimated                   using the CHM-
                                                                                           using the CHM-derived
    derived
method       method
         possibly   duepossibly    due to the inaccuracies
                         to the inaccuracies                    of 3D reconstruction
                                                of 3D reconstruction                    on some branches.
                                                                          on some branches.

      Figure 7. Scatter plot and the linear regression of tree height. Blue dots appearing above and below the
           Figure 7. Scatter plot and the linear regression of tree height. Blue dots appearing above and below
      1:1 line represent a UAS-based under- and overestimation of the tree height, respectively.
           the 1:1 line represent a UAS-based under- and overestimation of the tree height, respectively.
3.2. Accuracy of Image-Derived Crown Width and Length
    3.2. Accuracy of Image-Derived Crown Width and Length
      The correlation between the image-derived and field measured canopy width was low, because of
          The correlation
the overlapping     canopiesbetween
                                and lackthe
                                          of image-derived
                                              height variationand      field measured
                                                                    between                canopy width
                                                                               them, preventing       accuratewas   low, because
                                                                                                                  delineation
    of edges
of the  the overlapping       canopies and
               between neighbouring        tree lack
                                                 crowns of from
                                                             heightthevariation
                                                                       CHM andbetween            them, preventing
                                                                                     spectral imagery.     From Figure   accurate
                                                                                                                            8a,
    delineation    of the  edges    between    neighbouring       tree  crowns    from    the  CHM
we can tell that there is no correlation between the measured canopy width and image-derived canopy    and    spectral  imagery.
    From
width.      Figureof8a,
         Because         welimitation
                      this    can tell that   there isthe
                                        to estimate      nocanopy
                                                              correlation
                                                                       width between     the measured
                                                                                accurately,                 canopy
                                                                                              it is not feasible      width
                                                                                                                   to use  theand
    image-derived
estimated              canopy
            canopy width      aswidth.   Because
                                  an indicator   of of this
                                                    tree     limitation to estimate the canopy width accurately, it is
                                                          condition.
    not
      Thefeasible  to useofthe
           estimation           estimated
                             crown   lengthcanopy
                                               using width
                                                       a linearasmodel
                                                                   an indicator
                                                                            had a of
                                                                                   R2tree   condition.
                                                                                        value   of 0.88 compared to the
manually  The   estimation
            measured          of crown
                         length    using length    using a linear
                                          the orthomosaic              model
                                                                 (Figures       had 8b).
                                                                            6a and    a R From
                                                                                          2  valueFigure
                                                                                                     of 0.888b,compared     to the
                                                                                                                  we can tell
that there was an outlier in the scatter plot, which was caused by a branch of sparse leaves that failedcan
    manually     measured    length   using  the  orthomosaic       (Figure  6a  and   Figure   8b).  From    Figure  8b,  we
    tell that there
reconstructed     withwas  an Therefore,
                        SfM.   outlier in the   scatter
                                            it was        plot, which
                                                    excluded      from thewasstatistical
                                                                                caused by     a branch
                                                                                           analysis.   Theof average
                                                                                                             sparse leaves
                                                                                                                        of thethat
    failed reconstructed
manually    measured canopy   withlength
                                    SfM. Therefore,
                                            was 8.45 m   it (n
                                                            was   excluded
                                                                = 45),  whilefrom     the statistical
                                                                                the average             analysis. The
                                                                                                of the calculated        average
                                                                                                                      canopy
    of the  manually     measured     canopy    length    was   8.45   m  (n =  45),  while   the
length based on the semi-automatic delineation results was 8.32 m. The calculated canopy length     average    of the  calculated
wascanopy     length based
      underestimated           on theofsemi-automatic
                          for most       the trees with delineation
                                                             an RMSE atresults0.2 m,was     8.32 m.
                                                                                       because     theThe
                                                                                                       leavescalculated   canopy
                                                                                                                 at the edge
    length was
of canopy    wereunderestimated
                    usually sparse and for most
                                            henceofnotthewell-reconstructed
                                                            trees with an RMSE     withat SfM.
                                                                                           0.2 m,Thebecause    the leaves
                                                                                                       tree canopies        at the
                                                                                                                         were
    edge   of canopy    were   usually   sparse   and   hence    not  well-reconstructed       with
pruned mechanically so that the edge of canopies in the direction along the hedgerow aligned very     SfM.   The   tree canopies
    were
well.      pruned
       Hence,        mechanically
                the canopy    length so  that the edge
                                      is dictated   by theofpruning
                                                               canopies    in thethan
                                                                         rather    direction
                                                                                        the realalong   the hedgerow
                                                                                                  condition               aligned
                                                                                                               of individual
    very well. Hence, the canopy length is dictated by the pruning rather than the real condition of
    individual tree crowns. While the pruning effects prevent measured length from being used as an
    indicator of tree condition, tree crown length and gap length between hedgerows can still provide
    useful information for future pruning operations and management purposes.
Measuring Canopy Structure and Condition Using Multi-Spectral UAS Imagery in a Horticultural Environment - MDPI
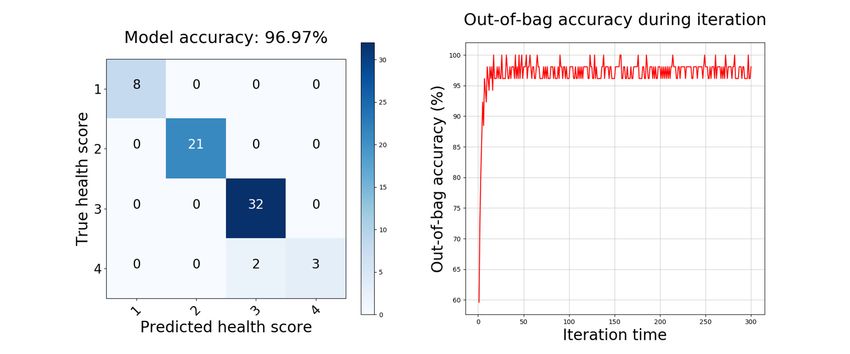
Remote Sens. 2019, 11, 269                                                                                          10 of 19

tree crowns. While the pruning effects prevent measured length from being used as an indicator of tree
condition, tree crown length and gap length between hedgerows can still provide useful information
for future  pruning
    Remote Sens.        operations
                 2018, 10,          and
                           x FOR PEER   management purposes.
                                      REVIEW                                                       10 of 19

                                                                 (a)

                                                                (b)
          Figure
      Figure     8. Scatter
             8. Scatter  plotplot
                              andand    linear
                                   linear      regression
                                           regression      of canopy
                                                      of (a)  (a) canopy   width
                                                                       width       in the
                                                                               in the     direction
                                                                                      direction     along
                                                                                                along  the the  hedgerow,
                                                                                                            hedgerow,
      andand  (b) canopy
          (b) canopy       length
                       length       in direction
                               in the  the direction perpendicular
                                                 perpendicular         to hedgerow.
                                                                  to the  the hedgerow.The The outlier
                                                                                           outlier     in caused
                                                                                                   in (b)  (b) caused
                                                                                                                   by aby a
          branch
      branch      of sparse
             of sparse       leaves
                        leaves       at lower
                                at the   the lower
                                               partpart
                                                   of a of a tree
                                                        tree was was    not taken
                                                                   not taken  into into account
                                                                                    account      inlinear
                                                                                            in the  the linear  regression.
                                                                                                           regression.

3.3. 3.3.
     PPCPPC
          Correlation
             Correlation
      Figure  9 shows
         Figure         the the
                   9 shows   different   R2 values
                                  different         for for
                                            R2 values   the the
                                                             PPCPPCregression  between
                                                                       regression         andand
                                                                                    between    fieldfield
                                                                                                      derived   PPCPPC
                                                                                                           derived
values  and and
    values  different  spectral
                  different     indicators,
                            spectral         including
                                       indicators,      the brightness
                                                   including             of the red
                                                               the brightness       edge
                                                                                of the redand NIR
                                                                                            edge  andbands
                                                                                                        NIRand   fiveand
                                                                                                             bands
vegetation  indices   and texture   bands,  with and  without   colour  correction.  Colour  correction
    five vegetation indices and texture bands, with and without colour correction. Colour correction      improved
the improved
    observed relationship
                 the observed of image   derivedofstructure
                                  relationship                values to
                                                    image derived       ground measurements.
                                                                      structure   values to ground Comparing      the
                                                                                                        measurements.
results derived   with  and  without    colour correction,  the R 2 value using the vegetation indices showed
    Comparing the results derived with and without colour correction, the R value using the vegetation
                                                                                        2

higher  variation
    indices  showed between
                       higherthe   two radiometric
                               variation             corrections
                                           between the             than the corrections
                                                         two radiometric     red edge and    NIR
                                                                                          than theband
                                                                                                    red brightness.
                                                                                                         edge and NIR
Theband
     PPC correlation
          brightness.among
                        The PPC all correlation
                                     the indicators  was highest
                                                 among             when integrating
                                                          all the indicators           mean,
                                                                              was highest     standard
                                                                                             when         deviation
                                                                                                    integrating    mean,
    standard deviation (Stdev), and the four Haralick texture GLCMs for multi-variate linear regression.
    The input of Haralick texture GLCM improved the R2 value more than the standard deviation, except
    for the use of the NIR brightness. The R2 value using the mean of NIR brightness was 0.38 without
    colour correction but increased to 0.42 with colour correction. With the extra input of standard
    deviation and four Haralick texture GLCMs, the R2 value increased to 0.59 and 0.61 for the NIR
Remote Sens. 2019, 11, 269                                                                                                    11 of 19

(Stdev), and the four Haralick texture GLCMs for multi-variate linear regression. The input of Haralick
texture GLCM improved the R2 value more than the standard deviation, except for the use of the NIR
brightness. The R2 value using the mean of NIR brightness was 0.38 without colour correction but
increased to 0.42 with colour correction. With the extra input of standard deviation and four Haralick
texture
Remote   GLCMs,
       Sens. 2018, 10, the
                        x FORR2PEER
                                value    increased to 0.59 and 0.61 for the NIR brightness using multi-variate
                                    REVIEW                                                                       11 of 19
linear regression without and with colour correction, respectively. When used to explain the variation
When
in PPC,used
          NDVI to had
                   explain the the variation
                               second     highestin RPPC,  NDVI
                                                      2 value     had the
                                                              without       second
                                                                        colour       highestand
                                                                               correction    R2 the
                                                                                                 value  without
                                                                                                     highest     colour
                                                                                                             R2 of  0.62
correction   and   the    highest  R 2 of
                                       2   0.62 with   colour correction.  The R 2 value using
with colour correction. The R value using the mean NDVI value without colour correction was 0.31the mean   NDVI   value
without   colour to
and improved        correction
                         0.54 when was    0.31standard
                                       both    and improved     to 0.54
                                                          deviation  andwhen   both
                                                                          texture     standard deviation
                                                                                   information             and texture
                                                                                                  were added.   On the
information
other hand, an  wereR added.
                      2           On the
                         of 0.56 was         other hand,
                                        achieved     usingan  R the
                                                            only2 of 0.56
                                                                      meanwas  achieved
                                                                             NDVI   valueusing
                                                                                           with only
                                                                                                 colourthe mean NDVI
                                                                                                         correction  per
value  with   colour     correction   per   tree crown,   whereas  this value  was  increased to
tree crown, whereas this value was increased to 0.62 when including both standard deviation and   0.62 when  including
both  standard
texture            deviation and texture information.
         information.

      Figure 9. The R22 value
                         value of
                                of the
                                   the linear
                                       linear correlation
                                              correlation between
                                                           between field
                                                                      field measured
                                                                            measured PPC and different spectral
      images, including
               includingthe
                          thebrightness
                              brightnessofof
                                           thethe
                                               redred
                                                    edge  andand
                                                       edge   NIRNIR
                                                                   bands   and five
                                                                         bands   andvegetation  indices.
                                                                                      five vegetation    Each colour
                                                                                                      indices.  Each
      represents
      colour      the different
             represents         combination
                         the different         of input
                                        combination      including
                                                      of input      mean,mean,
                                                               including     standard   deviation
                                                                                   standard       (Stdev),
                                                                                             deviation      and four
                                                                                                        (Stdev), and
      texture GLCMs    (Texture).   The  bars on  the left and  right  sides  of the graph  were  produced
      four texture GLCMs (Texture). The bars on the left and right sides of the graph were produced           for the
      orthomosaics without and with colour correction, respectively.
                                                             respectively.

3.4. Tree
3.4.  Tree Condition
            Condition Prediction
                         Prediction
       The mean,
       The   mean,standard
                       standarddeviation,
                                     deviation,  andandfour Haralick
                                                          four  Haralicktexture   GLCMs
                                                                             texture   GLCMs of theofNIR
                                                                                                       thebrightness      and NDVI,
                                                                                                             NIR brightness       and
derived     from   the   colour-corrected        orthomosaic,      were    extracted   for  the
NDVI, derived from the colour-corrected orthomosaic, were extracted for the 66 trees. CHM-derived 66  trees.   CHM-derived        tree
height
tree      was was
      height   also also
                      selected   as one
                           selected    as of
                                          onethe offeatures  for predicting
                                                    the features                tree condition.
                                                                   for predicting                   The prediction
                                                                                      tree condition.                   results
                                                                                                           The prediction        from
                                                                                                                               results
from both NIR and NDVI classifiers were identical (Figures 10 and 11). The seven-feature classifiera
both   NIR    and   NDVI     classifiers   were    identical   (Figures    10  and  11).  The   seven-feature      classifier   had
higher
had       tree condition
       a higher               prediction
                    tree condition           accuracyaccuracy
                                         prediction       than the than
                                                                     two-feature     classifier for
                                                                             the two-feature            both the
                                                                                                   classifier   forNIR
                                                                                                                     both brightness
                                                                                                                            the NIR
and NDVI.and
brightness       BothNDVI.
                        classifiers
                               Both which       usedwhich
                                       classifiers      sevenused
                                                                features
                                                                     seven  had  the accuracy
                                                                              features   had theof     98.48%,of
                                                                                                     accuracy     while    the result
                                                                                                                     98.48%,    while
based
the       on based
     result   two features
                       on two produced          an accuracy
                                 features produced               of 96.97%.
                                                           an accuracy          In oneIn
                                                                           of 96.97%.     and
                                                                                            onetwoandcases     for the
                                                                                                         two cases    forseven    and
                                                                                                                           the seven
two-feature      classifiers,  respectively,     the  trees were   mapped      as moderate     condition,
and two-feature classifiers, respectively, the trees were mapped as moderate condition, while ranked           while  ranked    in the
field
in  theasfield
           fair as
                condition.
                   fair condition.
       The feature importance
       The   feature   importance orderorderwas wasdifferent
                                                      differentbetween
                                                                  betweenthe  theNIR
                                                                                  NIRandandNDVINDVIclassifiers
                                                                                                        classifiers(Tables
                                                                                                                     (Tables 3 and  4).
                                                                                                                                3 and
TheThe
4).   variables
          variables enabling
                       enabling  thethe
                                      greatest
                                         greatest discrimination
                                                     discriminationfor  forboth
                                                                             bothclassifiers
                                                                                   classifierswere
                                                                                                 werethe themean
                                                                                                              mean value,     texture
                                                                                                                     value, texture
GLCM       standard     deviation,      and   the   CHM-derived         tree  height,   with
GLCM standard deviation, and the CHM-derived tree height, with their combination providing more their   combination       providing
more50%
than    thanprobability
                50% probability        of prediction.
                              of prediction.      While the While
                                                               mean thevalue
                                                                          meanwas value
                                                                                      the was    the top
                                                                                           top one           onefor
                                                                                                       feature    feature
                                                                                                                      both for
                                                                                                                             the both
                                                                                                                                  NIR
the NIR
and    NDVI andclassifiers,
                   NDVI classifiers,
                                the NDVI   theclassifier
                                                 NDVI classifier
                                                            relied on relied
                                                                          the on   the mean
                                                                                mean    value value
                                                                                                 slightly slightly
                                                                                                             more more
                                                                                                                     than than
                                                                                                                            the NIRthe
NIR    classifier  for  predicting     tree  condition,     which    was   22.30%    compared
classifier for predicting tree condition, which was 22.30% compared to 19.76%. The second and third to  19.76%.   The   second    and
third important
most    most importantfeaturesfeatures
                                  for thefor
                                           NIR theclassifier
                                                    NIR classifier
                                                             were the were    the CHM-derived
                                                                          CHM-derived                  tree (18.39%)
                                                                                             tree height     height (18.39%)
                                                                                                                         and GLCM and
GLCM standard
standard      deviation deviation
                           (14.62%),(14.62%),        respectively,
                                         respectively,     while thewhile
                                                                        orderthefororder
                                                                                    the NDVIfor the    NDVI was
                                                                                                   classifier   classifier   was the
                                                                                                                      the opposite,
opposite,     with   the  GLCM       standard     deviation    and   CHM-derived
with the GLCM standard deviation and CHM-derived tree height explaining 17.31% and 15.71%tree  height     explaining    17.31%    and
15.71%     probability,
probability,                respectively.
                 respectively.      In otherIn     other the
                                                words,     words,
                                                               NIR the    NIR classifier
                                                                      classifier  relied less relied
                                                                                                 on thelessspectral
                                                                                                              on the spectral     and
                                                                                                                       and textural
information compared to the NDVI classifier, which may be because the NIR brightness contains
shadow-induced noise, which means that its derivatives may not properly reflect the actual canopy
condition.
Remote Sens. 2019, 11, 269                                                                                         12 of 19

 textural information compared to the NDVI classifier, which may be because the NIR brightness
 contains shadow-induced noise, which means that its derivatives may not properly reflect the actual
Remote
 canopySens. 2018, 10, x FOR PEER REVIEW
          condition.                                                                         12 of 19

                                                          (a)

                                                          (b)
     Figure
      Figure10.10. The
                   The confusion   matrix and
                        confusion matrix  andout-of-bag
                                               out-of-bagaccuracy
                                                          accuracyofofthe
                                                                        the random
                                                                          random      forest
                                                                                   forest    classification
                                                                                          classification for for
                                                                                                             the the
                                                                                                                 tree
      condition
     tree          prediction
           condition           basedbased
                        prediction   on theon
                                            CHM-derived     tree height
                                               the CHM-derived     tree and   (a) NIR-related
                                                                         height                features, including
                                                                                  and (a) NIR-related      features,
      the mean,the
     including     standard
                      mean, deviation,  and four Haralick
                              standard deviation,  and fourtexture GLCMs;
                                                             Haralick        and
                                                                       texture    (b) predicted
                                                                                 GLCMs;   and (b)PPC   using all
                                                                                                    predicted  PPCthe
      six NIR-related
     using   all the six features. Thefeatures.
                         NIR-related   conditionThe
                                                 ranking  fromranking
                                                    condition   one to four
                                                                         fromrepresents  condition
                                                                                one to four          fromcondition
                                                                                             represents     excellent
      to fair.
     from   excellent to fair.

      Table 3. The feature importance of each classifier using CHM-derived tree height and NIR-brightness-
     Table 3. The feature importance of each classifier using CHM-derived tree height and NIR-brightness-
      related features.
     related features.
                             Classifier                         Feature                Feature Importance
                        Classifier                   Feature               Feature Importance
                                                          Mean
                                                    Mean NIR     NIR                  19.76%
                                                                                 19.76%
                                                    CHM-derived tree height           18.39%
                                            CHM-derived    tree height
                                                   GLCM Standard deviation
                                                                                 18.39%
                                                                                      14.62%
                                           GLCM
             7-features classifier (Figure 10a)    Standard  deviation
                                                        GLCM contrast            14.62%
                                                                                      12.77%
                 7-features classifier
                                                  GLCM  contrast
                                                      GLCM   dissimilarity       12.77%
                                                                                      12.06%
                     (Figure 10a)
                                               GLCM Standard    deviation
                                                      dissimilarity                   11.59%
                                                                                 12.06%
                                                      GLCM homogeneity                10.81%
                                                Standard deviation               11.59%
                                                    CHM-derived tree height           51.16%
             2-features classifier (Figure 10b)GLCM homogeneity                  10.81%
                                                       NIR-derived PPC                48.84%
                 2-features classifier CHM-derived tree height                   51.16%
                     (Figure 10b)                NIR-derived PPC                 48.84%
Remote Sens. 2019, 11, 269                                                                                           13 of 19
Remote Sens. 2018, 10, x FOR PEER REVIEW                                                                             13 of 19

                                                            (a)

                                                            (b)
     Figure
      Figure11.    The confusion
               11.The  confusion matrix andand out-of-bag
                                                out-of-bagaccuracy
                                                           accuracyofofthe
                                                                         therandom
                                                                              random forest classification
                                                                                       forest              for for
                                                                                               classification  the the
                                                                                                                    tree
      condition
     tree         prediction
           condition           basedbased
                       prediction     on theonCHM-derived   tree height
                                               the CHM-derived     tree and   (a) NDVI-related
                                                                         height                   features, including
                                                                                  and (a) NDVI-related       features,
      the mean,the
     including    standard
                     mean, deviation,    and four Haralick
                              standard deviation,   and fourtexture GLCMs;
                                                              Haralick  textureand  (b) predicted
                                                                                  GLCMs;    and (b)PPC    using all
                                                                                                     predicted   PPC the
      six NDVI-related    features.  The  condition ranking from  one to  four  represents  condition   from
     using all the six NDVI-related features. The condition ranking from one to four represents condition     excellent
      to fair.
     from   excellent to fair.
      Table 4. The feature importance of each classifier using CHM-derived tree height and NDVI-related
     Table 4. The feature importance of each classifier using CHM-derived tree height and NDVI-related
      features.
     features.
                        Classifier                         Feature            Feature Importance
                       Classifier                 Feature              Feature Importance
                                                      Mean NDVI                    22.30%
                                                Mean NDVI                    22.30%
                                                 GLCM standard deviation           17.31%
                                        GLCM standard    deviation
                                                 CHM-derived  tree height    17.31%15.71%
                                         CHM-derived
          7-features classifier (Figure 11a)           tree deviation
                                                   Standard height           15.71%12.96%
              7-features classifier                GLCM  homogeneity
                                             Standard deviation              12.96%10.81%
                  (Figure 11a)                       GLCM contrast
                                           GLCM homogeneity                  10.81%10.75%
                                                   GLCM dissimilarity              10.16%
                                               GLCM contrast                 10.75%
                                                 CHM-derived tree height
          2-features classifier (Figure 11b)GLCM dissimilarity               10.16%51.44%
                                                   NDVI-derived PPC                48.56%
              2-features classifier CHM-derived tree height                  51.44%
                  (Figure 11b)              NDVI-derived PPC                 48.56%
4. Discussion
    The average tree height was underestimated with the CHM-derived method. A similar
phenomenon was also observed in previous studies of lychee and olive trees [7,8], and may be
You can also read