Enhancing the Therapeutic Potential of CCL2-Overexpressing Mesenchymal Stem Cells in Acute Stroke - MDPI
←
→
Page content transcription
If your browser does not render page correctly, please read the page content below

International Journal of
            Molecular Sciences

Article
Enhancing the Therapeutic Potential of
CCL2-Overexpressing Mesenchymal Stem Cells in
Acute Stroke
Sanghun Lee 1,† , Ok Joon Kim 1, *,† , Kee Ook Lee 1 , Hyeju Jung 1 , Seung-Hun Oh 1 and
Nam Keun Kim 2
 1    Department of Neurology, CHA Bundang Medical Center, CHA University, Seongnam 13496, Korea;
      shlee2251@daum.net (S.L.); niceiatros@cha.ac.kr (K.O.L.); heaju0420@daum.net (H.J.);
      ohsh72@chamc.co.kr (S.-H.O.)
 2    Institute for Clinical Research, CHA Bundang Medical Center, CHA University, Seongnam 13488, Korea;
      nkkim@chamc.co.kr
 *    Correspondence: okjun77@cha.ac.kr; Tel.: +82-31-780-5481; Fax: +82-31-780-5269
 †    These authors contributed equally as co-first to this work.

 Received: 14 September 2020; Accepted: 19 October 2020; Published: 21 October 2020

 Abstract: Although intravenous administration of mesenchymal stem cells (MSCs) is effective for
 experimental stroke, low engraftment and the limited functional capacity of transplanted cells
 are critical hurdles for clinical applications. C–C motif chemokine ligand 2 (CCL2) is associated
 with neurological repair after stroke and delivery of various cells into the brain via CCL2/CCR2
 (CCL2 receptor) interaction. In this study, after CCL2-overexpressing human umbilical cord-derived
 MSCs (hUC-MSCs) were intravenously transplanted with mannitol in rats with middle cerebral
 arterial occlusion, we compared the differences between four different treatment groups: mannitol +
 CCL2-overexpressing hUC-MSCs (CCL2-MSC), mannitol + naïve hUC-MSCs (M-MSC), mannitol
 only, and control. At four-weeks post-transplantation, the CCL2-MSC group showed significantly
 better functional recovery and smaller stroke volume relative to the other groups. Additionally,
 we observed upregulated levels of CCR2 in acute ischemic brain and the increase of migrated stem
 cells into these areas in the CCL2-MSC group relative to the M-MSC. Moreover, the CCL2-MSC group
 displayed increased angiogenesis and endogenous neurogenesis, decreased neuro-inflammation but
 with increased healing-process inflammatory cells relative to other groups. These findings indicated
 that CCL2-overexpressing hUC-MSCs showed better functional recovery relative to naïve hUC-MSCs
 according to the increased migration of these cells into brain areas of higher CCR2 expression,
 thereby promoting subsequent endogenous brain repair.

 Keywords: angiogenesis; CCL2; CCR2; mesenchymal stem cell; neurogenesis; stroke

1. Introduction
     Stroke is a leading cause of death and disability worldwide and represents a significant public
health concern along with a large socio-economic burden on healthcare systems [1]. In South Korea,
one in 40 adults are stroke patients, and 232 people in 100,000 experience a stroke event annually.
Stroke mortality is gradually declining but remains high at 30 deaths per 100,000 individuals [2].
     Currently, recombinant tissue plasminogen activator (r-tPA) is the only therapeutic agent approved
by the Food and Drug Administration to treat patients with acute ischemic stroke. However, r-tPA
involves highly restrictive inclusion criteria, and the clinical benefits only manifest upon administration
within 4.5 h of stroke onset. Therefore, r-tPA has a narrow time window and a small proportion of
eligible patients. Furthermore, serious neurological sequelae after using r-tPA remain in many cases.

Int. J. Mol. Sci. 2020, 21, 7795; doi:10.3390/ijms21207795                        www.mdpi.com/journal/ijms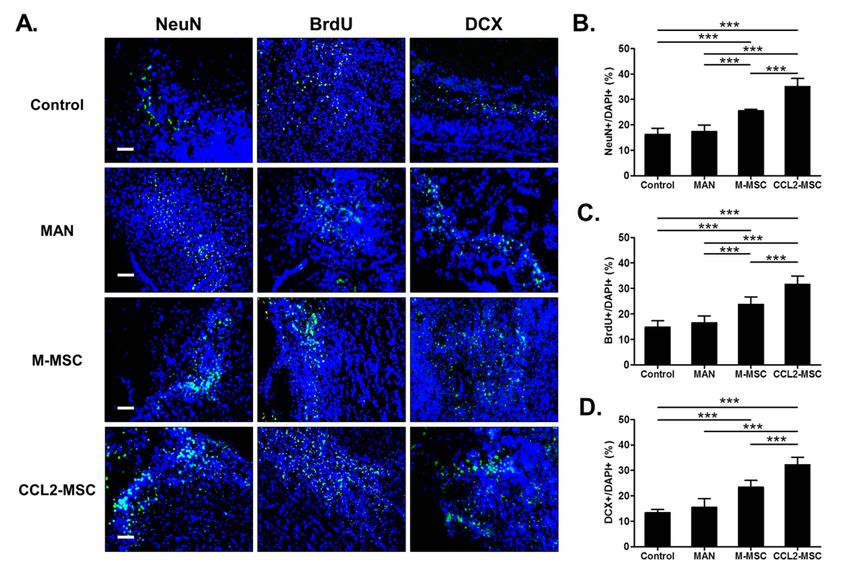
Int. J. Mol. Sci. 2020, 21, 7795 2 of 19
Moreover, to date, there remains no definitive treatment to regenerate damaged brain cells2 ofin19order to
Int. J. Mol. Sci. 2020, 21, x FOR PEER REVIEW
restore neurological deficits following stroke.
small proportion
Recently, stem celloftherapies
eligible patients.
using Furthermore,
different cellserious
types,neurological sequelae after stem
such as mesenchymal using cells
r-tPA(MSCs),
remain in many cases. Moreover, to date, there remains no definitive
bone marrow mononuclear cells, and neural stem cells, have emerged as a promising regenerative treatment to regenerate
damaged brain cells in order to restore neurological deficits following stroke.
treatment for stroke survivors with residual deficits [3–5]. Among these, MSCs as adult stem cell
Recently, stem cell therapies using different cell types, such as mesenchymal stem cells (MSCs),
haves been extensively
bone marrow investigated
mononuclear experimentally
cells, and neural stem cells, due
havetoemerged
their easy
as a isolation
promising and amplification,
regenerative
multipotent differentiation capacity, low immunogenicity, and their potential
treatment for stroke survivors with residual deficits [3–5]. Among these, MSCs as adult stem cell for paracrine and
immunomodulatory
haves been extensivelyfunctions [6,7]. Theexperimentally
investigated effectiveness of dueMSC-based treatment
to their easy in stroke
isolation and animal models
amplification,
has beenmultipotent
demonstrated differentiation capacity, low
[5,8]; however, immunogenicity,
their and their
efficacy in clinical potential
trials for paracrine
involving stroke andpatients is
immunomodulatory functions [6,7]. The effectiveness of MSC-based treatment in stroke animal
controversial [9]. To address this limitation, genetically engineered MSCs for functional augmentation
models has been demonstrated [5,8]; however, their efficacy in clinical trials involving stroke patients
of various factors, such as brain-derived neurotrophic factor or glial-derived neurotrophic factor, have
is controversial [9]. To address this limitation, genetically engineered MSCs for functional
been investigated
augmentation [6,7,10].
of various factors, such as brain-derived neurotrophic factor or glial-derived
Chemokines (chemoattractant
neurotrophic factor, have been investigated cytokines) are a superfamily of structurally related pro-inflammatory
[6,7,10].
peptides that Chemokines (chemoattractant
mediate cell-specific, cytokines)
directed are a of
migration superfamily
leukocytes of into
structurally
sites of related pro-
inflammation [10].
inflammatory
C–C motif chemokine peptides
ligand that2 mediate
(CCL2) cell-specific,
belongs todirected
the C–C migration
chemokineof leukocytes
family, into
and sites of
its effects are
inflammation [10]. C–C motif chemokine ligand 2 (CCL2) belongs to the C–C chemokine family, and
mediated through C–C motif receptor 2 (CCR2). A recent report indicated that CCL2 is associated
its effects are mediated through C–C motif receptor 2 (CCR2). A recent report indicated that CCL2 is
with neurological
associated with repair after stroke
neurological repairand
afterdelivery
stroke and of delivery
variousofcells intocells
various theinto
brain
the via CCL2/CCR2
brain via
interaction [11,12]. Therefore, in the present study, we evaluated the potential
CCL2/CCR2 interaction [11,12]. Therefore, in the present study, we evaluated the potential therapeutic effect and
safety oftherapeutic
CCL2-overexpressing
effect and safetyMSCs in a highly relevant
of CCL2-overexpressing MSCsanimal stroke
in a highly model.
relevant animal stroke model.
2. Results
2. Results
2.1. Confirmation
2.1. Confirmation of CCL2
of CCL2 Overexpression
Overexpression ininHuman
Human Umbilical
Umbilical Cord-Derived
Cord-DerivedMesenchymal Stem Cell
Mesenchymal Stem Cell
(hUC-MSCs)
(hUC-MSCs)
To confirm transfection of the CCL2-overexpression plasmid into MSCs, we verified GFP
To confirm transfection of the CCL2-overexpression plasmid into MSCs, we verified GFP expression
expression by fluorescence microscopy (Figure 1A) and upregulated CCL2 mRNA levels relative to
by fluorescence microscopy
controls (by ~1352-fold; (Figure 1A)(Figure
p < 0.002) and upregulated CCL2
1B). Additionally, mRNA
western levels
blot relative
analysis to controls
indicated
(by ~1352-fold; p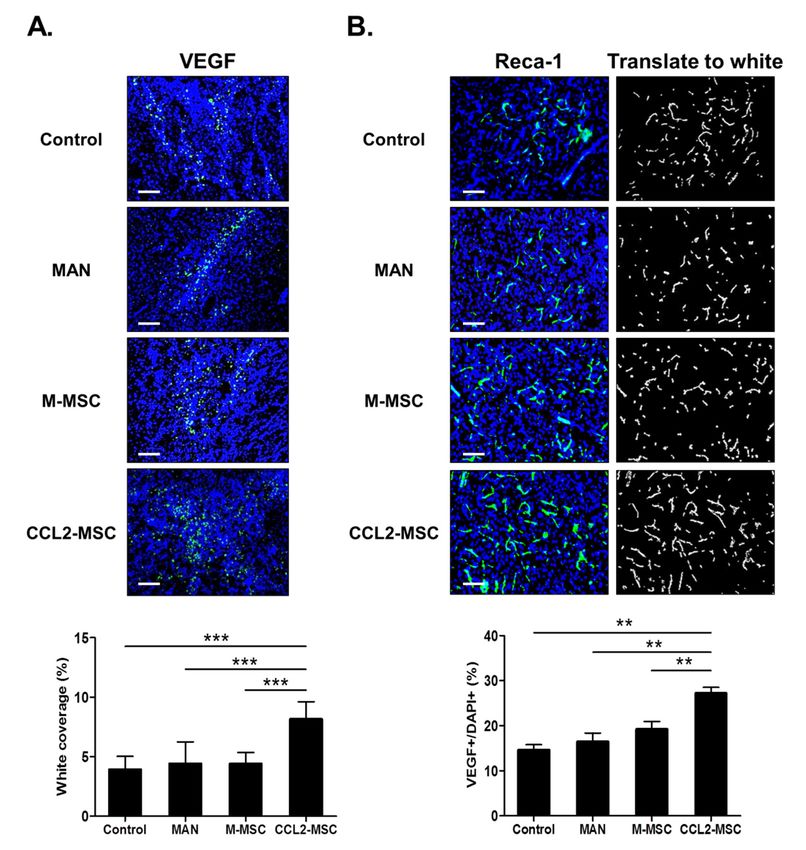
Figure 1. Confirmation of CCL2 overexpression following transfection into hUC-MSCs. (A) At 24-h
      post-transfection, hUC-MSCs observed in the bright field expressed GFP by fluorescence microscopy,
      and (B) RT-PCR results indicated CCL2 mRNA levels. Data represent fold changes relative to GAPDH
      and are presented as the mean ± SEM. ** p < 0.01, Student’s t test. (C) Western blot analysis showing
 Int. CCL2
      J. Mol. Sci.        21, 7795
                   2020, levels
              protein            at 24-h post-transfection. CCL2-specific bands were quantified and normalized 3 of 19
      against those of β-actin. Scale bar = 100 µm.

  2.2. Improvement of Functional Deficits in Middle Cerebral Artery Occlusion (MCAo) Model Rats after
2.2. Improvement of Functional Deficits in Middle Cerebral Artery Occlusion (MCAo) Model Rats after
  Transplantation of CCL2-Overexpressing hUC-MSCs
Transplantation of CCL2-Overexpressing hUC-MSCs
        To investigate the therapeutic efficacy of CCL2-overexpressing hUC-MSCs, we performed
      To investigate the therapeutic efficacy of CCL2-overexpressing hUC-MSCs, we performed
  behavioral testing of each treatment group seven times during the 28-day study period. The results
behavioral testing of each treatment group seven times during the 28-day study period. The results
  of the modified neurological severity score (mNSS) test revealed that the MAN group showed no
of the modified neurological severity score (mNSS) test revealed that the MAN group showed no
  significant behavioral changes relative to the control group, whereas the M-MSC group showed
significant behavioral changes relative to the control group, whereas the M-MSC group showed slight
  slight functional improvement in all three behavioral tests (p > 0.05). However, compared with the
functional improvement in all three behavioral tests (p > 0.05). However, compared with the other
  other groups, the CCL2-MSC group showed significant functional improvement starting from 1-day
groups, the CCL2-MSC group showed significant functional improvement starting from 1-day post-
  post-transplantation that remained robust after the second transplant and was sustained to the last day
transplantation that remained robust after the second transplant and was sustained to the last day of
  of the test (p < 0.01) (Figure 2A). Similarly, in the stepping test, the CCL2-MSC group showed gradual
the test (p < 0.01) (Figure 2A). Similarly, in the stepping test, the CCL2-MSC group showed gradual
  improvement of forelimb dysfunction from one-day post-transplantation relative to the other groups,
improvement of forelimb dysfunction from one-day post-transplantation relative to the other groups,
  with this recovery maintained for up to 28 days (p < 0.01) (Figure 2B). Moreover, for the foot-fault test,
with this recovery maintained for up to 28 days (p < 0.01) (Figure 2B). Moreover, for the foot-fault
  the CCL2-MSC group showed significantly reduced step errors from 7- to 21-days post-transplantation
test, the CCL2-MSC group showed significantly reduced step errors from 7- to 21-days post-
  relative to the other groups (p < 0.05) (Figure 2C).
transplantation relative to the other groups (p < 0.05) (Figure 2C).

       Figure 2. Evaluation of hUC-MSC transplantation according to behavioral testing. Changes in (A)
     Figure 2. Evaluation of hUC-MSC transplantation according to behavioral testing. Changes in (A)
       mNSS, (B) stepping, and (C) foot-fault results for each group for up to 28 days after MCAo induction.
     mNSS, (B) stepping, and (C) foot-fault results for each group for up to 28 days after MCAo induction.
       Data represent the mean ± SEM and were analyzed by one-way ANOVA. * p < 0.05, ** p < 0.01,
     Data represent the mean ± SEM and were analyzed by one-way ANOVA. * p < 0.05, ** p < 0.01, *** p <
       *** p < 0.001, control vs. CCL2-MSC; # p < 0.05, ## p < 0.01, ### p < 0.001, MAN vs. CCL2-MSC;
     0.001, control vs. CCL2-MSC; # p < 0.05, ## p < 0.01, ### p < 0.001, MAN vs. CCL2-MSC; & p < 0.05, &&
       & p < 0.05, && p < 0.01, &&& p < 0.001, M-MSC vs. CCL2-MSC.
     p < 0.01, &&& p < 0.001, M-MSC vs. CCL2-MSC.
 2.3. Reduced Infarct Size Following Transplantation of CCL2-Overexpressing hUC-MSCs
      At 28 days after MCAo induction, we observed no significant change in the infarct size between
 the control and MAN groups but a significant decrease in infarct size in the M-MSC (control vs.
 M-MSC: 31.47% ± 0.62 vs. 26.67 ± 1.00; p < 0.001) and CCL2-MSC groups (control vs. CCL2-MSC:
 31.47% ± 0.62 vs. 23.48 ± 1.55; p < 0.001) according to TTC staining (Figure 3A). Additionally, Cresyl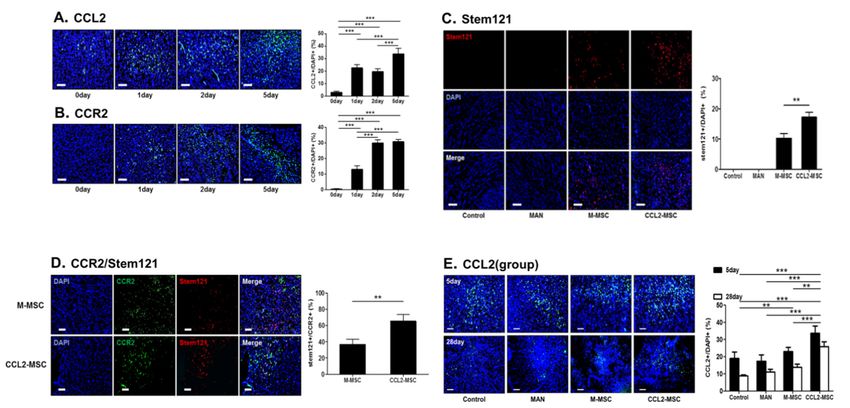
2.3. Reduced Infarct Size Following Transplantation of CCL2-Overexpressing hUC-MSCs
         At 28 days after MCAo induction, we observed no significant change in the infarct size between
  the control and MAN groups but a significant decrease in infarct size in the M-MSC (control vs. M-
Int. J. Mol.31.47%
  MSC:       Sci. 2020,
                     ± 21, 7795
                        0.62                                                                         4 of 19
                             vs. 26.67 ± 1.00; p < 0.001) and CCL2-MSC groups (control vs. CCL2-MSC: 31.47%
  ± 0.62 vs. 23.48 ± 1.55; p < 0.001) according to TTC staining (Figure 3A). Additionally, Cresyl Violet
  staining revealed similar results, with no significant difference in infarct size between control and
Violet staining revealed similar results, with no significant difference in infarct size between control
  MAN groups but significantly reduced sizes in the M-MSC (control vs. M-MSC: 23.3% ± 3.75 vs. 19.59
and MAN groups but significantly reduced sizes in the M-MSC (control vs. M-MSC: 23.3% ± 3.75 vs.
  ± 1.36; p < 0.05) and CCL2-MSC groups (control vs. CCL2-MSC: 23.30% ± 3.75 vs. 15.80 ± 1.53; p <
19.59 ± 1.36; p < 0.05) and CCL2-MSC groups (control vs. CCL2-MSC: 23.30% ± 3.75 vs. 15.80 ± 1.53;
  0.001) (Figure 3B). Furthermore, both TTC (M-MSC vs. CCL2-MSC: 26.67% ± 1.00 vs. 23.48 ± 1.55; p =
p < 0.001) (Figure 3B). Furthermore, both TTC (M-MSC vs. CCL2-MSC: 26.67% ± 1.00 vs. 23.48 ± 1.55;
  0.004) and Cresyl Violet (M-MSC vs. CCL2-MSC: 19.59% ± 1.36 vs. 15.80 ± 1.53, p < 0.05) staining
p = 0.004) and Cresyl Violet (M-MSC vs. CCL2-MSC: 19.59% ± 1.36 vs. 15.80 ± 1.53, p < 0.05) staining
  showed that the CCL2-MSC group exhibited more significant reductions in infarct size relative to the
showed that the CCL2-MSC group exhibited more significant reductions in infarct size relative to the
  M-MSC group.
M-MSC group.

     Figure 3. Comparison of infarct size between treatment groups. Infarct size was measured by (A) TTC
      Figure 3. Comparison of infarct size between treatment groups. Infarct size was measured by (A) TTC
     and (B) Cresyl Violet staining at 4 weeks after MCAo induction. Data represent the mean ± SEM and
      and (B) Cresyl Violet staining at 4 weeks after MCAo induction. Data represent the mean ± SEM and
     were analyzed by one-way ANOVA. * p < 0.05, ** p < 0.01, *** p < 0.001.
      were analyzed by one-way ANOVA. * p < 0.05, ** p < 0.01, *** p < 0.001.
2.4. CCL2 and CCR2 Levels are Elevated in the Brain During the Acute Ischemic Phase
  2.4. CCL2 and CCR2 Levels are Elevated in the Brain During the Acute Ischemic Phase
       We found that CCL2 levels were significantly increased 1, 2, and 5 days after MCAo induction
relative Weto found   that
              levels in     CCL2rats
                         control    levels  were
                                       before  MCAosignificantly
                                                        inductionincreased
                                                                   (0 day vs.1,1 2,  and3.12
                                                                                  day:    5 days   aftervs.
                                                                                              ± 0.82%     MCAo
                                                                                                             22.54 induction
                                                                                                                   ± 2.44%,
  relative   to levels  in control  rats before  MCAo     induction   (0 day  vs. 1  day: 3.12
p < 0.001; 0 day vs. 2 day: 3.12 ± 0.82% vs. 19.67 ± 2.13%, p < 0.001; 0 day vs. 5 day; 3.12    ± 0.82%   vs. 22.54±±0.82%
                                                                                                                       2.44%,
  p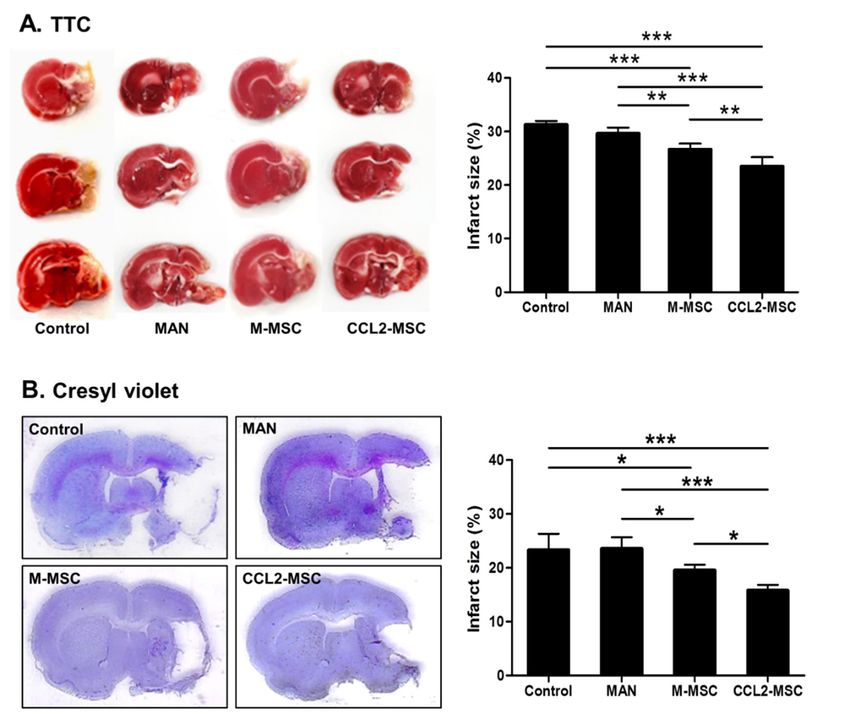
Int. J. Mol. Sci. 2020, 21, x FOR PEER REVIEW                                                                             5 of 19

 speculated
Int. J. Mol. Sci. that
                  2020,increased
                        21, 7795 CCR2 levels in the brain following stroke might promote translocation of5 of 19
 CCL2-overexpressing hUC-MSCs to the brain parenchyma.

       Figure 4.
      Figure    4. Changes
                    ChangesininCCL2  CCL2andandCCR2
                                                  CCR2levels   in in
                                                          levels   thethe
                                                                        brain
                                                                           brainduring
                                                                                   duringthe the
                                                                                              acute    stroke
                                                                                                   acute        phase
                                                                                                            stroke      and and
                                                                                                                    phase
       correlations between
      correlations      betweenMSC  MSC    migration
                                       migration        and levels
                                                   and CCR2    CCR2 following
                                                                        levels following        transplantation.
                                                                                   transplantation.                   (A,B)
                                                                                                        (A,B) Representative
       Representative immunostaining
      immunostaining        images showing   images  showing
                                               changes         changes
                                                          in CCL2    andin  CCL2levels
                                                                          CCR2      and CCR2
                                                                                          on dayslevels
                                                                                                      1, 2onand
                                                                                                             days  1, 2 and
                                                                                                                 5 after MCAo
       5 after MCAo
      induction          induction before
                   as compared       as compared    beforeThe
                                            induction.      induction.  The graph
                                                               graph shows            shows the
                                                                                the number       ofnumber
                                                                                                    CCL2+of    orCCL2+
                                                                                                                  CCR2+   orcells
       CCR2+
      in each cells
                group.in each
                           Datagroup.
                                 were Data   were analyzed
                                        analyzed   by one-way by one-way
                                                                  ANOVAANOVA  test. (C)test.
                                                                                         The (C)CCL2-MSC
                                                                                                  The CCL2-MSC  groupgroup
                                                                                                                        showed
       showed enhanced
      enhanced               engraftment
                   engraftment     into the into  the peri-infarct
                                             peri-infarct           area relative
                                                           area relative            to the M-MSC
                                                                          to the M-MSC       group. group.
                                                                                                       The graphThe shows
                                                                                                                     graph the
      number of Stem121+ cells in the peri-infarct area in each group. Data were analyzed usingusing
       shows   the number    of  Stem121+  cells in the peri-infarct area  in each   group.  Data  were    analyzed    a paired
       a paired Student’s
      Student’s   t test. (D)t Co-immunostaining
                                test. (D) Co-immunostaining
                                                       images of images
                                                                   CCR2+  of and
                                                                             CCR2+     and Stem121+
                                                                                  Stem121+      cells in cells in the peri- area
                                                                                                          the peri-infarct
       infarct area in each group on 5 day after MCAo induction. The graph shows the number of
      in each group on 5 day after MCAo induction. The graph shows the number of Stem121+/CCR2+ cells
       Stem121+/CCR2+ cells in each group. Data were analyzed using a paired Student’s t test. (E)
      in each group. Data were analyzed using a paired Student’s t test. (E) Representative immunostaining
       Representative immunostaining images showing changes in CCL2 levels at 5 and 28 days after MCAo
      images showing changes in CCL2 levels at 5 and 28 days after MCAo induction between treatment
       induction between treatment groups. The graphs show the number of CCL2+ cells in each group. Data
      groups. The graphs show the number of CCL2+ cells in each group. Data represent the mean ± SEM
       represent the mean ± SEM and were analyzed by one-way ANOVA. ** p < 0.01, *** p < 0.001. Scale bar
      and were analyzed by one-way ANOVA. ** p < 0.01, *** p < 0.001. Scale bar = 100 µm.
       = 100 µm.
2.5. Increased Engraftment of CCL2-Overexpressing hUC-MSCs in Areas of Upregulated CCR2 Levels in the
 2.5. Increased
Ischemic   BrainEngraftment of CCL2-Overexpressing hUC-MSCs in Areas of Upregulated CCR2 Levels in
 the Ischemic Brain
      To investigate the increased engraftment of IV-administrated CCL2-overexpressing MSCs in the
brain,Toweinvestigate   the increased
            immunostained               engraftment
                                 for Stem121,            of IV-administrated
                                                  a marker     of human neural  CCL2-overexpressing
                                                                                    stem cells, 1 day afterMSCsthein the
                                                                                                                     second
 brain,  we  immunostained      for  Stem121,   a  marker    of human    neural  stem   cells, 1 day
transplantation (Figure 4C). The results indicated the presence of Stem121+ cells in both the M-MSC   after the  second
 transplantation (Figure 4C). The results indicated the presence of Stem121+ cells in both the M-MSC
and CCL2-MSC groups, whereas Stem121+ cell was not observed the in control and MAN groups.
 and CCL2-MSC groups, whereas Stem121+ cell was not observed the in control and MAN groups.
This suggested that IV-transplanted mannitol-treated hUC-MSCs entered the brain parenchyma across
 This suggested that IV-transplanted mannitol-treated hUC-MSCs entered the brain parenchyma
the BBB. Interestingly, the number of invaded Stem121+ cells was significantly higher in the CCL2-MSC
 across the BBB. Interestingly, the number of invaded Stem121+ cells was significantly higher in the
group relative to that in the M-MSC group (M-MSC vs. CCL2-MSC: 10.39% ± 1.48 vs. 15.8 ± 2.14;
 CCL2-MSC group relative to that in the M-MSC group (M-MSC vs. CCL2-MSC: 10.39% ± 1.48 vs. 15.8
p±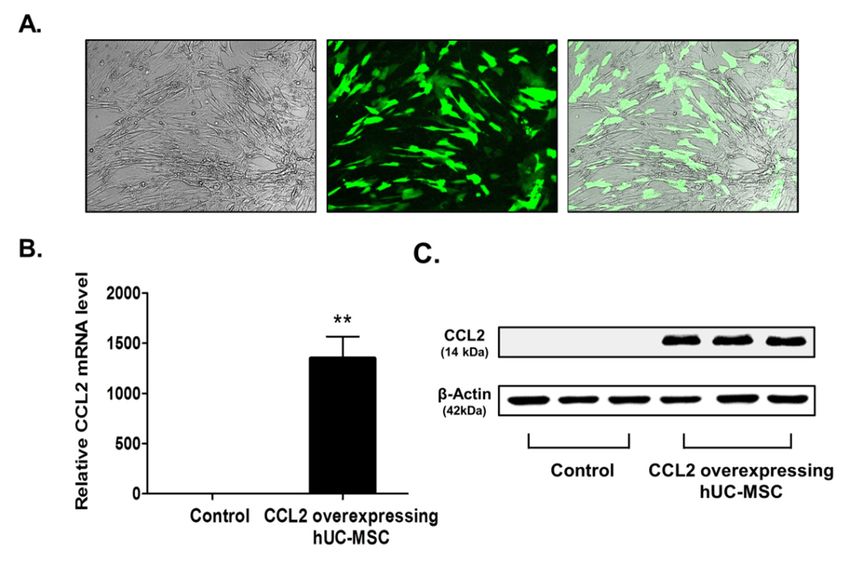
Int. J. Mol. Sci. 2020, 21, 7795                                                                  6 of 19

2.6. CCL2 Expression is Sustained in the Brain Following CCL2-Overexpressing hUC-MSC Transplantation
     To evaluate changes in CCL2-expression level according to treatment group, we performed
repeated CCL2 immunostaining at five days and four weeks after MCAo induction. The results
revealed that CCL2 expression on day 5 was significantly increased in the CCL2-MSC group relative
to that in the other groups (control vs. CCL2-MSC: 18.95 ± 3.75% vs. 33.61 ± 4.21%, p < 0.001;
MAN vs. CCL2-MSC: 17.33 ± 3.63% vs. 33.61 ± 4.21%, p < 0.001; and M-MSC vs. CCL2-MSC:
22.93 ± 2.47% vs. 33.61 ± 4.21%, p = 0.003) (Figure 4E). Moreover, these differences between groups
were sustained until week 4, at which time CCL2 levels remained elevated in the CCL2-MSC group
relative to the other groups (control vs. M-MSC: 8.79 ± 0.63% vs. 13.80 ± 1.87%, p < 0.01; control
vs. CCL2-MSC: 8.79 ± 0.63% vs. 25.79 ± 2.82%, p < 0.001; MAN vs. CCL2-MSC: 11.05 ± 1.60% vs.
25.79 ± 2.82%, p < 0.001; and M-MSC vs. CCL2-MSC: 13.80 ± 1.87% vs. 25.79 ± 2.82%, p < 0.001)
(Figure 4E). These results suggested that the increased CCL2 expression following transplantation of
CCL2-overexpressing hUC-MSCs was sustained and might affect endogenous brain repair.

2.7. Transplantation of CCL2-Overexpressing hUC-MSCs Increases Angiogenesis in the Peri-Infarct Area
     Human MSCs promote endogenous brain repair by enhancing angiogenesis in the peri-infarct area
following stroke. To evaluate the degree of angiogenesis after transplantation of CCL2-overexpressing
hUC-MSCs following brain ischemia, we immunostained for VEGF and RECA-1 to evaluate
angiogenesis and microvessel density in the peri-infarct area, respectively. The results indicated
a significantly higher number of VEGF+ cells in the M-MSC and CCL2-MSC groups relative to the
control group, with the highest number of VEGF+ cells observed in the CCL2-MSC group (control:
15.16 ± 1.13%, MAN: 16.45 ± 1.74%, M-MSC: 19.21 ± 1.55%, and CCL2-MSC: 27.19 ± 1.19%; CCL2-MSC
vs. other groups: p < 0.001) (Figure 5A). Moreover, RECA-1 immunostaining revealed a significantly
higher vessel-coverage area in the CCL2-MSC group relative to then other groups (control: 3.92 ± 1.00%,
MAN: 4.42 ± 1.63%, M-MSC: 4.41 ± 0.85%, and CCL2-MSC: 8.15 ± 1.31%; CCL2-MSC vs. control, MAN,
and M-MSC: p = 0.001, p = 0.003, and p = 0.003, respectively) (Figure 5B). These findings suggested
that CCL2-overexpressing hUC-MSCs enhanced peri-infarct angiogenesis following stroke.

2.8. Transplantation of CCL2-Overexpressing hUC-MSCs Increases Endogenous Neurogenesis in the
Peri-Infarct Area
     To evaluate endogenous neurogenesis in the peri-infarct area, we performed immunostaining
for NeuN, BrdU, and DCX. The results showed that the M-MSC and CCL2-MSC groups exhibited
significantly higher numbers of NeuN+ cells (control, 16.25 ± 2.20%; MAN, 17.32 ± 2.32% vs. M-MSC,
25.46 ± 0.62% vs. CCL2-MSC, 34.99 ± 2.90%; p < 0.001) (Figure 6B), BrdU+ cells (control, 14.77 ± 1.80%;
MAN, 16.47 ± 1.21% vs. M-MSC, 23.69 ± 2.04%, vs. CCL2-MSC, 31.17 ± 2.92; p < 0.001) (Figure 6C)
relative to the MAN and control groups. Additionally, the number of DCX+ cells was higher in
the M-MSC and CCL2-MSC groups relative to the control group (control, 13.3 ± 1.20% vs. M-MSC,
23.34 ± 2.45 vs. CCL2-MSC, 32.45 ± 2.73; p < 0.001) (Figure 6D). All immunostaining results indicated
that the CCL2-MSC groups showed a significantly higher number of positive cells relative to the
M-MSC group (p < 0.001). These findings suggested that CCL2-overexpressing hUC-MSCs enhanced
endogenous neurogenesis in the peri-infarct area following stroke.
Int. J. Mol. Sci. 2020, 21, 7795                                                                          7 of 19
 Int. J. Mol. Sci. 2020, 21, x FOR PEER REVIEW                                                            7 of 19

     Figure 5. Changes in angiogenesis in the peri-infarct area following hUC-MSC transplantation.
      Figure 5. Changes in angiogenesis in the peri-infarct area following hUC-MSC transplantation.
     Immunostaining analyses were performed 28 days after MCAo induction. (A) Representative
      Immunostaining analyses were performed 28 days after MCAo induction. (A) Representative
     immunostaining images showing VEGF+ cells in each group. The graph shows the number of VEGF+
      immunostaining images showing VEGF+ cells in each group. The graph shows the number of VEGF+
     cells in each group. (B) Representative immunostaining image showing RECA-1+ vessels in each group.
      cells in each group. (B) Representative immunostaining image showing RECA-1+ vessels in each
     The graph shows vessel density in the peri-infarct area in each group. Data represent the mean ± SEM
      group. The graph shows vessel density in the peri-infarct area in each group. Data represent the mean
     (n = 5/group) and were analyzed by one-way ANOVA. ** p < 0.01, *** p < 0.001. Scale bar = 100 µm.
      ± SEM (n = 5/group) and were analyzed by one-way ANOVA. ** p < 0.01, *** p < 0.001. Scale bar = 100
      µm.

2.8. Transplantation of CCL2-Overexpressing hUC-MSCs Increases Endogenous Neurogenesis in the Peri-
Infarct Area
     To evaluate endogenous neurogenesis in the peri-infarct area, we performed immunostaining
for NeuN, BrdU, and DCX. The results showed that the M-MSC and CCL2-MSC groups exhibited
significantly higher numbers of NeuN+ cells (control, 16.25 ± 2.20%; MAN, 17.32 ± 2.32% vs. M-MSC,
25.46 ± 0.62% vs. CCL2-MSC, 34.99 ± 2.90%; p < 0.001) (Figure 6B), BrdU+ cells (control, 14.77 ± 1.80%;
MAN, 16.47 ± 1.21% vs. M-MSC, 23.69 ± 2.04%, vs. CCL2-MSC, 31.17 ± 2.92; p < 0.001) (Figure 6C)
relative to the MAN and control groups. Additionally, the number of DCX+ cells was higher in the
M-MSC and CCL2-MSC groups relative to the control group (control, 13.3 ± 1.20% vs. M-MSC, 23.34
± 2.45 vs. CCL2-MSC, 32.45 ± 2.73; p < 0.001) (Figure 6D). All immunostaining results indicated that
the CCL2-MSC groups showed a significantly higher number of positive cells relative to the M-MSC
Int. J. Mol. Sci. 2020, 21, x FOR PEER REVIEW                                                                      8 of 19

 group
Int. J. Mol. (p
              Sci.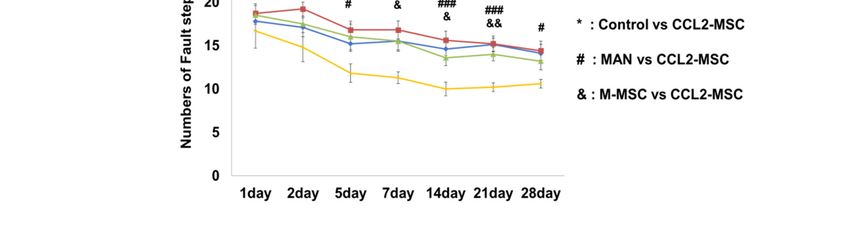
Int. J. Mol. Sci. 2020, 21, 7795                                                                                               9 of 19
Int. J. Mol. Sci. 2020, 21, x FOR PEER REVIEW                                                                                  9 of 19

                      Changesinininflammation
      Figure7.7.Changes
     Figure                           inflammationininthe  theperi-infarct
                                                                peri-infarctarea
                                                                               areafollowing
                                                                                     followinghUC-MSC
                                                                                                  hUC-MSCtransplantation.
                                                                                                                transplantation.
      Immunostaining analyses
     Immunostaining          analyses were
                                         wereperformed
                                                performed2828   days  after
                                                                   days     MCAo
                                                                          after     induction.
                                                                                 MCAo             (A) Images
                                                                                          induction.            showing
                                                                                                        (A) Images        GFAP+
                                                                                                                       showing
     GFAP+ cells in the peri-infarct area. The graph shows the density of GFAP+ cells per area in group.
      cells  in  the   peri-infarct    area.  The  graph   shows    the  density  of  GFAP+     cells per   area  in each   each
      (B) Representative
     group.                     immunostaining
               (B) Representative                    images
                                        immunostaining         showing
                                                             images        Iba-1+Iba-1+
                                                                      showing      cells in thein
                                                                                          cells  peri-infarct   area. The
                                                                                                   the peri-infarct   area.graph
                                                                                                                             The
      shows
     graph      Iba-1+
             shows         cellscells
                       Iba-1+    per per
                                       areaarea
                                             in each
                                                in eachgroup.
                                                         group.(C)(C)Representative
                                                                       Representative immunostaining
                                                                                         immunostaining images imagesshowing
                                                                                                                        showing
      ED-1+cells
     ED-1+      cellsin in
                         thethe  peri-infarct
                             peri-infarct       area.
                                             area. The The
                                                        graph graph
                                                                shows shows    the number
                                                                         the number    of ED1+ of cells
                                                                                                   ED1+ in cells
                                                                                                            each in  each (D,
                                                                                                                  group.   group.
                                                                                                                              E)
      (D,E)   Immunostaining         images    showing   iNOS+     cells and  CD206+     cells in the peri-infarct
     Immunostaining images showing iNOS+ cells and CD206+ cells in the peri-infarct area in each group.              area in each
      group.
     Each   graphEach     graphthe
                       shows      shows    the iNOS+:ED1+
                                      iNOS+:ED1+      cell ratiocell
                                                                   andratio  and CD206+:ED-1+
                                                                         CD206+:ED-1+      cell ratiocell
                                                                                                        in ratio
                                                                                                            each in  each group.
                                                                                                                   group.  Data
     represent the mean ± SEM and were analyzed by one-way ANOVA. * p < 0.05, ** p < 0.01, *****p p< 0.001.
      Data    represent     the  mean    ±  SEM    and  were   analyzed     by  one-way    ANOVA.       * p  < 0.05,       < 0.01,
            < 0.001.
      *** p bar
     Scale               Scale bar = 20 µm.
                  = 20 µm.
Int. J. Mol. Sci. 2020, 21, 7795 10 of 19
A previous study reported that in the micro-adherent cell/macrophage phenotype around the
infarct area, the M1 macrophage phenotype induces post-ischemic inflammation, whereas the M2
phenotype exhibits neuroprotective effects [14], suggesting that inducing M2 and reducing M1
polarization following ischemic brain injury might promote brain recovery. To confirm changes in the
these phenotypes, we stained for iNOS (an M1 marker) and CD206 (an M2 marker) among ED1(CD68)+
cells. First, the results confirmed no changes in the proportion of ED1+ cells around the infarct area
in the control and MAN groups (Figure 7C), whereas the M-MSC and CCL2-MSC groups showed a
significant decrease in the percentage of ED1+ cells relative to the control and MAN groups (control,
36.10 ± 4.10%; MAN, 36.77 ± 4.40%; M-MSC, 26.90 ± 1.63%; CCL2-MSC, 16.38 ± 3.02%; control vs.
M-MSC: p = 0.008; control vs. CCL2-MSC: p < 0.001; MAN vs. M-MSC: p = 0.005; and MAN vs.
CCL2-MSC: p < 0.001). Specifically, the CCL2-MSC group showed a significant reduction in ED1+
cells as compared with the M-MSC group (M-MSC vs. CCL2-MSC: 26.90 ± 1.63% vs. 16.38 ± 3.02%;
p = 0.003). Additionally, the proportion of iNOS+ cells among ED1+ cells around the infarct area in the
MAN group did not changed relative to that in the control group (control: 65.35 ± 5.09%; and MAN:
64.25 ± 8.18%) (Figure 7D); however, in the MSC groups, the iNOS+:ED1+ ratio slightly decreased
relative to the control group, with the CCL2-MSC group showing a more significant reduction in this
ratio than the M-MSC group (M-MSC, 52.90 ± 2.4%; CCL2-MSC, 37.93 ± 1.14%; control vs. M-MSC:
p < 0.05; control vs. CCL2-MSC: p < 0.001; and M-MSC vs. CCL2-MSC: p < 0.02) (Figure 7D).
Furthermore, the proportion of CD206+ cells among ED1+ cells around the infarct area in the MAN
group was similar to that in the control group (control: 50.40 ± 5.21%; and MAN: 50.99 ± 1.43%)
(Figure 7E), whereas in the MSC groups, the CD206+:ED1+ ratio increased significantly relative to
that in the control group, with the CCL2-MSC group showing a more significant increase than that
in the M-MSC group (M-MSC vs. CCL2-MSC: 61.07 ± 2.63 vs. 79.58 ± 4.38; p < 0.001) (Figure 7E).
These results demonstrated that CCL2-overexpressing hUC-MSCs promoted the repair of damaged
brain tissue by regulating the inflammatory environment in the infarct area.
3. Discussion
These results demonstrated that CCL2-overexpressing hUC-MSCs significantly improved
functional recovery and decreased infarct volume relative to naïve hUC-MSCs in an animal stroke model.
We observed increased stem cell engraftment by CCL2-overexpressing hUC-MSCs as compared with
naïve hUC-MSCs and found that elevated CCR2 levels in the peri-infarction area during acute phase
of stroke promoted the migration of CCL2-overexpressing hUC-MSCs into the brain. Additionally,
we observed sustained elevations in CCL2 levels during the acute ischemic phase for up to 4 weeks
post-induction following transplantation of CCL2-overexpressing hUC-MSCs, as well as increased
angiogenesis, neurogenesis, and decreased neuro-inflammation.
Although the M-MSC group showed significant changes in stroke volume and marker levels for
various immunohistochemical analyses relative to the control and MAN groups, we did not observed
significant differences in behavioral-test outcomes between the three groups. Previous preclinical
studies reported that naïve human MSCs of various origins induce functional recovery following
stroke [5,8]. In the present study, we did not observed this, possibly attributable to limited engraftment
following IV transplantation of stem cells. IV-transplanted human MSCs are trapped in the lung,
liver, and spleen, resulting in low proportions of cells reaching brain parenchyma [15,16]. Therefore,
the previous studies described the therapeutic mechanism of IV-transplanted human MSCs as being
induced through the bystander effect of remote, trapped MSCs secreting cytokines and trophic factors
in extra-brain organs [15].
CCL2 is a pro-inflammatory chemokine that plays an important role in inflammatory reactions
under various neurological conditions, such as stroke, Alzheimer’s disease, and multiple sclerosis [17].
CCL2 is constitutively present in the normal brain and within neurons, astrocytes, and endothelial cells;
however, it is upregulated during a stroke [17–19]. Increases in CCL2 level induce the recruitment of
various inflammatory cells to the brain and disruption of the BBB after stroke [10,20]. This migrationInt. J. Mol. Sci. 2020, 21, 7795 11 of 19
of inflammatory cells is promoted by CCL2/CCR2 interactions, which induces translocation of
CCR2-expressing inflammatory cells into infarct areas already experiencing increased CCL2 expression
following a stroke. Previously studies suggest that increased CCL2 levels in stroke exacerbate
neuro-inflammation and subsequent brain injury, thereby increasing stroke volume and resulting in
poor prognosis [21,22]. However, recent studies show that CCL2/CCR2 interaction positively affects
functional recovery from stroke [23,24], and other studies confirm that CCL2 promotes the homing of
CCR2-expressing stem cells from the bone marrow to the damaged brain, which contributes to brain
repair following stroke [20,25,26]. Additionally, this interaction promotes intravascular migration
of stem cells into the injury sites and is essential for the therapeutic homing of CCR2-expressing
stem cells [6,7,11,27–29]. Furthermore, studies indicate that CCR2 overexpression on MSCs [20]
or exosomes [26] following genetic modification enhances their targeted migration to the ischemic
hemisphere and improves therapeutic outcomes.
In addition to CCR2 presentation on inflammatory cells, such as monocytes/macrophages and
lymphocytes, it is also found in neurons and astrocytes [30], with reports showing increased CCR2
levels in the brain following ischemia [31] and heat stroke [32]. Therefore, we speculated that the
CCL2/CCR2 interaction might promote the migration of CCL2-overexpressing hUC-MSCs into areas
exhibiting elevated CCR2 levels. Our results confirmed that both CCR2 and CCL2 levels increased in
brain parenchyma during acute phase after stroke, and that CCL2-overexpressing hUC-MSCs more
effectively entered the brain parenchyma relative to naïve hUC-MSCs and distributed more densely
around areas of upregulated CCR2. This suggests that increased engraftment of CCL2-overexpressing
hUC-MSCs effectively induced cell-to-cell communication with host cells to promote the secretion
of cytokines and trophic factors to nearby damaged brain areas and neurovascular niche structures.
Our findings showed that the CCL2-MSC group underwent significant functional recovery and
displayed decreased stroke volume relative to the M-MSC group.
Previous studies using animal models of stroke report that MSCs increase angiogenesis and
neurogenesis [3,5,33]. In the present study, both MSC groups showed increased endogenous
angiogenesis (VEGF+ cells and RECA-1+ areas) and neurogenesis (NeuN+, BrdU+, and DCX+
cells); however, we found that these levels were enhances in the CCL2-MSC group relative to the
M-MSC group. It is possible that this is a consequence of the increased number of migrated stem cells
to the infarct area. A recent report indicated that CCL2 participates in mechanisms associated with
neurologic recovery [12]. In the present study, we found sustained elevations of CCL2 levels in the
brain at 28 days after stroke induction in the CCL2-MSC group as compared with levels in the other
groups. This suggests that this activity might promote increased functional recovery.
Previous studies reported that CCL2 is implicated in angiogenesis and promotes capillary-like
structure formation of human umbilical vein endothelial cells in vitro through the increased expression
of both VEGF and hypoxia-inducible factor 1-alpha, and through activation of the Ets-1 transcription
factor [34,35]. Additionally, secreted CCL2 mediates the angiogenic effect of tissue factors by recruiting
smooth muscle cells toward endothelial cells and facilitates the maturation of newly formed microvessels
in Matrigel plugs in vivo [34,36]. Moreover, the CCL2/CCR2 axis plays a critical biological role in
recovery of blood flow in a murine hindlimb ischemic model and might have a regulatory role in both
the migration of endothelial cells and maturation of neovascularization [34].
Several studies indicate that CCL2 has beneficial neuroprotective effects beyond its established
role in leukocyte recruitment and activation [12,30,37]. Previous in vitro studies showed that in mixed
cultures of human or mouse neurons and astrocytes, CCL2 provided neuroprotection against apoptotic
stimuli induced by N-methyl-D-aspartate (NMDA) and Tat protein. CCL2 treatment inhibits the
increase of toxic extracellular glutamate concentration induced by Tat or NMDA and regulates the
intracellular trafficking of Tat and NMDA receptor 1 expression [12,38]. Additionally, reports indicate
that norepinephrine and adenosine increase CCL2 levels, resulting in reductions of neuronal damage
attributable to NMDA or glutamate [12,39]. Furthermore, hypoxic preconditioning induces stroke
tolerance in mice via CCL2 signaling pathway [37,40].Int. J. Mol. Sci. 2020, 21, 7795 12 of 19
The exact role of CCL2 in normal brain function or neurodevelopment remains unclear; however,
studies suggest possible roles in adult neurogenesis and/or repair processes through the CCR2 on neural
progenitor cells [30]. It has been reported that CCL2 overproduced by activated astrocytes and microglia
in an MCAo model induced the migration of newly formed CCR2-expressing subventricular zone
neuroblasts from neurogenic regions to the damaged regions of brain following focal ischemia [12,41,42].
In the present study, continuous increases in CCL2 levels in the brain following transplantation of
CCL2-overexpressing hUC-MSCs might mediate the various steps of neurogenesis, such as neuronal
progenitor proliferation, neuroblast migration toward the injured area, and differentiation, maturation,
and integration of newly generated neurons [12,41,42].
Furthermore, in our study, the sustained increase in CCL2 levels in the brain following
transplantation of CCL2-overexpressing hUC-MSCs might induce further increases in the migration
of monocytes and macrophages, which are involved in neurological recovery after stroke.
Microglia/macrophages are the primary immune cells involved in defending against brain damage.
After a stroke, excessive activation by damage-related mechanisms can destroy nerve cells and the BBB,
thereby negatively affecting neuronal development. However, recent studies suggest that activated
microglia contribute to neural plasticity and neuro-restoration following insult [41]. In response to
various signals, microglia/macrophages polarize to two major phenotypes: pro-inflammatory (M1)
and anti-inflammatory (M2) [41,43]. Although the M1 population of microglia/macrophages mainly
exhibits destructive properties, the M2 population plays a protective role in nerves; therefore, regulating
macrophage polarization can be an important factor in improving stroke [14]. MSCs reportedly weaken
the M1 population and induce activation of M2 polarization [44,45]. In the present study, the results
showed that transplantation of CCL2-overexpressing hUC-MSCs decreased neuro-inflammation
accompanied by a decreased M1 population and increased M2 population relative to those in other
groups, especially naïve hUC-MSCs. Therefore, the sustained upregulation of CCL2 for up to 28 days
of the post-stroke delayed phase following CCL2-overexpressing hUC-MSCs transplantation might
contribute to neurological recovery via CCL2/CCR2-dependent microglia/macrophage status based
on the dominant pro-inflammatory phenotype observed in the acute phase versus the dominant
anti-inflammatory phenotype in delayed phase after stroke [24,46].
In conclusion, we demonstrated that CCL2-overexpressing hUC-MSCs effectively restored
functional deficits in an animal stroke model by promoting continuous increases in CCL2 levels in the
brain, enhancing angiogenesis and neurogenesis, and decreasing neuro-inflammation. This activity
was a result of the increased efficiency of hUC-MSC migration due to elevated CCR2 levels in the
infarcted areas of the brain, which promoted migration of the CCL2-overexpressing hUC-MSCs. These
findings suggest that genetically modified CCL2-overexpressing MSCs might represent an effective
strategy for cell therapy of clinical stroke.
4. Materials and Methods
4.1. Ethics
All experimental animals were manipulated in accordance with guidelines provided by the
Institutional Animal Care and Use Committee of CHA University (IACUC nos. 190088 (1 April 2019–1
April 2020) and 200062 (1 April 2020–1 April 2021).
4.2. Culture of hUC-MSCs
hUC-MSCs were provided from CHA Biotech (Seongnam, Korea). The detailed description
of preparation and characterization for hUC-MSCs were reported previously [47–49]. hUC-MSCs
were cultured in high-glucose minimum essential medium (MEM; Gibco, Gaithersburg, MD, USA)
supplemented with 10% fetal bovine serum (Gibco, Gaithersburg, MD, USA), 50 µg/mL gentamycin
(Sigma-Aldrich, St. Louis, MO, USA), 1 µg/mL heparin (Sigma-Aldrich, St. Louis, MO, USA) andInt. J. Mol. Sci. 2020, 21, 7795 13 of 19
25 ng/mL fibroblast growth factor-4 (Peprotech, Rocky Hill, NJ, USA). We used cells at passage eight or
nine for the experiments.
4.3. Manufacturing of CCL2-Overexpressing hUC-MSCs
The pUCIDT-kan plasmid (2705bp) harboring CCL2 was purchased from Cosmo Genetech (Seoul,
Korea). The plasmid also harbored green fluorescent protein (GFP), which allowed confirmation of
transfection and CCL2 expression. The CCL2 plasmid was amplified in Escherichia coli DH5α cells
and purified using a NucleoBond Xtra Midi Plus kit (Macherey-Nagel, Düren, Germany) according to
manufacturer instructions. hUC-MSCs (2 × 10⁶ ) were plated in T-75 flasks, and after a 24-h incubation
at 37 ◦ C in a CO2 incubator, Lipofectamine–stem-cell-mediated transfection was performed using
reagents supplied by Invitrogen (Carlsbad, CA, USA) and according to their instructions. Prior to
transfection, the cells were washed twice with phosphate-buffered saline, and the culture medium
was changed to serum-free α-MEM. The first dilution of CCL2 plasmids was performed in 12-mL
microtubes with 725 µL Opti-MEM (Cat. No. 31985; Gibco, Gaithersburg, MD, USA). In a separate
tube, Lipofectamine was added to 725 µL Opti-MEM, followed by transfer of the plasmid mixture
and incubation for 10 min at 20 ◦ C to form a DNA-Lipofectamine–stem cell complex. The complex
was added to hUC-MSCs, and the mixture was incubated at 37 ◦ C in a CO2 incubator. After 6 h,
the medium was supplemented with 10% serum, and after another 24 h, GFP expression was observed
by fluorescence microscopy (LSM510; Carl Zeiss Microimaging Inc., München, Germany; Nikon Eclipse
Ni; Nikon Instruments Inc., Melville, NY, USA), indicating successful transfection.
4.4. Reverse Transcription Polymerase Chain Reaction (RT-PCR)
RT-PCR was performed to evaluate CCL2 mRNA levels in CCL2-overexpressing hUC-MSCs.
Total RNA was extracted from hUC-MSCs using TRIzol reagent (Ambion, Austin, TX, USA).
After cDNA synthesis, specific primers for CCL2 (F: 50 -TTTGGTTGCATGAAGGCTGC-30 ;
and R: 50 -GCCGAACTTTCTGGTCCTCA-30 ) and glyceraldehyde 3-phosphate dehydrogenase (GAPDH;
F: 50 -AGCAATGCCTCCTGCACCACCAAC-30 ; and R: 50 -CCGGAGGGGCCATCCACAGTC-30 ) were
used for amplification using the Quantitect SYBR Green PCR kit (Qiagen, Hilden, Germany) according
to the following program: 40 cycles at 95 ◦ C for 15 s and 60 ◦ C for 60 s. CCL2 levels were normalized
against those of GAPDH, and amplifications were independently replicated four times on different days.
4.5. Western Blot
Western blot was used to evaluate CCL2 levels in CCL2-overexpressing hUC-MSCs.
After hUC-MSCs were harvested and lysed in 2× Laemmli sample buffer (Bio-Rad, Hercules, CA,
USA), the proteins were isolated. The proteins obtained were quantified using the BCA Assay kit
(Thermo Fisher Scientific, Waltham, MA, USA). And then, 50 µg proteins were separated by 10%
sodium dodecyl sulfate polyacrylamide gel electrophoresis and transfer to polyvinylidene difluoride
membranes (Millipore, Billerica, MA, USA) using standard electroblotting procedures. The blots were
blocked with 5% skim milk in Tris-buffered saline containing Tween-20 for 1 h at room temperature
and immunolabeled with primary antibodies against CCL2 (1:1000; Abcam, Cambridge, UK) and
β-actin (1:1000; Santa Cruz Biotechnology, Dallas, TX, USA) overnight at 4 ◦ C. Immunolabeling was
detected with an enhanced chemiluminescence kit (Bio-Rad, Hercules, CA, USA) using the LAS4000
imaging system (GE Healthcare, Pittsburgh, PA, USA). Experiments were independently replicated
four times on different days.
4.6. MCAo Stroke Model
Male Sprague–Dawley rats (7-weeks old; 270–300 g) were purchased from Orient Bio (Orient
Bio, Seongnam, Korea) and housed in a temperature- and humidity controlled room with a 12-/12-h
light/dark cycle. Animals were allowed to acclimatize to the laboratory 1-week prior to surgery and had
ad libitum access to food and water. Rats were anesthetized via intramuscular injection of ketamineInt. J. Mol. Sci. 2020, 21, 7795 14 of 19
and Rompun (3:1), followed by placement on a heating pad, limb fixation with tape, and monitoring of
Int. J. Mol. Sci. 2020, 21, x FOR PEER REVIEW 14 of 19
body temperature. The internal, external, and common carotid arteries (ECAs and CCAs, respectively)
were exposed after midline skin incision in the right neck area, followed by ligation of CCA branches.
ligation of CCA branches. After incision of the ECA, a filament coated with silicon (Doccol Corp.,
After incision of the ECA, a filament coated with silicon (Doccol Corp., Sharon, MA, USA) was inserted
Sharon, MA, USA) was inserted 20 mm from the ECA through the carotid artery to block the MCA.
20 mm from the ECA through the carotid artery to block the MCA. After 60 min of occlusion, blood
After 60 min of occlusion, blood flow was restored in the CCA, and the MCA was reperfused by
flow was restored in the CCA, and the MCA was reperfused by withdrawing filament. During the
withdrawing filament. During the procedure, rectal temperature was maintained at 37 °C by heating
procedure, rectal temperature was maintained at 37 ◦ C by heating surgical pad. The following day,
surgical pad. The following day, the MCAo-induced rats were randomly divided into four groups (n
the MCAo-induced rats were randomly divided into four groups (n = 10/group), (1) phosphate-buffered
= 10/group), (1) phosphate-buffered saline (PBS) group (control), (2) mannitol-treatment group
saline (PBS) group (control), (2) mannitol-treatment group (MAN), (3) mannitol+hUC-MSC-treatment
(MAN), (3) mannitol+hUC-MSC-treatment group (M-MSC), and 4) mannitol+CCL2-overexpressing
group (M-MSC), and (4) mannitol+CCL2-overexpressing hUC-MSC-treatment group (CCL2-MSC).
hUC-MSC-treatment group (CCL2-MSC).
4.7. Stem Cell Transplantation
4.7. Stem Cell Transplantation
The in vivo experiments are described in Figure 8. Mannitol, which is effective at increasing the
The in vivo experiments are described in Figure 8. Mannitol, which is effective at increasing the
permeability of the blood–brain barrier (BBB) [50], was injected prior to implantation. According
permeability of the blood–brain barrier (BBB) [50], was injected prior to implantation. According to
to cell administration described in a previous study [47], intravenous (IV) mannitol (2.5 mL of
cell administration described in a previous study [47], intravenous (IV) mannitol (2.5 mL of 20%
20% solution; injection speed: 1.0 mL/min) and either IV hUC-MSCs or IV CCL2-overexpressing
solution; injection speed: 1.0 mL/min) and either IV hUC-MSCs or IV CCL2-overexpressing hUC-
hUC-MSCs (1 × 10⁶ cells in 0.5 mL PBS) were carefully injected into the tail vein at two different
MSCs (1 × 10⁶ cells in 0.5 mL PBS) were carefully injected into the tail vein at two different
transplantation time points (1- and 4-days post-MCAo induction) in the cell-transplantation group.
transplantation time points (1- and 4-days post-MCAo induction) in the cell-transplantation group.
Immunosuppressive drugs were not used. The PBS group received only IV PBS, and the MAN
Immunosuppressive drugs were not used. The PBS group received only IV PBS, and the MAN group
group received only IV mannitol without cell transplantation at the same time points. During the
received only IV mannitol without cell transplantation at the same time points. During the procedure,
procedure, no profound bleeding occurred during transplantation, and vital signs in rats were stable.
no profound bleeding occurred during transplantation, and vital signs in rats were stable. There were
There were no perioperative complications (death or severe morbidity) in any of the four tested groups
no perioperative complications (death or severe morbidity) in any of the four tested groups or
or significant changes in temperature and weight (data not shown). All rats, including those receiving
significant changes in temperature and weight (data not shown). All rats, including those receiving
CCL2-overexpressing hUC-MSC transplantation, survived during the experiment, supporting the
CCL2-overexpressing hUC-MSC transplantation, survived during the experiment, supporting the
safety of these hUC-MSCs.
safety of these hUC-MSCs.
Figure Experimental
8. Experimental
Figure 8. schedule.
schedule. Schematic
Schematic showing
showing the timing
the timing of cell of cell transplantation
transplantation and
and various
various
analysesanalyses in the MCAo
in the MCAo animal animal
model,model, including
including dates dates of transplantation,
of transplantation, behavior
behavior test, test,
and
and immunohistochemical analyses. IHC: immunohistochemical
immunohistochemical analyses. IHC: immunohistochemical assay. assay.
4.8. Behavioral Tests
4.8. Behavioral Tests
Behavioral tests were performed independently by two blinded investigators at 1-, 2-, and 5-days
after Behavioral tests were
MCAo induction, performed
followed independently
by once weekly forby uptwo blinded
to four investigators
weeks. The mNSS at test
1-, 2-, and 5-
assessed
days after MCAo induction, followed by once weekly for up to four weeks. The mNSS
scores according to analysis of motor, sensory, reflex, and balance deficits and ranged from 0 to 28. test assessed
scores according
Higher to analysis
scores indicate closeroftomotor,
severe sensory, reflex,
conditions, and balance
whereas deficits
lower scores and ranged
indicate normal from 0 to 28.
conditions.
Higher scores indicate closer to severe conditions, whereas lower scores indicate
Stepping tests to assess forefoot deficits were performed using a treadmill. Recovery of forefootnormal conditions.
Stepping
motor tests towas
function assess forefootbydeficits
measured counting were
theperformed
number ofusing
handastrokes
treadmill. Recovery
on the bottomofofforefoot motor
the treadmill.
function
For was measured
each forefoot test, theby counting
average the number
of three of hand
times trials strokes
was used foron the bottom
analysis. of thetests
Foot-fault treadmill.
measuredFor
each forefoot test, the average of three times trials was used for analysis. Foot-fault tests measured
forefoot motor impairment using a ladder (120-cm long with rungs 4-cm apart). The falling depth of
the right forelimb was counted when the forelimb of the affected side slid, fell off of, or slippedInt. J. Mol. Sci. 2020, 21, 7795 15 of 19
forefoot motor impairment using a ladder (120-cm long with rungs 4-cm apart). The falling depth
of the right forelimb was counted when the forelimb of the affected side slid, fell off of, or slipped
between the rod, and scores were recorded as follows: fallen to the shoulder: 2; fallen to the ankle: 1;
and normal walk: 0 [47].
4.9. Measurement of Infarct Size
At 4-weeks post-MCAo induction, infarct volume was measured in the independent MCAo model
group using 2,3,5-triphenyltetrazolium chloride (TTC) and Cresyl Violet staining. The removed brain
was cut at 1-mm intervals and stained with 2% TTC solution (n = 5/group), followed by fixation with
4% paraformaldehyde (PFA). The infarct volume of the MCAo model was also measured using Cresyl
Violet staining of brain sections in each group. The infarct size was measured as a percentage of the
intact hemisphere using the following formula: Infarct size (%) = [1 − (area of remaining ipsilateral
hemisphere/area of intact contralateral hemisphere)] × 100. The size of the infarct region was measured
with Image J software (National Institutes of Health, Bethesda, MD, USA). Percentages of infarct size
were summed from three sections per brain, and values obtained from TTC and Cresyl Violet staining
were compared.
4.10. Immunohistochemistry
Rats were euthanized and transcardially perfused with heparinized saline and 4% PFA (Merck
Millipore, Waltham, MA, USA). After perfusion, the brain was separated and fixed with 4% PFA
overnight at 4 ◦ C and then transferred to 30% sucrose solution (Sigma-Aldrich, St. Louis, MO, USA) for
incubation for at least 3 days at 4 ◦ C. The brains were then embedded using optimal cutting temperature
compound and stored at −80 ◦ C. Brain tissues were then sectioned at a thickness of 40 µM on a cryostat.
Free-floating sections were blocked with 5% normal goat serum in PBS for 1 h at 20 ◦ C and incubated
with blocking buffer containing the following primary antibodies overnight at 4 ◦ C: anti-Stem121
(1:200; Takara Bio, Shiga, Japan), anti-neuronal nuclei (NeuN; 1:200, Merck Millipore, Waltham, MA,
USA), anti-bromodeoxyuridine (BrdU; 1:200; Invitrogen, Carlsbad, CA, USA), anti-doublecortin (DCX;
1:200, Cell Signaling Technology, Danvers, MA, USA), anti-vascular endothelial growth factor (VEGF;
1:200; Thermo Fisher Scientific, Waltham, MA, USA), anti-rat endothelial cell antigen-1 (RECA-1;
1:100; Abcam, Cambridge, UK), anti-ionized calcium-binding adapter molecule-1 (Iba-1; 1:500; Wako
Pure Chemical Co., Kyoto, Japan), anti-glial fibrillary acidic protein (GFAP; 1:200; BD Pharmingen,
San Diego, CA, USA), anti-ED1/CD68 (1:500; Bio-Rad, Hercules, CA, USA), anti-inducible nitric oxide
synthase (iNOS; 1:50; Thermo Fisher Scientific, Waltham, MA, USA), anti-CD206 (1:100; Thermo
Fisher Scientific, Waltham, MA, USA), anti-CCL2 (1:200; Abcam, Cambridge, UK), and anti-CCR2
(1:250; Abcam, Cambridge, UK). The sections were washed in PBS three times for 15 min each and
then incubated with secondary antibodies (1;500, Invitrogen, Carlsbad, CA, USA) for 1 h at 20 ◦ C.
The sections were then treated with the nuclear marker 40 ,6-diamidine-20 -phenylindole dihydrochloride
(Sigma-Aldrich, St. Louis, MO, USA). The sections were cover-slipped with mounting solution (Vector
Labs, Burlingame, CA, USA) to delay fading. Changes in CCL2 and CCR2 levels in the brain during
acute ischemia were confirmed on the day before MCAo induction and days 1, 2 and 5 after MCAo
induction. To investigate the migration and engraftment of IV-transplanted cells in the brain, Stem121
analysis was performed 1 day after the second transplantation. Co-localization of Stem121 and, CCL2 or
CCR2 was also performed 1 day after the second transplantation. Changes in CCL2 level according
treatment were determined at 5 days and 4 weeks after MCAo induction. Other immunohistochemical
analyses to assess angiogenesis, neurogenesis, and neuro-inflammation were performed 4 weeks after
MCAo induction. All immunohistochemical analyses were performed four or five times for each group.
4.11. Quantitation of Vessel Density
Vascular images detected by RECA-1 targeting to identify the vascular endothelium were
transformed into a black-and-white image using VesSeg-Tool software (http://www.isip.uni-luebeck.Int. J. Mol. Sci. 2020, 21, 7795 16 of 19
de/index.php?id=150&L=0, Lübeck, Germany), with RECA-1+ areas shown in white calculated as a
percentage of the total area.
4.12. Statistical Analysis
Statistical analyses were performed using GraphPad Prism software (v.5.0; GraphPad Software,
La Jolla, CA, USA) and SigmaPlot software (v.14.0.; https://systatsoftware.com/products/sigmaplot/,
San Jose, CA, USA). Statistically significant differences between two groups were analyzed using
Student’s t test, and analysis of behavioral test results was performed using one-way analysis of variance
(ANOVA). Statistically significant differences in multiple comparisons of immunohistochemical results
were analyzed using one-way ANOVA, followed by Tukey’s post hoc test. A p < 0.05 was considered
significant, and all values are presented as the mean ± standard error (SEM).
Supplementary Materials: Supplementary materials can be found at http://www.mdpi.com/1422-0067/21/20/7795/s1.
Author Contributions: S.L. and O.J.K. designed the study and wrote the draft of the manuscript; S.L. performed
data acquisition and analysis; S.L., K.O.L., H.J., S.-H.O., N.K.K., and O.J.K. interpreted the data. S.L., K.O.L., and
O.J.K. performed manuscript revisions. All authors have read and agree to the published version of the manuscript.
Funding: This study was funded by the Ministry for Health, Welfare & Family Affairs, Republic of Korea
(HI16C1559).
Conflicts of Interest: The authors declare no conflict of interest.
Abbreviations
ANOVA Analysis of variance
BBB Blood–brain barrier
BrdU Bromodeoxyuridine
CCA Common carotid artery
CCL2 C–C motif chemokine ligand 2
CCL2-MSC Mannitol+CCL2-overexpressing hUC-MSC-treatment group
CCR2 C–C motif chemokine receptor 2
DCX Doublecortin
ECA External carotid artery
GFAP Glial fibrillary acidic protein
GFP Green fluorescent protein
hUC-MSC Human umbilical cord-derived mesenchymal stem cell
Iba-1 Ionized calcium-binding adapter molecule 1
IV Intravenous
MAN Mmannitol-treatment group
M-MSC Mannitol + hUC-MSC-treatment group
MSC Mesenchymal stem cell
MCAo Middle cerebral artery occlusion
MEM Minimum essential medium
mNSS Modified neurological severity score
NeuN Neuronal nuclei
PBS Phosphate-buffered saline
PFA Paraformaldehyde
r-tPA Recombinant tissue plasminogen activator
RECA-1 Rat endothelial cell antigen 1
RT-PCR Reverse transcription polymerase chain reaction
SEM Standard error of the mean
TTC 2:3:5-triphenyltetrazolium chloride
VEGF Vascular endothelial growth factorYou can also read