Intravital imaging of glioma border morphology reveals distinctive cellular dynamics and contribution to tumor cell invasion
←
→
Page content transcription
If your browser does not render page correctly, please read the page content below
www.nature.com/scientificreports

                         OPEN      Intravital imaging of glioma border
                                   morphology reveals distinctive
                                   cellular dynamics and contribution
Received: 24 July 2018
Accepted: 18 December 2018         to tumor cell invasion
Published: xx xx xxxx
                                   Maria Alieva1,2, Verena Leidgens1,3, Markus J. Riemenschneider4, Christoph A. Klein                      5
                                                                                                                                                ,
                                   Peter Hau 3 & Jacco van Rheenen1,6
                                   The pathogenesis of glioblastoma (GBM) is characterized by highly invasive behavior allowing
                                   dissemination and progression. A conclusive image of the invasive process is not available. The aim of
                                   this work was to study invasion dynamics in GBM using an innovative in vivo imaging approach. Primary
                                   brain tumor initiating cell lines from IDH-wild type GBM stably expressing H2B-Dendra2 were implanted
                                   orthotopically in the brains of SCID mice. Using high-resolution time-lapse intravital imaging, tumor cell
                                   migration in the tumor core, border and invasive front was recorded. Tumor cell dynamics at different
                                   border configurations were analyzed and multivariate linear modelling of tumor cell spreading was
                                   performed. We found tumor border configurations, recapitulating human tumor border morphologies.
                                   Not only tumor borders but also the tumor core was composed of highly dynamic cells, with no clear
                                   correlation to the ability to spread into the brain. Two types of border configurations contributed to
                                   tumor cell spreading through distinct invasion patterns: an invasive margin that executes slow but
                                   directed invasion, and a diffuse infiltration margin with fast but less directed movement. By providing a
                                   more detailed view on glioma invasion patterns, our study may improve accuracy of prognosis and serve
                                   as a basis for personalized therapeutic approaches.

                                   Glioblastoma (GBM) is one of the most aggressive primary brain tumors, with a median survival time of about
                                   14.6 months despite maximal therapy1. Besides resection and radiotherapy, Temozolomide, a cytotoxic drug2 and
                                   Optune, so-called Tumor Treating Fields3,4, remain the only measures that improve outcome.
                                       GBM is hallmarked by a high complexity and heterogeneity5,6, making a deep understanding of its pathogen-
                                   esis challenging. The tumor is driven by a minority of cancer stem-like brain tumor initiating cells (BTIC)7,8, that
                                   appear to be not only implicated in tumor initiation, but also in recurrence, progression9,10 and resistance to cur-
                                   rent therapy8,11. BTICs and non-stem tumor cell co-exists in vivo and are likely to change dynamically depending
                                   of the tumor microenvironment12,13. In view of modelling the disease, BTICs are the best available cell population
                                   to investigate GBM in vitro and in vivo14,15.
                                       The pathogenesis of GBM is manifold and includes highly-invasive behavior that is a main cause behind
                                   GBM dissemination and progression16,17. There is general agreement that invasion is an early event in GBM
                                   progression16, where the tumor cells tend to invade individually or in small groups17,18. These infiltrating tumor
                                   cells lie well beyond the definable margin for maximal resections17,18 giving rise to tumor relapse19. GBM cells are
                                   thought to preferentially migrate along existing brain structures12,18, however vascular co-option and migration
                                   along white matter tracts are also important features of glioma cell invasion16,20,21. Tumor borders are not always
                                   uniform, and several invasion patterns such as single cell invasion18,22 and collective migration with leading and

                                   1
                                    Hubrecht Institute-KNAW & University Medical Center Utrecht, Uppsalalaan 8, 3584 CT, Utrecht, The Netherlands.
                                   2
                                     Prinses Máxima Center for Pediatric Oncology, Uppsalalaan 8, 3584CT, Utrecht, The Netherlands. 3Department
                                   of Neurology and Wilhelm Sander-NeuroOncology Unit, University Hospital Regensburg, Regensburg, Germany.
                                   4
                                     Department of Neuropathology, Regensburg University Hospital, Regensburg, Germany. 5Department of
                                   Experimental Medicine, University of Regensburg, Regensburg, Germany. 6Department of Molecular Pathology,
                                   Oncode Institute, Netherlands Cancer Institute, Plesmanlaan 121, 1066CX, Amsterdam, The Netherlands. Maria
                                   Alieva, Verena Leidgens, Peter Hau and Jacco van Rheenen contributed equally. Correspondence and requests for
                                   materials should be addressed to M.A. (email: m.alieva@prinsesmaximacentrum.nl) or P.H. (email: peter.hau@ukr.de)

        Scientific Reports |   (2019) 9:2054 | https://doi.org/10.1038/s41598-019-38625-4                                                            1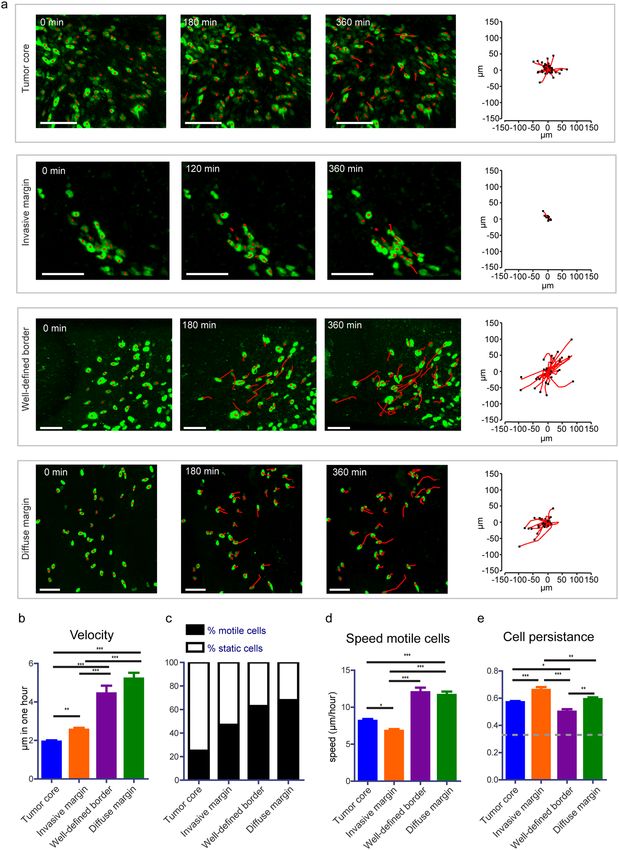
www.nature.com/scientificreports/
follower cells23,24 have been described. However it is unclear how these patterns correlate to clinically relevant
macroscopic tumor growth and dissemination18,25.
The reason why a conclusive image of the invasive process in malignant gliomas is still not available is partly
due to the lack of relevant models. Screens based on partitioned resections from tumor boarder and core26,27 and
conventional in vitro migration assays28–30 are highly artificial and cannot recapitulate in vivo tumor cell behavior.
The development of intravital microcopy (IVM), a potent tool that allows to perform single-cell resolution
time-lapse imaging on live animals, has provided new insights into (GBM) tumor cell dynamics22,31–39. To further
investigate the physiological processes40 underlying GBM cell movement, this study aimed to image and analyze
distinct GBM invasive growth patterns found in vivo, similar to those observed in patients. We combined an
orthotopic human BTIC-derived GBM model with real time dynamic high-resolution IVM22,31,35 followed by a
comprehensive analysis of tumor cell migratory behavior and found that distinct types of tumor border morphol-
ogies present different invasive growth patterns that can contribute to tumor expansive growth.
Results
Distinct tumor border configurations in glioma tumors. To gain insight in glioma cells migratory
behavior at different tumor border configurations we imaged the in vivo behavior of single BTICs derived from
GBM patients who had undergone resection15,41. We injected two BTIC cell lines (BTIC-10 and BTIC-12) stably
expressing a nuclear fluorescent protein (H2B Dendra2) in the brain of NSG mice. To gain visual access to the
brain and study the invasive behavior at single cell level in vivo, we implanted a chronic cranial imaging win-
dow (CIW) around the injection site35. Upon tumor development, a series of microscopic time-lapse z-stack
images of all the visible tumor volume were acquired through the CIW at multiple time points with a minimum
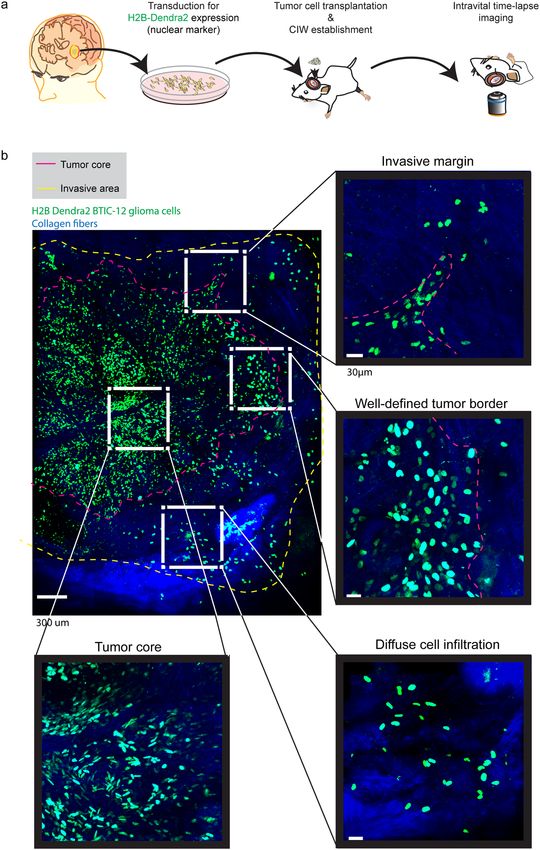
time interval of 45 minutes (Fig. 1a). Tile-scan images revealed distinct tumor border configurations (Fig. 1b).
Three different patterns of invasion were observed: protruding multicellular groups originating at the interphase
between the tumor and the brain parenchyma were defined as “invasive margin” (Fig. 1b). Tumor margins show-
ing no protrusions were named “well-defined tumor border” (Fig. 1b). Individual cell migration into the invasive
area of the brain parenchyma was defined as “diffuse cell infiltration” (Fig. 1b). Similar types of invasion patterns
can also be found in human glioblastoma biopsy samples (Supplementary Fig. S1). For comparison, cell behavior
in the tumor core was evaluated (Fig. 1b). Both BTIC cells lines showed the described border configurations
(Supplementary Fig. S2).
The movement of individual tumor cells in distinct tumor border configurations was determined by tracking
the migration path over time in 3D reconstructed time-lapse movies (Fig. 2a). Information about migration
velocity, speed, persistence, and directionality was extracted from the tracks. Although there was variation in
terms of cell velocity between the different mice, the relative migratory behavior between the different border
configurations was consistent among them (Supplementary Fig. S2). When we performed a mixed-effects regres-
sion of tumor cell migration away from the tumor border we found that it was uncorrelated to the type of BTIC
(Suppl. Table 1). Thus, we excluded that the type of BTIC had an impact on the migratory behavior and describe
pooled data of both BTIC lines in further analysis.
Role of spatial cell arrangements in migratory behavior within the invasive margin. Next, we
aimed to understand what drives cell migration at the invasive margin. We hypothesized that spatial cellular
arrangements at the invasive margin define the migration direction of subsequently following cells, as previously
described23. Within each invasive margin position, we measured the direction correlation between cells leading
invasion and their followers (Fig. 3a). We did not find clear correlations between the direction of movement of
invasion leading cells and those following (Fig. 2b). To test the hypothesis that these data point towards a pre-
dominant role of the microenvironment to determine direction and against an individual genetic program of a
subtype of cells, we re-evaluated our IVM movies and observed that cells spatially rearrange within the invasive
margin, with leader cells becoming followers and vice versa (Supplementary Movie 1).
To further analyze spatial rearrangements, we compared the proportion of leader and follower cells moving
towards and away from the tumor. We found that cells located at the leader position more often moved away
from the tumor core (74%) than towards it, compared to follower cells that moved in both directions (Fig. 3c),
pointing to the hypothesis that they were most strongly disposed to a microenvironmental gradient that triggers
invasion42,43. While follower cells showed distinct velocities depending on the direction they moved, with a higher
velocity when moving away from the tumor core, leader cells did not show such behavior (Fig. 3d).
Next, we analyzed invasion related to anatomical structures within the brain. We observed that BTIC use dif-
ferent routes of invasion along white-matter tracts or blood vessels (Supplementary Fig. 3). We further analyzed
and compared the behavior of cells that used both routes of migration and found that in both cases the direc-
tion of leader cell invasion did not correlate to the direction taken by follower cells (Supplementary Fig. 4a,b,e).
Perivascular leader cells had a higher tendency to move away from the tumor core than leader cells within the
parenchyma (Supplementary Fig. 4c). In addition, perivascular leader cells moved faster than intraparenchymal
leader cells (Supplementary Fig. 4d).
In summary, these results indicate that leader cells migrate away from the tumor core more often and faster
when associated to blood vessels.
Cell dynamics at the tumor core. To get a more holistic picture of BTIC fates within our model, we next
analyzed cell migration in the non-invasive parts of the tumor (Fig. 2a). In contrast to the common believe that
cells within the tumor core are static22, we observed that from all cancer cells in the tumor core, 23% was motile
(Fig. 2c) and moved with an average speed of 8 μm/hour (Fig. 2d), a speed even higher than of the cells of the
invasive front.
Scientific Reports | (2019) 9:2054 | https://doi.org/10.1038/s41598-019-38625-4 2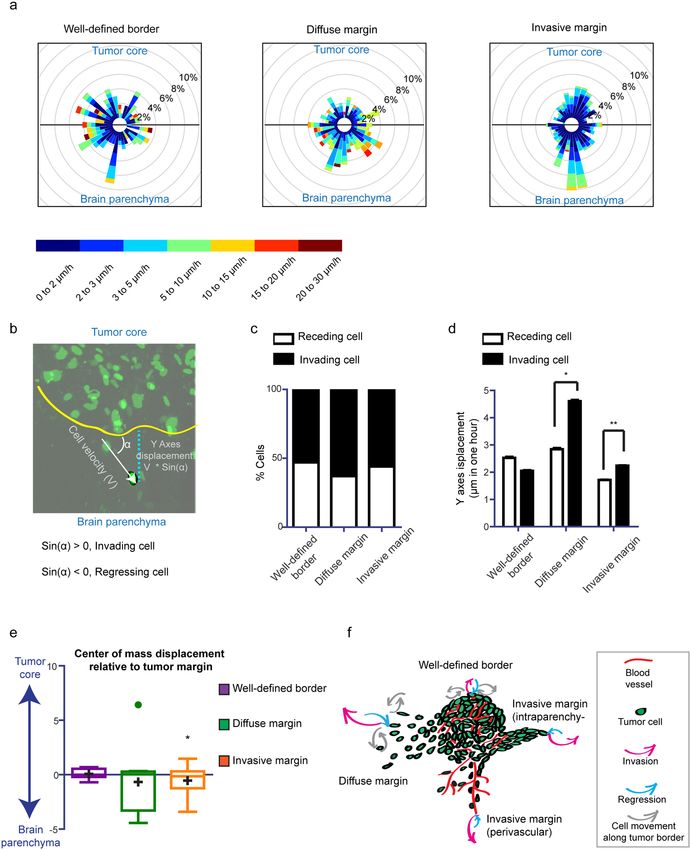
www.nature.com/scientificreports/

                           Figure 1. Tumor border configuration in the interphase between normal brain and tumor core. (a)
                           Schematic overview of the experimental setup. Patient derived BTIC lines expressing H2B Dendra2 where
                           implanted in the brain of NSG mice. Time-lapse intravital imaging was performed through a CIW to study
                           the invasive behavior of single tumor cells. (b) Representative 3D reconstructed tile-scan showing distinct
                           tumor border configurations. Shown are H2B expressing BTICs in green, collagen fibers in blue. The dotted
                           pink line delineates the tumor core, while the dotted yellow line delineates the tumor cell invasive area. Scale
                           bar = 300 μm.

                           Cell dynamics at the tumor border. We next analyzed the behavior of cells within the different types of
                           tumor borders. Here, we determined the mean cell velocity of tracked single cells (cell displacement over time)
                           and found that cells, at the well-defined border (4.4 µm/hour) and the diffuse margin (5.2 µm/hour), possessed a

Scientific Reports |   (2019) 9:2054 | https://doi.org/10.1038/s41598-019-38625-4                                                             3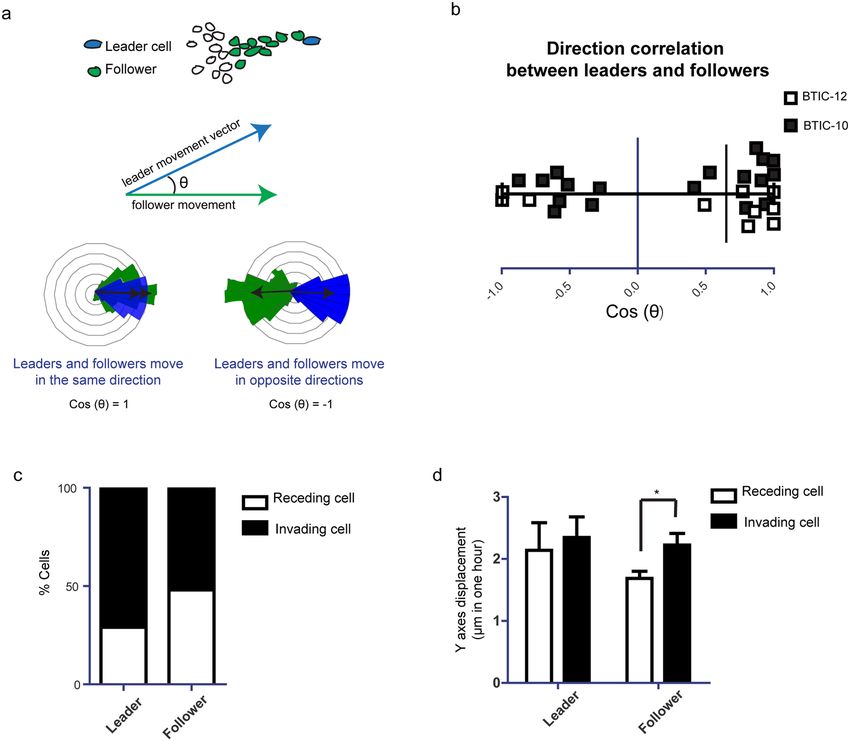
www.nature.com/scientificreports/

                           Figure 2. Migratory behavior of tumor cells at different border configurations. (a) Representative still images
                           from a time-lapse movie showing migrating tumor cells from different border configurations. Red lines
                           highlight individual tumor cell tracks. Scale bar = 100 μm. Corresponding plots show tracks with a common
                           origin. (b) Quantification of cell velocity for the indicated border and tumor core configurations. The data is
                           shown as mean ± S.E.M. (c) Percentage of motile (cell velocity > 2 μm/hour) and static cells for each condition.
                           (d) Speed of motile cells at the indicated border and tumor core configurations. Data is shown as mean ± S.E.M.,
                           n = 7 mice (BTIC-10 and BTIC-12 lines). (e) Persistence of motile cells at the indicated border and tumor
                           core configurations. The data is shown as mean ± S.E.M, n = 7 mice (BTIC-10 and BTIC-12 lines). *p < 0.05,
                           **p < 0.01, ***p < 0.0001, one-way ANOVA with Tukey’s post hoc test.

Scientific Reports |   (2019) 9:2054 | https://doi.org/10.1038/s41598-019-38625-4                                                        4
www.nature.com/scientificreports/
Figure 3. Role of spatial cell arrangements in invasive margin migratory behavior. (a) Schematic representation
how the correlation of direction between leader and follower cells of the invasive margin was quantified. (b)
Quantification of direction correlation between leader and follower cells. n = 7. Black squares show BTIC-10
line. White squares show BTIC-12 line. nsp > 0.05, one sample Student’s t, hypothetical value = 0. (c) Percentage
of invading and regressing cells for each condition, n = 7 (BTIC-10 and BTIC-12). (d) Quantification of Y-axes
displacement for the invading/regressing cells of each condition, n = 7 (BTIC-10 and BTIC-12). *p < 0.05,
Student’s t test. For leader and follower cells invading cells versus receding cells were tested.
higher velocity than cells from the invasive margin (2.6 µm/hour) (Fig. 2b). Next, we compared the percentage of
motile cells with a cell velocity > 2 µm/hour in between the tumor core and all kinds of borders and observed a
higher proportion of motile cells in all border configurations as compared to the tumor core (Fig. 2c), pointing to
a general more migratory behavior of tumor borders. The speed of motile cells (measure of the actual distance a
cell covers over time) was highest at the diffuse margin and the well-defined border with 11.6 µm/hour and 12 µm/
hour respectively (Fig. 2d). Cells in the invasive margin were found to be moving more slowly with an average
speed of 6.8 µm/hour. However, when we analyzed the persistence of movement, we discovered that cells from the
invasive margin moved in the most persistent fashion of higher than 0.36, a number that was previously consid-
ered to be representative for random walk44.
Since directionality is an important feature of invasion, we analyzed the directionality patterns in each type
of border configuration. We observed disperse directionality patterns in all subtypes (Supplementary Fig. S5),
with cells migrating towards the parenchyma, while other cells migrated towards the tumor core, or parallel
to the tumor border (Fig. 2a, Supplementary Movie 1). Moreover, we observed cells that changed migration
directionality over time (Fig. 2a, Supplementary Movie 1). To assess whether a particular migration behavior is
favored within one of the border configurations, we plotted the migration path of all the cells from different posi-
tions in a wind rose plot (Fig. 4a). Here, we found the most directed and invasive pattern in the invasive margin
configuration.
To identify the velocity and proportion of phenotypically relevant invading and retreating cells, we meas-
ured the perpendicular cell displacement relative to the tumor margin (Fig. 4b). We found that the proportion
of invasion was balanced at all border configurations with only a slight prevalence of invading cells (Fig. 4c).
The diffuse margin harbored the highest proportion of invading cells (61.5%), followed by the invasive margin
(54.4%) (Fig. 4c). Moreover, when we compared the velocity of the invading and retreating cells we found that
invading cells moved faster than retreating cells at both the invasive margin and the diffuse margin, but not at the
well-defined border (Fig. 4d).
Scientific Reports | (2019) 9:2054 | https://doi.org/10.1038/s41598-019-38625-4 5www.nature.com/scientificreports/
Figure 4. Direction of cell movement at different tumor border configurations. (a) Wind rose plot representing
the percentage of cells migrating in the direction of a leaflet for each tumor border configuration. Color
scale indicates migration speed, n = 7 (BTIC-10 and BTIC-12). (b) Schematic representation of Y-axes cell
displacement quantification. (c) Percentage of invading and regressing cells for each condition, n = 7 (BTIC-
10 and BTIC-12). (d) Quantification of the Y-axes velocity for invading and regressing cells of each condition,
respectively, n = 7 (BTIC-10 and BTIC-12), *p < 0.05, Student’s t test. For each border configuration invading
cells versus regressing cells were tested. (e) Tukey-style whiskers plot of the center of mass displacement of
individual positions of each condition. Boxes indicate the interquartile range, crosses indicate the mean,
and dots indicate outliers. n = 7 (BTIC-10 and BTIC-12), *p < 0.05, one sample Student’s t test, hypothetical
value = 0. When the center of mass does not change in respect to its initial position it is considered to be 0. The
one sample Student´s t test determines if the mean of the center of mass displacement (COMd) of the positions
belonging to the distinct border types is different from 0. COMd > 0: overall the cells in this type of position
move towards the tumor core. COMd < 0: overall the cells in this type of position move away from the tumor
core. (f) Schematic illustration of the model showing cell dynamics at different tumor border configurations.
Finally, to depict if all areas within a specific border configuration follow the same phenotypic behavior, we
assessed the overall displacement of the center of mass perpendicular to the tumor margin (COMy) (Fig. 4e).
In all border configurations, we found positions moving towards and away from the tumor border (Fig. 4e),
Scientific Reports | (2019) 9:2054 | https://doi.org/10.1038/s41598-019-38625-4 6www.nature.com/scientificreports/
indicating that not all the regions of a tumor are in continuous expansion. Our results showed that for the
well-defined border configuration the mean COMy was close to zero, indicating that this type of configuration,
although very dynamic within the position (Fig. 2a), does not contribute to cell spreading away from the tumor.
However, both the diffuse and invasive margin showed a mean COMy shifted towards the brain parenchyma
(Fig. 4e), emphasizing that these configurations may drive tumor cell spreading away from the tumor.
To further confirm this observation, we used a multivariate linear model to more accurately evaluate the
association of COMy with factors such as mean velocity of invading cells, mean velocity of retreating cells and
their interaction with variables such as frequency of invading cells, configuration type and BTIC type (Suppl.
Table 2). Our model shows that for each position the velocity of invading cells was the strongest predictor of
tumor expansion (COMy shift towards the brain parenchyma) and was independent of the BTIC cell line. The
velocity of invading cells showed interaction effects with two other predictors (Supplementary Fig. 6), namely
frequency of invading cells and border configuration type. We consolidated variation to these predictors: with a
high proportion of invading cells, the velocity of invading cell has a higher impact on tumor expansion (COMy);
the velocity of invading cells has a higher impact on cell spreading and at the invasive margin and at the diffuse
border (Supplementary Fig. 6a).
Since our analysis showed that cells at the invasive margin have a lower cell velocity (Figs 2b and 4d), this
factor alone could not explain a similar effect on cell spreading at the invasive margin and at the diffuse border as
shown in Fig. 4e. Therefore, we analyzed the distribution of the frequency with which cells were invading within
each position for each configuration type and found that the invasive margin showed more positions with a high
frequency of invading cells compared to the diffuse margin (Supplementary Fig. 6b).
Combined, these data indicate that the diffuse margin and invasive margin contribute to cell spreading and
tumor expansion through two different mechanisms: a higher speed for the first, and a higher proportion of
invading cells for the second.
Discussion
In contrast to glioblastoma morphology, tumor cell dynamics within GBM is not well understood. We combined
an orthotopic GBM model, time-lapse in vivo microscopy of human brain tumor initiating cells through a cranial
window, and in-depth analysis of tumor cell spreading to acquire a better insight of GBM tumor cells dynamics
within their environment on multiple layers.
Using this approach, we delineated tumor border configurations conformed by two different types of inva-
sion represented by cells in the invasive margin and diffuse infiltration pattern; and one pattern that, although
dynamic, seems to be non-invasive, the well-defined tumor border pattern. We discovered that, in contrast to
the other patterns45, cells from the invasive margin moved with lower velocity and speed, but in the most persis-
tent fashion. At the diffuse margin cells moved less persistently but also contributed to cell spreading and tumor
expansion through a higher speed of migration. Moreover, we found that not all regions that show tumor cell
migration actually contribute to tumor cell invasion. GBM cells in the tumor well defined border, a region gener-
ally thought to be static22, are also extremely dynamic, but do not contribute to invasion as their movement shows
a highly undirected pattern. This highlights the importance of this study, indicating that a more comprehensive
analysis of GBM including morphological and dynamic data may allow deeper insights in the complex mech-
anism of invasion. In contrast, studies that looked solely on tumor cell migration speed, or were performed in
vitro, models where tumor cells lack microenvironmental cues for directed migration, do not fully elucidate this
heterogeneity30,46.
Glioma cells have previously been reported to use different routes of invasion such as intraparenchymal inva-
sion along white-matter tracks16,21 or invasion along blood vessels16. In line with this, in our model, perivascular
leader cells had also a higher tendency to move away from the tumor core than cells within the parenchyma, and
to move faster. These data correspond well to published data, where individually migrating cells, collective strands
extending along blood vessels or white matter tracts, and multicellular networks of interconnected glioma cells
were found22,45,47–49. However, this is the first piece of work that analyzed single-cell dynamics of patient derived
tumor cells in vivo at different tumor border and invasive front areas corresponding to the morphologies found
in patients.
It has been previously described that collectively moving cells can either have a specific role defined by their
position in the cellular stream, or dynamically change position with any cell from the group with the ability to
drive migration23. Against our expectation, we did not find clear correlations between the direction of movement
of invasion leading cells and those following. Our results show that in our model tumor cells can dynamically
exchange position in the collective cell stream indicating that their behavior may be more dependent of microen-
vironmental influences than of genetic predisposition. Cells located at the leader position more often moved
away from the tumor core than towards it, compared to follower cells that moved in both directions. This possibly
points to the hypothesis that leader cells were most strongly disposed to a microenvironmental gradient that trig-
gers invasion50–52, probably due to distinct microenvironmental structures45,53 or gradients of chemoattractants50.
Moreover, since we found migratory cells in all areas of the tumor, it is likely that all cells have an intrinsic capac-
ity to migrate, however only some actually contribute to invasion due to microenvironmental cues.
The fact that tumor cells move bidirectionally indicates that tumor cells may receive chemotactic signals from
both the tumor core and the tumor microenvironment. Indeed, studies based on brain slices engrafted with
tumor spheres showed a cell fraction with a highly invasive morphology that interacted with the tumor core54–56.
In addition, ex vivo and in vivo studies using IVM have also shown that tumor cells that are integrated into
functional connective networks respond to tumor core removal or injury by repopulating the injured area54,57.
We have also found that tumor biopsy-like injury changes tumor cell migratory capacity and increases tumor
cell migration speed31, all contributing to the hypothesis that invasion is highly dependent on the environment.
Another potential driver of glioma tumor cell migration is the direct movement of stromal cells. Although there
Scientific Reports | (2019) 9:2054 | https://doi.org/10.1038/s41598-019-38625-4 7www.nature.com/scientificreports/
is no evidence so far that that brain parenchymal cells can directly drive tumor cell migration, in squamous cell
carcinoma, fibroblasts have shown to lead collective migration of tumor cells58. Moreover immune cells, such as
macrophages, have shown to associate with breast tumor cells, drive their migration towards blood vessels and
facilitate their intravasation59. The possibility of parenchymal brain cells such as e.g. microglia as direct drivers of
glioma cell migration still needs to be explored.
In summary our work is the first analytical study that correlates distinct tumor border patterns that can be
found on histological sections with particular tumor cell dynamics. It not only fosters the understanding of single
cell invasion, but possibly also of distant metastasis and re-population of the primary tumor site, both mech-
anisms that significantly influence the prognosis of patients with GBM. Our long-term goal is to correlate the
analysis of tumor morphology with the dynamics of tumor cell movement to get a more complete picture of GBM
invasion and to therefore improve the prognostic evaluation of GBM and to possibly develop novel therapeutic
approaches. Future work should be directed to analyze invasive behavior of a much larger cohort of distinct
patient-derived tumor cell lines, in order to confirm our results and to allow correlations with morphological
and possibly prognostic features. Since it is known that the adaptive immune system can also influence tumor
migratory behavior18,60, it might be worth to use humanized tumor mouse models to assess the role of the human
immune microenvironment on tumor cell behavior.
Materials and Methods
Tumor cell lines. We used previously established primary brain tumor initiating cell lines (BTIC)-10 and
-12 derived from patients with IDH wild type glioblastoma as described15,41. The Department of Neuropathology,
University of Regensburg (MJR), verified the patients’ diagnoses and WHO grade.
Tumor cells were maintained in RHB-A (Y40001, Takara), supplemented with 20 ng/ml of EGF (130097751),
bFGF (130093842) (both Miltenyi Biotech), and 50 U (v/v) Penicillin/0.05% (v/v) Streptomycin (P4333)
(Sigma-Aldrich) at 37 °C, 5% CO2, 95% humidity in a standard tissue culture incubator. Progenitor features of
BTICs were verified by clonogenicity assays, flow cytometry (CD133, CD15, CD44, A2B5), immunocytochemis-
try (Nestin, Sox2, GFAP), and tumor take in an immunocompromised mouse model (female NOD.Cg-Prkdcscid
Il2rgtm1Wjl/SzJ). BTICs were lentivirally transduced to achieve stable expression of the nuclear fluorescent pro-
tein H2B Dendra2, as described61.
The ethics board of the University of Regensburg, Germany, approved the use of human material for this study
(No° 11-103-0182) and all patients gave written informed consent. All methods were performed in accordance
with the relevant guidelines and regulations.
Animals. Non-obese diabetic SCID IL-2 receptor gamma chain knockout (NSG) mice 8 to 12 weeks post
partum were used for the experiments. Mice were housed in an individually ventilated cage and received food
and water ad libitum. All experiments were carried out in accordance with the guidelines of the Animal Welfare
Committee of the Royal Netherlands Academy of Arts and Sciences, the Netherlands. The experimental protocols
used in this manuscript were approved by the Centrale Commissie Dierproeven (CCD) and the Instantie voor
Dierenwelzijn (IvD).
Cranial imaging window (CIW) surgery and tumor cell injection. CIW surgery and tumor cell injec-
tion were performed at the same day as described31,62. Briefly, mice were sedated with Hypnorm (Fluanison [neu-
roleptic] + Fentanyl [opioid]) (0.4 ml/kg) + Midazolam [benzodiazepine sedative] (2 mg/kg) at a dose of 1:1:2 in
sterile water and mounted in a stereotactic frame. The head was secured using a nose clamp and two ear bars. The
head was shaved and the skin was cut in a circular manner. The mouse was placed under a stereo-microscope to
ensure precise surgical manipulation. The periosteum was scraped and a circular groove of 5 mm diameter was
drilled over the right parietal bone. The bone flap was lifted under a drop of cortex buffer (125 mM NaCl, 5 mM
KCl, 10 mM glucose, 10 mM HEPES buffer, 2 mM MgSO4 and 2 mM CaCl2, pH 7.4) and the dura mater was
removed. Gelfoam sponge (Pfizer) was used to stop bleeding. (Supplementary Fig. 7).
Next, 1 × 10⁵ BTIC H2B-Dendra2 cells suspended in 3 μl of PBS were injected stereotactically using a 10 μl
Hamilton syringe with a 2 pt style in the middle of the craniotomy at a depth of 0.5 mm. The exposed brain was
sealed with silicone oil and a 6 mm coverslip glued on top. Dental acrylic cement (Vertex) was applied on the skull
surface, covering the edge of the coverslip and a stainless steel ring was glued around the coverslip to provide fix-
ation to the microscope. A single dose of 100 μg/kg of buprenorphine (Temgesic, BD pharmaceutical limited) was
administered. Mice were closely monitored twice per week for behavior, reactivity and appearance.
Intravital imaging. Mice were imaged as previously described31. In short, mice were sedated and placed
face-up in a custom-designed imaging box. Time-lapse images of the entire tumor volume were acquired for a
maximum of 13 hours. The minimal time interval between serial images was set to 45 minutes. For tile-scans,
images of the complete z-stack of the tumor were acquired to a depth of 300 μm, with a step size of 3 µm (typi-
cally 70–100 images in each z-stack). In a group of 4 mice, blood vessels were imaged by intravenous injection of
70 kDa Dextran–Texas Red (Invitrogen Life Technologies) or 2.000.000 kDa Dextran-Rhodamine (Thermofisher
scientific).
Imaging was performed on an inverted Leica SP8 multiphoton microscope with a chameleon Vision-S
(Coherent Inc., Santa Clare, CA, www.coherent.com), equipped with a 25 x water objective (HCX IRAPO NA0.95
WD 2.5 mm) with four HyD detectors: HyD1 (560–650 nm), HyD2 (500–550 nm), HyD3 (455–490 nm), and
HyD4 (www.nature.com/scientificreports/
Image processing and analysis. For 3D visualization, shift correction, rendering and data analysis
time-lapse movies were processed with Imaris (Bitplane, Switzerland). The Spot Analysis module was used for
semi-automated tracking of cell motility in three dimensions and for shift correction. Data containing the coor-
dinates of each cell, the values of cell direction, speed (per time unit) and velocity (the vector of movement) was
exported and processed and plotted in GraphPad or R. As the animal’s pulse and breathing can cause motion arti-
facts, we decided that only cells with a velocity (displacement) more than 2.0 µm/hour were classified as motile.
Regions with distinct patterns of invasion were defined as described above by visual assessment of the first
frame of the movies. Only regions with a clear invasive pattern were included in the analysis.
The windrose plot representing cell direction and speed was created using R package “openair”63. To measure
the individual cell and center of mass displacement perpendicular to the tumor border the ‘Chemotaxis and
Migration Tool’ (Ibidi GmbH) was used64. The results of Imaris tracking were converted in 2D along the x and y
axes and directly imported into the ‘Chemotaxis and Migration Tool’ software tool. The cell trajectories were all
extrapolated to (x, y) = 0 at time 0 h (Fig. 2a) to visualize the trajectories of each cell with a common origin. Next
the cell trajectories were rotated for each position using “Data rotation” tab of the software in order to get the
tumor margin parallel to the x axis (as in Fig. 4b). The tumor margin was defined as the tangent drawn to the main
tumor mass. For each cell trajectory the angle of cell displacement vector in respect to the x axes (tumor border)
was extracted using the ‘Chemotaxis and Migration Tool’. Finally individual cell displacement perpendicular to
the tumor border was measured as:
Yaxes displacement = Cell velocity × sin(anglerelative to tumor boder )
The spatial average of all cell positions was used to measure the center of mass displacement perpendicular to
the tumor border. For each position the difference in the center of mass along the Y axes between its initial value
and that at the end of the experiment was measured by means of the ‘Chemotaxis and Migration Tool’. This meas-
ure represented per unit of time was termed the displacement of center of mass (COMy), where n is the number
of cells per individual position:
1 n 1 n
Mstart = ∑ (y ) = (0); Mend = n ∑ i=1(yi ,end )
n i =1 i , start
Mend − Mstart
COMy =
hour
3D tile scan projections were used for illustration of different border configurations. For illustration of tumor
cell migration, 3D images were tracked manually with an ImageJ plugin (“MTrackJ” Rasband, W.S., ImageJ, U.S.
NIH, Bethesda, Maryland, USA).
The identities of leader and follower cells were defined at the first frame of the time-lapse and were maintained
through all the movie. The first cells protruding from an invasive margin morphology were defined as “leader”.
All the consequent cells from the invasive margin were defined as “follower”. The direction correlation between
leader and follower cells of the invasive margin was calculated as the cosine of the angle of the leader cell and all
the follower cell paths (Fig. 3a). Values close to 1 indicate correlation of direction, while values close to −1 indi-
cate opposite direction correlation.
As i.v. injected Dextran reagents leak out of the vessels in the course of time, blood vessel structure from the
first time point was applied to all time points for illustration of the blood vessels in the time-lapse stills.
Patient glioblastoma samples. Archives of the Department of Neuropathology, University Hospital
Regensburg, were reviewed for glioblastoma cases sampled with parts of the infiltrative rim and representing
a spectrum of infiltration patterns observed in the mouse glioblastoma window model. Immunohistochemical
staining was performed in context of the routine diagnostic work-up of the samples following a standard proto-
col65. Antibodies used were as follows: GFAP (Clone 6F2), Dako #M0761, 1:200 dilution; p53(Clone BP53-12)
Santa Cruz Biotechnology #SC-263, 1:2000 dilution; Ki-67(Clone MIB-1) Dako #M7240, 1:200 dilution.
Statistical analysis. For all normally distributed measurements, the Student’s t test (comparison of two
mean values) or one-way ANOVA (when >2 means were compared) were used to determine significance, set to
p < 0.05. Post-hoc tests were performed with p values < 0.05. All p values were two-tailed. Levels of significance
were set as follows: nsp > 0.05, *0.05 ≤ p > 0.01, **0.01 ≤ p > 0.001, ***0.001 ≤ p > 0.0001, ****p ≤ 0.0001. Error
bars are presented as ± S.E.M. All statistical analysis were performed using GraphPad Prism software (version 6,
GraphPad Software, USA).
Data Availability
The authors declare that all data supporting the findings of this study are available within the article and its Sup-
plementary Information files, or from the corresponding author (MA) upon request.
References
1. Omuro, A. & DeAngelis, L. M. Glioblastoma and Other Malignant Gliomas: A Clinical Review. JAMA 310, 1842–1850 (2013).
2. Stupp, R. et al. Effects of radiotherapy with concomitant and adjuvant temozolomide versus radiotherapy alone on survival in
glioblastoma in a randomised phase III study: 5-year analysis of the EORTC-NCIC trial. Lancet Oncol. 10, 459–466 (2009).
3. Stupp, R. et al. Maintenance Therapy With Tumor-Treating Fields Plus Temozolomide vs Temozolomide Alone for Glioblastoma.
Jama 314, 2535 (2015).
Scientific Reports | (2019) 9:2054 | https://doi.org/10.1038/s41598-019-38625-4 9www.nature.com/scientificreports/
4. Stupp, R. et al. Effect of tumor-treating fields plus maintenance temozolomide vs maintenance temozolomide alone on survival in
patients with glioblastoma a randomized clinical trial. JAMA - J. Am. Med. Assoc. 318, 2306–2316 (2017).
5. Verhaak, R. G. W. et al. Integrated genomic analysis identifies clinically relevant subtypes of glioblastoma characterized by
abnormalities in PDGFRA, IDH1, EGFR, and NF1. Cancer Cell 17, 98–110 (2010).
6. Noushmehr, H. et al. Identification of a CpG island methylator phenotype that defines a distinct subgroup of glioma. Cancer Cell 17,
510–22 (2010).
7. Singh, S. K. et al. Identification of a cancer stem cell in human brain tumors. Cancer Res. 63, 5821–5828 (2003).
8. Galli, R. et al. Isolation and characterization of tumorigenic, stem-like neural precursors from human glioblastoma. Cancer Res. 64,
7011–21 (2004).
9. Das, S., Srikanth, M. & Kessler, Ja Cancer stem cells and glioma. Nat. Clin. Pract. Neurol. 4, 427–35 (2008).
10. Sundar, S. J., Hsieh, J. K., Manjila, S., Lathia, J. D. & Sloan, A. The role of cancer stem cells in glioblastoma. Neurosurg. Focus 37, E6
(2014).
11. Singh, S. K. et al. Identification of human brain tumour initiating cells. Nature 432, 396–401 (2004).
12. Cuddapah, V. A., Robel, S., Watkins, S. & Sontheimer, H. A neurocentric perspective on glioma invasion. Nat. Rev. Neurosci. 15,
455–65 (2014).
13. Medema, J. P. Cancer stem cells: the challenges ahead. Nat. Cell Biol. 15, 338–44 (2013).
14. Vescovi, A. L., Galli, R. & Reynolds, Ba Brain tumour stem cells. Nat. Rev. Cancer 6, 425–36 (2006).
15. Moeckel, S. et al. Response-predictive gene expression profiling of glioma progenitor cells in vitro. PLoS One 9, e108632 (2014).
16. Louis, D. N. Molecular pathology of malignant gliomas. Annu. Rev. Pathol. 1, 97–117 (2006).
17. Sahm, F. et al. Addressing Diffuse Glioma as a Systemic Brain Disease With Single-Cell Analysis. Arch Neurol 69, 523–526 (2012).
18. Claes, A., Idema, A. J. & Wesseling, P. Diffuse glioma growth: a guerilla war. Acta Neuropathol. 114, 443–58 (2007).
19. Kim, J. et al. Spatiotemporal Evolution of the Primary Glioblastoma Genome. Cancer Cell 28, 318–28 (2015).
20. Bellail, A. C., Hunter, S. B., Brat, D. J., Tan, C. & Van Meir, E. G. Microregional extracellular matrix heterogeneity in brain modulates
glioma cell invasion. Int. J. Biochem. Cell Biol. 36, 1046–69 (2004).
21. Demuth, T. & Berens, M. E. Molecular mechanisms of glioma cell migration and invasion. J. Neurooncol. 70, 217–28 (2004).
22. Winkler, F. et al. Imaging glioma cell invasion in vivo reveals mechanisms of dissemination and peritumoral angiogenesis. Glia 57,
1306–1315 (2009).
23. Rørth, P. Fellow travellers: emergent properties of collective cell migration. EMBO Rep. 13, 984–991 (2012).
24. Haeger, A., Krause, M., Wolf, K. & Friedl, P. Cell jamming: Collective invasion of mesenchymal tumor cells imposed by tissue
confinement. Biochim. Biophys. Acta - Gen. Subj. 1840, 2386–2395 (2014).
25. Iwadate, Y. Epithelial-mesenchymal transition in glioblastoma progression (Review). Oncol. Lett. 38, 739–40 (2016).
26. Hoelzinger, D. B. et al. Gene expression profile of glioblastoma multiforme invasive phenotype points to new therapeutic targets.
Neoplasia 7, 7–16 (2005).
27. Nevo, I. et al. Identification of molecular pathways facilitating Glioma cell invasion in situ. PLoS One 9 (2014).
28. Bonneh-Barkay, D. & Wiley, C. A. Brain extracellular matrix in neurodegeneration. Brain Pathol. 19, 573–85 (2009).
29. Lau, L. W., Cua, R., Keough, M. B., Haylock-Jacobs, S. & Yong, V. W. Pathophysiology of the brain extracellular matrix: a new target
for remyelination. Nat. Rev. Neurosci. 14, 722–729 (2013).
30. Valster, A. et al. Cell migration and invasion assays. Methods 37, 208–15 (2005).
31. Alieva, M. et al. Preventing inflammation inhibits biopsy-mediated changes in tumor cell behavior. Sci. Rep. 7, 7529 (2017).
32. Zomer, A. et al. In Vivo Imaging Reveals Extracellular Vesicle-Mediated Phenocopying of Metastatic Behavior. Cell 161, 1046–1057
(2015).
33. Beerling, E. et al. Plasticity between Epithelial and Mesenchymal States Unlinks EMT from Metastasis-Enhancing Stem Cell
Capacity. Cell Rep. 2281–2288, https://doi.org/10.1016/j.celrep.2016.02.034 (2016).
34. Osswald, M. et al. Impact of blood-brain barrier integrity on tumor growth and therapy response in brain metastases. Clin. Cancer
Res. 22, 6078–6087 (2016).
35. Alieva, M., Ritsma, L., Giedt, R. J., Weissleder, R. & van Rheenen, J. Imaging windows for long-term. intravital imaging. IntraVital 3,
e29917 (2014).
36. Patsialou, A. et al. Intravital multiphoton imaging reveals multicellular streaming as a crucial component of in vivo cell migration in
human breast tumors Antonia. IntraVital 2, 1–29 (2014).
37. Entenberg, D. et al. A permanent window for the murine lung enables high- resolution imaging of cancer metastasis. 15, 73–80 (2018).
38. Orth, J. D. et al. Analysis of mitosis and antimitotic drug responses in tumors by In Vivo microscopy and single-cell
pharmacodynamics. Cancer Res. 71, 4608–4616 (2011).
39. Miller, M. A. & Weissleder, R. Imaging the pharmacology of nanomaterials by intravital microscopy: Toward understanding their
biological behavior. Adv. Drug Deliv. Rev. 113, 61–86 (2017).
40. Suijkerbuijk, S. J. E. & van Rheenen, J. From good to bad: Intravital imaging of the hijack of physiological processes by cancer cells.
Dev. Biol. 1–10, https://doi.org/10.1016/j.ydbio.2017.04.015 (2017).
41. Leidgens, V. et al. Stattic and metformin inhibit brain tumor initiating cells by reducing STAT3-phosphorylation. Oncotarget 3,
8250–8263 (2017).
42. Quail, D. F. & Joyce, J. A. The Microenvironmental Landscape of Brain Tumors. Cancer Cell 31, 326–341 (2017).
43. Gu, L. & Mooney, D. J. Biomaterials and emerging anticancer therapeutics: engineering the microenvironment. Nat. Rev. Cancer 16,
56–66 (2015).
44. Pegtel, D. M. et al. The Par-Tiam1 Complex Controls Persistent Migration by Stabilizing Microtubule-Dependent Front-Rear
Polarity. Curr. Biol. 17, 1623–1634 (2007).
45. Friedl, P. & Alexander, S. Cancer invasion and the microenvironment: plasticity and reciprocity. Cell 147, 992–1009 (2011).
46. Rao, S. S. et al. Mimicking white matter tract topography using core-shell electrospun nanofibers to examine migration of malignant
brain tumors. Biomaterials 34, 5181–5190 (2013).
47. Cheung, K. J., Gabrielson, E., Werb, Z. & Ewald, A. J. Collective invasion in breast cancer requires a conserved Basal epithelial
program. Cell 155, 1639–51 (2013).
48. Gritsenko, P., Leenders, W. & Friedl, P. Recapitulating in vivo-like plasticity of glioma cell invasion along blood vessels and in
astrocyte-rich stroma. Histochem. Cell Biol. 148, 395–406 (2017).
49. Osswald, M. et al. Brain tumour cells interconnect to a functional and resistant network. Nature 528, 93–98 (2015).
50. Hoelzinger, D. B., Demuth, T. & Berens, M. E. Autocrine factors that sustain glioma invasion and paracrine biology in the brain
microenvironment. J. Natl. Cancer Inst. 99, 1583–1593 (2007).
51. Scarpa, E. & Mayor, R. Collective cell migration in development. J. Cell Biol. 212, 143–155 (2016).
52. Sahai, E. Mechanisms of cancer cell invasion. Curr. Opin. Genet. Dev. 15, 87–96 (2005).
53. Brock, A., Krause, S. & Ingber, D. E. Control of cancer formation by intrinsic genetic noise and microenvironmental cues. Nat. Rev.
Cancer 15, 499–509 (2015).
54. Fayzullin, A. et al. Time-lapse phenotyping of invasive glioma cells ex vivo reveals subtype-specific movement patterns guided by
tumor core signaling. Exp. Cell Res. 349, 199–213 (2016).
55. Parker, J. J., Lizarraga, M., Waziri, A. & Foshay, K. M. A Human Glioblastoma Organotypic Slice Culture Model for Study of Tumor
Cell Migration and Patient-specific Effects of Anti-Invasive Drugs. J. Vis. Exp. 1–10, https://doi.org/10.3791/53557 (2017).
Scientific Reports | (2019) 9:2054 | https://doi.org/10.1038/s41598-019-38625-4 10www.nature.com/scientificreports/
56. Ren, B. et al. Invasion and anti-invasion research of glioma cells in an improved model of organotypic brain slice culture. Tumori
101, 390–397 (2015).
57. Weil, S. et al. Tumor microtubes convey resistance to surgical lesions and chemotherapy in gliomas. Neuro. Oncol. 19, 1316–1326
(2017).
58. Gaggioli, C. et al. Fibroblast-led collective invasion of carcinoma cells with differing roles for RhoGTPases in leading and following
cells. Nat. Cell Biol. 9, 1392–1400 (2007).
59. Harney, A. S. et al. Real-Time Imaging Reveals Local, Transient Vascular Permeability, and Tumor Cell Intravasation Stimulated by
TIE2hi Macrophage-Derived VEGFA. Cancer Discov. 5, 932–943 (2015).
60. Weller, M. et al. Glioma. Nat. Rev. Dis. Prim. 15017, https://doi.org/10.1038/nrdp.2015.17 (2015).
61. Gurskaya, N. G. et al. Engineering of a monomeric green-to-red photoactivatable fluorescent protein induced by blue light. Nat.
Biotechnol. 24, 461–465 (2006).
62. Alieva, M., Ritsma, L., Giedt, R. J., Weissleder, R. & van Rheenen, J. Imaging windows for long-termintravital imaging. IntraVital 3,
e29917 (2014).
63. Carslaw, D. C. & Ropkins, K. Environmental Modelling & Software openair d An R package for air quality data analysis. Environ.
Model. Softw. 27–28, 52–61 (2012).
64. Trapp G, H. E. Chemotaxis and Migration Tool. Ibidi cells Focus (2014).
65. Hoja, S. et al. Molecular dissection of the valproic acid effects on glioma cells. Oncotarget, https://doi.org/10.18632/oncotarget.11379
(2016).
Acknowledgements
We thank Martin Proescholdt, Department of Neurosurgery, University of Regensburg, Regensburg, Germany, for
collaboration and providing the patient tumor material for BTIC generation. We cordially thank Birgit Jachnik,
Department of Neurology, University Hospital Regensburg, Regensburg, Germany, for excellent technical
assistance in establishment and cultivation of BTIC. This study was partly supported by the Bavarian Program
for promotion of equal opportunities for women in research and teaching (to V.L.), the Wilhelm Sander-Stiftung,
Munich and Ingolstadt, Germany (to P.H.), European Research Council Grant CANCER-RECURRENCE 648804
(to J.v.R.), the CancerGenomics.nl (Netherlands Organisation for Scientific Research) program (to J.v.R.), the
Doctor Josef Steiner Foundation (to J.v.R) and the European Union’s Horizon 2020 research and innovation
program under the Marie Sklodowska-Curie grant agreement No 642866 (to J.v.R).
Author Contributions
M.A. contributed to the concept of the study, performed the in vivo assays and data analysis and wrote the paper;
V.L. contributed to the concept of the study, performed the in vivo assays and wrote the paper; M.J.R. contributed
to human in vivo data on translational aspects and edited the paper; C.K. contributed to the concept of the study
and edited the paper; P.H. contributed to the concept of the study, characterized the BTIC lines and wrote and
edited the paper; J.v.R. contributed to the concept of the study, supervised the in vivo experimental work, and
wrote and edited the paper.
Additional Information
Supplementary information accompanies this paper at https://doi.org/10.1038/s41598-019-38625-4.
Competing Interests: The authors declare no competing interests.
Publisher’s note: Springer Nature remains neutral with regard to jurisdictional claims in published maps and
institutional affiliations.
Open Access This article is licensed under a Creative Commons Attribution 4.0 International
License, which permits use, sharing, adaptation, distribution and reproduction in any medium or
format, as long as you give appropriate credit to the original author(s) and the source, provide a link to the Cre-
ative Commons license, and indicate if changes were made. The images or other third party material in this
article are included in the article’s Creative Commons license, unless indicated otherwise in a credit line to the
material. If material is not included in the article’s Creative Commons license and your intended use is not per-
mitted by statutory regulation or exceeds the permitted use, you will need to obtain permission directly from the
copyright holder. To view a copy of this license, visit http://creativecommons.org/licenses/by/4.0/.
© The Author(s) 2019
Scientific Reports | (2019) 9:2054 | https://doi.org/10.1038/s41598-019-38625-4 11You can also read