Routing algorithms as tools for integrating social distancing with emergency evacuation
←
→
Page content transcription
If your browser does not render page correctly, please read the page content below
Routing algorithms as tools for integrating social distancing with
                                                                                     emergency evacuation

                                                Yi-Lin Tsai1,* , Chetanya Rastogi2 , Peter K. Kitanidis1,3,4 , and Christopher B. Field3,5,6

                                         1
                                             Department of Civil and Environmental Engineering, Stanford University, Stanford, CA, USA
arXiv:2103.03413v2 [cs.AI] 3 May 2021

                                                        2
                                                            Department of Computer Science, Stanford University, Stanford, CA, USA
                                                    3
                                                        Woods Institute for the Environment, Stanford University, Stanford, CA, USA
                                         4
                                             Institute for Computational and Mathematical Engineering, Stanford University, Stanford, CA,
                                                                                                     USA
                                                                5
                                                                    Department of Biology, Stanford University, Stanford, CA, USA
                                                    6
                                                        Department of Earth System Science, Stanford University, Stanford, CA, USA
                                                                                         *
                                                                                             Corresponding author

                                                                                                May 5, 2021

                                                                                                   Abstract

                                                  We explore the implications of integrating social distancing with emergency evacuation, as would be expected
                                               when a hurricane approaches a city during the COVID-19 pandemic. Specifically, we compare DNN (Deep Neural
                                               Network)-based and non-DNN methods for generating evacuation strategies that minimize evacuation time while
                                               allowing for social distancing in emergency vehicles. A central question is whether a DNN-based method provides
                                               sufficient extra routing efficiency to accommodate increased social distancing in a time-constrained evacuation
                                               operation. We describe the problem as a Capacitated Vehicle Routing Problem and solve it using a non-DNN
                                               solution (Sweep Algorithm) and a DNN-based solution (Deep Reinforcement Learning). The DNN-based solution
                                               can provide decision-makers with more efficient routing than the typical non-DNN routing solution. However, it
                                               does not come close to compensating for the extra time required for social distancing, and its advantage disappears
                                               as the emergency vehicle capacity approaches the number of people per household.

                                                  Keywords: deep reinforcement learning, multi-hazard risk mitigation and management, compound disaster
                                        preparedness and response, human-centered AI, social distancing, COVID-19, pandemic

                                                                                                       1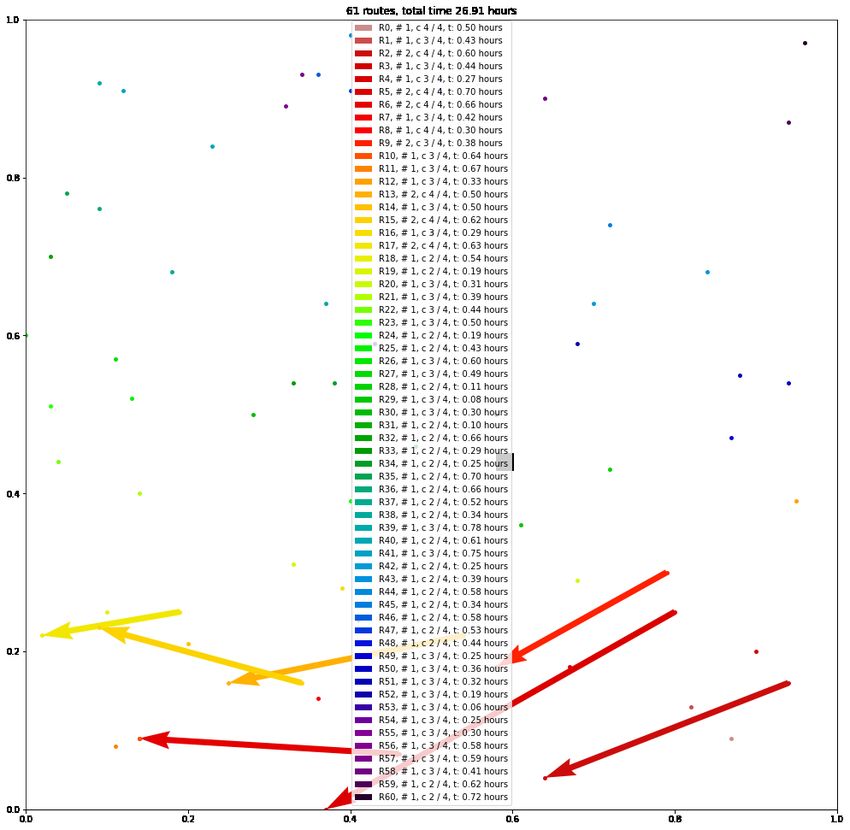
Introduction

Background

As of May 3, 2021, COVID-19 had caused over 153 million confirmed cases and over 3.2 million deaths around the
world1 . However, floods, wildfires, earthquakes, and landslides do not take a break during a pandemic. We have
to prepare for the challenges of responding to a catastrophe like a major hurricane while also managing the risk
of spreading severe acute respiratory syndrome coronavirus 2 (SARS-CoV-2)2 . More generally, we must prepare
for multiple overlapping disasters3 . Furthermore, the complexity of evacuation operations and shelter management
increases when a major disaster happens during a pandemic4–8 . Social distancing is an indispensable containment
measure against the spread of SARS-CoV-29,10 and many other agents that could lead to pandemics. Maintaining
social distancing during rescue operations is a logistical and time-management challenge.

         Although governments worldwide are ramping up COVID-19 vaccination, many challenges remain. Fur-
thermore, integrating social distancing with emergency evacuation is relevant to planning for future disasters even
after COVID-19 fades as a major risk. Looking beyond COVID-19, we need to be ready for the next pandemic,
especially given the fact that increasing emergence and transmission of infectious diseases and pandemics, such as
influenza, SARS-CoV-1, and SARS-CoV-2, have been associated with climate change for several decades11–14 . One
of the important lessons from COVID-19 is the need to anticipate future pandemics and take social distancing into
account in compound-disaster preparedness and response.

         Here, we focus on the interaction of social distancing and flood evacuation scheduling during a pandemic.
As of April 8, 2021, tropical cyclones are the weather and climate disasters in the U.S. that led to the largest economic
losses ($1,011.3 billion, CPI-adjusted to 2021 prices), the highest number of deaths (6,593 people), and the highest
average event cost ($19.4 billion per event, in 2021 prices) from 1980 to 202115 . 30.1 million people were affected
and 3,134 people were killed worldwide by 65 flood events that overlapped with the COVID-19 pandemic in 202016 .

         The Natural Hazard Mitigation Saves Study17 found that every dollar invested by federal agencies in disaster
mitigation saves society $6 in post-disaster recovery costs, but spending on disaster recovery is almost nine times
higher than on disaster prevention18 . The much better benefit to cost ratio of effective preparation than recovery is
a strong argument for studying ways to improve evacuation planning. One possibility is that DNN-based methods
can add substantial efficiency to emergency evacuation route planning.

         Machine learning and deep neural networks (DNN) find diverse applications in Earth system science studies
to build new data-driven models. Examples include identifying extreme weather patterns, predicting river runoff
in ungauged catchments, and precipitation nowcasting19–22 . These state-of-the-art geoscientific tools help us better
predict important phenomena. Increasingly, we can use deep neural networks to improve behavioral responses to
these weather and climate disasters. In particular, machine learning and DNN-based techniques have the poten-
tial to enhance climate change mitigation and adaptation, from smart buildings and climate modeling to disaster
management23 .

                                                           2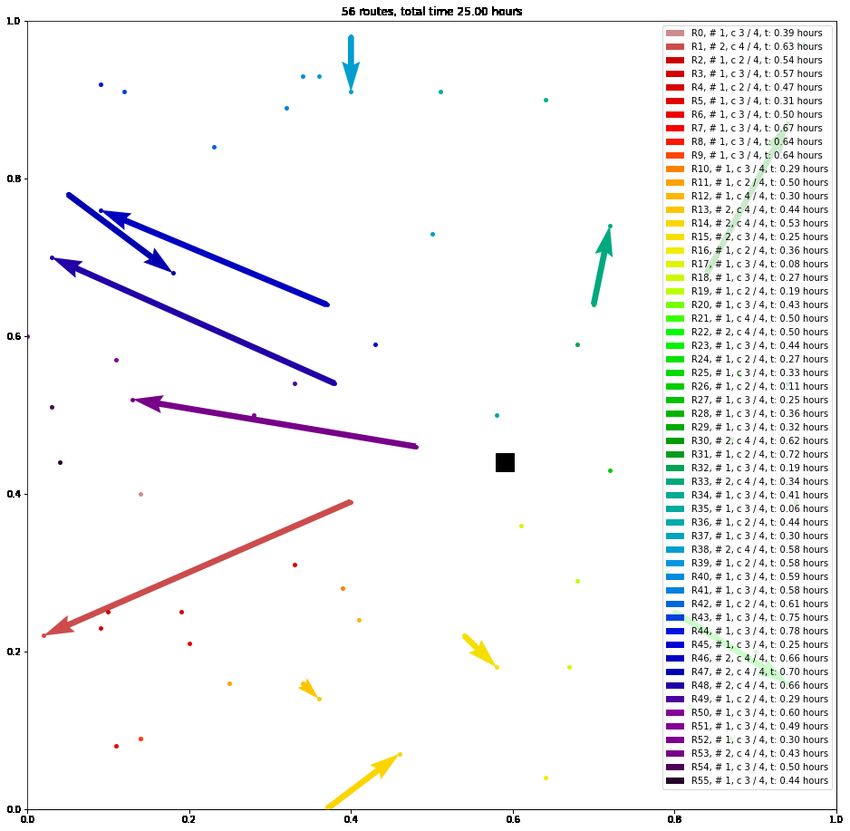
Deep reinforcement learning, combining traditional reinforcement learning and deep neural networks, has
been widely applied to computer games, self-driving cars, the game of Go, and robotics24–28 . Applications of deep
reinforcement learning to facilitate disaster responses are beginning to appear in the literature29–36 . In any disaster
situation, the efficient delivery of assistance can contribute to limiting damages37–40 . However, to the best of our
knowledge, none of the existing research applies the state-of-the-art deep reinforcement learning to enhance the
routing efficiency of disaster evacuation operations during a pandemic.
This study aims to improve evacuation operations in compound events that involve both a pandemic and
a well-forecast disaster like a major hurricane. Specifically, we investigate the role of social distancing in extending
evacuation timelines and increasing the number of emergency vehicles to evacuate a city, and we explore the potential
to increase evacuation efficiency through using optimized vehicle routing based on a DNN-based method (deep
reinforcement learning)41 and a non-DNN method.
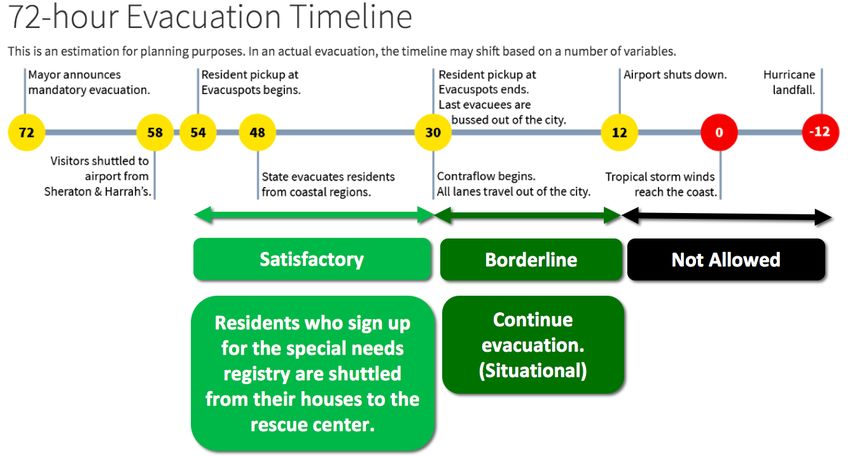
We chose New Orleans as the inspiration and case study, starting with its plans, population, and area
though not the specifics of its geography. New Orleans has a 72-hour hurricane evacuation timeline, which plans to
pick up, from their homes, evacuees who signed up for the Special Needs Registry and transport them to the city-wide
rescue center, the Smoothie King Center, during a 42-hour window before tropical storm winds reach the coast42,43
(see “Methods”). Therefore, we can describe this pre-hurricane evacuation process as a Capacitated Vehicle Routing
Problem (CVRP) where there is one vehicle repeating the process of starting from a local rescue center, going to
several houses to pick up people, and returning to the rescue center when its vehicle capacity is reached, until the
vehicle picks up every resident in the neighborhood (see “Methods”).
The application is relevant to a setting where every resident is evacuated, but it could also be used to target
a known population of elderly or disabled individuals on a special needs registry. For instance, the elderly are usually
more vulnerable in flood events, as documented for Hurricane Katrina and the 1953 flood in the Netherlands44–46 .
People with disabilities are less likely to move to a rescue center by themselves and thus need more assistance from
rescue teams during a flood event.
Evacuation planning: balancing multiple priorities
The COVID-19 pandemic adds significantly to the complexities of evacuation planning and execution. Craig Fugate,
a former Federal Emergency Management Agency (FEMA) Administrator, said47 , “We’ve been telling people: stay
home, stay home, stay home, stay home. And then you’re going to turn around and tell them they need to evacuate.
That’s going to be a hard message.” Also, according to FEMA’s COVID-19 Supplement for Planning Considerations:
Evacuation and Shelter-in-Place, one of the critical questions for state, local, tribal, and territorial governments is
“Have you incorporated social distancing considerations when calculating evacuation clearance time (e.g., reduced
load capacity, additional vehicles, increased loading time)?48 ” However, to the best of our knowledge, there is no
previous research that aims to help jurisdictions answer this question.
3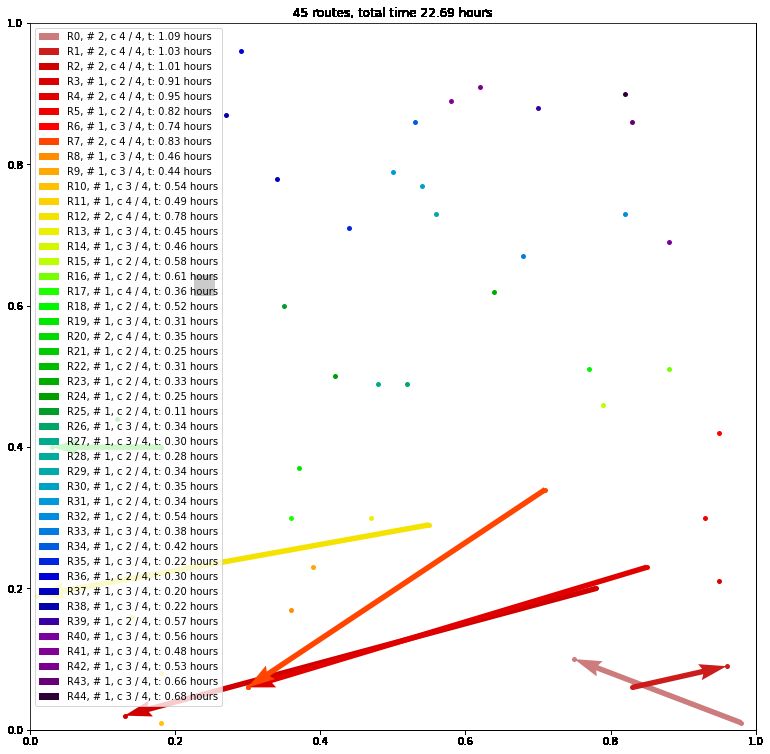
Although New Orleans asks evacuees to include face coverings in their “go-bag”42 , social distancing is still
important. But social distancing, implemented through decreasing the number of people per rescue vehicle, adds to
the time and distance vehicles need to cover. To assess the feasibility of social distancing as part of an evacuation
operation, we explore: (1) total time of picking up and transporting evacuees from their houses to a rescue center; (2)
sizes of neighborhood that one emergency vehicle serves for evacuation operations; (3) degrees of social distancing
enforced in an emergency vehicle; and (4) the number of emergency vehicles needed to evacuate the whole city.

Results

Trade-offs in size of neighborhood and social distancing

In this section, we analyzed the trade-offs in size of neighborhood and social distancing by simulating the CVRP
process of an emergency vehicle repeatedly starting from a rescue center to collect residents house by house until its
vehicle capacity is met. In this study, we used the locations of nodes (or “houses”) and a depot (a rescue center) in
the standard CVRP benchmarking datasets published by49,50 . We generated the demand of each node (household
size or the number of people in each house to be picked up by the rescue vehicle) using the average household size in
New Orleans (see “Methods”). The sizes of neighborhood in the four datasets we used in this study were 20, 35, 52,
and 68 houses. Social distancing limited the number of passengers allowed in one rescue vehicle, with capacities of
64, 32, 16, 8, 4, and 2 passengers per rescue vehicle. One can think of this range of vehicle capacities as representing
the span from no social distancing to very strict social distancing in a large bus. But it can also be a way to explore
modest distancing (2- to 4-fold capacity changes) in vehicles ranging from a large bus to a small van or sedan.

         After the emergency vehicle picked up every resident in the neighborhood, we summed the total time and
the number of routes as the outputs (see Supplementary information for more information about the outputs). Figure
1 is an example of the output.

                                                           4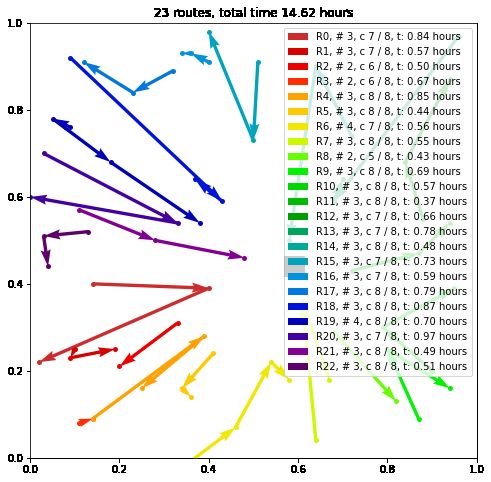
a DNN-based Solution                                         b Non-DNN Solution

Figure 1: An example of DNN-based and non-DNN solutions. Information in each legend box is in the
format41 “R0, #6, c 14/16, t: 0.86 hours”. R0 is the first route, R1 is the second, etc. “#6” means that the emergency
vehicle visits 6 houses in that route. “c 14/16” indicates that the emergency vehicle whose passenger capacity is 16
people picks up 14 people in route R0. Finally, “t: 0.86 hours” means that the emergency vehicle spends 0.86 hours
in route R0. To make the routing pattern easy to read41 , we hide the first and the last line going from and back to
the black square, which represents the transition point for transit to the depot. The total time and the number of
routes required to pick up every resident are shown at the top of Fig. 1. This example is for vehicle capacity = 16
and transit time = 0.
                                                          .

          New Orleans plans to pick up residents starting 54 hours before the storm reaches the coast and collect
the last residents by 30 hours before the storm reaches the coast, for a 24-hour window (Fig. 2)42,43 . Between 30
hours and 12 hours before the storm reaches the coast, the city may continue the evacuation operation if necessary43 .
Therefore, to evaluate the performance of the DNN-based and non-DNN models, we used 42 hours and 24 hours as
the thresholds to determine if the vehicle completed the evacuation missions within the desired timelines. Further,
we classified the time performance as Satisfactory (42
hours).

          To accommodate the transit time required to travel from each neighborhood to the centrally located
Smoothie King Center and back, we added 0, 0.5, 1, or 2 hours to each evacuation route. In a realistic city layout,
transit times would differ among neighborhoods, but they should be similar for each route within a neighborhood.
With zero transit time, the de facto assumption is that the Smoothie King Center is in each neighborhood. With
additional fixed transit time per route, the black squares in Fig. 1 and other figures in Supplementary informa-

                                                          5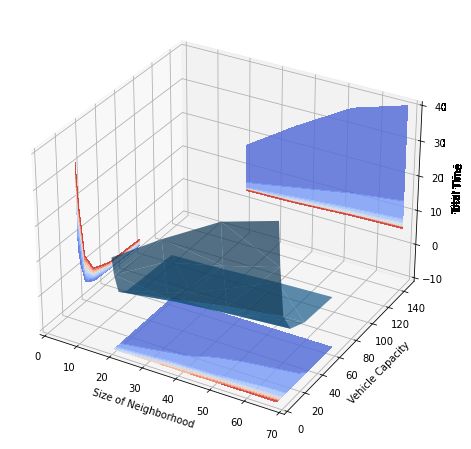
tion represent the closest freeway on-ramp or intersection with a major thoroughfare, marking the transition from
collecting people within a neighborhood to transporting people to the Smoothie King Center.

Figure 2: 72-hour Evacuation Timeline in New Orleans. This pre-hurricane evacuation timeline is adapted
from42,43 .
                                                           .

Size of neighborhood

With any level of capacity per rescue vehicle (social distancing), the total time for evacuations increased as the size
of neighborhood increased (Fig. 3). The total time of both DNN-based and non-DNN solutions rose more steeply
with stronger social distancing across all sizes of neighborhood. For example, with 32 people in an emergency vehicle
instead of 64, increasing the neighborhood size from 20 houses to 68 (a factor of 3.4), increased the total time by
1.89 hours and 4.79 hours for DNN-based and non-DNN solutions respectively. However, with more stringent social
distancing (2 people per vehicle), increasing the neighborhood size from 20 houses to 68, increased the total time by
23.37 hours and 22.18 hours for DNN-based and non-DNN solutions respectively.

                                                          6
a DNN-based Solution                                      b Non-DNN Solution

Figure 3: Impacts of neighborhood size and vehicle capacity on total time. (x axis: size of neighborhood
(unit: the number of houses), y axis: vehicle capacity due to social distancing (unit: people per vehicle), z axis: total
time (unit: hours))

         The average total time across six vehicle capacities (2, 4, 8, 16, 32, and 64 people per emergency vehicle) and
two algorithms (deep reinforcement learning and sweep algorithm) rises with the neighborhood size, and the change is
linearly proportional to the change in neighborhood size (Fig. 4). For example, with 16 people per emergency vehicle,
increasing the neighborhood size from 20 houses to 68 (a factor of 3.4), increased the total time by 2.37-fold and
2.97-fold for cases with the minimum (+0 hour/route) and the maximum (+2 hours/route) transit time respectively.
Compared to the cases without adding any transit time to each route, the relationship between neighborhood size
and the average total time is closer to linearly proportional in the cases with longer transit time adding to each route.

         Without adding any transit time to each route, a disaster manager can evacuate everyone in all sizes
of neighborhood within 24 hours (achieving the Satisfactory threshold) (Fig. 4). In addition, the smaller the
neighborhood size, the more likely every resident can be evacuated within 24 hours (Satisfactory threshold) and 42
hours (Borderline threshold). With a transit time of two hours per route, only the smallest neighborhood can be
fully evacuated by the end of 42 hours. Of course, the trade-off is that dividing a city into smaller neighborhoods
increases the number of neighborhoods to evacuate.

                                                           7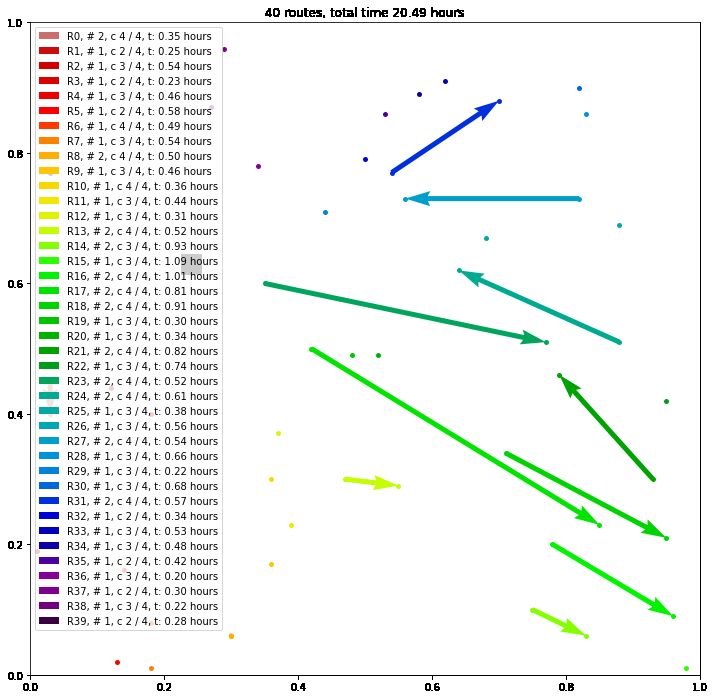
Figure 4: Trade-offs between size of neighborhood and average evacuation time. The y-axis is the average
time across both algorithms and all vehicle capacities (passenger limit= 2, 4, 8, 16, 32, and 64 people per emergency
vehicle). The red dashed line represents the 42-hour window (54-12 hours before tropical storm winds reach the
coast) while the yellow dashed line represents the 24-hour window (54-30 hours before tropical storm winds reach
the coast).

Social distancing

As expected, for any neighborhood size, algorithm, and transit time, stricter social distancing increases the total
evacuation time (Fig. 5). For the strictest social distancing (2 people per vehicle), the evacuation time is less
than 42 hours only when transit time is zero. With milder social distancing (32 people per vehicle), the sensitivity
of evacuation time to passenger limit is approximately the same in the DNN-based and non-DNN solutions. For
example, without any additional transit time per evacuation route, decreasing vehicle capacity from 64 to 32 increases
evacuation time 1.13-1.17-fold and 1.12-1.23-fold in DNN-based- and non-DNN solution respectively. However, with
stricter social distancing, evacuation times for the DNN-based solutions are more sensitive to vehicle capacity than
are the non-DNN solutions (Fig. 5). Across the full range of neighborhood sizes, decreasing vehicle capacity from 64
to 2 increases evacuation time by up to 8.94-fold with a DNN-based solution and 5.41-fold in a non-DNN solution.
This sensitivity difference with additional transit time for larger but not for smaller neighborhoods.

                                                          8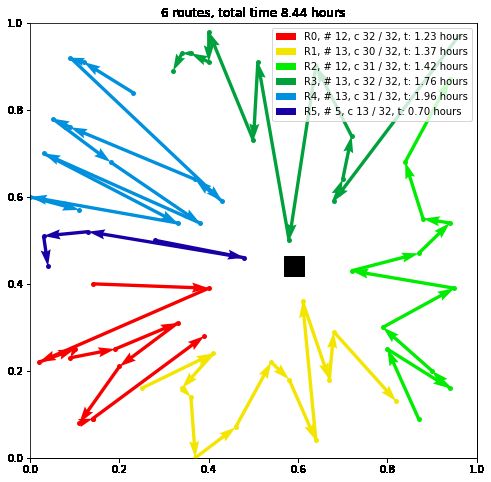
a Neighborhood 1                                          b Neighborhood 2

  c Neighborhood 3                                          d Neighborhood 4

Figure 5: Social distancing and total evacuation time for a neighborhood. The x-axis indicates different
social distancing protocols (the number of people allowed in an emergency vehicle) and y-axis indicates the total
time required to evacuate a neighborhood. Red and yellow dashed lines indicate the 42-hour and 24 hour windows,
respectively (Fig. 2)). a Neighborhood 1 has 52 people and 20 houses. b Neighborhood 2 has 83 people and 35
houses. c Neighborhood 3 has 126 people and 52 houses. d Neighborhood 4 has 168 people and 68 houses.

         One of the critical elements of an evacuation plan is the number of vehicles to allocate. A rough estimate
for this can come from the ratio of the size of the special needs registry to the number of people evacuated by a single
vehicle within the 42 hour target windows (Fig. 6). With stricter social distancing, the number of emergency vehicles
increased. Stricter social distancing also increased the risk that one emergency vehicle could not fully evacuate one
neighborhood within 24 or 42 hours (Fig. 5) (Fig. 6).

                                                           9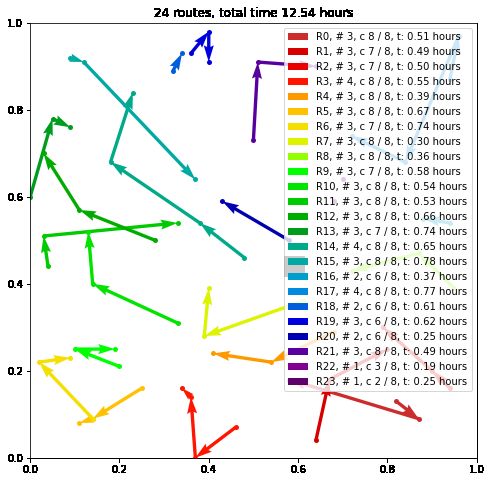
a Neighborhood 1                                         b Neighborhood 2

 c Neighborhood 3                                         d Neighborhood 4

Figure 6: Social distancing and the number of vehicles required to evacuate a city. The x-axis is vehicle
capacity, and the y-axis indicates the number of vehicles required to evacuate 4000 people. If it is impossible to
evacuate one neighborhood within 42 hours, data points are not shown. a Neighborhood 1 has 52 people and 20
houses. b Neighborhood 2 has 83 people and 35 houses. c Neighborhood 3 has 126 people and 52 houses. d
Neighborhood 4 has 168 people and 68 houses.

Efficacy of DNN-based and non-DNN solutions

Across all of the scenarios without additional transit time in each route, the DNN-based solution generated a shorter
total evacuation time than the non-DNN solution in 66.67% of the cases (Fig. 7). The DNN-based solution required
fewer routes than the non-DNN solution in 8.33% of the scenarios and the same number of routes in 33.33%. On
average, the DNN-based method took less time but used more routes. With additional transit time in each route,
the advantage of the DNN-based algorithm decreased (Fig. 7). In general, the DNN-based solutions outperformed
the non-DNN solutions, except when neighborhood size was very small or vehicle capacity was very low (Fig. 7b,

                                                         10
c, d). The DNN-based solutions that took less time were the ones that needed fewer or the same number of routes.
When DNN-based solutions took more time, they required more routes.
a Neighborhood 1 b Neighborhood 2
c Neighborhood 3 d Neighborhood 4
Figure 7: Performance comparison between DNN-based and Non-DNN solutions in terms of total
evacuation time for one neighborhood. The x-axis is vehicle capacity and the y-axis is the percentage change in
evacuation time is calculated as equation 1. Points below the red dashed line indicate that the DNN-based solution
saves time. aNeighborhood 1 has 52 people and 20 houses. b Neighborhood 2 has 83 people and 35 houses. c
Neighborhood 3 has 126 people and 52 houses. d Neighborhood 4 has 168 people and 68 houses.
T imeDN N −based − T imeN on−DN N
P ercentage Change of Evacuation T ime (%) = × 100 (1)
T imeN on−DN N
Overall, 63.54% of the DNN-based solutions met the threshold for evacuation within 24 hours, see Fig.
2), the same as the non-DNN solutions (Fig. 5). Times were greater than 42 hours in 22.92% and 21.88% of the
DNN-based and non-DNN solutions respectively. In 1.04% of the cases, the non-DNN solution was enough better
11than the DNN-based solution to shift the time performance from > 42 hours to between 24 and 42 hours. Even
though the DNN-based solutions used less time than the non-DNN solutions in 57.29% of the cases, none of the
DNN-based solutions were enough better than the non-DNN solutions to shift a result from > 42 to 24 to 42 or from
24 to 42 to < 24.
DNN-based solutions outperformed non-DNN solutions by up to 40.18% (Fig. 7). The advantage of the
DNN-based approach was largest with high-capacity vehicles, mild social distancing, and larger neighborhoods (Fig.
7b, c, d). In visual terms, the DNN-based method outperformed the non-DNN method because its routing patterns
were smoother loops compared to the non-DNN method, which wasted a lot of time going back and forth among
houses with its more “spiky” routing (Fig. 1 and the other figures in Supplementary information).
However, with the non-DNN approach, the vehicle always picked up passengers until it reached its capacity
(see Supplementary Fig. 1b), while in some of the DNN-based solutions, the vehicle returned to the rescue center
before reaching full capacity (see Supplementary Fig. 1a). This led to the DNN-based solutions sometimes using
more routes than the non-DNN solutions. An added transit time was effectively a penalty on the number of routes
per neighborhood, leading to DNN-based solutions using up to 75.38% more time than the non-DNN solutions (Fig.
7a).
The number of routes required for DNN-based and non-DNN solutions were approximately the same most
of the time (Fig. 8). In 58.33% of the cases the difference is within ±10%. In 33.33% of the cases, DNN-based and
non-DNN solutions used the same number of routes (Fig. 8b). In these cases, the transit time per route did not
impact total evacuation time too much, and the advantage of the DNN-based solutions was expressed (Fig. 7b, c,
d).
a Comparison of the number of routes b Percentage change of the number of routes
Figure 8: Performance comparison between DNN-based and Non-DNN solutions in terms of the
number of routes. Negative numbers on the y-axis means that the DNN-based solution required fewer routes than
the non-DNN solution. The x-axis is vehicle capacity and the y-axis is the difference in the number of routes (Fig.
8a) and the percentage change of the number of routes (Fig. 8b, equation (2)) is calculated as follows.
12RoutesDN N −based − RoutesN on−DN N
P ercentage Change of the N umber of Routes (%) = × 100 (2)
RoutesN on−DN N
The advantage of deep reinforcement learning faded with smaller vehicles or stricter social distancing. When
the vehicle capacity was close to the number of people in each household, the DNN-based solution performed about
the same as or even worse than the sweep algorithm. It is not surprising that the DNN-based method did not work
well when vehicle capacity was close to the household size. This is a situation known as the demand of a single node
in the Capacitated Vehicle Routing Problem. If the vehicle collects two people from one house and then returns to
the rescue center, the problem collapses to one of determining the shortest path between each node and the depot
(Supplementary Fig. 6). The order of visiting houses might be different, but no version of a DNN-based approach
would outperform a non-DNN approach.
We did not specifically train the DNN-based model for vehicle sizes close to the number of people in a
house, largely because the fact that all solutions converge at some point indicates that this retraining could provide
no more than marginal improvements. In addition, a DNN-based model is more complicated than is appropriate for
these simple edge cases.
Across all scenarios, the DNN-based method required 1.67 more routes (20.96%) than non-DNN solution
but saved 0.73 hours (14.78%), 0.1 hours (6.86%), 0.93 hours (2.11%), and 2.6 hours (3.59%) on average for the cases
with additional 0, 0.5, 1, and 2 hours per route respectively compared to the non-DNN method. In 42.71% of the
scenarios, the total evacuation time for the non-DNN solution was shorter than for the DNN-based solution. But all
the cases where non-DNN solution required less time than the DNN-based solution occurred when vehicle capacity
was limited to 2 or 4 (Fig. 7). When the DNN-based method required less evacuation time than the non-DNN
method, it saved 2.1 hours (18.57%) on average. When the DNN-based method required more evacuation time, it
needed 4.51 hours more (13.1%) on average.
The DNN-based approach required more routes in 58.33% of the cases but less time in 57.29% of the cases
compared to the non-DNN approach. However, the time performance boost from implementing the DNN-based
solution was not large enough to accommodate stricter social distancing without other compromises (Figs. 5 and 7).
Although deep reinforcement learning can provide more efficient evacuation routing, it cannot totally offset
the extra time required for adding social-distancing (Figs. 5 and 7). Evacuation plans can be modified to accommo-
date social distancing, but the modifications will require operational changes like increasing the number of vehicles
(and decreasing the size of the neighborhood each serves) or extending the evacuation timeline. The magnitude
of the required operational changes becomes larger as the social distancing becomes more aggressive. Even if the
addition of DNN-based evacuation plans can make a real contribution to efficiency and could, in critical cases, be
the difference between a successful evacuation and one that is not completed in the allowed window, it is imperative
for disaster managers to re-examine the evacuation timeline and incorporate additional disaster relief resources, such
as more emergency vehicles, into any evacuation operation that requires social distancing.
13Discussion
Artificial intelligence has been employed to solve various hard problems in operations research, computer science,
business, healthcare, and other fields. We showed how human-centered AI techniques can augment the efficiency of
an evacuation, but its benefit decreases and eventually disappears with stronger requirements for social distancing.
The findings from our research are relevant to other disaster evacuations that are based on a registry of people to be
collected. The efficiency improvements that come from implementing a DNN-based solution can be substantial, but
they may not compensate for social distancing in each evacuation route.
In general, the DNN-based solutions were not useful for cases where vehicle capacity was close to the size
of a single household (node). In typical CVRP simulations and benchmarking research41,51 , the vehicle capacity is
much larger than the demand of each node. In future work, the DNN-based model could be retrained for scenarios
with low-capacity vehicles. However, when the vehicle goes to only one house and then returns to the rescue center,
all possible solutions collapse to the same performance. Furthermore, with low-capacity vehicles, the total time both
DNN-based and non-DNN methods need is far from achieving the threshold, and a modest performance boost from
a DNN-based solution would be unlikely to change this pattern, especially in larger neighborhoods (Fig. 5d).
On the other hand, when vehicle capacity is much larger than the size of each household, multiple households
can be combined in a route, and it is non-trivial to come up with an efficient routing strategy. In cases like these,
the DNN-based model can reinforce itself by learning from various possible solutions. It is not guaranteed that a
DNN-based method can always outperform non-DNN method, especially in settings without sufficient data (possible
routing solutions) for learning and reinforcing the DNN-based model. The limitation of DNN-based method can be
a part of the planning for evacuation routing, suggesting cases where DNN-based approaches have and do not have
the potential to be helpful.
A transit time to a central evacuation center, required in any real-world situation, tends to decrease the
advantage of an efficient routing algorithm. For our analysis, it creates an additional burden on the DNN-based
approach. This arises from the fact that the DNN algorithm is attempting to minimize the time collecting people,
without regard to the number of routes. But because transit adds a fixed time to each route, it penalizes any solution
that requires additional routes (Fig. 7). In future work, it may be possible to address this through multi-objective
optimization (minimizing both time and number of routes) or to design test neighborhoods with depots located at
some distance.
When social distancing is required, evacuations become more complicated, and they require additional
resources. Disaster managers will need to make accommodate these complexities both through capitalizing on tools
for more efficient routing, but also in other aspects of the evacuations. Specifically, they may want to explore
options for (1) extending the evacuation timeline, (2) increasing the number of evacuation vehicles that serves each
neighborhood, or (3) partitioning the evacuation area into a larger number of smaller neighborhoods, each served by
a single vehicle. In any particular setting, the preferred option will be determined by local resources and constraints.
In every location, however, it will be wise to plan ahead for the possibility of an evacuation with social distancing.
14One of the durable lessons from COVID-19 is that governments, NGOs, and community members should
have all-hazard emergency operations and evacuation plans that consider the interactive effects of both a pandemic
and a wide range of possible disasters. Disaster managers should also take advantage of every efficiency they can
find, including DNN-based vehicle routing. Consistent with the FEMA suggestion that jurisdictions incorporate
social distancing into emergency evacuation during the COVID-19 pandemic52 , this study investigates the impacts
of social distancing on an evacuation timeline and the number of emergency vehicles required to evacuate a city.
Methods
Dataset
Vehicle Routing Problems (VRPs) in the context of pre-disaster evacuation are both critical and complex53 . Although
we cannot include all real-world constraints, we can roughly formulate the problem of pre-disaster evacuation as the
most studied variant of the VRPs, which is the Capacitated Vehicle Routing Problem (CVRP) with a rescue center
(typically called depot) and a given set of n houses denoted nodes or customers, N ={1,2,...,n}41,54 . In each simulation,
we have one vehicle whose vehicle capacity is C. People to be picked up (typically referred to as demand) from each
house is di , where 0 < di ≤ C, i ∈ N 41,54 .
The vehicle starts from the rescue center, goes to a house subset S ⊆ N to pick up people until its vehicle
capacity C is reached, and finally returns to the rescue center54 . The vehicle repeats this process until it picks up
every resident in the neighborhood, and it visits each house only once throughout the simulation (Figs. 1 and 9))54
. The goal of the simulation is to pick up every person within the minimum possible evacuation time. Results for
a rescue operation consist of the routes utilized by this vehicle, evacuation time, the number of routes, and other
detailed information about each route (Supplementary information).
To analyze the efficacy of pre-disaster evacuations using Deep Reinforcement Learning (DNN-based solution)
and Sweep Algorithm (Non-DNN solution), we consider four datasets in this study.
Dataset selection
In our experiments, we used the A-n36-k5, A-n53-k7, A-n69-k9 datasets, commonly used in studies of capacitated
vehicle routing problems49,50 . Each dataset contains a unique set of coordinates of one depot and several nodes in
a two-dimensional Cartesian coordinate system, plus the demand of each node and vehicle capacity. Since we are
interested in exploring how size of neighborhood and social distancing policy could impact the total time and number
of routes in evacuation operations, we selected the first 20 locations in the A-n36-k5 dataset as our Dataset 1. We
used all 35 locations in A-n36-k5 as our Dataset 2. Our Dataset 3 and 4 are A-n53-k7, A-n69-k9 datasets which
contain 52 and 68 houses respectively. To accommodate the possibility that the depot is outside the neighborhood,
we allowed for a series of fixed times (0, 0.5, 1.0, and 2.0 hours) for transit to and from a central depot.
15Dataset formation
In structuring the problem, we use the city of New Orleans, Louisiana, USA, as the reference case. New Orleans
experienced massive losses and disruption in Hurricane Katrina (2005)55–59 and has implemented comprehensive
plans to prepare for a future major hurricane. While our analytical framework is general, details like the average
number of people in a household and the length of the time window for completing the evacuation are specific to
New Orleans.
In New Orleans, the elderly, disabled, and those at high risk for severe illness from COVID-19 can sign up
online or call 311 for the Special Needs Registry (SNR) before a mandatory evacuation order is announced42,43 . The
72-hour evacuation timeline announced by the City of New Orleans specifies a window of 42 hours to collect evacuees
from their houses and transport them to the Smoothie King Center, which serves as a transfer and processing center,
and from there, evacuees will board a bus to state or federal shelters in other cities42 . Finally, the city government
will bring evacuees back to their homes or local shelters once it becomes safe to return to New Orleans42 . As of
February 23, 2021, the special needs registry for New Orleans contains 4,000 names60 .
We considered four datasets, each consisting of a depot (rescue center) and several nodes (houses) randomly
distributed within a flat 2D grid world. The distance metric is Manhattan distance, as in an urban area laid out in
blocks (Fig. 9). Each dataset is in the shape of a square (about 3 km x 3 km)61 . The land area of New Orleans is
438.8 km2 (169.42 mile2 )62 so the size of each dataset represents about 2% of the area of the city.
To enhance the efficiency of computation, we normalize the neighborhood as a 1 x 1 box, and transform
the normalized distance back to actual distance to get total evacuation time.
Figure 9: Example plot of a solution to CVRP in Manhattan distance. The vehicle capacity is 16 people
per route.
To estimate the number of people in each house, we used the average household size (2014-2018), which
is 2.44 persons per household in New Orleans, based on the American Community Survey of (ACS) U.S. Census
Bureau62 , assuming a normal distribution with mean=2.44 and standard deviation=0.5. If the household size is not
16an integer, it is rounded to the nearest integer. So, the household size ranges from 1-4 people. Supplementary Table
1 contains the summary of the datasets used in our study.
Table 1: Summary of datasets49,50 .
We ran the sweep algorithm and the pre-trained deep reinforcement learning model on a GPU NVIDIA Tesla
K80, which enabled us to complete all experiments within one second with a batch size of 25641 . For our conceptual
model of a pre-planned evacuation map, calculation time is not relevant, but the possibility of quick calculation is
consistent with real-time adjustments. In particular, a timely and scalable solution is of vital importance in real-world
disaster response and evacuation route planning.
Emergency vehicle and social distancing
We chose the average speed of 8 km/h (equivalent to 5 mph) for our simulation, based on the idea that emergency
vehicles usually move slowly during evacuation operations, especially when the elderly and people with disabilities
need extra time to get on and off the vehicles. To investigate how social distancing in an emergency vehicle impacts
the total time and the number of routes in disaster evacuation operation, we consider a nominal evacuation vehicle
as a bus that seats up to 64 people. Social distancing could decrease that to 32, 16, 8, 4, or 2 people per emergency
vehicle. The analysis can also be applied to a nominal capacity of 32, 16, 8 or 4, with an increasingly restricted
range of social distancing. To our knowledge, this study is the first research which incorporates FEMA’s official
guidelines52 into the investigation of the impacts of social distancing on emergency evacuation. In light of FEMA’s
guidance on Recommended Evacuee Queuing and Boarding Process52 , with social distancing protocols, only up to
25-28 passengers are allowed in a 56-passenger motor coach, which is the most widely available motor coach. In
other words, the vehicle capacity decreases to half of its original value when social distancing is applied. All of the
specifics like the size of the neighborhoods, vehicle speed, and vehicle capacity are reasonable, chosen to illustrate
the general issues.
Evacuees and evacuation timeline
This is a model for a pre-planned evacuation, with a map of locations and number of people per location known
in advance. Such a map could be based on a registry of advance requests for evacuation assistance, or it could
17be developed in parallel with the forecast leading to an evacuation. With this concept, we know in advance the
spatial distribution of the demand in the capacitated vehicle routing problem. In addition, we considered the rescue
center to have unlimited accommodation capacity. Consistent with the Guide of City-Assisted Evacuation (CAE)
for Hurricanes in New Orleans, people transported from their houses to the rescue center will be moved from there
to be treated by appropriate emergency health care services at other disaster relief centers, such as state or federal
long-term shelters42,63 .
Algorithm design
In this section, we describe the general design of the DNN-based and non-DNN algorithms in this study.
Non-DNN solution–Sweep Algorithm
The sweep algorithm is a computationally efficient non-DNN solution typically used in real-world evacuations, busi-
ness logistics, and supply chain management64,65 . It starts with an arbitrary line from the depot (the rescue center).
The order of houses to be visited by an emergency vehicle is determined by sweeping this line counter-clock wise
and adding houses one by one when the line intersects these houses. In addition, the emergency vehicle must return
to the rescue center when it reaches its passenger limit. After sweeping the line for 360 degrees, the evacuation
operation is complete.
DNN-based solution–Deep Reinforcement Learning
In this study, we selected deep reinforcement learning as the DNN-based solution. Deep reinforcement learning
is good at searching for optimal solutions in a relatively short period of time and is well-known for its capacity
of adaptively resolving similarly complex problems, such as the Game of Go, robotics, and computer games. In
particular, we used the Attention Model (AM)41 because this algorithm outperformed several common baseline
algorithms and models for various routing problems, including the Capacitated Vehicle Routing Problem (CVRP).
The Attention Model integrates the REINFORCE algorithms66 with greedy rollout baseline to the attention-based
Transformer model67 and the variant of Graph Attention Networks (GATs)68 whose Convolutional Neural Networks
(CNNs) with masked self-attention layers analyze graph-structured data efficiently. For all of our experiments of deep
reinforcement learning, we adapted the algorithm designs in41 to our scenarios of evacuation with social distancing.
Evaluation of DNN-based and non-DNN solutions
According to the 72-hour hurricane evacuation timeline announced by New Orleans42 , there will be only 42 hours
to pick up evacuees (Fig. 2). To evaluate the performance of DNN-based and non-DNN solutions, we used 24 and
1842 hours as the thresholds of categorizing the results into three levels of performance: satisfactory (< 24 hours),
borderline (24-42 hours), and not allowed (> 42 hours) (Fig. 2).
Data availability
The Capacitated Vehicle Routing Problem datasets can be obtained online from the Capacitated Vehicle Routing
Problem Library (http://vrp.galgos.inf.puc-rio.br/index.php/en/).
Code availability
Any code necessary to reproduce the results presented in this study is available upon request.
References
1. Dong, E., Du, H. & Gardner, L. An interactive web-based dashboard to track COVID-19 in real time. The
Lancet Infectious Diseases (2020).
2. Phillips, C. A. et al. Compound climate risks in the COVID-19 pandemic. Nature Climate Change, 1–3 (2020).
3. Zscheischler, J. et al. Future climate risk from compound events. Nature Climate Change 8, 469–477 (2018).
4. Pei, S., Dahl, K. A., Yamana, T. K., Licker, R. & Shaman, J. Compound Risks of Hurricane Evacuation amid
the COVID-19 Pandemic in the United States. GeoHealth, e2020GH000319 (2020).
5. Shultz, J. M., Fugate, C. & Galea, S. Cascading risks of COVID-19 resurgence during an active 2020 Atlantic
hurricane season. JAMA 324, 935–936 (2020).
6. Shultz, J. M. et al. Mitigating the twin threats of climate-driven Atlantic hurricanes and COVID-19 transmission.
Disaster medicine and public health preparedness, 1–10 (2020).
7. Shultz, J. M. et al. Superimposed threats to population health from tropical cyclones in the prevaccine era of
COVID-19. The Lancet Planetary Health 4, e506–e508 (2020).
8. Tripathy, S. S., Bhatia, U., Mohanty, M., Karmakar, S. & Ghosh, S. Flood evacuation during pandemic: a
multi-objective framework to handle compound hazard. Environmental Research Letters 16, 034034 (2021).
9. Te Vrugt, M., Bickmann, J. & Wittkowski, R. Effects of social distancing and isolation on epidemic spreading
modeled via dynamical density functional theory. Nature Communications 11, 1–11 (2020).
10. Contreras, S. et al. The challenges of containing SARS-CoV-2 via test-trace-and-isolate. Nature Communications
12, 1–13 (2021).
11. Jones, K. E. et al. Global trends in emerging infectious diseases. Nature 451, 990–993 (2008).
1912. Shaman, J. & Lipsitch, M. The El Niño–Southern Oscillation (ENSO)–pandemic Influenza connection: Coinci-
dent or causal? Proceedings of the National Academy of Sciences 110, 3689–3691 (2013).
13. Flahault, A., de Castaneda, R. R. & Bolon, I. Climate change and infectious diseases. Public health reviews 37,
1–3 (2016).
14. Beyer, R. M., Manica, A. & Mora, C. Shifts in global bat diversity suggest a possible role of climate change in
the emergence of SARS-CoV-1 and SARS-CoV-2. Science of The Total Environment, 145413 (2021).
15. NOAA National Centers for Environmental Information (NCEI) U.S. Billion-Dollar Weather and Climate
Disasters 2021. https://www.ncdc.noaa.gov/billions/.
16. Walton, D. & van Aalst, M. Climate-related extreme weather events and COVID-19 (International Federation
of Red Cross and Red Crescent Societies, 2020).
17. Natural Hazard Mitigation Saves: 2017 Interim Report (MMC (Multihazard Mitigation Council), National
Institute of Building Sciences Washington, DC, 2017).
18. The Global Risks Report 2019 (Geneva: World Economic Forum, 2019).
19. Reichstein, M. et al. Deep learning and process understanding for data-driven Earth system science. Nature
566, 195 (2019).
20. Racah, E. et al. ExtremeWeather: A large-scale climate dataset for semi-supervised detection, localization, and
understanding of extreme weather events in Advances in Neural Information Processing Systems (2017), 3402–
3413.
21. Liu, Y. et al. Application of deep convolutional neural networks for detecting extreme weather in climate
datasets. arXiv preprint arXiv:1605.01156 (2016).
22. Shi, X. et al. Deep learning for precipitation nowcasting: A benchmark and a new model in Advances in Neural
Information Processing Systems (2017), 5617–5627.
23. Rolnick, D. et al. Tackling Climate Change with Machine Learning. arXiv preprint arXiv:1906.05433 (2019).
24. Schrittwieser, J. et al. Mastering atari, go, chess and shogi by planning with a learned model. arXiv preprint
arXiv:1911.08265 (2019).
25. Silver, D. et al. Mastering the game of go without human knowledge. Nature 550, 354 (2017).
26. Mnih, V. et al. Asynchronous methods for deep reinforcement learning in International conference on machine
learning (2016), 1928–1937.
27. Silver, D. et al. Mastering the game of Go with deep neural networks and tree search. Nature 529, 484 (2016).
28. Mnih, V. et al. Human-level control through deep reinforcement learning. Nature 518, 529 (2015).
29. Ganapathi Subramanian, S. & Crowley, M. Using Spatial Reinforcement Learning to Build Forest Wildfire
Dynamics Models from Satellite Images. Frontiers in ICT 5, 6 (2018).
30. Niroui, F., Zhang, K., Kashino, Z. & Nejat, G. Deep Reinforcement Learning Robot for Search and Rescue
Applications: Cluttered Environments. IEEE Robotics and Automation Letters 4, 610–617 (2019).
2031. Lee, H.-R. & Lee, T. Multi-agent reinforcement learning algorithm to solve a partially-observable multi-agent
problem in disaster response. European Journal of Operational Research (2020).
32. Tian, K. & Jiang, S. Reinforcement learning for safe evacuation time of fire in Hong Kong-Zhuhai-Macau
immersed tube tunnel. Systems Science & Control Engineering 6, 45–56 (2018).
33. Nguyen, L., Yang, Z., Zhu, J., Li, J. & Jin, F. Coordinating Disaster Emergency Response with Heuristic
Reinforcement Learning. arXiv preprint arXiv:1811.05010 (2018).
34. Tsai, Y.-L., Phatak, A., Kitanidis, P. K. & Field, C. B. Deep Reinforcement Learning for Disaster Response: Nav-
igating the Dynamic Emergency Vehicle and Rescue Team Dispatch during a Flood. AGUFM 2019, NH33B–14
(2019).
35. Yan, L., Mahmud, S., Shen, H., Foutz, N. Z. & Anton, J. MobiRescue: Reinforcement Learning based Rescue
Team Dispatching in a Flooding Disaster. Proc. ICDCS. IEEE, Singapore (2020).
36. Ghannad, P., Lee, Y.-C. & Choi, J. O. Prioritizing Postdisaster Recovery of Transportation Infrastructure Sys-
tems Using Multiagent Reinforcement Learning. Journal of Management in Engineering 37, 04020100 (2020).
37. Ukkusuri, S. V. & Yushimito, W. F. Location routing approach for the humanitarian prepositioning problem.
Transportation research record 2089, 18–25 (2008).
38. Ozdamar, L. & Yi, W. Greedy neighborhood search for disaster relief and evacuation logistics. IEEE Intelligent
Systems 23, 14–23 (2008).
39. Yi, W. & Özdamar, L. A dynamic logistics coordination model for evacuation and support in disaster response
activities. European Journal of Operational Research 179, 1177–1193 (2007).
40. Han, L. D., Yuan, F., Chin, S.-M. & Hwang, H. Global optimization of emergency evacuation assignments.
Interfaces 36, 502–513 (2006).
41. Kool, W., van Hoof, H. & Welling, M. Attention, Learn to Solve Routing Problems! in International Conference
on Learning Representations (2019). https://openreview.net/forum?id=ByxBFsRqYm.
42. Plan for Emergencies (The City of New Orleans, the Office of Homeland Security and Emergency Preparedness
(NOHSEP).). https://ready.nola.gov/plan/hurricane/#cae.
43. Schrilla, T. P. Evacuation and Return: Increasing Safety and Reducing Risk (United States Department of
Transportation. Federal Transit Administration. Office of Research, Demonstration and Innovation, 2019).
44. Jonkman, S. N., Maaskant, B., Boyd, E. & Levitan, M. L. Loss of life caused by the flooding of New Orleans
after Hurricane Katrina: analysis of the relationship between flood characteristics and mortality. Risk Analysis:
An International Journal 29, 676–698 (2009).
45. Jonkman, S. N. Loss of life estimation in flood risk assessment; theory and applications (2007).
46. Pollard, M. North Sea surge: the story of the east coast floods of 1953 (Dalton, 1978).
47. Rott, N. ’Hope Isn’t A Strategy.’ How To Prepare For A Natural Disaster During COVID-19 Apr. 2020. https:
//www.npr.org/2020/04/11/829193312/hope- isn- t- a- strategy- how- to- prepare- for- a- natural-
disaster-during-covid-19.
2148. COVID-19 Supplement for Planning Considerations: Evacuation and Shelter-in-Place (Federal Emergency Man-
agement Agency, Sept. 2020). https : / / www . fema . gov / sites / default / files / 2020 - 09 / fema _ covid -
19_supplement-evacuation-shelter-in-place.pdf.
49. Capacitated Vehicle Routing Problem Library 2021. http://vrp.galgos.inf.puc-rio.br/index.php/en/.
50. Augerat, P. et al. Computational results with a branch and cut code for the capacitated vehicle routing problem
(1995).
51. Nazari, M., Oroojlooy, A., Snyder, L. V. & Takáč, M. Reinforcement Learning for Solving the Vehicle Routing
Problem. Advances in Neural Information Processing Systems, 9839–9849 (2018).
52. South Carolina COVID-19 Hurricane Response Contingency Plan (South Carolina Emergency Management
Division, July 2020). https://www.scemd.org/media/1516/annex- j- covid- 19- hurricane- response-
contingency-plan.pdf.
53. Golden, B. L., Kovacs, A. A. & Wasil, E. A. in Vehicle Routing: Problems, Methods, and Applications, Second
Edition 409–436 (SIAM, 2014).
54. Irnich, S., Toth, P. & Vigo, D. in Vehicle Routing: Problems, Methods, and Applications, Second Edition 1–33
(SIAM, 2014).
55. Dyson, M. E. & Elliott, P. Come hell or high water: Hurricane Katrina and the color of disaster (Read-
HowYouWant. com, 2010).
56. Council, N. R. et al. The New Orleans hurricane protection system: Assessing pre-Katrina vulnerability and
improving mitigation and preparedness (National Academies Press, 2009).
57. Richardson, H. W., Gordon, P., Moore, J. E., et al. Natural disaster analysis after Hurricane Katrina (Edward
Elgar, 2008).
58. Kettl, D. J. On risk and disaster: Lessons from Hurricane Katrina (University of Pennsylvania Press, 2006).
59. Banipal, K. Strategic approach to disaster management: lessons learned from Hurricane Katrina. Disaster
Prevention and Management: An International Journal 15, 484–494 (2006).
60. Schrilla, T. P. & Tsai, Y.-L. Personal Communication with Thomas Schrilla, the Disaster Manager in the City
of New Orleans (Feb. 2021).
61. Schrilla, T. P. & Tsai, Y.-L. Personal Communication with Thomas Schrilla, the Disaster Manager in the City
of New Orleans (Apr. 2021).
62. U.S. Census Bureau Quick Facts: New Orleans City, Louisiana 2020. https://www.census.gov/quickfacts/
fact/table/neworleanscitylouisiana/HSD310218#HSD310218.
63. City-Assisted Evacuation for Hurricanes (The City of New Orleans, the Office of Homeland Security and Emer-
gency Preparedness (NOHSEP)). https://ready.nola.gov/plan/hurricane/evacuspot-survey/.
64. Swamy, R., Kang, J. E., Batta, R. & Chung, Y. Hurricane evacuation planning using public transportation.
Socio-Economic Planning Sciences 59, 43–55 (2017).
2265. Ballou, R. H. Business logistics/supply chain management: planning, organizing, and controlling the supply
chain (Pearson Education India, 2007).
66. Williams, R. J. Simple statistical gradient-following algorithms for connectionist reinforcement learning. Ma-
chine learning 8, 229–256 (1992).
67. Vaswani, A. et al. Attention is all you need in Advances in neural information processing systems (2017), 5998–
6008.
68. Veličković, P. et al. Graph Attention Networks. International Conference on Learning Representations. https:
//openreview.net/forum?id=rJXMpikCZ (2018).
Acknowledgements
Funding: This research was supported by Stanford Woods Institute for the Environment, Department of Civil &
Environmental Engineering at Stanford University, Department of Earth System Science at Stanford University,
Microsoft AI for Earth Program, and Stanford RISE (Respond. Innovate. Scale. Empower.) COVID-19 Crisis
Response Research Grant and Fellowship.
Insights: We appreciate those who provide their first-hand insights and work experiences in emergency response and
evacuation during disasters:
1. Thomas Schrilla–Planner, Office of Homeland Security and Emergency Preparedness, City of New Orleans.
2. Ann Herosy–Team Lead of the Emergency Management Team and the Community Partners Team, American Red
Cross of the Silicon Valley.
3. Luke Beckman–Division Disaster State Relations Director for California, American Red Cross Pacific Division.
4. Keith Perry–University Emergency Manager, Assistant Director, Department of Environmental Health and Safety
(EH&S), Stanford University.
Technical Supports: We thank the City of New Orleans for permitting us to use its hurricane evacuation timeline
and publish as shown in Fig. 2. In addition, we thank Abhijeet Phatak and Laura Domine for providing advice
and exploratory assistance in the preliminary design of this study. We thank Professor Sarah Fletcher and Laura
Domine for rigorously reviewing our manuscript, and providing feedback and suggestions in detail. We also thank
Professor Emma Brunskill and Eley Ng for their guidance on some technical issues of deep reinforcement learning.
We appreciate that Wouter Kool helped us figure out technical bugs and clarify some issues of DNN-based models
when we adapted the ideas in41 to our scenarios of flood evacuation with social distancing. Last but not least, we
thank Dr. Rishi Mediratta, Jack Scala, and Nathaniel Braun on the Stanford teaching team of PEDS 220: COVID-19
Elective for their support and guidance on the reciprocal community-based research partnership between the City of
New Orleans and Stanford University.
23Author contributions
Y.L.T., P.K.K., and C.B.F. designed the research; all authors developed and refined the methodologies of analyses;
Y.L.T. and C.R. performed the analyses; Y.L.T., P.K.K., and C.B.F. interpreted results. Y.L.T. wrote the first draft
of the manuscript. Y.L.T., P.K.K., and C.B.F. revised the manuscript. All authors reviewed the final version of the
manuscript.
Ethics declarations
Competing interests
The authors declare no competing interests.
Disclaimer
This disclaimer informs readers that this study should only serve as their own references rather than official guidelines
for any jurisdictions. The scenarios of simulations performed in this study are only examples for the purpose of
academic research. Any actions, including but not limited to decisions, policies, and studies, taken based on any
part of this study is the sole liability of readers, not authors in this study.
Supplementary information
Routing experiments
I n this supplementary information section, we included all of the routing figures generated from our DNN-based and
non-DNN solutions. As we mentioned in Methods, in each figure, a legend box shows the detailed information about
that experiment. For example, in Supplementary Fig. 1a, the legend box is in the format of “R0, #14, c 37/64, t:
1.79 hours”. “R0” represents the index of the order of the routing experiment. R0 is the first route, R1 is the second,
R2 is the third, etc. “#14” means that an emergency vehicle visits 14 houses in that route. “c 37/64” indicates that
the emergency vehicle whose passenger capacity is 64 people picks up 37 people in total in route R0. Finally, “t:
1.79 hours” means that the emergency vehicle spends 1.79 hours in route R0.
In addition, to make the routing pattern concise and easy to read, we hide the first and the last line going
from and back to the black square, which represents a rescue center. In other words, a dot in the figure means that
the emergency vehicle only visits one house and then go back to the rescue center. For example, there is a green dot
24in Supplementary Fig. 1a and it means that the emergency vehicle only visits one house in route R1. If we connect
the green dot, the black square, and the first house in route R2, we can form a triangle.
Intuitively, a rescue team would not just visit one house (the green dot) in route R1, come back to the
depot (the black square), and then start route R2. A rescue team typically picks up as many people as possible
until the vehicle capacity is full, just as the sweep algorithm does in Supplementary Fig. 1b. However, a rescue
team would spend less time by following the routes in Supplementary Fig. 1a than typical and intuitive routing,
which may integrate the green dot into route R0 (Supplementary Fig. 1b). The result in Supplementary Fig. 1a
demonstrates that deep reinforcement learning may generate unusual routes but they require less time than how we
typically would plan for evacuation routing.
To summarize the result of each experiment, we show the total time and routes the emergency vehicle needs
to pick up every person in that experiment on the top of each figure. As mentioned in Methods, all the distance
was normalized between 0 and 1 m to make the figures easy to read and the computational process more efficient
and easier to generalize to different scenarios. However, we converted the normalized distance back to the original
distance to obtain actual total time an emergency vehicle needs at the end of each experiment.
In our study, we use the typical CVRP setting, meaning the vehicle would only visit each house once and
pick up people before the vehicle is full. For our cases where vehicle capacity is 2, to deal with some houses with more
than 2 people, we split the simulations into two parts. In Part I, the vehicle can take 2 people from each household,
as shown in Supplementary Fig. 6. People left in each house where there are originally more than 2 people, will be
picked up in Part II, as shown in Supplementary Fig. 7.
25You can also read