Analyzing Worldwide Social Distancing through Large-Scale Computer Vision - arXiv
←
→
Page content transcription
If your browser does not render page correctly, please read the page content below
Analyzing Worldwide Social Distancing through
                                                      Large-Scale Computer Vision
                                         Isha Ghodgaonkar, Subhankar Chakraborty† , Vishnu Banna, Shane Allcroft, Mohammed Metwaly, Fischer Bordwell,
                                                   Kohsuke Kimura, Xinxin Zhao, Abhinav Goel, Caleb Tung, Akhil Chinnakotla, Minghao Xue
                                         Yung-Hsiang Lu, Mark Daniel Ward, Wei Zakharov, David S. Ebert, David M. Barbarash, George K. Thiruvathukal‡
                                                                                       Purdue University, West Lafayette, IN, USA
                                                                                 † IndianInstitute of Technology Madras, Chennai, India
                                                                                          ‡ Loyola University Chicago, IL, USA
arXiv:2008.12363v1 [cs.CV] 27 Aug 2020

                                            Abstract—In order to contain the COVID-19 pandemic,
                                         countries around the world have introduced social distancing
                                         guidelines as public health interventions to reduce the spread of
                                         the disease. However, monitoring the efficacy of these guidelines
                                         at a large scale (nationwide or worldwide) is difficult. To make
                                         matters worse, traditional observational methods such as in-
                                         person reporting is dangerous because observers may risk
                                         infection. A better solution is to observe activities through
                                         network cameras; this approach is scalable and observers
                                         can stay in safe locations. This research team has created
                                         methods that can discover thousands of network cameras
                                         worldwide, retrieve data from the cameras, analyze the data,
                                         and report the sizes of crowds as different countries issued
                                         and lifted restrictions (also called “lockdown”). We discover
                                         11,140 network cameras that provide real-time data and we
                                         present the results across 15 countries. We collect data from
                                         these cameras beginning April 2020 at approximately 0.5TB
                                         per week. After analyzing 10,424,459 images from still image
                                         cameras and frames extracted periodically from video, the           Fig. 1: A park in Schwarzsee, Switzerland, on May 22,
                                         data reveals that the residents in some countries exhibited         2020. Red and green bounding boxes represent people
                                         more activity (judged by numbers of people and vehicles)            violating social distancing guidelines and following them,
                                         after the restrictions were lifted. In other countries, the
                                         amounts of activities showed no obvious changes during the          respectively, without consideration for families traveling in
                                         restrictions and after the restrictions were lifted. The data       groups. Image source: Snoweye.com
                                         further reveals whether people stay “social distancing”, at least
                                         6 feet apart. This study discerns whether social distancing is      maintaining a safe distance to reduce close contact between
                                         being followed in several types of locations and geographical       people. This distance is generally around 6 feet.
                                         locations worldwide and serve as an early indicator whether
                                         another wave of infections is likely to occur soon.                    Observing the effects of social distancing is difficult with
                                            Index Terms—computer vision, crowd counting, social dis-         traditional methods of journalism. Dispatching reporters
                                         tancing, traffic, cameras, COVID-19, deep learning                  and researchers to a location could expose them to health
                                                                                                             risks. Some countries have strict travel restrictions and
                                                               I. I NTRODUCTION                              sending reporters is not possible. Other methods rely on
                                                                                                             self reporting; such methods have well-known biases as
                                            On November 11, 2019, the first known case of COVID-             they capture only the people that are willing to report their
                                         19 was reported [26]. In January 2020, the World Health             locations. Moreover, it is difficult for a single person or any
                                         Organization (WHO) warned that the fast-spreading virus             organization to collect enough data at the same locations
                                         could reach other parts of the globe [31]. By March 2020,           every day during a month-long lockdown and observe the
                                         COVID-19 cases had spread around the world, and the                 trend. Any method that involves human labor is not scalable
                                         disease had been officially labelled as a pandemic [39].            to nationwide or worldwide observation. Therefore, it is
                                         Since then, countries have implemented different policies to        necessary to develop methods of observation without the
                                         slow down the spread of the disease, for example, stopping          physical presence of humans.
                                         non-essential activities (also called “lockdown” policies),            Many cities deploy traffic cameras and make the data
                                         encouraging people to follow social distancing guidelines,          available to the general public. We hypothesize that if fewer
                                         and more recently encouraging or requiring wearing face             people are leaving their homes and travelling to places, there
                                         covers. In public health, social distancing is defined as           must be fewer vehicles on highways or city streets. Thus,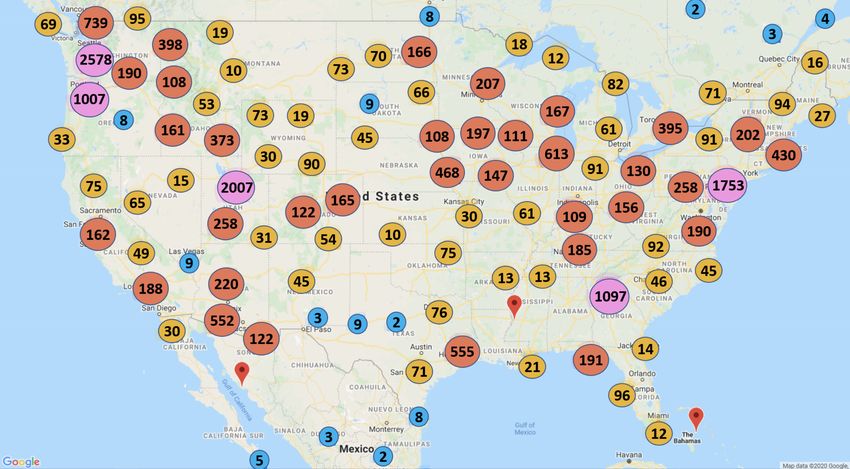
the number of vehicles can provide an indirect indication of              of locations in which there is a lack of social distancing.
whether people are following social distancing guidelines.
                                                                                         II. R ELATED W ORK
   This research team uses the globally deployed network
cameras to observe activities during and after lockdown.                 This section considers related work in three categories:
This study is built on the team’s existing work of discovering        1) detecting people and vehicles in images and video, 2)
network cameras [23, 24, 28] and retrieving and analyzing             estimating social distancing using computer vision, and 3)
the data [25]. Thousands of network cameras have already              analyzing social distancing using other digital means.
been deployed worldwide for monitoring traffic, observing
                                                                      A. Detecting people and vehicles in images
national parks and other locations. This study observes
responses to pandemic intervention policies in 63 countries              Crowd counting is a specialized class of techniques to
utilizing 11,140 cameras. This study focuses on observing             estimate the number of people in an image or a video. The
trends in selected location archetypes (such as ‘street corner’       three broad approaches to crowd counting are via detection,
or ‘restaurant’). The study uses computer vision to select            regression and density estimation. Early attempts [4, 55] at
this subset of cameras out of 30,702 originally discovered            crowd counting involved the use of detection and regression.
cameras by removing frozen camera streams and the cam-                Detection methods include You Only Look Once (YOLO)
eras that provide no information about human activities (a            [38] and Single-Shot-Detector (SSD) [21]. Object counting
planetary camera pointed at the night sky, for instance).             may use hierarchical object counting [10]. These early
Specifically, the study identifies 9,752 cameras to analyze           methods are inaccurate with estimating density in moderate
traffic and 3,254 cameras to count people. This study collects        to dense crowds. Many methods [20, 42, 49, 58] for popular
and analyzes data from April 1, 2020, to August 1, 2020.              crowd counting datasets [15, 54] use deep learning to
The analysis includes 15 selected countries, 2,973 cities,            estimate crowd density maps and integrate over the maps
10,424,459 images extracted from still image cameras and              to predict the counts. Many crowd counting methods fail
video segments, 301,398 detected people, and 12,459,271               to perform well on data from network cameras due to the
detected vehicles to observe potential changes in crowd               assumption of the presence of dense crowds. In data with
sizes, vehicle presence, or both. This paper provides insight         sparse or no crowds, the methods are unreliable.
about the ability of computer vision to analyze the vast,                Vision methods use the motion of a vehicle to separate
diverse visual data available from network cameras. Overall,          these from background and are hence unsuitable on still
object detection performs well enough to give reasonable              images. These methods can be broadly divided into three
estimates of the numbers of people and vehicles in data.              types: [2]: 1) using background subtraction [29], 2) using
   The analysis shows that many countries follow the lock-            continuous video frame difference [18], and 3) using optical
down: the numbers of people and vehicles increased notice-            flow [22]. YOLO along with road pixel segmentation [3]
ably after the policies were lifted. Some areas do not show           is used in some methods [43] for vehicle detection and
a clear pattern over the four months.                                 tracking. Workman et al. [52] use overhead imagery to
                                                                      understand patterns in traffic flow. Open-source software
   This paper has the following major contributions:
                                                                      [5, 13, 16, 37] facilitates the process of training object
 1) We believe this is the first study that utilizes the data         detectors on custom data sets or using pre-trained models on
    from network cameras to observe human activities                  common datasets [19, 41]. In this work we find that robust
    during and after lockdown in response to COVID-                   object detection models perform best on our data.
    19. Moreover, we are not aware of any other study
    comparable to this in terms of scale.                             B. Estimating social distancing using AI
 2) The team creates computer tools that can collect vi-                 Existing work explores how wireless and networking
    sual data periodically from the thousands of network              technologies combined with AI can help enable and enforce
    cameras.                                                          social distancing [33]. Visual Social Distancing [7] intro-
 3) This paper develops a method to strategically narrow              duces a method to estimate interpersonal distance given a 2D
    down over 10 TB of image and video data from 30,702               image. This method is based on pose estimation and requires
    cameras to less than half to use for analysis.                    high resolution images with relatively close-up people. In
 4) This paper presents the patterns in crowd sizes and               many images obtained from network cameras, people are
    traffic over time in 15 countries.                                too pixelated for this method to perform successfully. Yang
 5) This paper evaluates existing computer vision methods             et. al [53] and Khandelwal et. al [17] utilize perspective
    including crowd counting and object detection on a                transformation to change a given image’s perspective to a
    representative sample of network camera data and dis-             bird’s eye view before estimating social distancing. The
    covers the extent to which computer vision can perform            transformation requires human effort and therefore is not
    successfully on the data.                                         scalable. Several open-source methods [40] use the centroids
 6) This paper develops the basis for an algorithm to                 of detected people’s bounding boxes in order to estimate
    detect social distancing in images. This paper uses the           distance between people. These methods do not consider
    algorithm to discover geographical locations and types            depth differences. Disnet [14] provides a deep learned model

                                                                  2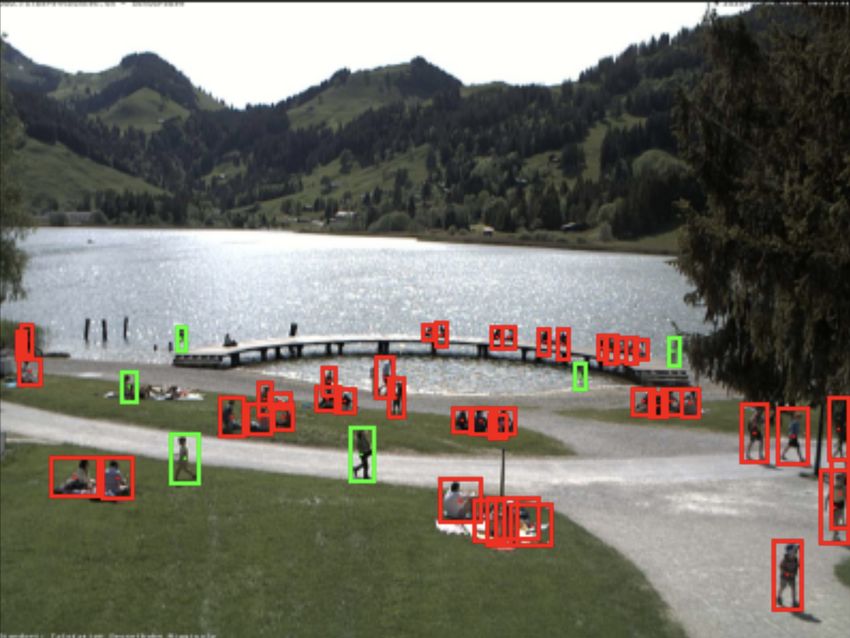
to estimate distance from the camera, but is not lightweight
and therefore not suitable for our use case given the size of
our data. To the best of our knowledge, there is no method
to estimate social distancing in heterogeneous camera data
that is lightweight (and therefore scalable to data of this           Fig. 2: Automatic Network Camera Discovery System [8].
size), automatic, robust to perspective change and depth in           The system has 2 main parts: (1) Web Crawler module and
2D images.                                                            (2) Network Camera Identification module.
C. Analyzing worldwide responses
                                                                      any visual data link found on a web page, the web crawler
   Several studies analyze adherence to social distancing in-         module downloads and parses the HTML. The pages are
terventions using data-driven methods. For example, Google            displayed in a web browser environment [8] to ensure all
Cloud Mobility Reports is used to gauge behavioral re-                web assets are properly loaded to avoid any potential losses
sponses to social distancing policies internationally [30, 47].       of information. The crawler then parses the HTML response
This data may be biased because users opt in to save their            and searches for data links common to network cameras
location history. Similarly, mobility from wearable trackers          such as image-specific visual links (e.g. baseURL /camera
or mobile phones can be used [36] [34]. As far as we know,            id.jpg) and video stream links (e.g. starting with rtmp:://
there is no study that analyzes social distancing using camera        and rtsp::// or ending with .mjpg). After the web crawler
data to the scale presented in this paper.                            aggregates potential links for image data, the network cam-
   III. C AMERA D ISCOVERY AND DATA C OLLECTION                       era identification module determines whether such data links
                                                                      connect to network cameras that update the data frequently.
   The following sections will describe the process to dis-           The identification distinguishes between active camera data
cover network cameras, collect data, manage the data,                 (frequently changing) and web assets (rarely changing). The
narrow down the data for analysis, analyze the data, and              module retrieves several images from the data links at differ-
present results. The discovery method finds 30,702 cameras            ent times, and after each retrieval, compares the images to
distributed worldwide. Then, we select the cameras based              determine the change or lack thereof. The module uses three
on the data quality in order to perform analysis. The large           different comparison methods: (1) checksum: compare the
number of cameras produces a vast amount of data. This pa-            file checksum of the images, (2) percent difference: compare
per discusses the methods to manage over 10 TB of data and            the percentage of pixels changed between images, and (3)
select which data to analyze. We then describe the process            luminance difference: compare the mean pixel luminance
of choosing state-of-the-art computer vision methods, and             change between images. If the images change over time, the
show successes and failures of the chosen methods. Finally,           link is considered as connected to a live network camera.
we present the trends over time in selected countries. An
increasingly large number of network cameras are available            B. Data Collection
publicly online. Hosted by governments, schools, and private             After the network cameras are discovered, a computer
entities, these cameras are sources of live visual data. To           program runs at defined time intervals and submits jobs to
observe worldwide responses to COVID-19, thousands of                 save data from subsets of cameras. The intervals begin on
cameras are needed. However, no simple method exists                  varying time stamps each day to ensure data is collected
to collect this data. Due to the heterogeneity of website             regularly each week for every camera. On average, we
designs, developing automated solutions for network camera            collect 5 images or video clips per day per camera. The
discovery is needed.                                                  image archiver program is capable of handling several image
                                                                      data formats. Video data is downloaded using one of several
A. Camera Discovery
                                                                      APIs built upon a plugin system for developers to access
   This team has developed automated solutions to discover            video live stream data. The compatible plugin link for each
network cameras [24]. The process is composed of two                  video link is obtained before the relevant API methods are
modules, as shown in Figure 2. The first module discovers             invoked to download data.
websites that may contain live visual data. This is achieved
by a web crawler that receives a set of seed URLs and                            IV. DATA M ANAGEMENT AT S CALE
tabulates a list of the links found from crawling the seed               Capturing visual data from 30,702 cameras and running
URLs. The module identifies the links that may contain live           object detection methods on a significantly large subset of
data and sends the URLs to the second module. The module              these cameras poses two distinct challenges: 1) obtaining
determines whether the visual data is live or not by checking         enough computational power to collect visual data and run
whether the data changes over time. This process discovers            models on selected data, and 2) running retrieving programs
30,261 live network cameras providing snapshots and an                in parallel to ensure that multiple cameras can be obtained
additional 441 live video cameras.                                    simultaneously and indefinitely.
   After the web crawler discovers a URL, the crawler parses             We address scalability, parallelizability, and compute
the website for image formats such as JPEG and PNG. For               power in this work by using Cooley, a mid-sized powerful

                                                                  3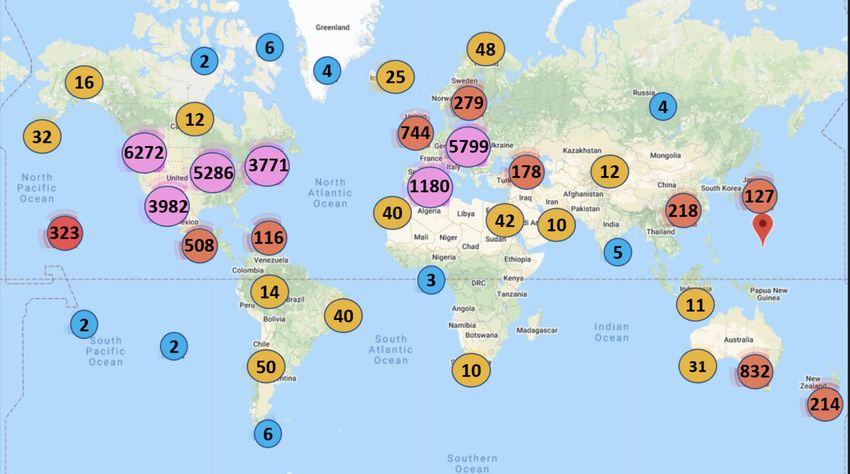
scene classification. We attempt to analyze all 441 video live
                                                                       streams.

                                                                       A. Filtering based on camera functionality
                                                                          To avoid analyzing frozen camera streams, we check 4
                                                                       equally spaced images from the set of saved images of each
                                                                       camera. If all images are identical pixelwise, we disregard
                                                                       this camera stream as it is likely to be frozen.
                                                                       B. Scene classification
                                                                          Places365 [56, 57] is a scene-centric database containing
                                                                       images labeled with one of 365 category labels. This work
Fig. 3: Camera counts of 30,261 discovered cameras                     uses a ResNet classifier trained on Places365 to identify
distributed by geographic location.                                    which “scene”, or type of place, a given camera shows.
                                                                          Due to the uncertainty of classifications, 5 random images
                                                                       are selected from each camera and assigned a scene classifi-
                                                                       cation. We use any one of the 5 classifications to determine
                                                                       candidates for analysis. For example, a camera classified as
                                                                       “highway” may also pan and zoom to additionally show
                                                                       a “crosswalk”, and therefore can be used to detect both
                                                                       people and cars. We count vehicles from cameras with a
                                                                       “highway” or “road” classification. In total, we analyze
                                                                       11,186 cameras for vehicles. A total of 9,751 cameras from
                                                                       these are functional and found to contain traffic data for at
                                                                       least one day during the 4 months. We search for people
                                                                       in cameras in 23 scene classifications. In total, we choose
         Fig. 4: USA map of discovered cameras.
                                                                       4,615 cameras to analyze for people, including 441 video
                                                                       streams. From these, 164 video streams and 3,090 image
computational cluster at Argonne Leadership Computing                  cameras are found to contain people on at least one day out
Facility. Through the Director’s Discretionary program, we             of the 4 months analyzed. In total, we utilize 11,140 cameras
possess access to over 3000 node hours per month and                   in this analysis, of which 1,865 overlap.
300 TB of persistent storage. Cooley is primarily targeted
                                                                          To determine a singular classification for a camera for
to high-performance data visualization workloads, which
                                                                       statistical purposes, we take the mode of the 5 classifications
makes it ideal for capturing video and performing analysis.
                                                                       determined by the model. If there are multiple modes, we
We retrieve data at the aforementioned intervals from all
                                                                       select the mode with the highest confidence. Our cameras
cameras via a set of short jobs that run on Cooley.
                                                                       span 274 of 365 scene categories, revealing the diversity
   A notable feature of our high-performance computing                 of our camera database. The scene “highway” is the most
environment is the enormous amount of networked storage                populous category, containing 5,875 cameras, followed by
available to store datasets. The image archiver mentioned              “desert road” with 2,568 cameras.
in section III is designed to utilize all available cores to
fetch data simultaneously. As more still image cameras and             C. Preprocessing video data
video cameras are discovered, Cooley will allow seamless                  Each clip for a video camera consists of a one minute
expansion. At the time of writing, we possess over 9 TB of             video, subject to small variations. Since people move slowly
image data and over 1 TB of video data, and over 2 PB of               within a video clip, we do not need to detect people in every
storage is available to cluster users.                                 frame. We pre-process the videos to save every 30th frame.
   Cooley contains 126 compute nodes. Each node has two                Then, we take the maximum number of people detected
2.4 GHz Intel Haswell E5-2620 v3 processors (6 cores per               amongst these frames as the person count for this clip.
CPU, 12 cores total), with 384GB RAM. The system uses
FDR Infiniband interconnect. Each compute node contains                                 VI. A NALYSIS M ETHODS
an NVIDIA Tesla K80 dual-GPU card. We utilize both                        Once we identify which cameras to analyze, we apply
Cooley and an additional NVIDIA Titan X GPU to run video               computer vision to detect people and vehicles by using
preprocessing object detection models on selected data.                two object detection models. The following sections provide
                                                                       details about the object detection models used. It is important
       V. DATA S ELECTION AND P REPROCESSING
                                                                       to note that while the models may not detect every car on
   It is unnecessary to analyze all images from all 30,261 still       the highway or every person in an image at a very small
image cameras. Therefore, we strategically choose cameras              scale, the object detector is consistent enough for purposes
to analyze based on two criteria: camera functionality and             of reporting trends over time.

                                                                   4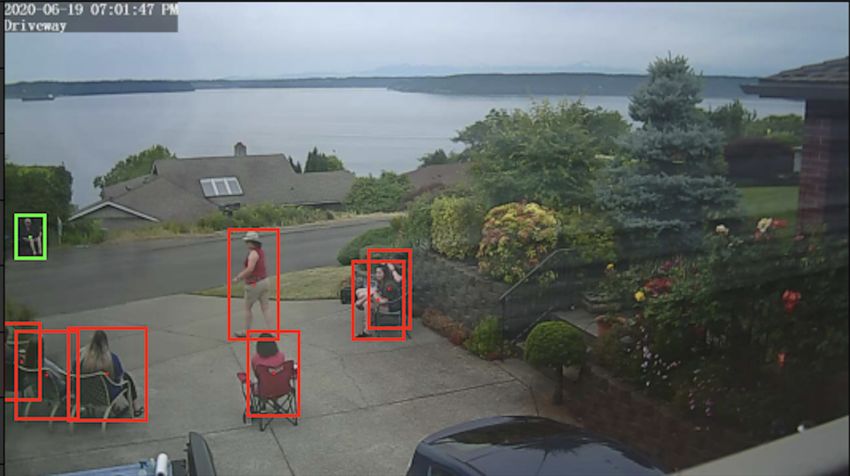
A. Detecting people in images
   We use a object detection model from Pedestron [13],
specifically, Cascade-HRNet [44, 48] trained on the Crowd-
Human dataset [41], to detect people. This model was val-
idated by the developers of Pedestron with a mean average
precision (mAP) of 84.1 on the CrowdHuman validation
dataset of 4730 images. We additionally validate this model
on a validation dataset of 1000 images constructed from
our network camera data by labeling ground truth bounding
boxes, using an IOU threshold of 0.5, resulting in an F1
score of 0.712 and a mAP of 61.3. We utilize a confidence          Fig. 5: Visualization of social distancing algorithm. Left:
threshold of 0.3 for inference.                                    How people appear in a 2D image. Right: How the people
                                                                   most likely appear in reality. The pixel distance between the
B. Detecting vehicles in images                                    two red boxes in the original image is greater than the pixel
   We use a YOLOv3 model trained on the MS COCO                    distance between the green and red boxes. However, only
dataset [19] to detect vehicles. The model was validated           the red boxes are in violation.
by Ultralytics [16] on the MS COCO validation set with
an mAP of 57.9. MS COCO contains 20 classes, four of               violations in an image, we check all pairwise combinations
which are ‘car’, ‘truck’, ‘motorcycle’, and ‘bus’, which we        of bounding boxes to decide whether each pair of boxes is
consider as vehicles. We additionally validate this model          in violation.
on a validation dataset of 1000 images constructed from               In order to develop a method that is lightweight, auto-
our network camera data by labeling ground truth bounding          matic, and robust to depth difference and camera angle, we
boxes, using an IOU threshold of 0.5, resulting in an F1           make the following assumptions:
score of 0.619 and a mAP of 45.6. We utilize a confidence
                                                                    1) All people in the image are the same height of 5.4 feet,
threshold of 0.3 for inference.
                                                                       which is the height of an average human.
C. Generating time-series plots from the data                       2) All detections reported by the object detector are peo-
                                                                       ple, including false positives.
   We run the object detectors on all image data, taking the
                                                                    3) All people in the image are standing upright and
maximum count as the people count for a given day for
                                                                       bounding boxes have the same aspect ratio.
a given camera. This accounts for measurements taken at
night, which may have little to no detection results and              While we recognize these assumptions decrease the con-
thereby serves as a smoothing filter on the number of              fidence of the reported number of violations, the method
detected people. We then plot the sum of the maximum of            works well enough to seek out locations with high levels
the numbers of detected people over all cameras in a country       of violations. The success of this method depends on the
or city to generate graphs of people and vehicles observed         accuracy of the object detection model used. In our case,
over time. Therefore, each point on the graph is composed          the object detection model is reasonably accurate, and in
of data from many cameras rather than a single camera. As          the majority of cases, the camera is far enough from people
some cameras have missing data for certain dates during the        to render relative height differences inconsequential. Most
timeframe analyzed, taking the maximum number of people            people are standing upright in the images, and in cases where
observed allows us to observe a clearer trend. While this          people are sitting down, our method still detects violations
process may keep outliers in the data, we consider these           well as shown in Figure 1.
useful. A spike in the data points to a possible scenario             The method works as follows: first, we account for the
warranting investigation. These plots are shown in Figure 9.       depth difference between the two bounding boxes. Assuming
                                                                   that all people are of average and equal height allows us
D. Total amount of data analyzed                                   to utilize the size of the bounding box as an indication
   In total, we analyze 2,498,920 images from still image          of how far the person is from the camera. We calculate a
cameras for people, and 6,174,806 images for vehicles. From        metric “depth similarity”, P , by dividing the area of the
164 video cameras, we analyze 1,750,733 frames for people.         smaller bounding box by the area of the larger bounding
In total, we analyze 10,424,459 images over a 4 month              box. The depth similarity metric approaches 1 as the two
timeframe.                                                         bounding boxes approach equal areas and approaches zero as
                                                                   the two people stand at increasingly different distances from
E. Calculating Social Distancing                                   the camera. Then, we calculate euclidean distance between
   We develop a method to count the number of social               the bounding box centers, D, measured in pixels. We scale
distancing violations in an image based on detected objects.       this distance by the average bounding box height to obtain
Violations are an important metric that is missed when only        “inverse relative distance”, ID. Finally, we multiply ID by
counting numbers of people. To count the total number of           P to obtain a number ranging from (0, image height in

                                                               5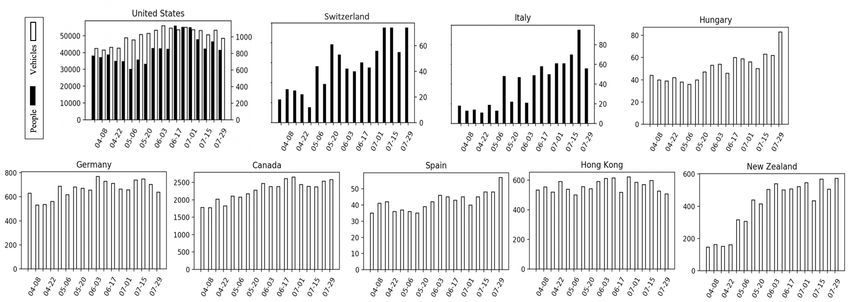
(a)                            (b)
Fig. 6: A comparison between the proposed method and
Visual Social Distancing [7]. Left: The team’s methods can           Fig. 8: Failures of the chosen object detection method on
successfully estimate people that are within six feet. Right:        selected images. (a) False positives detected on a road in
Visual Social Distancing fails to detect most people and             Jamestown, ND, USA. (b) 2 people detected incorrectly in
violations. Image source: Earthcam.com                               an image from a banner in Badneuenahr-ahrweiler, Germany.
                                                                     Although to human eyes it is obvious these people are
                                                                     drawn on a banner, object detection does not successfully
                                                                     take into account the context. Image sources: ND DOT,
                                                                     Webcamgalore.com

                                                                     aware of a concrete definition of what constitutes a ‘group’
                                                                     of people, we use these boundaries to estimate group sizes.
             (a)                           (b)
                                                                                            VII. R ESULTS
Fig. 7: Successes of the chosen object detection method on              Here we discuss successes and failures of the computer
selected images. (a) 35 people detected in Ocean Springs,            vision models chosen, the presented social distancing algo-
Mississippi, on May 28, 2020. (b) More than 80 people                rithm, crowd and group size statistics, violation statistics,
detected in a protest in Klagenfurt, Austria, June 6, 2020.          and worldwide trends over time.
Image sources: Wunderground.com, klagenfurt.it-wms.com
                                                                     A. Performance of Computer Vision
pixels) unless D is zero, in which case the centers of each             We show some successes of computer vision on world-
bounding box overlap. We do not consider this corner case            wide network camera data. We do not show the bounding
because empirical evidence shows that this case is unlikely          boxes on the following images as these would impede the
to present itself in realistic data. If the product is greater       reader’s view of the people. Annotated images are available
than 1, this indicates the two people are within an average          upon request. Figure 7 (a) shows 35 people detected in
person’s height of one another. However, if this product is          Ocean Beach, Mississippi. Although most people occupy
greater than (6/5.4) = 1.11, this indicates the two people are       very few pixels in the image, the model gives us a relatively
within 6 feet of each other. Since the accepted standard of          accurate estimate. More than 80 people are detected in Fig-
social distancing is normally 6 feet, we use this threshold          ure 7 (b) during a protest. Although we do not utilize crowd
for our experiments. Figure 6 shows the results of our               density methods, object detection still gives an estimate
method as compared to a recent method in literature, Visual          useful enough to allow observation of changes over time.
Social Distancing [7] that aims to estimate social distancing           Given the diversity and realistic nature of our data, we
violations based on a 6 foot radius around a person, but fails       find some limitations. For example, Figure 8 (a) shows
to detect many violations. It is important to note, however,         a road with separators detected as people. Figure 8 (b)
that violating social distancing is expected among family            shows an advertisement on a banner showing people. The
members or roommates.                                                object detector consistently detects 2 people because object
                                                                     detection does not take into account context. These results
F. Calculating Group Sizes
                                                                     could be ameliorated by increasing the confidence threshold
   To calculate group size, we create an unweighted graph            of our detector. However, we find that in many cases, the
in which all of the detected persons are each represented            resolution of data is so low that many true positives are
by a node, and edges are drawn between nodes based on                detected with low confidence threshold between 0.3 and 0.4.
social distancing violation. For example, if two people are          Thus, there is a trade-off to be considered when using a static
within six feet of each other, we draw an edge between               object detection model on image data at this scale.
their two nodes. We use two definitions of a group to create
a lower bound and upper bound of the largest group found             B. Social distancing violations
in a given image. The lower bound is defined as the largest             We utilize our social distancing algorithm to find specific
adjacency list of the graph. The upper bound is defined as the       locations in the world exhibiting low levels of social distanc-
largest connected component of the graph. Since we are not           ing. We show two examples here. Figure 11 (a) shows police

                                                                 6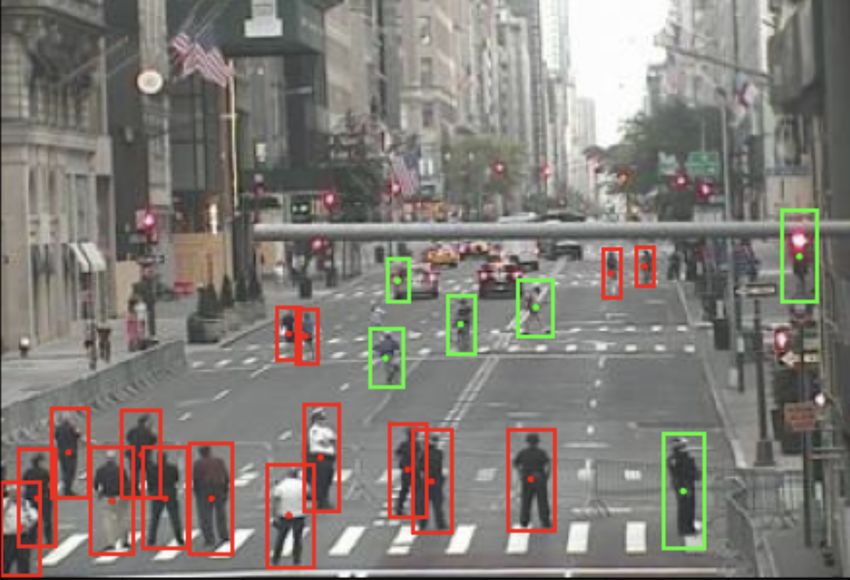
Fig. 9: Scatterplots of daily data from select countries. Different colors and markers represent different date ranges indicated
in the legend of each plot to reflect the period of lockdown and reopening. Red crosses represent lockdown. Other symbols
represent different phases of reopening.
Fig. 10: Scatterplots of daily data from select US states. Date ranges indicated in legend. Red crosses represent lockdown and
green circles represent reopening.
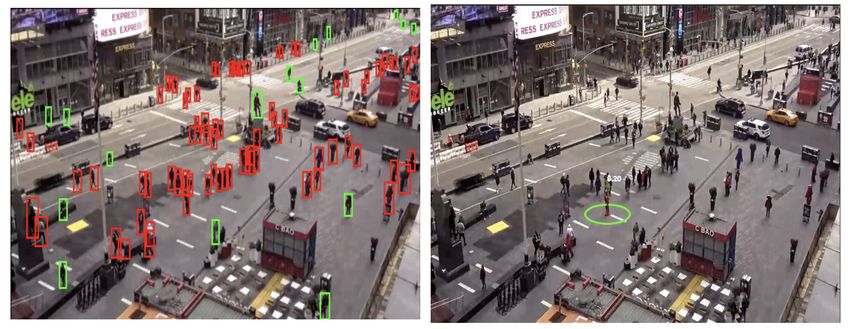
officers standing more closely together than pedestrians on The data shows that big groups are occasionally detected.
the street in New York City, USA. Figure 11 (b) shows Smaller group sizes and pedestrian counts are more frequent
people gathering in a backyard in Tacoma, WA, USA. A than larger ones.
full list of images found using this method can be accessed
at the Zenodo upload [9]. D. Observed Trends in Select Countries
Figure 15 shows the numbers of people and vehicles over
C. Trends in Crowd Sizes time detected by cameras in 9 countries. We show people
We observe pedestrian counts of up to 100, given the data for which the maximum number of people detected is
limitation of the model chosen. We observe the distribution at least 40 and vehicle data for which the maximum number
of pedestrian counts over all images as shown in Figure 12. of vehicles detected is at least 50. We do not set a minimum
We observe a similar distribution of violation counts as threshold because we expect to observe fewer people during
shown in Figure 13. We detect group sizes up to 63 using the lockdown, and thus do not rule out days where the number of
loose definition (upper bound), and sizes of up to 21 using people detected is minimal. In some countries with relatively
the strict definition (lower bound), as shown in Figure 14. few cameras, we still observe trends. It is important to note
7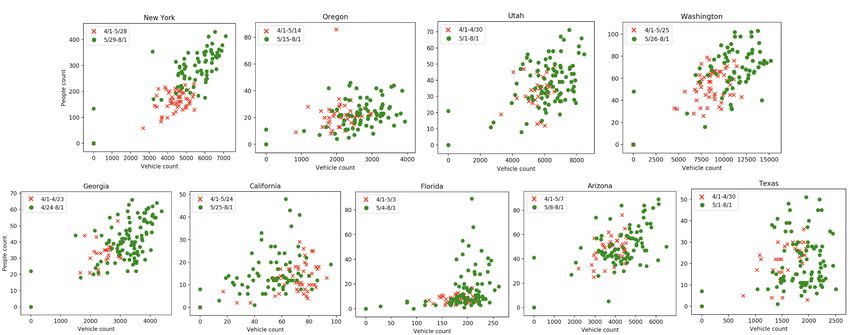
that these trends may not be representative, but may still
                                                                   provide insight. Figure 9 shows scatter plots of people counts
                                                                   vs. vehicle counts in 8 countries, where we do not filter any
                                                                   data. The (0,0) points on all charts are due to interruptions
                                                                   in data collection. Here we discuss trends in a few countries
                                                                   of note with sufficient data.
                                                                      United States In the United States, we observe a slight
                                                                   increase in the number of vehicles on roads over time and
              (a)                         (b)                      an unclear trend in the numbers of people in public over
                                                                   time as shown in Figure 15. Social distancing policies in
Fig. 11: Examples of the proposed algorithm performing in          the United States vary by state. As of March 31, 30 states
situations with varying camera angle and depth differences         published stay at home orders, and as of April 12, 12 more
between bounding box detections. (a) A street in New York          states did the same [46]. Reopening plans also vary by state,
City, NY, USA. Image source: NY DOT. (b) Backyard in               ranging from late April to early June. We do not observe a
Tacoma, WA, USA. Image source: Wunderground.com                    clear response to these orders in the data on a national scale.
                                                                   We show a few states of interest in Figure 10. We see that
                                                                   after respective reopening on April 24 [46] in Georgia, we
                                                                   see a slight increase in activity. We see a clearer increase
                                                                   in activity after New York’s June 8 reopening [45]. We see
                                                                   a slight increase in activity after May 26 in Washington.
                                                                   California shows a decrease in vehicle count and an increase
                                                                   in people count after May 25. We see an increase in people
                                                                   count following May 4 in Florida. Oregon shows almost no
                                                                   change after May 15, as do Utah and Texas after May 1,
Fig. 12: Histogram of people counts observed over all              and Arizona after May 8.
images. Left: zoomed in counts of 1-10 people. Right:                 France On March 16, France announced mandatory home
Counts of 11-100 people. 0 people are detected more than           confinement, a policy which was extended until May 11 [27].
1,200,000 times and are not shown.                                 After May 11, a clear increase in activity can be observed.
                                                                      Germany On March 22, Germany banned groups of 2 or
                                                                   more people in public [51]. Small businesses were reopened
                                                                   on April 20 [6], and on May 4, some schools and other
                                                                   institutions reopened [50]. We observe a general increase of
                                                                   activity in public areas following these dates.
                                                                      Australia In Australia several relaxations of restrictions
                                                                   occurred between April 27 and May 2 by various regions
                                                                   and states [32]. We show the changes happening after May
                                                                   1 and observe an increase in activity.
Fig. 13: Histogram of violation counts observed over all              Austria Austria reopened small shops on April 14 [35],
images. Left: zoomed in counts of 1-10 people. Right:              and lifted border restrictions on June 4 [11]. We observe a
Counts of 11-100 people. 1 violation is not possible as 2          steady increase in the numbers of both people and vehicles
people must be in violation with each other. More than             in public throughout these time periods.
1,000,000 images have no violation and are not shown.                 Great Britain On May 10, Great Britain changed their
                                                                   motto from “stay at home” to “stay alert” [12]. We observe
                                                                   an increase in people count but a decrease in vehicle count
                                                                   following this date.
                                                                      Czech Republic The Czech Republic opened museums
                                                                   and cinemas May 11, restaurants and bars May 25, increased
                                                                   public gathering size on June 8, and opened borders on
                                                                   June 15 for select countries from the EU [1]. We observe
                                                                   that vehicle counts do not show much change over time but
                                                                   people counts increase steadily.

Fig. 14: Histogram of group counts observed over all images.
                                                                                        VIII. D ISCUSSION
Left: Group counts of 1-10 people. Right: Group counts of
11-100 people. Lower bound and upper bound are calculated            Here we discuss limitations of the work presented and
as described in VI-F.                                              potential future directions of research.

                                                               8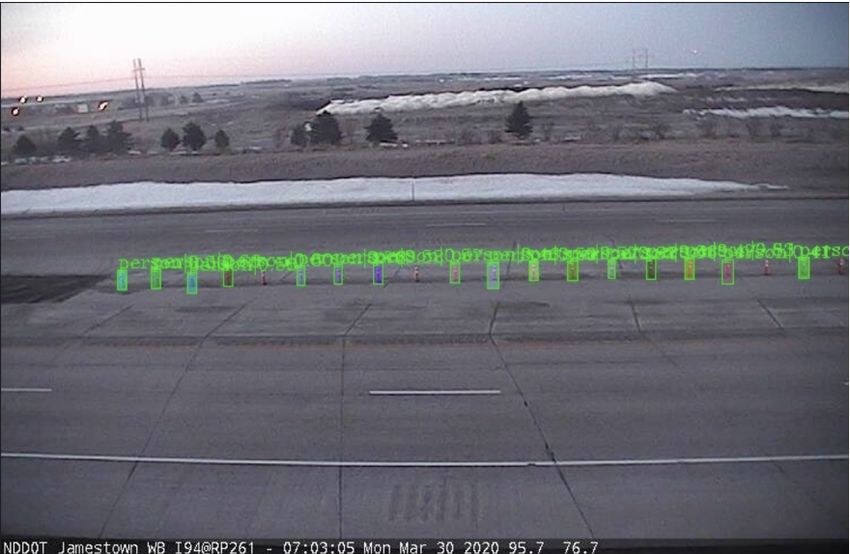
Fig. 15: Vehicle and people counts from April 1 to August 1. Weekly maximums are shown from the period starting with the
date indicated on the x-axis and ending with the date previous to the next date on the x-axis.

A. Performance of Computer Vision                                     are limited to locations observed by our camera network.
   While the object detection models utilized represent the           More representative results could be obtained with a more
state-of-the-art in computer vision, data obtained from cam-          expansive camera network, which is a direction of future
eras are diverse and thus pose challenges. There are cases            research. For example, the trends observed in Great Britain
of false positives and negatives for particularly difficult           and California do not resemble the trends observed in other
cases and low quality data. While the chosen methods can              US states or European countries.
provide reasonable estimates of numbers of people and
                                                                                           IX. C ONCLUSION
vehicles in images resulting in the ability to observe trends,
false detections may pose a problem for quantifying social               This paper seeks to answer the following questions:
distancing as the proposed method depends upon accurate               In the time of COVID-19, to what extent can computer
bounding boxes. To avoid compounding the error, even more             vision analyze worldwide network camera data for observing
robust object detection models should be developed.                   human activities? This paper presents the collection of live
                                                                      visual data from worldwide network cameras for monitoring
B. Calculating Social Distancing and Group Sizes                      responses to social distancing policies, successes and failures
   We observe variations in bounding box area and aspect              of powerful object detection models to detect people and
ratios leading to misclassifications. For our purposes these          vehicles in this diverse data, a social distancing algorithm,
misclassifications are negligible, but improving the method           and trends observed in 15 countries. We find that existing
is a direction of future work, such as by using Disnet                vision methods perform well enough on challenging data
[14]. Additionally, this study does not consider groups of            to allow us to observe preliminary trends, but are not
individuals that may belong to the same family or residence.          perfect. We utilize these methods to collect and display
Therefore, the number of violations in reality may be lower           aggregate numbers of people and vehicles over time in select
than the ones reported here, although the purpose of our              countries. We show the potential to observe responses to
documentation of violations is simply to show trends. We              social distancing guidelines using network cameras. Readers
additionally attempt to detect group sizes using two separate         interested in obtaining the data collected and full analysis
definitions based on graph theory and display distributions           may contact the project’s lead author, Isha Ghodgaonkar
of the group sizes detected. However, once the groups are             (ighodgao@purdue.edu).
identified, it is impossible to tell whether the individuals in
a given cluster belong to the same residence or not without                              ACKNOWLEDGMENTS
invading privacy. Graph theory also removes the spatial                  This research uses resources of the Argonne Leadership
dimension of data which is useful for determining group               Computing Facility, which is a DOE Office of Science User
sizes based on spatial heuristics. Therefore, definitively            Facility supported under Contract DE-AC02-06CH11357.
measuring social distancing is an emerging area of research.          We thank the Argonne Leadership Computing Facility for
                                                                      access to the Cooley supercomputer that was used in this
C. Observed Worldwide Trends                                          study. This project is supported in part by the National
   While this work provides insight into responses to so-             Science Foundation OAC-2027524 and Purdue College of
cial distancing guidelines, trends may not be representative          Engineering Fund for Security and Privacy. Any opinions,
of each geographical location. The results presented here             findings, conclusions or recommendations presented in this

                                                                  9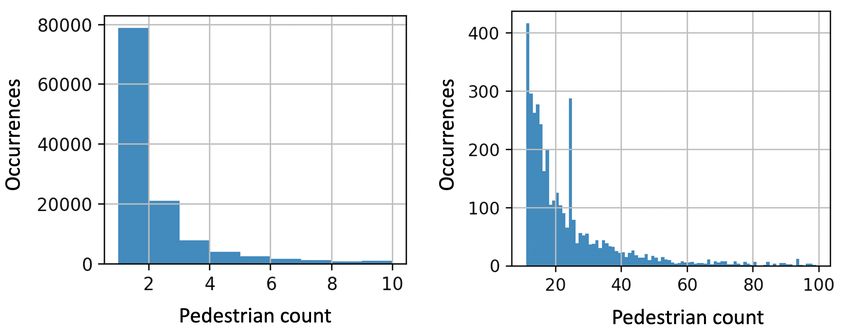
material are those of the authors and do not necessarily                           [30] H. Morita et al. International comparison of behavior changes with
reflect the views of the National Science Foundation.                                   social distancing policies in response to covid-19, 2020.
                                                                                   [31] S. Nebehay. WHO says new China coronavirus could spread, warns
                                                                                        hospitals worldwide. Reuters, January 14, 2020.
                            R EFERENCES                                            [32] A. B. C. News. One hundred days of the coronavirus crisis, May
 [1] Measures adopted by the czech government against the coronavirus,                  2020.
     Jun 2020.                                                                     [33] C. T. Nguyen et al. Enabling and emerging technologies for social
 [2] K. Abdulrahim et al. Traffic surveillance: A review of vision based                distancing: A comprehensive survey, 2020.
     vehicle detection, recognition and tracking. International journal of         [34] N. Oliver et al. Mobile phone data and covid-19: Missing an
     applied engineering research, 11(1):713–726, 2016.                                 opportunity?, 2020.
 [3] J. M. Alvarez et al. Road scene segmentation from a single image. In          [35] ORF.at.      Neue verordnungen: Details zu handelsöffnung und
     European Conference on Computer Vision, pages 376–389. Springer,                   maskenpflicht, Apr 2020.
     2012.                                                                         [36] J. L. Pépin et al. Wearable activity trackers for monitoring adherence
 [4] K. Chen et al. Feature mining for localised crowd counting. In BMVC,               to home confinement during the covid-19 pandemic worldwide: Data
     volume 1, page 3, 2012.                                                            aggregation and analysis. J Med Internet Res, 22(6):e19787, Jun 2020.
 [5] K. Chen et al. MMDetection: Open mmlab detection toolbox and                  [37] J. Redmon.          Darknet: Open source neural networks in c.
     benchmark. arXiv preprint arXiv:1906.07155, 2019.                                  http://pjreddie.com/darknet, 2013–2016.
 [6] K. Connolly. Germany takes tentative steps back to normality as               [38] J. Redmon et al. You only look once: Unified, real-time object
     lockdown eases, Apr 2020.                                                          detection. In IEEE conference on computer vision and pattern
 [7] M. Cristani et al. The visual social distancing problem, 2020.                     recognition, pages 779–788, 2016.
 [8] R. Dailey et al. Automated discovery of network cameras in                    [39] R. Saavedra. Global Emergency Declared Over Coronavirus; First
     heterogeneous web pages. Submitted for Review, Mar. 2020.                          Transmission Confirmed In U.S. The Daily Wire, January 30, 2020.
 [9] I. Ghodgaonkar. Violations detected from social distancing algorithm,         [40] R. Senaratne. Social distance detector with python, yolov4, darknet,
     Aug. 2020.                                                                         and opencv.
[10] A. Goel et al. Low-power object counting with hierarchical neural             [41] S. Shao et al. Crowdhuman: A benchmark for detecting human in a
     networks. Proceedings of the ACM/IEEE International Symposium                      crowd. arXiv preprint arXiv:1805.00123, 2018.
     on Low Power Electronics and Design, Aug 2020.                                [42] Z. Shi et al. Counting with focus for free. In IEEE International
[11] G. Gotev. Austria lifting coronavirus border checks with all neigh-                Conference on Computer Vision, pages 4200–4209, 2019.
     bours bar italy, Jun 2020.                                                    [43] H. Song et al. Vision-based vehicle detection and counting system
[12] gov.uk. Prime minister’s statement on coronavirus, May 2020.                       using deep learning in highway scenes. European Transport Research
[13] I. Hasan et al. Pedestrian detection: The elephant in the room. arXiv              Review, 11(1):51, 2019.
     preprint arXiv:2003.08799, 2020.                                              [44] K. Sun et al. Deep high-resolution representation learning for human
[14] M. A. Haseeb et al. Disnet: A novel method for distance estimation                 pose estimation. In CVPR, 2019.
     from monocular camera. 10th Planning, Perception and Navigation               [45] T. N. Y. Times. New york city is expected to open june 8, cuomo
     for Intelligent Vehicles (PPNIV18), IROS, 2018.                                    says, May 2020.
[15] H. Idrees et al. Composition loss for counting, density map estimation        [46] T. N. Y. Times. See how all 50 states are reopening (and closing
     and localization in dense crowds. In European Conference on                        again), Apr 2020.
     Computer Vision, pages 532–546, 2018.                                         [47] A. van Loon et al. Not just semantics: Social distancing and covid
[16] G. Jocher et al. ultralytics/yolov3: 43.1map@0.5:0.95 on coco2014,                 discourse on twitter. 2020.
     May 2020.                                                                     [48] J. Wang et al. Deep high-resolution representation learning for visual
[17] P. Khandelwal et al. Using computer vision to enhance safety of                    recognition. TPAMI, 2019.
     workforce in manufacturing in a post covid world, 2020.                       [49] Q. Wang et al. Learning from synthetic data for crowd counting in the
[18] Q.-L. Li and J.-F. He. Vehicles detection based on three-frame-                    wild. In IEEE conference on computer vision and pattern recognition,
     difference method and cross-entropy threshold method. Computer                     pages 8198–8207, 2019.
     Engineering, 37(4):172–174, 2011.                                             [50] D. Welle. Merkel cautiously optimistic as she announces lockdown
[19] T.-Y. Lin et al. Microsoft coco: Common objects in context. In                     rollback, May 2020.
     European conference on computer vision, pages 740–755. Springer,              [51] Welt. Coronavirus deutschland: Kontaktverbote zu mehr als zwei
     2014.                                                                              personen, friseure zu - welt, Mar 2020.
[20] L. Liu et al. Crowd counting with deep structured scale integration           [52] S. Workman and N. Jacobs. Dynamic Traffic Modeling from Over-
     network. In IEEE International Conference on Computer Vision,                      head Imagery. In IEEE Conference on Computer Vision and Pattern
     pages 1774–1783, 2019.                                                             Recognition (CVPR), 2020.
[21] W. Liu et al. Ssd: Single shot multibox detector. In European                 [53] D. Yang et al. A vision-based social distancing and critical density
     conference on computer vision, pages 21–37. Springer, 2016.                        detection system for covid-19. arXiv e-prints, pages arXiv–2007,
[22] Y. Liu et al. Optical flow based urban road vehicle tracking. In                   2020.
     2013 ninth international conference on computational intelligence and         [54] Y. Zhang et al. Single-image crowd counting via multi-column
     security, pages 391–395. IEEE, 2013.                                               convolutional neural network. In IEEE conference on computer vision
[23] Y.-H. Lu. US patent 10367877: System and method for identifying                    and pattern recognition, pages 589–597, 2016.
     publicly available cameras, July 30, 2019. US Patent 10506201.                [55] T. Zhao and R. Nevatia. Bayesian human segmentation in crowded
[24] Y.-H. Lu and R. M. Dailey. US patent application 16/846365:                        situations. In 2003 IEEE Computer Society Conference on Computer
     Automated discovery of network camera in heterogeneous web pages,                  Vision and Pattern Recognition, 2003. Proceedings., volume 2, pages
     March 26, 2020. US Patent 10506201.                                                II–459. IEEE, 2003.
[25] Y.-H. Lu et al. See the world through network cameras. IEEE                   [56] B. Zhou et al. Learning deep features for scene recognition using
     Computer pages 30-40, Volume 52, Issue 10, October 2019.                           places database. In Advances in neural information processing
[26] J. Ma. China’s first confirmed Covid-19 case traced back to November               systems, pages 487–495, 2014.
     17. South China Morning Post, March 13, 2020.                                 [57] B. Zhou et al. Places: A 10 million image database for scene
[27] F. Magnenou and V. Matalon. Replay. coronavirus : prolongation du                  recognition. IEEE Transactions on Pattern Analysis and Machine
     confinement jusqu’au 11 mai, tests, masques... revivez l’allocution                Intelligence, 2017.
     d’emmanuel macron, Apr 2020.                                                  [58] Z. Zou et al. Crowd counting via hierarchical scale recalibration
[28] A. Malik et al. US patent 10506201: Public safety camera identifi-                 network. arXiv preprint arXiv:2003.03545, 2020.
     cation and monitoring system and method, December 10, 2019. US
     Patent 10506201.
[29] R. Manikandan and R. Ramakrishnan. Video object extraction
     by using background subtraction techniques for sports applications.
     Digital Image Processing, 5(9):435–440, 2013.

                                                                              10
You can also read


