Using Wearable Sensors and a Convolutional Neural Network for Catch Detection in American Football - MDPI
←
→
Page content transcription
If your browser does not render page correctly, please read the page content below
sensors
Article
Using Wearable Sensors and a Convolutional Neural
Network for Catch Detection in American Football
Bernhard Hollaus 1, *,†        , Sebastian Stabinger 1   , Andreas Mehrle 1 and Christian Raschner 2
 1    Department of Mechatronics, MCI, Maximilianstraße 2, 6020 Innsbruck, Austria;
      sebastian@stabinger.name (S.S.); andreas.mehrle@mci.edu (A.M.)
 2    Department of Sport Science, University of Innsbruck, Fürstenweg 185, 6020 Innsbruck, Austria;
      Christian.Raschner@uibk.ac.at
 *    Correspondence: bernhard.hollaus@mci.edu; Tel.: +43-512-2070-3934
 †    Current address: Maximilianstraße 2, 6020 Innsbruck, Austria.

 Received: 6 October 2020; Accepted: 21 November 2020; Published: 24 November 2020

 Abstract: Highly efficient training is a must in professional sports. Presently, this means doing
 exercises in high number and quality with some sort of data logging. In American football many
 things are logged, but there is no wearable sensor that logs a catch or a drop. Therefore, the goal of this
 paper was to develop and verify a sensor that is able to do exactly that. In a first step a sensor platform
 was used to gather nine degrees of freedom motion and audio data of both hands in 759 attempts to
 catch a pass. After preprocessing, the gathered data was used to train a neural network to classify all
 attempts, resulting in a classification accuracy of 93 %. Additionally, the significance of each sensor
 signal was analysed. It turned out that the network relies most on acceleration and magnetometer data,
 neglecting most of the audio and gyroscope data. Besides the results, the paper introduces a new type
 of dataset and the possibility of autonomous training in American football to the research community.

 Keywords: sensor platform; wearable; machine learning; convolutional neural network; American
 football; catch detection

1. Introduction
     Data in sports is becoming increasingly important. In sports such as football, tennis, baseball, etc.,
data is used to prepare for matches, improve the performance of athletes and teams, analyze opponents,
monitor training progress and many more things [1–4]. Decades ago, all mentioned tasks were based
on human analysis, evaluation and intuition. As possibilities increased with the introduction of
computers, computer aided analysis became increasingly popular, e.g., in scouting, opposition analysis
or training monitoring [2,5–7]. Meanwhile, the state of the art comprises a mixture of human and
computer-aided evaluation and analysis, mainly based on data, processed with modern methods of
deep learning [8–12].
     All computer-based forms of evaluation and analysis need underlying sensor systems to gather
relevant data. In American football, these sensor systems are almost exclusively electronic performance
and tracking systems (EPTS), according to the definition by the digi sporting consortium [13].
The sensor systems used to record data are dictated by the application and the required data quality,
which has lead to a wide range of sensor systems.
     First and foremost, optical-based tracking systems and local positioning systems are used across a
wide range of sports [4,14–16] to determine an athlete’s position on the field and its change over time.
For American football in particular, these systems may be combined with complimentary systems,
such as wearables for motion sensing [17] or passing machines [18]. The former often come in the
shape of inertial measurement units (IMUs). Since these IMUs gather data for a single point in space
the placement of the IMU is critical for the measurement [17,19–22]. Depending on the application the

Sensors 2020, 20, 6722; doi:10.3390/s20236722                                   www.mdpi.com/journal/sensors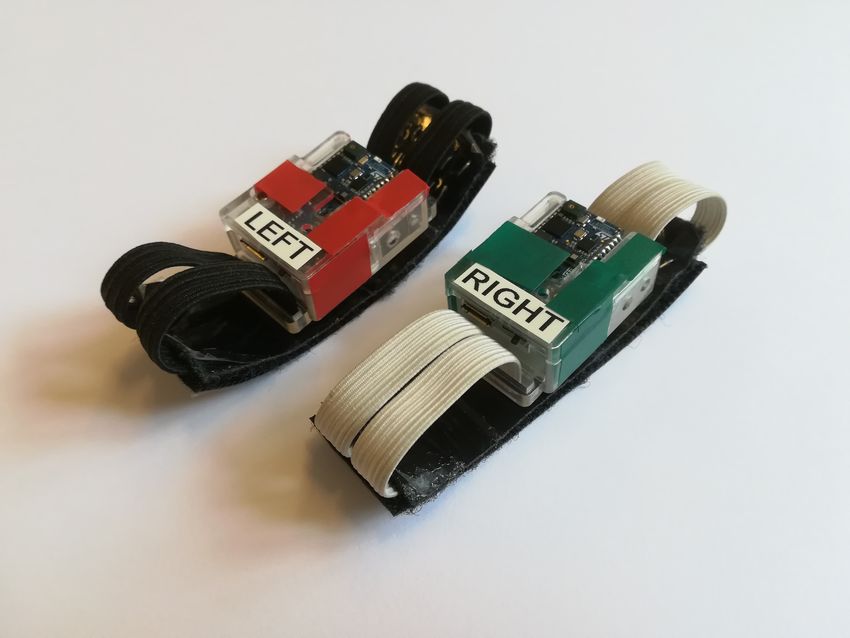
Sensors 2020, 20, 6722                                                                                2 of 16

IMU may be placed directly on the skin [17] a wristband, harness or similar [23,24], but also within
a ball, shoe or alike is common [25]. If the orientation of the IMU sensor in space is relevant as well,
magnetic flux densities are often measured as well in combination with applying some sort of sensor
fusion (Kalman-, Madwick-filtering or other [26,27]) on the measured data.
      Once data is collected with the aforementioned measurement systems, it is processed with specific
algorithms starting from simple Butterworth filters to more advanced sensor fusion techniques [28–30].
Over the last decade, processing the given data with neural networks became more popular [11,31,32].
Machine learning provided new analysis methods for data, hence old data could be used to gain new
insights [10,32–34]. The main problem with machine learning at the moment is the amount of data is
necessary to get good generalized results. In some sports, data is practically non-existent, due to the
lack of sensors or adequate equipment. Sometimes, data exists but only in a very limited fashion. As a
result, applying machine learning is challenging in many situations yet the combination of machine
learning with IMUs has shown promising results [11,32,34,35].
      An example of a sport that proves promising for the application of IMUs and machine learning is
American football. Currently, performance measures in American football are based on metrics that
summarize a large amount of detailed data, sometimes for specific aspects of the sport. Over the years,
these statistics became more advanced and have had an increasing impact on the match [36]. On the
level of individual players, available metrics focus either on the overall performance of the player or on
a specific performance aspect. One example of an overall metric is the quarterback rating, also called
the passer rating. It summarizes the performance of a quarterback within a season. This metric is also
referenced in the official NFL record and fact book every year [37]. In contrast to the NFL, the NCAA
uses a slightly different algorithm to evaluate the passer rating [38]. Wide receivers are often evaluated
with the defense-adjusted yards above replacement or the defense-adjusted value over average metric
[39]. When considering the entire team, metrics focus on the team performance and sometimes more
specifically on a subgroup of the team. Naturally, the offense team needs other metrics than the defence
or special team. Also, within each part of the team, further distinctions may be useful. For example,
a defence can be evaluated in their ability to stop runs of the opposing team early, but also the pass
protection is of interest for an analysis. Metrics such as the sack rate, adjusted line yards, or second
level yards, are typical for the defense line and linebackers [39].
      Apart from metrics based on match statistics, players are regularly subjected to test scenarios in
order to assess their performance. The “NFL combine” is an annual event in which selected athletes
perform specific drills in order to establish an objective comparison. Tests such as the Wonderlic
test [40], 20 and 60 yd shuttle, bench press, 40 yd dash, vertical and broad jump, etc. [41] deliver
relevant data for scouts and coaches in the NFL. Based on this data, decisions for the draft are made,
which is also reflected in [42]. The 40 yd dash especially is a predictor for the rank of athletes across all
positions. Nevertheless, good results in the NFL combine do not correlate well with the performance
of quarterbacks and wide receivers in the NFL [43].
      All mentioned metrics are calculated from statistics of various actions and outcomes in the match
or the NFL combine. Actions can be sacks, fumbles, drops, catches, pass attempts, etc. Outcomes can
be a new first down, touchdown, turnovers, field goal, safety, etc. One drawback of the commonly
used metrics is that they either rely on match data or the NFL combine. This excludes all athletes that
are not part of a league that keeps track of all the relevant data. Additionally, all athletes that have low
match time do not contribute significantly to the statistics and therefore the metrics for them are also
not statistically significant. The lack of data in American football is problematic in some parts of the
sport. On an amateur level, data is either not collected at all or only collected in an insufficient amount.
Therefore, it is not possible to calculate meaningful metrics. To overcome this difficulty, one would
also need to gather data during training to cover more athletes and obtain more detailed information
about an athlete’s skill set. Additionally, new metrics for this new kind of data are necessary.
      American football training is multifaceted in its exercises. Offensive plays in an American football
match can be executed in various ways. A very common one is to pass the ball to a receiving player,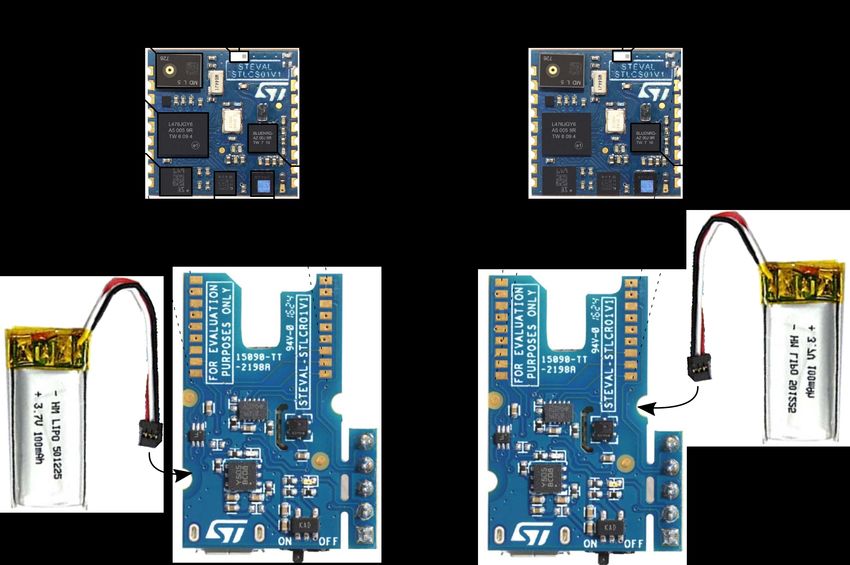
Sensors 2020, 20, 6722 3 of 16
catch the pass, and the run towards the end zone to score and win the match. All parts of this play are
represented in training. Since there is a variety of exercises in training, necessary data for a potential
neural network processing can vary for each respective exercise. One of the exercises in American
football is about catching a pass, representing a key component in the match.
Catching the pass is a crucial point in a play and can decide whether a match is won or lost.
Hence, choosing the right athlete as a receiver with the highest catch probability for a given play is
very important. The decision process should be based, at least partly, on data. Therefore, data about
catching, that contribute to a better decision, would be of interest. Unfortunately, the commonly used
metrics and data on catching do not provide a good basis.
To calculate relevant information for coaches, scouts, etc. it is necessary to provide data on catching
first. The fundamental measurement is about a classification of a catch or drop of an individual receiver.
Based on that measurement, things like an individual catch probability or a receiver rating for various
scenarios can be calculated. At first though, an adequate sensor platform has to be chosen and the
corresponding algorithms have to be implemented.
Therefore, the main goal of this paper is to provide a sensor with a corresponding algorithm that
allows receivers to automatically detect whether they caught or dropped a pass. The detection has
to be reasonably reliable, which leads to the goal that at least 90 % of all passes should be classified
correctly overall. Since there is no need to classify the data in real time, no time limitations for the
algorithm are given.
2. Materials and Methods
2.1. Approach to Measurement
To be able to classify a catch or a drop a sensor platform is needed that provides potentially
important data. In general, there are several approaches to measure the relevant data. One possible
way is to use a camera system that records the catching motion. With the video as input to an algorithm,
it may be possible to classify a catch or a drop within the recorded video. A second possible approach
is to use IMUs in wearables to monitor the movement of the arms of the receiver. With the motion
data of the arms and a corresponding signal processing algorithm, a catch or a drop may be detectable
within a sequence. A third possible approach is to record the sound during the catching process. Again,
a signal processing algorithm would do the classification. Further options would be a mixture of the
sensor (more data might lead to more reliable results), or an IMU within the ball that is caught.
The decision for this paper was to go with a wearable that provides several sensors, such as a
9 degrees of freedom (DOF) IMU, a pressure sensor and a microphone. Additionally, the platform had
to be programmable so adjusting sampling rate, sensor sensitivity, synchronisation, data labeling, data
storage etc. could be performed on the wearable, before or during the experiment.
2.2. Sensor Platform
The evaluation kit STEVAL-STLKT01V1 from ST Microelectronics was used as the sensor platform.
The sensors on the platform are listed in Table 1 or in [44–53].
Further adaptions to the hardware were necessary to fit the experimental needs. Since each wrist
of a pass receiving athlete wears one wearable, some sort of synchronisation algorithm had to be
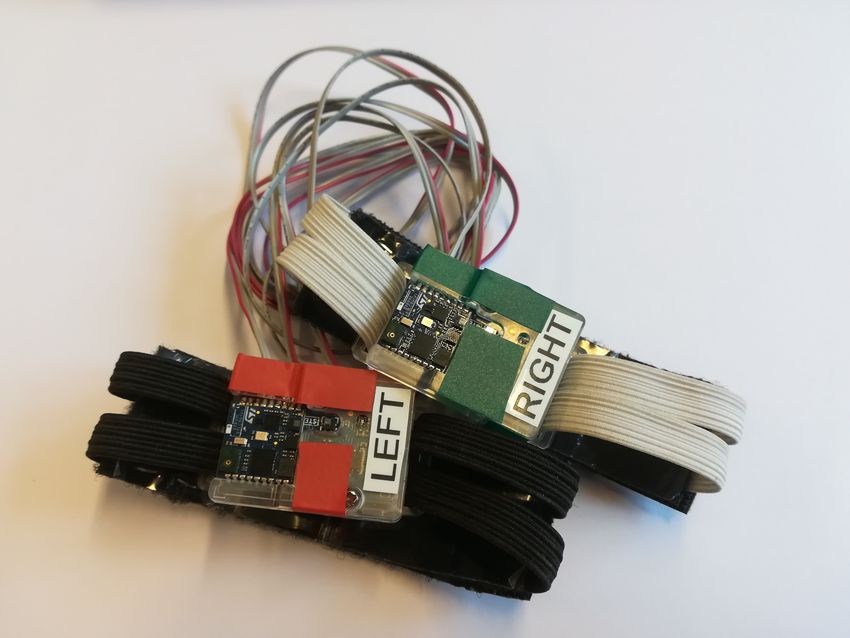
developed. Figure 1 shows the prototype of each version, with a more detailed setup of the prototypes
in Figure 2.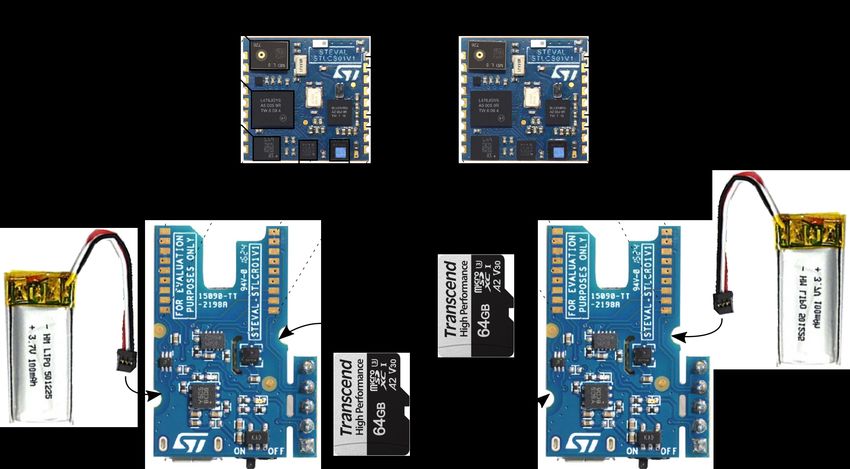
Sensors 2020, 20, 6722                                                                                       4 of 16

                            (a)                                                       (b)
      Figure 1. Prototype Version 1 uses general purpose inputs and outputs for synchronisation and
      labeling, hence a button for each board and a wire to connect the wearable on each wrist were necessary.
      For version 2 there was no further need for this. (a) Prototype Version 1, (b) Prototype Version 2.

                  Table 1. Settings of the Sensors on the STEVAL-STLKT01V1 for the experiment.
          Sensor Code      Sampling Frequency f s         Range         Resolution          Usage
           LSM6DSM                1 kHz                   ±16 g           16 bit         acceleration
           LSM6DSM                1 kHz                ±1000 ◦ s−1        16 bit           spin rate
          LSM303AGR               100 Hz                 ±5 mT            16 bit        magnetometer
            LPS22HB               100 Hz              260–1260 hPa        16 bit       absolute pressure
          MP34DT05-A              8 kHz               0–122.5 dbSPL       16 bit            audio

     As shown in Figure 1, two versions of the wearable have been developed. The first version,
which uses wires and a pulse signal to trigger both wearables and synchronise their time stamps,
has been developed earlier. The second version, which is based on wireless synchronisation and
triggering of the wearables, provides more freedom for the athlete. Both versions were used in
the experiment.
     Each catch or drop delivers a data sequence, which needs to be labeled according to the outcome
of the respective try to catch the pass. This labeling process was done differently for the two versions
of the wearable. The wired version, as can be seen in Figure 1a, has one button on each wearable
which is either pushed to label a catch or a drop. The devices were programmed in pairs, so one
device was always configured with a catch label button, and the other one with a drop label button.
According to Figure 1 additional colored tape indicated the respective meaning of the button to
minimize mislabeling. The wireless version sends the data sequence to a mobile device, where it is
labeled manually within an application, running on the mobile device.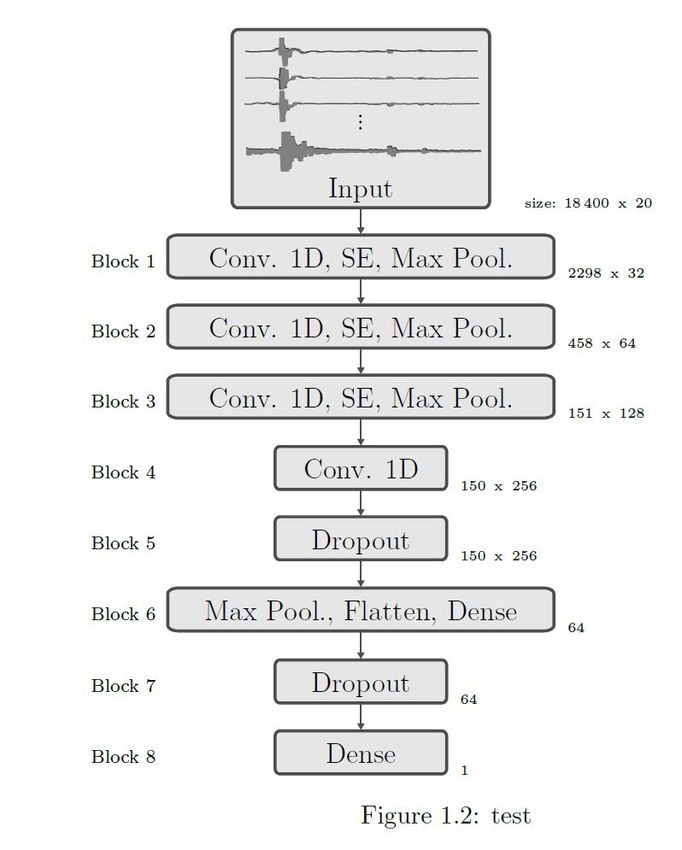
Sensors 2020, 20, 6722                                                                                  5 of 16

                                            (a) Prototype Version 1

                                               (b) Prototype Version 2
      Figure 2. Two prototypes were developed for the experiment. The components on the printed circuit
      board (PCB) are indexed as follows with a: microphone, b: microcontroller, c: accelerometer and
      gyroscope, d: magnetometer, e: pressure sensor. (a) shows the first version of the wearable, with a
      wired synchronization and data labeling setup as the components are indexed with f: synchronization
      wire, g: labeling button, h: common ground. (b) shows the setup with a wireless synchronization via
      Bluetooth low energy (BLE) with the components indexed as i: BLE Communication chip and j: Antenna.
      The labeling of the data is done in an application running on the mobile device.

2.3. Design of Experiment
     The design goal of the experiment was to gather data on a broad spectrum of catches with a
multitude of athletes and a wide range of possible conditions. In this case, a neural network, used as
the signal processing algorithm, is forced to train its parameters on general signal information of
catches and drops, not on specific ones from an athlete, pass, catching motion, or alike. For that
reason, nearly no restrictions were given to the participants of the experiment within the task of data
acquisition. The only relevant restriction was to try to catch the pass and do not fake drops, since the
data should represent natural circumstances. Though, uncatchable passes, e.g., passes which are
thrown not near enough to the receiver, are not considered a valid try, and should not be logged.
     The experiment was reviewed and approved by the ethics board of the MCI. All participants
were informed about the goal of the study, its risks and how the participants data will be processed.
All participants signed a form of consent, which can be accessed by request.
     To meet the design goal of the experiment, eight participant have carried out tests under various
conditions. All of them were male with an age between 24 and 35. Their abilities to catch a pass are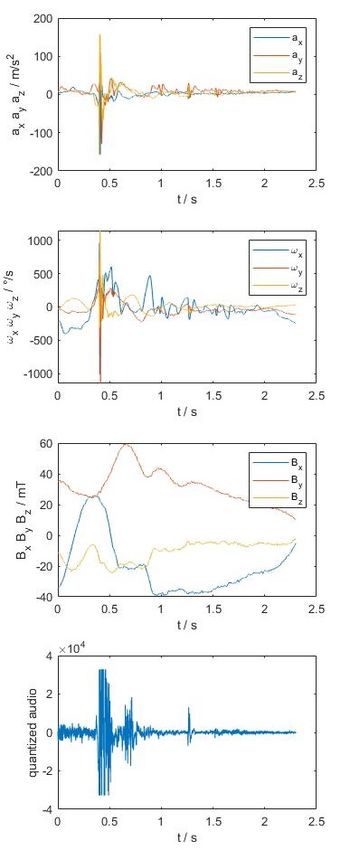
Sensors 2020, 20, 6722                                                                                6 of 16

classified due to their further experience within sports and American Fooball. A participant, who has
no ball sports related experiance, is classified as a novice. If the participant is familiar with sports
such as basketball, baseball, handball or other ball-related sports, he is classified as advanced, since he
has experience in estimating a trajectory of a pass [54–58] and is used to catch passes with other balls.
A former or active player in American Football is classified as an expert.
     Table 2 shows all relevant conditions that have been varied within the experiment. It underlines
the multitude of conditions and athletes skills that contribute to a multifaceted set of data for training
a neural network.

                              Table 2. Various conditions for the experiment.

    Condition              Range
    pass source            human quarterback, automated passing machine [31]
    movement scenario      standing, running left/right/towards/away from the passer, jumping
    positioning scenario   facing towards, sideways, away from the passer
    pass scenario          passes thrown high and low, off target, over the shoulder
    catch scenario         one/two handed, body catch (first impact is on the body)
    athlete level          four novice/three advanced/one expert
                           brightness levels from approximately 50–80,000 lx, indoor and outdoor tests,
    external               experiments with and without wires running from one wearable to the other via
                           the sleeves (due to the different prototype versions)

2.4. Data Acquisition
      Prior to data acquisition, the wearables were fixed to the wrists. As can be seen in Figure 1,
the wearables have labels with the text “left” and “right” on them. All participants were instructed to
wear the wearables in an orientation so they could read the labels. This ensured that the wearables
were not worn in a flipped manner, which would have led to rotated coordinate systems for some of
the sensors.
      As a first step in the data acquisition process, the sensor platforms had to be configured correctly
in the initialization state. This was implemented trough a start up routine in the firmware of the sensor
platform, which makes sure that every time the system is powered on, the system is configured in the
same way. To monitor the motion during a catch or drop, the sensor platform was configured to meet
the given sampling rates, range and resolution according to Table 1.
      As a second state, the wearables are waiting for a trigger to record the whole data sequence.
In this state, all signals were sampled continuously on both wearables and intermediately saved in a
first in first out buffer on the random access memory (RAM) of the sensor platform. The buffer was
configured to save approximately one second of data. If a trigger event happens, which reflects an
absolute acceleration over 14 g, additional two seconds of all signals are sampled and recorded on the
RAM. Both wearables were configured in a way such that if one wearable is triggered, also the other
one is triggered. This is important to have synchronous data sets. One try to catch a pass leads to three
seconds of data, one before and two after the trigger.
      Depending on the version of the prototype, the labeling process, which follows the second state,
was performed via the wearables or a mobile device. With prototype version 1 labeling was the next
step in the data acquisition process after the data sequence was recorded. Directly after the end of the
second state, a five second time window allowed the receiver to label the logged data as catch or drop
via the button on the wearables. As mentioned, a catch was labeled by pressing the button of the green
wearable and a drop by pressing the button of the red one. After the raw signals were logged and
labeled, data was transferred to a local SD card. Version 2 of the prototype sends the logged raw data
directly to a smart device, for labelling.
      In total, 759 data sequences were recorded, using the procedure described above. This resulted
in a dataset with 541 catches and 218 drops, covering the range of conditions given in Table 2. In the
past, a classic approach for analysis would have been the extraction of hand-crafted features from the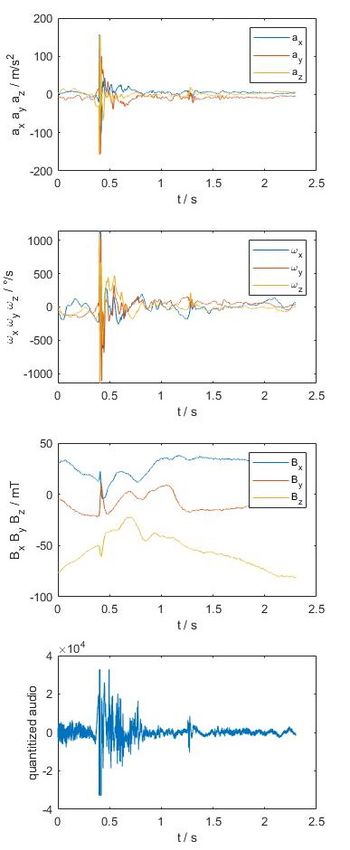
Sensors 2020, 20, 6722                                                                              7 of 16

recorded sequences (e.g., Fourier features, wavelets, etc.) and the use of a support vector machine
(SVM) for classification.
     Although hand-crafted features and SVMs are still used to classify sensor signals in sports [32],
fully parametric solutions are also able to identify similar (and more complex) features from training
data. These fully parametric ML systems have been shown to outperform the hand-crafted approaches,
if enough training data is available [59]. Since the present study meets this requirement, we opted for
a convolutional neural network (CNN) to detect catches.

2.5. Preparation of Data for the Development of a Convolutional Neural Network
     After data acquisition, all 759 data sequences had to be prepared for the neural network. Due to
different sampling times and distribution of the data over two SD cards for the prototype version
1, an algorithm was used to create a standardized data shape, which can be used by the network.
The algorithm uses linear interpolation to upsample the raw data to 8 kHz. To remove irrelevant data
and artefacts from the data, the first 0.7 s are cut from all signals. Due to the outfall of the pressure
signals in several data sequences no pressure signal was taken into the final data set for the network.
Additionally, the data of both wearables is merged to one sequence, resulting in a matrix with a
dimension of 18,400 × 20 for each signal as input for the network.

2.6. Neural Network Architecture and Implementation
     The network should be able to identify unique features in data sequences that classifies the data
as a catch or a drop. Feature extraction is a very common problem in computer vision and signal
processing. Convolutional neural networks (CNN) for feature extraction are commonly used due
to their good performance [60–64]. For this reason this paper also uses a model that is based on
convolutional layers. A sequential model with multiple convolutional, average, max pooling, dense,
and dropout layers to extract relevant features is used. This sequential model is illustrated in Figure 3.
The given data is split in five equally sized sub sets, which all contain the same percentage of catches
and drops. Four subsets were used for training the network, and one subset served as a validation
set. Ranger [65] was used as the optimizer, with a maximum of 1000 epochs. An early stopping
configuration with a patience of 20 optimization cycles and a minimum improvement of the validation
loss of 1 × 10⁻³ per cycle was used to reduce the training time and prevent overfitting. As a loss
function, binary cross entropy was used since the networks output is binary (either a catch or a drop).
As an activation function in all layers, except for the output layer, a parametric rectified linear unit
(PReLu) [66] was used. The output layer uses a logistic sigmoid as its activation function. In total,
the network has 2,198,365 trainable parameters.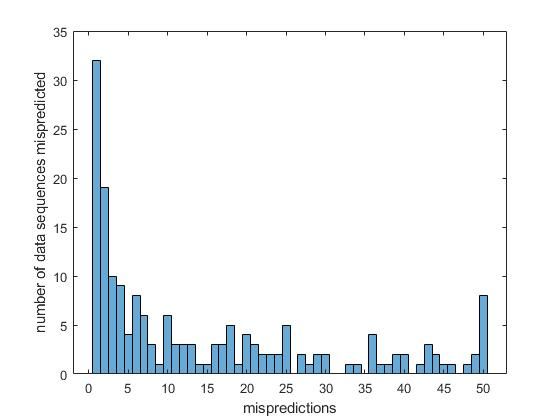
Sensors 2020, 20, 6722                                                                                         8 of 16

      Figure 3. The neural network architecture used for the experiments in this paper. Blocks 1 to 3 consist of
      a convolution layer with additional layers such as squeeze and excitation layer and max pooling layer.

3. Results and Discussion
     To get a better understanding of the catching motion, the first findings in the signals have not
been identified by computer aided analysis, but by observation of an average try to catch a pass and
the corresponding signals. Among the participants of the experiment, several approaches to catch a
pass were observed. The novice participants lacked a good catching technique, which resulted in more
drops on average in comparison to the expert and advanced level athletes. Nevertheless, the process
of catching was the same for all athletes. The catching motion starts with a unique starting pose for
each athlete. After the pass is released the athlete starts to position himself according to his estimation
of the ball’s trajectory. In this positioning phase, the novices tended to have a sharper movement,
due to misjudgment and readjusting, resulting in higher accelerations, in comparison to the advanced
and expert athletes. When the ball establishes contact with the hands for the first time, the catching
phase starts. This can be observed in the data sequences as strong amplitudes in acceleration, spin rate,
volume, etc. A few hundred ms after the impact, the catching phase ends and the post impact phase
starts. During this phase, a variety of different signal shapes occur. The shape highly depends on the
scenario, athlete and the outcome of the catching process. Assuming the cause-effect relationship,
especially the catching and post impact phase contains information about a catch/drop. Although it
was possible to characterise the phases of the catching process, it was not possible to find clear and
easily visible indicators for a catch/drop within the signals, with classic methods of signal processing
such as thresholding, Fourier and wavelet analysis. This finding underlines the need for neural
networks, since the classification is not easily possible with conventional signal processing.

3.1. Raw Data and Input to the Neural Network
     The collected dataset is too large to visualize it completely, therefore only an excerpt is given
in Figure 4. This excerpt also is an example for an illustration of the input to the neural network.
Note, that input data highly depends on the conditions listed in Table 2. Figure 4a shows the left
hand and Figure 4b the right hand signals, which are acceleration a in all axis, spin rate ω around all
Sensors 2020, 20, 6722 9 of 16
axis, flux density B in all axis and quantized audio. Feel free to contact the authors for access to the
whole dataset.
(a) (b)
Figure 4. Raw signals (acceleration a in all axis, spin rate ω around all axis, flux density B in all axis
and quantized audio) of the left (a) and right (b) hand for a caught pass under the circumstances:
automated passing machine [31], standing, facing towards, twohanded, advanced, indoor, Prototype 1.
3.2. Neural Network Performance
To train the neural network, the dataset was split into five nearly equally sized folds with a
stratified approach. Four folds have been used for training the network, one fold was used as a testSensors 2020, 20, 6722 10 of 16
fold. Fifty training iterations with four trainings in each iteration for each of the training folds have
lead to an average classification accuracy of 93 % on the test fold of each iteration.
This accuracy is also reflected in the confusion matrices, as can be seen in Figure 5. Since the data
of Figure 5a contains also the folds, which the network used for training, the accuracy exceeds 93 %.
(a) (b)
Figure 5. The normalized confusion matrices show the classification accuracy as comparision between
the predicted catches/drops and the real catches/drops. (a) shows the matrix of the whole dataset,
whereas (b) shows the matrix of the validation fold in the last iteration
During the training iterations, the mispredicted data sequences were logged. This has been
done to identify mislabeled or badly triggered data sequences, but also to find data sequences that
are difficult to classify. During fifty iterations, several observation were made. Figure 6 shows the
distribution of the mispredicted data sequences over their reccurance, i.e., the amount of times a single
data sequence is classified incorrectly during the verification stage of each 50 training iterations. As can
be seen in Figure 6 eight data sequences have been mispredicted repeatedly during the fifty iterations
and most of the mispredicts occurred less than ten out of fifty times.
Figure 6. This histogram shows the 2630 mispredicted data sequences distributed over the accumulated
mispredictions of the data sequences.Sensors 2020, 20, 6722 11 of 16
As a limitation of the system, the triggering has to be considered. The system triggers with an
absolute acceleration of 14g. This leads to the problem that a catch attempt might not trigger the sensor
platform, due to not reaching the threshold of 14g. This can happen e.g., if no appropriate contact
was made with the passed ball during a catch attempt. A possible scenario would be a body catch,
where most of the kinetic energy of the pass is taken by the body, but not the hands or wrists. Since this
scenario may not trigger the sensor platform, it cannot be classified. Another scenario would be if the
pass never makes contact with the hands or wrists of the receiver, although a catch attempt was made.
Clearly this should be classified as a drop, but since the triggering needs a threshold of 14g, it will not
be recorded and therefore also not classified. In general, the mentioned scenarios may happen more
often to novice players, who lack a good catch technique.
Another limitation for the use of such sensor would be mistriggering. There are possible scenarios
in which triggering can happen due to other impacts. This might occur, if athletes clap their hands,
or an opposing player tackles them. All these scenarios would be falsely classified as a drop or a
catch. Therefore the system should be applied in training but not in a match setting to maintain high
classification accuracy. Additionally this limit might be pushed if the network is extended to have
three outputs (catch, drop, no attempt), instead of only two. For this study, this was not possible due
to no adequate data.
3.3. Significance of Inputs
Further analysis of the dataset and the significance of the sensor data is of interest, due to a
possible optimization of the wearable and the neural network. For that reason an analysis was carried
out and the results are shown in Table 3. Note, that for this analysis, five iterations were used in each
training to identify the mean accuracy.
Table 3. Mean accuracy of the neural network with various input settings with five iterations.
Training Accelerometer Audio Gyroscope Magnetometer Accuracy
1 on on on on 92.99 %
2 zeros on on on 91.09 %
3 on zero on on 92.86 %
4 on on zero on 93.15 %
5 on on on zero 92.33 %
6 on zero zero zero 91.91 %
7 zero on zero zero 75.44 %
8 zero zero on zero 86.80 %
9 zero zero zero on 91.30 %
10 on zero zero on 93.39 %
As can be seen in Table 3 the magnetometer sensor and the acceleration sensor seems to be of
highest significance. The least important sensor data are the audio signals. This can be used to further
simplify the network, since especially the audio signals have to be sampled with the highest sampling
rate. Therefore, neglecting the audio signals decreases the inputs order and size, which also has the
potential to decrease the number of trainable parameters in the neural network considerably.
The sensor board, that was used in this study, also has limitations concerning the sensor signals.
Since the acceleration and magnetometer sensor have the highest significance, the limitations of the
range of the signals limits the ability for classification slightly. In Figure 4 saturation of the acceleration
is visible at approximately 0.4 s. The acceleration is limited due to the sensor limit of ±156.96 m s−2 .
With the introduction of an acceleration sensor with a wider range additional information may be
gathered that could lead to a better accuracy. Nevertheless, the given data set already shows results,
that satisfy the original goal of at least 90 % correctly classified passes.Sensors 2020, 20, 6722 12 of 16
4. Conclusions
The main goal of this paper, i.e., to develop a sensor platform in combination with a neural
network to classify catches and drops of receiving players in American football accurately, has been
met. Additionally, the paper provides a new type of dataset, which is unique in its composition
and creation.
From a sports science perspective, new possibilities open up because of the findings of this paper.
A sensor for catch detection, in combination with an automated passing machine such as the one
developed in [31], enables fully automated catch training, which allows for various new training
possibilities. For example, an automated passing machine could aim on a designated spot where a
receiver should attempt to catch a pass. By automatically measuring the success of the catch attempt
statistics can be gathered, which link specific catch scenarios (one hand catching, over the shoulder,
left and right, etc.) with individual catch success rates. Therefore, it is possible to determine strengths
and weaknesses of an athlete for specific catch scenarios. This is important information for any coach,
since the exercises can be optimized for all athletes individually.
Information about the catch rate in training in various scenarios might serve as the decision basis
of a coach, which receiver should run which route in a play. This way, it is possible to maximize the
success rate of a pass play.
The sensor additionally enables continuous monitoring of catch attempts during training,
which enables analysis of potential and progress in catching abilities. From a scouts perspective,
this might be relevant information about an athlete.
Author Contributions: Conceptualization, B.H.; methodology, B.H., S.S.; software, B.H., S.S.; validation, B.H.,
S.S.; formal analysis, B.H.; investigation, B.H., S.S.; resources, B.H.; data curation, B.H.; writing–original draft
preparation, B.H.; writing–review and editing, B.H., S.S., A.M., C.R.; visualization, B.H.; supervision, A.M., C.R.;
project administration, B.H.; funding acquisition, A.M. All authors have read and agreed to the published version
of the manuscript.
Funding: This research received no external funding, but was funded within the department of mechatronics
at MCI.
Acknowledgments: The authors want to gratefully acknowledge the support and participation of the following
group of students and colleagues: Jasper Volmer, Dominik Bergler, Michael Hocheder, Clemens Hoflehner,
Balint Kurucz, Kevin Niederacher, Bernhard Reiter and Michael Thaler.
Conflicts of Interest: The authors declare no conflict of interest.
Abbreviations
The following abbreviations are used in this manuscript:
MCI Management Center Innsbruck
IMU inertial measurement unit
etc. et cetera
EPTS Electronic Performance and Tracking System
e.g. exempli gratia
AI artificial intelligence
DOF degrees of freedom
RAM random access memory
CNN convolutional neural network
PReLu parametric rectified linear unit
ML machine learningSensors 2020, 20, 6722 13 of 16
References
1. Mackenzie, R.; Cushion, C. Performance analysis in football: A critical review and implications for future
research. J. Sport. Sci. 2013, 31, 639–676, [CrossRef] [PubMed]
2. Hughes, M.D.; Bartlett, R.M. The use of performance indicators in performance analysis. J. Sport. Sci. 2002,
20, 739–754, [CrossRef] [PubMed]
3. Ofoghi, B.; Zeleznikow, J.; MacMahon, C.; Raab, M. Data Mining in Elite Sports: A Review and a Framework.
Meas. Phys. Educ. Exerc. Sci. 2013, 17, 171–186, [CrossRef]
4. Sarmento, H.; Marcelino, R.; Anguera, M.T.; CampaniÇo, J.; Matos, N.; LeitÃo, J.C. Match analysis in football:
A systematic review. J. Sport. Sci. 2014, 32, 1831–1843, [CrossRef]
5. Reilly, T.; Lees, A.; Davids, K.; Murphy, W.J. Science and Football. Proceedings of 1st World Congress of Science
and Football; Spon Ltd.: London, UK, 1988.
6. Hughes, M.; Franks, I. Analysis of passing sequences, shots and goals in soccer. J. Sport. Sci. 2005, 23, 509–514,
[CrossRef]
7. Taylor, J.B.; Mellalieu, S.D.; James, N.; Shearer, D.A. The influence of match location, quality of opposition,
and match status on technical performance in professional association football. J. Sport. Sci. 2008, 26, 885–895,
[CrossRef]
8. Bačić, B. Predicting golf ball trajectories from swing plane: An artificial neural networks approach.
Expert Syst. Appl. 2016, 65, 423–438, [CrossRef]
9. Harfoush, A.; Hossam, M. Modelling of a robot-arm for training in fencing sport. Int. J. Intell. Robot. Appl.
2020, 28, S104, [CrossRef]
10. Minhas, R.A.; Javed, A.; Irtaza, A.; Mahmood, M.T.; Joo, Y.B. Shot Classification of Field Sports Videos Using
AlexNet Convolutional Neural Network. Appl. Sci. 2019, 9, 483, [CrossRef]
11. Stetter, B.J.; Ringhof, S.; Krafft, F.C.; Sell, S.; Stein, T. Estimation of Knee Joint Forces in Sport Movements
Using Wearable Sensors and Machine Learning. Sensors 2019, 19, [CrossRef]
12. Clark, C.; Storkey, A. Training Deep Convolutional Neural Networks to Play Go. In Proceedings of the 32nd
International Conference on Machine Learning (ICML 2015), Lille, France, 6–11 July 2015; pp. 1766–1774.
13. Digi-Sporting. A New Step Towards Digital Transformation Through Sports Science. Available online:
https://digi-sporting.eu/wp-content/uploads/2020/07/Handbook.pdf (accessed on 30 October 2020).
14. Memmert, D.; Lemmink, K.A.P.M.; Sampaio, J. Current Approaches to Tactical Performance Analyses in
Soccer Using Position Data. Sports Med. 2017, 47, 1–10, [CrossRef] [PubMed]
15. Park, J.L.; Logan, O. High-speed video analysis of arrow behaviour during the power stroke of a recurve
archery bow. Proc. Inst. Mech. Eng. Part J. Sport. Eng. Technol. 2012, 227, 128–136, [CrossRef]
16. Jackson, B.M.; Polglaze, T.; Dawson, B.; King, T.; Peeling, P. Comparing Global Positioning System and
Global Navigation Satellite System Measures of Team-Sport Movements. Int. J. Sport. Physiol. Perform. 2018,
13, 1005–1010, [CrossRef] [PubMed]
17. Wu, L.C.; Kuo, C.; Loza, J.; Kurt, M.; Laksari, K.; Yanez, L.Z.; Senif, D.; Anderson, S.C.; Miller, L.E.; Urban,
J.E.; et al. Detection of American Football Head Impacts Using Biomechanical Features and Support Vector
Machine Classification. Sci. Rep. 2017, 8, 855, [CrossRef]
18. Maganti, B. Monarc Sport Products. 2020. Available online: https://www.monarcsport.com/products/
(accessed on 31 October 2020).
19. Camarillo, D.B.; Shull, P.B.; Mattson, J.; Shultz, R.; Garza, D. An instrumented mouthguard for measuring
linear and angular head impact kinematics in American football. Ann. Biomed. Eng. 2013, 41, 1939–1949,
[CrossRef]
20. Carey, L.; Stanwell, P.; Terry, D.P.; McIntosh, A.S.; Caswell, S.V.; Iverson, G.L.; Gardner, A.J. Verifying
Head Impacts Recorded by a Wearable Sensor using Video Footage in Rugby League: A Preliminary Study.
Sport. Med. Open 2019, 5, 9, [CrossRef]
21. Greybe, D.G.; Jones, C.M.; Brown, M.R.; Williams, E.M.P. Comparison of head impact measurements via an
instrumented mouthguard and an anthropometric testing device. Sport. Eng. 2020, 23, 670, [CrossRef]
22. Wu, L.C.; Nangia, V.; Bui, K.; Hammoor, B.; Kurt, M.; Hernandez, F.; Kuo, C.; Camarillo, D.B. In Vivo
Evaluation of Wearable Head Impact Sensors. Ann. Biomed. Eng. 2016, 44, 1234–1245, [CrossRef]Sensors 2020, 20, 6722 14 of 16
23. Hol, J.D.; Dijkstra, F.; Luinge, H.; Schon, T.B. Tightly coupled UWB/IMU pose estimation. In Proceedings
of the IEEE International Conference on Ultra-Wideband (ICUWB 2009), Vancouver, BC, Canada,
9–11 September 2009; pp. 688–692, [CrossRef]
24. Alatise, M.B.; Hancke, G.P. Pose Estimation of a Mobile Robot Based on Fusion of IMU Data and Vision
Data Using an Extended Kalman Filter. Sensors 2017, 17, 2164. [CrossRef]
25. Wilson. Wilson X Connected Football System—Wilson Football Amp; Wilson LABS. 2020. Available online:
https://www.wilson.com/en-us/explore/labs/connected-football-system (accessed on 31 October 2020).
26. Won, S.H.P.; Melek, W.W.; Golnaraghi, F. A Kalman/Particle Filter-Based Position and Orientation Estimation
Method Using a Position Sensor/Inertial Measurement Unit Hybrid System. IEEE Trans. Ind. Electron. 2010,
57, 1787–1798, [CrossRef]
27. Madgwick, S.O.H.; Harrison, A.J.L.; Vaidyanathan, A. Estimation of IMU and MARG orientation using a
gradient descent algorithm. In Proceedings of the IEEE International Conference on Rehabilitation Robotics
(ICORR 2011), Zurich, Switzerland, 29 June–1 July 2011; pp. 1–7, [CrossRef]
28. Adesida, Y.; Papi, E.; McGregor, A.H. Exploring the Role of Wearable Technology in Sport Kinematics and
Kinetics: A Systematic Review. Sensors 2019, 19, 1597, [CrossRef] [PubMed]
29. Aroganam, G.; Manivannan, N.; Harrison, D. Review on Wearable Technology Sensors Used in Consumer
Sport Applications. Sensors 2019, 19, 1983, [CrossRef] [PubMed]
30. Camomilla, V.; Bergamini, E.; Fantozzi, S.; Vannozzi, G. Trends Supporting the In-Field Use of Wearable
Inertial Sensors for Sport Performance Evaluation: A Systematic Review. Sensors 2018, 18, 873, [CrossRef]
[PubMed]
31. Hollaus, B.; Raschner, C.; Mehrle, A. Development of release velocity and spin prediction models for passing
machines in American football. J. Sport. Eng. Technol. 2018, 47, 175433711877444, [CrossRef]
32. Whiteside, D.; Cant, O.; Connolly, M.; Reid, M. Monitoring Hitting Load in Tennis Using Inertial Sensors
and Machine Learning. Int. J. Sport. Physiol. Perform. 2017, 12, 1212–1217, [CrossRef]
33. Ballan, L.; Bazzica, A.; Bertini, M.; Del Bimbo, A.; Serra, G. Deep networks for audio event classification in
soccer videos. In Proceedings of the IEEE International Conference on Multimedia and Expo (ICME 2009),
New York, NY, USA, 28 June–3 July 2009; pp. 474–477.
34. Steven Eyobu, O.; Han, D.S. Feature Representation and Data Augmentation for Human Activity
Classification Based on Wearable IMU Sensor Data Using a Deep LSTM Neural Network. Sensors 2018,
18, 2892, [CrossRef]
35. Clouthier, A.L.; Ross, G.B.; Graham, R.B. Sensor Data Required for Automatic Recognition of Athletic Tasks
Using Deep Neural Networks. Front. Bioeng. Biotechnol. 2019, 7, 473, [CrossRef]
36. Cohn, N. Fourth Down? We’re Going for It! 2013. Available online: https://newrepublic.com/article/
112300/football-sabermetrics-how-stats-could-transform-nfl (accessed on 31 October 2020).
37. National Football League. Official 2020 National Football League Record&FactBook. 2020. Available
online: https://operations.nfl.com/updates/the-game/2020-nfl-record-and-fact-book/ (accessed on
31 October 2020).
38. Forman, S. College Football Stats Glossary: College Football at Sports. 2000. Available online: https:
//www.sports-reference.com/cfb/about/glossary.html (accessed on 31 October 2020).
39. Outsiders, F. Football Outsiders Glossary. 2020. Available online: https://www.footballoutsiders.com/info/
glossary (accessed on 31 October 2020).
40. Dodrill, C.B. An economical method for the evaluation of general intelligence in adults. J. Consult.
Clin. Psychol. 1981, 49, 668–673, [CrossRef]
41. Pro football reference, 2020 NFL Combine Results. Available online: https://www.pro-football-reference.
com/draft/2020-combine.htm (accessed on 30 October 2020).
42. Sierer, S.P.; Battaglini, C.L.; Mihalik, J.P.; Shields, E.W.; Tomasini, N.T. The National Football League
Combine: Performance differences between drafted and nondrafted players entering the 2004 and 2005
drafts. J. Strength Cond. Res. 2008, 22, 6–12, [CrossRef]
43. Kuzmits, F.E.; Adams, A.J. The NFL combine: Does it predict performance in the National Football League?
J. Strength Cond. Res. 2008, 22, 1721–1727, [CrossRef]Sensors 2020, 20, 6722 15 of 16
44. ST Electronics. Getting started with the STEVAL-STLKT01V1 SensorTile Integrated Development Platform,
2019. Rev. 5. Available online: https://www.st.com/resource/en/user_manual/dm00320099-getting-
started-with-the-stevalstlkt01v1-sensortile-integrated-development-platform-stmicroelectronics.pdf
(accessed on 23 November 2020).
45. ST Electronics. SensorTile Development Kit, 2019. Rev. 8. Available online: https://www.st.com/resource/
en/data_brief/steval-stlkt01v1.pdf (accessed on 23 November 2020).
46. ST Electronics. iNEMO Inertial Module: Always-on 3D Accelerometer and 3D Gyroscope, 2017.
Rev. 7. Available online: https://www.st.com/resource/en/datasheet/lsm6dsm.pdf (accessed on
23 November 2020).
47. ST Electronics. Ultra-Compact High-Performance eCompass Module: Ultra-Low-Power 3D Accelerometer
and 3D Magnetometer, 2018. Rev. 10. Available online: https://www.st.com/resource/en/datasheet/
lsm303agr.pdf (accessed on 23 November 2020).
48. ST Electronics. 50 Ohm Nominal Input/Conjugate Match to BlueNRG Tranceiver, With Integrated Harmonic
Filter, 2017. Rev. 1. Available online: https://www.st.com/resource/en/datasheet/balf-nrg-02d3.pdf
(accessed on 23 November 2020).
49. ST Electronics. MEMS Nano Pressure Sensor: 260-1260 hPa Absolute Digital Output Barometer, 2017.
Rev. 6. Available online: https://www.st.com/resource/en/datasheet/dm00140895.pdf (accessed on
23 November 2020).
50. ST Electronics. MEMS Audio Sensor Omnidirectional Digital Microphone, 2019. Rev. 4. Available online:
https://www.st.com/resource/en/datasheet/mp34dt06j.pdf (accessed on 23 November 2020).
51. ST Electronics. 150 mA Low Quiescent Current Low Noise Voltage Regulator, 2018. Rev. 7. Available online:
https://www.st.com/resource/en/datasheet/ld39115j.pdf (accessed on 23 November 2020).
52. ST Electronics. Ultra-low-power Arm R Cortex R -M4 32-bit MCU+FPU, 100DMIPS, up to 1MB Flash,
128 KB SRAM, USB OTG FS, LCD, ext. SMPS, 2019. Rev. 8. Available online: https://www.st.com/resource/
en/datasheet/stm32l476je.pdf (accessed on 23 November 2020).
53. ST Electronics. Upgradable Bluetooth R Low Energy Network Processor, 2019. Rev. 9. Available online:
https://www.st.com/resource/en/datasheet/bluenrg-ms.pdf (accessed on 23 November 2020).
54. Shaffer, D.M.; Dolgov, I.; Maynor, A.; Reed, C. Receivers in American Football Use a Constant Optical
Projection Plane Angle to Pursue and Catch Thrown Footballs. Perception 2013, 42, 813–827, [CrossRef]
[PubMed]
55. Oudejans, R.R.; Michaels, C.F.; Bakker, F.C. The effects of baseball experience on movement initiation in
catching fly balls. J. Sport. Sci. 1997, 15, 587–595, [CrossRef] [PubMed]
56. Kang, C.; Hwang, J.; Li, K. Trajectory Analysis for Soccer Players. In Proceedings of the 6th IEEE
International Conference on Data Mining - Workshops (ICDMW 2006), Hong Kong, China, 18–22 December
2006; pp. 377–381.
57. Dolgov, I.; McBeath, M.K.; Sugar, T. Evidence for axis-aligned motion bias: Football axis-trajectory
misalignment causes systematic error in projected final destinations of thrown American footballs. Perception
2009, 38, 399–410, [CrossRef] [PubMed]
58. Zaal, F.T.J.M.; Bootsma, R.J. Virtual Reality as a Tool for the Study of Perception-Action: The Case of Running
to Catch Fly Balls. Presence (Camb) 2011, 20, 93–103, doi:10.1162/pres_a_00037. [CrossRef]
59. Sun, C.; Shrivastava, A.; Singh, S.; Gupta, A. Revisiting unreasonable effectiveness of data in deep learning
era. In Proceedings of the IEEE International Conference on Computer Vision (ICCV 2017), Venice, Italy,
22–29 October 2017; pp. 843–852.
60. Acharya, U.R.; Fujita, H.; Oh, S.L.; Hagiwara, Y.; Tan, J.H.; Adam, M. Application of deep convolutional
neural network for automated detection of myocardial infarction using ECG signals. Inf. Sci. 2017,
415–416, 190–198, [CrossRef]
61. Kalchbrenner, N.; Grefenstette, E.; Blunsom, P. A Convolutional Neural Network for Modelling Sentences.
arXiv 2014, arXiv:1404.2188.
62. Krizhevsky, A.; Sutskever, I.; Hinton, G.E. ImageNet Classification with Deep Convolutional Neural
Networks. In Proceedings of the 26th Conference on Neural Information Processing Systems (NIPS 2012),
Lake Tahoe, NV, USA, 3–8 December 2012; pp. 1097–1105.
63. O’Shea, K.; Nash, R. An Introduction to Convolutional Neural Networks. arXiv 2015, arXiv:1511.08458.Sensors 2020, 20, 6722 16 of 16
64. Lawrence, S.; Giles, C.L.; Tsoi, A.C.; Back, A.D. Face recognition: A convolutional neural-network approach.
IEEE Trans. Neural Netw. 1997, 8, 98–113, [CrossRef]
65. Less Wright. New Deep Learning Optimizer, Ranger: Synergistic Combination of RAdam +
LookAhead for the Best of Both, 2019. Available online: https://medium.com/@lessw/new-deep-learning-
optimizer-ranger-synergistic-combination-of-radam-lookahead-for-the-best-of-2dc83f79a48d (accessed on
23 November 2020).
66. He, K.; Zhang, X.; Ren, S.; Sun, J. Delving deep into rectifiers: Surpassing human-level performance on
imagenet classification. In Proceedings of the IEEE International Conference on Computer Vision (ICCV
2015), Santiago, Chile, 7–13 December 2015; pp. 1026–1034.
Publisher’s Note: MDPI stays neutral with regard to jurisdictional claims in published maps and
institutional affiliations.
c 2020 by the authors. Licensee MDPI, Basel, Switzerland. This article is an open access
article distributed under the terms and conditions of the Creative Commons Attribution
(CC BY) license (http://creativecommons.org/licenses/by/4.0/).You can also read


