A Comparative Process Mining Analysis of Road Trauma Patient Pathways - MDPI
←
→
Page content transcription
If your browser does not render page correctly, please read the page content below
International Journal of
           Environmental Research
           and Public Health

Article
A Comparative Process Mining Analysis of Road
Trauma Patient Pathways
Robert Andrews 1, * , Moe T. Wynn 1 , Kirsten Vallmuur 2,3 , Arthur H. M. ter Hofstede 1
and Emma Bosley 4
 1    School of Information Systems, Queensland University of Technology (QUT), Brisbane 4000, Australia;
      m.wynn@qut.edu.au (M.T.W.); a.terhofstede@qut.edu.au (A.H.M.t.H.)
 2    Centre for Healthcare Transformation, Australian Centre for Health Services Innovation (AusHSI),
      Queensland University of Technology (QUT), Brisbane 4059, Australia; k.vallmuur@qut.edu.au
 3    Jamieson Trauma Institute, Royal Brisbane and Women’s Hospital, Metro North Hospital and Health
      Service, Brisbane 4029, Australia
 4    Queensland Ambulance Service (QAS), Brisbane 4034, Australia; emma.bosley@ambulance.qld.gov.au
 *    Correspondence: r.andrews@qut.edu.au; Tel.: +61-7-31380193

 Received: 7 April 2020; Accepted: 7 May 2020; Published: 14 May 2020

 Abstract: In this paper we report on key findings and lessons from a process mining case study
 conducted to analyse transport pathways discovered across the time-critical phase of pre-hospital care
 for persons involved in road traffic crashes in Queensland (Australia). In this study, a case is defined
 as being an individual patient’s journey from roadside to definitive care. We describe challenges in
 constructing an event log from source data provided by emergency services and hospitals, including
 record linkage (no standard patient identifier), and constructing a unified view of response, retrieval,
 transport and pre-hospital care from interleaving processes of the individual service providers.
 We analyse three separate cohorts of patients according to their degree of interaction with Queensland
 Health’s hospital system (C1: no transport required, C2: transported but no Queensland Health
 hospital, C3: transported and hospitalisation). Variant analysis and subsequent process modelling
 show high levels of variance in each cohort resulting from a combination of data collection, data
 linkage and actual differences in process execution. For Cohort 3, automated process modelling
 generated ’spaghetti’ models. Expert-guided editing resulted in readable models with acceptable
 fitness, which were used for process analysis. We also conduct a comparative performance analysis
 of transport segment based on hospital ‘remoteness’. With regard to the field of process mining,
 we reach various conclusions including (i) in a complex domain, the current crop of automated process
 algorithms do not generate readable models, however, (ii) such models provide a starting point for
 expert-guided editing of models (where the tool allows) which can yield models that have acceptable
 quality and are readable by domain experts, (iii) process improvement opportunities were largely
 suggested by domain experts (after reviewing analysis results) rather than being directly derived by
 process mining tools, meaning that the field needs to become more prescriptive (automated derivation
 of improvement opportunities).

 Keywords: case study; process mining; data quality; healthcare; ambulance; variant analysis

1. Introduction
     This paper reports on key findings and lessons learned from a process mining case study
conducted to analyse patient journeys during the time-critical phase of pre-hospital care and transport
of persons involved and injured in road traffic crashes in Queensland, Australia. Pre-hospital care
and transport can be supplied by road services, aero-medical services or a combination of these

Int. J. Environ. Res. Public Health 2020, 17, 3426; doi:10.3390/ijerph17103426   www.mdpi.com/journal/ijerph
Int. J. Environ. Res. Public Health 2020, 17, 3426                                                  2 of 22

two services. Both types of service are costly, resource intensive, asset limited and take significant
coordination to deploy. Comparing the various transport modes, escort levels, etc. may lead to a
better understanding of associated factors contributing to patient outcomes. However, there is limited
research internationally examining the retrieval processes for patients from roadside to definitive
care, and there has been no research conducted in the Queensland context. Process mining has been
successfully applied in the healthcare domain as evident by a recent literature review [1] which
discovered 172 articles reporting applications of various process mining techniques in the healthcare
domain. In Australia, process mining techniques have been used to conduct a comparative analysis of
patients’ care pathways in four South Australian Hospitals [2], and to undertake performance analysis
of patients’ length of stay [3]. Insights from these studies and many others [4–6] showed potential
benefits of utilising process mining techniques in the healthcare domain while also highlighting many
challenges associated with varying quality of healthcare data [4,7,8] and the complexity of modelling
healthcare processes where variations are the norm rather than the exception. There are several
novel and challenging aspects to this study. Firstly, while process mining has been applied to patient
flows and care pathways in emergency departments [9,10], to this point, process mining has not been
applied to model the retrieval and transport phases of pre-hospital care. Secondly, the retrieval and
transport phases include some events with short durations and rapid transitions interspersed with
longer duration events. Thirdly, data collection is a mixture of automated and real-time, automated but
manually-initiated and manually entered (with sometimes, multiple recording modes being applied to
the same activity). Lastly, the retrieval, transport and pre-hospital care (roadside to bedside) process
is not a single, end-to-end process, but rather the inter-leaving, and parallel execution of individual
service providers’ processes where even points of articulation are not fixed.
     The objectives of this study are to discover the range of different care and delivery processes
undertaken for road trauma patients from roadside to definitive care, and to conduct comparative
performance analyses across various cohorts of patients. Specific research questions include:

RQ 1      What is the range of attendance-retrieval-transport processes?
RQ 2      What is the range of patient and process outcomes?
RQ 3      What specific process and performance variations are observed across different cohorts of
          patients classified by, (i) transport type provided, and (ii) transport locale (metro, regional
          and remote locations)?

     This paper builds upon the earlier data pre-processing phase of the case study reported in [8,11]
in which the project establishment phase and source (event) data quality assessment were discussed
in detail. The rest of this paper, in which new work related to the case study, is organised as follows.
Section 2 discusses the related work. Section 3 elaborates on the organisational context and key
questions of interest. Section 4 describes the source event data collection and log preparation. Section 5
presents findings from two key questions of interest: (1) a comparative analysis of different attendance,
retrieval and transport processes involving Queensland Ambulance Services (QAS) and Retrieval
Services Queensland (RSQ) and (2) a quantitative assessment of performance. Section 6 presents some
options for process improvement resulting from this study and discusses key lessons learned from this
study for stakeholders and process mining experts.

2. Related Work
     Pre-hospital transport and care: Pre-hospital retrieval time influences morbidity outcomes in
certain trauma patients and understanding the processes which occur in the transportation of trauma
patients can inform interventions to improve the timeframes within which patients are transferred to
appropriate hospital-based care [12]. While process mining has been applied to the healthcare domain
in many case studies [13], there has been only limited attention paid to pre-hospital transport and
care. Lamine et al. [14] report on a simulation study of emergency call centre operations in France,
and Bruns et al. [15] apply complex event processing (CEP) to improve the availability and accuracy
Int. J. Environ. Res. Public Health 2020, 17, 3426                                                3 of 22

of information for emergency call centre dispatch operators. Badakhshan and Alibabaei [16] apply
discovery, conformance checking and performance analysis techniques in a case study involving
ambulance services in Iran. Notably, there has been very limited research which examines the intersect
of ground and aero-medical retrieval of trauma patients and the influence time-to-appropriate-care has
on patient outcomes. Further research is needed to understand the processes when there are multiple
service providers [17].
     Process mining and healthcare: Yang and Su [18] reviewed 37 process mining case studies
dealing with clinical pathways. Rojas et al. [5] reviewed 74 papers in which process mining was
applied in healthcare. Each paper was characterised according to 11 features including process type,
frequently asked questions, analysis perspectives, tools and methodologies. A key finding was that
there was a need for improved visualisation and visual analytics techniques and an increased focus
on conformance checking. Andrews et al. [3] report on challenges facing process mining analysts
when applying process mining in healthcare which arise from the semi-structured nature of healthcare
processes and the manner in which healthcare data is collected and stored. The authors discussed
challenges associated with data pre-processing and quality assessment, as well as automated process
discovery, comparative performance analysis and conformance analysis. Suriadi et al. [19] and
Partington et al. [2] describe approaches to performing comparative analysis using process mining
techniques in a healthcare setting, i.e., four Australian hospitals treating patients with chest pain.
Durojaiye et al. [10] reports on the application of process mining to mapping the in-hospital flow
of pediatric trauma patients with the aim of identifying major patient pathways. The study applies
the Flexible Heuristic Miner [20] algorithm to model data extracted from the trauma registry of a
Level 1 pediatric trauma centre. Similar to our study, Durojaiye et al. [10] describes the complexity
of discovered models (28 discovered pathways) despite there being only 8 activities in the model.
We note that application of the Flexible Heuristic Miner to data in our study generated extremely
complex, unreadable models.
     Process mining tools and techniques for comparative process analysis: Usually, comparative
process analysis requires analysing each cohort of interest separately and then combining the separate
analysis outcomes (often in a different tool than that used for the analysis). Such an approach requires
many tasks to be conducted manually. In [21], the authors describe ProcessProfiler3D, a process
mining tool specifically designed to support simultaneous, side-by-side comparative analysis of
different cohorts which uses three-dimensional visualisation to compare the cohorts using a variety of
performance metrics. Some process mining tools, e.g., Disco (www.fluxicon.org), provide animation
options to visually represent the progress of process cohorts over a model. Inductive visual Miner [22]
supports segmenting the log into process cohorts according to case attribute values and provides
an animation where tokens (representing the cases in the log) are (i) coloured according to cohort
membership and, (ii) traverse a (discovered) model. The tool provides both visual and numeric
cohort comparisons.
     We argue that process mining in the pre-hospital transport and care setting can provide valuable
insights into process performance with particular benefits to process owners from quantifying and
understanding both the ‘usual’ or frequently occurring pathways (from roadside to bedside) and the
pathways where deviations from clinical guidelines are observed.

Data Ethics
    Release of confidential health information is authorised under the authority of the Director
General, Queensland Health. Ethical clearance was obtained from the Royal Brisbane & Women’s
Hospital Human Research Ethics Committee (#EC00172).

3. Case Study: Organisational Context
     Motivation The delivery of appropriate and timely prehospital care and transport of seriously
injured road trauma patients is critical to patient survival and outcomes. Queensland is unique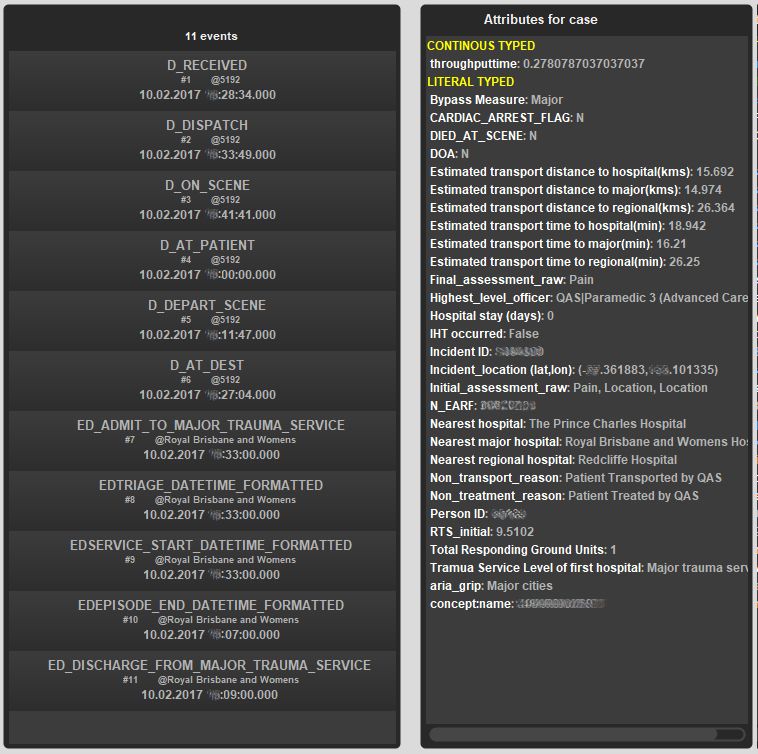
Int. J. Environ. Res. Public Health 2020, 17, 3426                                                   4 of 22

in regards to the geospatial characteristics and population distribution. Being the second largest
state in Australia with more than half the population living outside the metropolitan area, significant
challenges are faced by emergency services (ground and air ambulance) in responding to (road) trauma,
caring for injured persons at the scene and retrieval and transport of patients to health facilities able to
deliver the level of care required by the patients.
      Queensland is divided into 15 geographical Local Ambulance Service Network (LASN) areas.
There are 296 ambulance response locations across the state, including 229 permanent ambulance
locations, 22 hospital-based ambulance locations, 10 airport locations, five field offices, 24 locations
with QAS first responders and six locations with honorary volunteers. In addition to road ambulances,
aeromedical and helicopter retrieval services are available, coordinated by Retrieval Services
Queensland (RSQ) under the governance of the Department of Health, Queensland Government.
      In 2016-17 financial year, QAS attended 1.04 million incidents across the state, providing
1.19 million responses. For each incident, a record is created within the Computer Aided Dispatch
system to manage and record the ambulance dispatch processes through the Operations Centres. For
each case where paramedics provide patient assessment and management, an electronic Ambulance
Report Form (eARF) is completed containing patient demographic, clinical, scene and management
information. In 2016/17 financial year, there were 1,394,096 admitted patient episodes and 12,927,275
non-admitted occasions of service for all diagnoses (https://www.health.qld.gov.au/__data/assets/
excel_doc/0028/366616/activity.xls). Qld hospitals had an acute care bed capacity of 11,881 in the
same time period with approximately 231 public and private hospitals (https://www.aihw.gov.au/
getmedia/d4e53b39-4718-4c81-ba90-b412236961c5/21032.pdf.aspx?inline=true) servicing a population
of 4.9 million people in that time period.
      Road traffic crashes frequently involve multiple vehicles, multiple passengers (patients), and
multiple emergency services response units. Further, any response unit may attend/treat more than
one injured person, and any injured person may be attended/treated/transported by more than one
response unit. Thus, there are many possible notions of case that can be constructed around road
traffic crashes. In this study, we take a case as being an individual patient’s journey from roadside to
definitive care.
      Data sources At the time of this study, a significant challenge in reviewing retrieval processes
at the level of individual patient journeys was the lack of data integration between ground-based
and aero-medical service providers and state-run health facilities (emergency departments and
hospitals). That is, linking patient data collected by the individual emergency services, emergency
departments and hospitals is not automated. The Data Linkage Unit within Queensland Health is
now responsible for routinely linking both QAS and RSQ data with Qld Health’s existing hospital
databases (including emergency department presentation data, admitted patient data and deaths
data) (DLU linkage process in https://www.health.qld.gov.au/__data/assets/pdf_file/0030/150798/
qlddatalinkframework.pdf) to facilitate the identification of patients that have been attended to by
both QAS and RSQ.

4. Data Collection and Event Log Preparation
     In constructing the event data for this study, data from the following sources was linked by Qld
Health’s Statistical Services Branch Data Linkage Unit: (1) Queensland Ambulance Service (QAS),
(2) Retrieval Services Queensland (RSQ), (3) Emergency Department Collection (EDC), (4) Queensland
Hospital Admitted Patient Collection (QHAPDC) and (5) Births, Deaths and Marriages Data (BDM).
As patient journeys were the analysis unit for this study, linkage resulted in a patient identifier being
added to each record of each individual source data set. It is worth noting that the event log used in the
study was created from event data collected from multiple emergency services providers, with each
provider having their own processes for conducting their specialist service. A particular challenge in
constructing the event log was blending event data from interleaving processes of the participating
service providers with multiple points of articulation between underlying processes.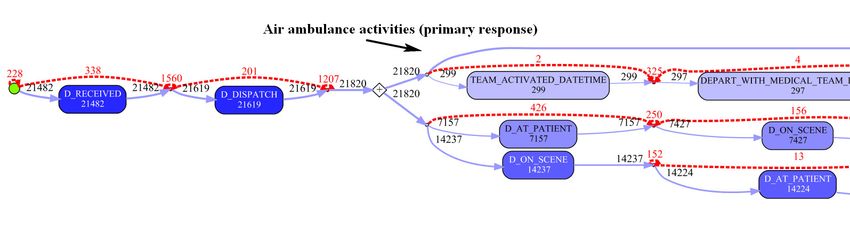
Int. J. Environ. Res. Public Health 2020, 17, 3426                                                   5 of 22

4.1. Data Sources and Recording Practices
     Data requested for this study were restricted to those road traffic crashes occurring in the most
recent stable years available (i.e., July 2015–June 2017).
     QAS uses two separate systems to gather incident, waypoint and clinical intervention data; one
system collects vehicle-related data and the other collects patient-related data. Ground-based QAS
vehicles in urban and inner-regional areas are fitted with a mobile data collection unit which records
vehicle-related waypoint information when an ambulance officer presses a button. However, (i) not
all vehicles are fitted with mobile data collection units, (ii) sometimes vehicles are in areas where
mobile reception is not possible and (iii) sometimes the underlying information system is off-line.
QAS patient-related data is generally not automatically recorded, i.e., the data is firstly recorded by
paramedics (noted temporarily while the paramedic is with the patient) and then later transcribed into
a digital information system.
     In general, aero-medical waypoint times and details of clinical interventions are also recorded
manually and transcribed, some time after the actual event, into an information system. Individual
aero-medical service providers send data extracts to RSQ on a monthly basis. RSQ, standardises and
consolidates these data extracts on a monthly basis and makes the consolidated data available to
Qld Health.
     Where patients were transported to an emergency care facility that reports to Qld Health, details
of emergency presentations are recorded in Qld Health’s Emergency Department Collection (EDC).
Where the patient was admitted to a hospital that reports to Qld Health, admission details are recorded
in the Queensland Hospital Admitted Patients Data Collection (QHAPDC). Where a transported
patient is delivered to a non-reporting healthcare facility, e.g., a private medical practice, no details of
post-transport care were available.
     Case information from each data source was linked to records in the EDC, QHAPDC and
Births-Deaths-Marriages systems and an identifier was assigned by the Data Linkage Unit to indicate
which records belong to the same event (road trauma patient transport).

4.2. Event Log Preparation
     In this study, a case was taken to be an individual patient pathway (from roadside to bedside).
Thus, for any road traffic crash (RTC), multiple cases may be created (as any RTC may involve multiple
injured persons). Data from QAS and RSQ was provided in tabular (Excel) format where each column
represented an attribute of the attendance/transport (e.g., incident identifier, electronic accident report
form identifier and patient and vehicle waypoint times). Each record in the QAS and RSQ data set
contained multiple waypoints. Similarly, data from Qld Health (EDC and QHAPDC data sets) was
provided in tabular (Excel) format and included patient identifier and details of the hospital interaction
(whether the interaction was in the emergency department or as an admitted patient). Each EDC and
QHAPDC record referred to a single hospital interaction and included start and end times for the
interaction. (Note that any patient may have multiple interactions recorded in the EDC and QHAPDC
data sets.) Cases were generated by linking the record sets using common patient identifier and
timestamp proximity. This was to account for those patients who were involved in more than one RTC
during the period covered by the study.
     It was also necessary to filter the resulting linked record set to remove incidents that did not
represent road traffic crashes. The QAS data extract included transport related incidents (AMPDS
code = 29). As such this extract included a number of incidents relating to boats or jet-skis, BMX bikes,
etc. The record set was filtered to include only incidents representing road traffic crashes (RTCs) by
searching for keywords in the T_NARRATIVE field commonly used by paramedics when attending
RTCs. To be inclusive, the ICD-10-AM principal diagnosis codes of the QHAPDC data set were
searched to identify injuries related to road traffic crashes. Finally, the patient journeys were split into
three separate cohorts for analysis based on whether the patient required transport, and if so, did the
transport result in hospitalisation. Figure 1 gives details of the numbers of records from each data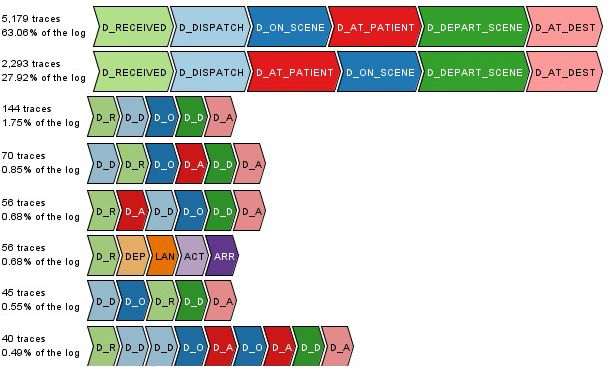
Int. J. Environ. Res. Public Health 2020, 17, 3426                                                                                                    6 of 22

source that was used in preparation of the study data and the steps involved in generating the event
logs used in the process mining analysis. Figure 2 is an example of related records from the QAS and
ED data sets which shows (1) how hospital presentations related to road traffic crashes were identified,
(2) how QAS records were matched with ED records (same approach for QHAPDC and RSQ records)
and (3) how events were created from waypoint timestamps. The corresponding case from the event
log is illustrated in Figure 3.

         Step                                 Record Set Size (# records) and Name                                          Action
         Extract 1:                             32,100 EDC             19,462 QHAPDC        532 Deaths
                                                                                                                            DLU added anonymised
         All ED / Hospital admissions                                                                                       Person_ID from Patient Master
                                              (ED presentations) (Hospital admissions)
         07/2015-06/2017 with
         principal diagnosis ICD-10-AM
         Ch 19 S00-S99, T00-T75, T78
         Ch 20 V,W,X,Y codes

         Extract 2:                              9,082 RSQ               92,420 QAS         89,922 QAS
                                                                                                                            DLU and RSQextracted
         All aero-medical transports                                                                                        relevant records from routinely
                                              (transport & clinical)    (CAD & eARF)          (clinical)
         07/2015-06/2017                                                                                                    collected data
         All QAS 07/15-06/17 with
         AMPDS Code = 29

         Linkage 1:                             47,192 QAS               64,129 QAS         45,228 CAD/eARFexcluded         DLU linked QAS to EDC/
         Link QAS patient to                                                                                                QHAPDC and added
                                               (CAD & eARF)               (clinical)        25,793 Clinical excluded
         EDC/QHAPDC patient                                                                                                 anonymised Person_ID from
                                                                                              Patient not identified        Patient Master Data
         Match on: patient age, gender,
                                                                                                No transport, or
         incident datetime, location                                                            Transport to non-Qld
                                                                                                Health reporting facility

         Filter 1:                              44,064 QAS             13,027 QHAPDC        3,128 CAD/eARFexcluded
                                                                                                                            Research Team filtered
         Identify road traffic crash                                                        6,435 QHAPDC excluded           QHAPDC injury codes and
                                               (CAD & eARF)               (clinical)
         incidents:                                                                         20,964 EDC excluded             QAS narrative to identify
         QHAPDC (E01_Alpha, E01_Num,                                                        8,407 RSQ excluded              RTC incidents
         EX01)                                                                              220 Deaths excluded
         QAS Narrative keyword search

         Merge 1:                              42,603 Cases
                                                                                                                            Research Teammerged QAS
         Create 'patient journeys' (cases):                                                                                 CAD eARF Clinical, RSQ,
                                              (patient journeys)                                                            EDC, QHAPDC and Deaths to
         Merge on: Person_ID, Incident
         datetime                                                                                                           create consolidated patient
                                                                                                                            journey histories

         Filter 2:                              12,552 Cases
                                                                                                                            Research Teamapplied major
         Identify interaction with Qld                                                                                      triage pre-hospital criteria to
         hospital system:                      Cohort 1: No transport                                                       clinical observations recorded
         Endpoint filter to create patient                                                                                  by paramedics.
         cohorts                                8,231 Cases
                                               Cohort 2: Transport - no QH hospital records

                                               21,820 Cases
                                               Cohort 3: Transport to Qld Health hospital

                          Figure 1. Event log generation—from source data to main analysis cohorts.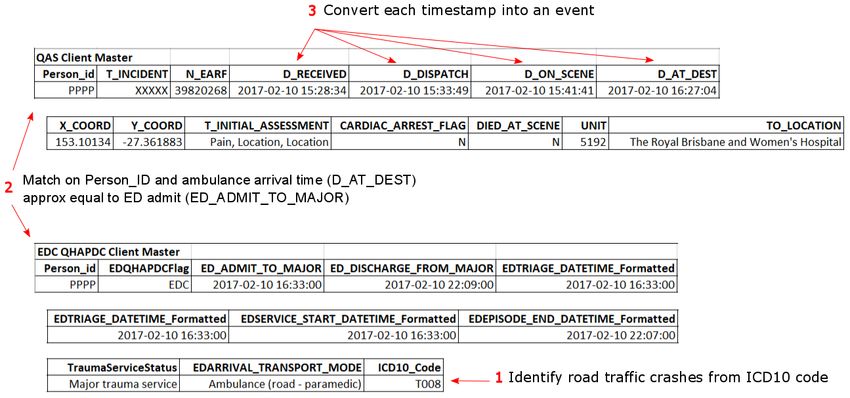
Int. J. Environ. Res. Public Health 2020, 17, 3426                                                        7 of 22

      Figure 2. Sample data from Queensland Ambulance Services (QAS) and Emergency Department
      Collection (EDC) with data attributes—log generation.

     A summary of the event log is shown in Table 1 and a dictionary of the meanings associated with
activity labels is given in the Appendix A (see Table A1). It should be noted that we have considered
the patient journey to include all emergency services and relevant hospital events from the initial call to
the QAS emergency call centre up to a maximum of eight days following the emergency call. We took
relevant hospital events to those EDC or QHAPDC events with less than 24 h between the completion
of one and the beginning of the next activity up to a maximum of 8 days. An extract of the log (single
case from Cohort 3) is shown in Figure 3. The extract shows events and case attributes. For this case,
the patient was transported (by QAS) to a Qld Health Facility (Royal Brisbane and Women’s Hospital).
Even though the patient met criteria for transport to a major trauma service (Bypass Measure = Major)
and the patient was transported to a major trauma service (trauma Service Level of first hospital =
Major trauma service), the Revised Trauma Score (RTS = 9.5102) being towards the upper end of the
scale, is associated with a better chance of of survival. The patient was not admitted to the hospital
(Hospital stay (days) = 0) and was treated, then discharged from the emergency department.

                                                 Table 1. Summary of event log.

                           Attribute                 Frequency           Attribute            Frequency
                    Number of events                   366,754        Number of cases          42,603
                  Duration of cases (max)            8 days 4 h   Event per case (max, min)     45.3
                 Duration of cases (median)           50.9 min    Events per case (median)        7
                  Duration of cases (mean)              10.2 h     Events per case (mean)        8.6
                  Number of trace variants               2863
Int. J. Environ. Res. Public Health 2020, 17, 3426 8 of 22
Figure 3. Example case record—with case attributes (identifiers deliberately obfuscated).
5. Case Study Findings
In this section we (i) show how we addressed each of the research questions, (ii) describe our
approach and (iii) the tools we used to answer the questions and generate results.
In this case study we used techniques/plug-ins from the open-source ProM (www.promtools.org)
framework for all process mining analyses. In particular, we selected the Inductive visual Miner [22] as
a tool that is suitable for discovery, conformance and (comparative) performance analyses. We found
this tool to have excellent data filtering capabilities and was robust enough to deal with complex
models plus it supports direct editing of models.
5.1. RQ 1 What Is the Range of Attendance-Retrieval-Transport Processes?
During the exploratory phase of the case study, we observed different process behaviours
(e.g., 2863 trace variants) among the 42,603 cases in the data set. To investigate RQ 1 we conduct an
endpoint analysis in which the log is split into three cohorts based on their end destination event
as follows:
• Cohort 1: Attend but no transport—(29.5% of log)
• Cohort 2: Transport, no link to a Qld Health facility—(19.3% of log)
• Cohort 3: Transport to Qld Health facility—(51.2% of log)Int. J. Environ. Res. Public Health 2020, 17, 3426 9 of 22
Cases belonging to Cohort 1 were characterised by having (i) only events with QAS as org:group,
and (ii) no event with activity label as D_AT_DEST, i.e., no record of an ambulance arriving at some
destination with a patient on-board.
Cases belonging to Cohort 2 were characterised by having (i) no records with EDC or QHAPDC
as org:group, and (ii) at least one event with activity label as D_AT_DEST, i.e., record of an ambulance
arriving at some destination with a patient on-board.
Cases belonging to Cohort 3 were characterised by having (i) at least one event with EDC or
QHAPDC as org:group.
This segmentation of cases was selected as it represents varying levels of care provided to patients
involved in road traffic crashes. At the least severe end of the injury spectrum (Cohort 1) are those
patients that require no transport (and sometimes, no treatment). These patients were involved in an
accident to which at least one ambulance was dispatched. Records in this cohort are characterised by
having an eARF number but with an empty Person_ID value, or, both eARF number and person_ID
are empty. As Cohort 1 consists of only the process fragment from emergency call received to on scene
(or with patient), there are only 4 distinct events recorded in this cohort, and 43 process variants.
Cohort 2 represents cases where transport is provided to a patient, but based on the transport
destination, the injuries received are minor. In general, for Cohort 2, transport destinations include local
medical practices, aged care facilities and other private (non-reporting) medical facilities. (There are a
number of cases where the destination is a Qld Health reporting facility, but there are no matching
EDC or QHAPDC records for the incident/patient).
Cohort 3 represents cases where transport is provided to a Qld Health reporting hospital.
For patients in Cohort 3 at least one ED presentation is recorded. Patients in this cohort may also
have at least one hospital admission. Inter-hospital transfers may also be included for these patients
indicating that injuries received in the accident require treatment not available at the first hospital to
which the patient was transported.
It is worth noting from Table 2 that the maximum case duration for Cohorts 1 and 2 seem
extraordinarily long for the type of cases included in each cohort. In each cohort, the case with the
maximum duration includes a data error that affects the case duration. For instance, as shown in
Figure 4 the “day” value for the D_AT_PATIENT event has been incorrectly entered as “11” instead of
“9” resulting in a case duration of 2 days 22 mins instead of 96 mins.
Table 2. Event log and cohort summary.
Attribute Log Cohort 1 Cohort 2 Cohort 3
Number of cases 42,603 12,552 8231 21,820
Number of events 366,754 49,315 50,033 267,339
Duration of cases (max) 8 days 4 h 7 days 23 h 2 days 22 min 8 days 4 h
Duration of cases (mean) 10.2 h 16.2 min 68.2 min 19.2 h
Duration of cases (IQR) 5.0 h 3.75 h 35 min 11.4 h
Activities 49 5 16 49
Event per case (max) 45 7 25 45
Event per case (mean) 8.6 4 6 12.3
Number of trace variants 2969 43 57 2800Int. J. Environ. Res. Public Health 2020, 17, 3426 10 of 22
Figure 4. Exceptional case duration due to event timestamp data entry error.
5.1.1. Cohort 1: Attend But No Transport
The (automatically) discovered process model for this cohort (from the Direct Follows Inductive
visual Miner [23]) is shown in Figure 5 where after an emergency call is received, an ambulance is
dispatched, the ambulance arrives on the scene or/and at the patient and no other event has been
recorded for these cases. Cohort 1 comprised 40 trace variants with the median and mean case duration
as 10.1 and 16.1 min respectively.
D_AT_PATIENT
11897
D_RECEIVED D_DISPATCH D_ON_SCENE
12347 12439 12090
Figure 5. Process model of Cohort 1—no transport.
The discovered model shows that, following the D_DISPATCH event, the D_ON_SCENE and
D_AT_PATIENT events may be executed in either order (where in actuality, the ambulance must
arrive on the scene before the paramedics attend the patient). Investigation revealed a data quality
issue associated with the timestamps of these two events, i.e., D_AT_PATIENT events are recorded at
the minute level and D_ON_SCENE events at the second level. Thus where the two events actually
occurred within the same minute, the D_AT_PATIENT event will be considered to have happened
before the D_ON_SCENE event. For example: D_ON_SCENE = ‘2017-03-20 09:45:15’ and (actual)
D_AT_PATIENT = ‘2017-03-20 09:45:55’ will result in (recorded) D_AT_PATIENT = ‘2017-03-20 09:45:00’
thus apparently occurring before D_ON_SCENE.
5.1.2. Cohort 2: Transport to Non-Qld Health Facility
The process model of this cohort can be seen in Figure 6 which depicts that after a call for
ambulance is received, an ambulance is dispatched, it arrives on the scene/at the patient, the patient is
then loaded or triaged at the scene, the ambulance then departs from the scene and finally arrives at the
destination recorded as the last activity D_AT_DESTINATION. Cohort 2 comprised 122 trace variants
with median and mean case duration as 53.7 and 61.3 minutes, respectively. Figure 7 illustrates some
of this cohort’s trace variants.
D_RECEIVED D_DISPATCH D_ON_SCENE
8053 8096
D_DEPART_SCENE D_AT_DEST
8155
8115
8118
D_AT_PATIENT
7911
Figure 6. Process model of Cohort 2.Int. J. Environ. Res. Public Health 2020, 17, 3426 11 of 22
Figure 7. Cohort 2—most frequent trace variants.
The multiple trace variants of this cohort as well as observed deviations in the process model
showcase a number of characteristics. First, the interchange of D_ON_SCENE and D_AT_PATIENT
activities within the trace variants, as well as D_LOADED and D_DEPART_SCENE can be considered
as data quality and accuracy issues which are discussed in Section 5.1.1. Some of the activities
also are skipped and not performed (e.g., in some circumstances the patient is assessed on scene
and is not loaded onto the ambulance). Consequently, in this instance the D_LOADED activity
has not occurred/is not recorded. According to the process owner, possible reasons for these trace
variants include patients not admitted to a Qld hospital facility, interchange of transport happened
(e.g., the ambulance is called to a regional area, transports patient to a local school, the only place
that helicopter can land to transport the patient to a trauma service), or flexibility in data recording
protocols. Nevertheless, as the two most frequently occurring trace variants account for 91% of cases in
this cohort (with the only difference between trace variants being the order of the D_ON_SCENE and
D_AT_PATIENT activities), it can be concluded that this cohort exhibits strong conformity to expected
process behaviour.
5.1.3. Cohort 3: Transport to a Qld Health Facility
Queensland Health operates 5 hospitals able to provide major trauma services. Of these, 4 are
located in the south-east of the state (major population area) with 1 major trauma service hospital
located in the north-east of the state. There are 14 regional trauma services located in primarily coastal
areas with reasonably high populations. Only 1 regional trauma service is located in the west of the
state. There are approximately 200 other hospital and healthcare facilities operated by Queensland
Health throughout the state.
The automatically discovered process model from the Inductive visual Miner is shown in Figure 8.
The automatically discovered process model showed high fitness (0.96), and reveals the interleaving of
processes/activities provided by the respective emergency services. The model reflects the fact that
points of articulation between the emergency services can happen at multiple points in the patient
journey. Process experts however, found the model complex and hard to read. In particular, it was
difficult to follow patient journeys from roadside to the various trauma service levels. Further, on using
the modelling tool’s options for reducing complexity (limiting activities and paths considered), the
activities associated with aero-medical transport were immediately filtered out of the model and
sequential paths (which showed options for interleaving of activities over the different emergency
services) were reduced to optional concurrent execution of the individual activities.
Accordingly, the model was manually edited (Inductive visual Miner supports real-time model
editing) with an expert from each of QAS and RSQ providing domain and process knowledge, and
guidance. The resulting model had somewhat lower average trace fitness (0.91), but was easier to read,Int. J. Environ. Res. Public Health 2020, 17, 3426 12 of 22
and, in the view of the process owners, provided a better view of process pathways (patient journey
options) than the automatically discovered model.
Figure 8. Automatically discovered process model of Cohort 3—80% path abstraction.
The edited model makes it clear that, the vast majority of cases (individual patient journeys)
involve a single ground-based ambulance attending and transporting the patient. Where an air
ambulance is required, it is frequently used as primary response, i.e., involved in transport from the
scene (see Figure 9). The transport (by ground or air) is to a health facility categorised according
to its level of trauma service (major, regional or other). The attending paramedics make a choice as
to destination facility depending on incident and hospital location (thus determining travel time),
patient status, injury severity, and injury pattern. The edited model shows that for each of the
three trauma service levels, approximately 95% of patients transported are ‘handed over’ to the
facility’s emergency department (slightly higher for regional trauma service (97%), with the remainder
being directly admitted to the hospital (see Figure 10). Of the patients initially presenting to the
emergency departments, approximately 18% (slightly higher, 23% for major trauma services) progress
to a hospital admission.
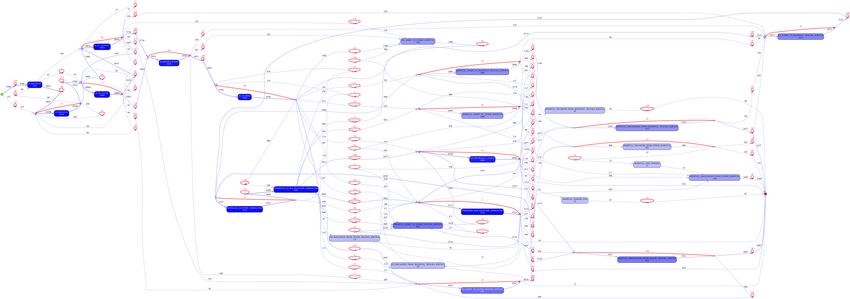
Figure 9. Edited process map fragment (Cohort 3)—air ambulance primary response.Int. J. Environ. Res. Public Health 2020, 17, 3426 13 of 22
Figure 10. Edited process map fragment (Cohort 3)—trauma service level discharge or transfer to
another hospital.
Figure 11 is a process fragment showing the death/discharge/transfer options from the various
trauma service levels.
Figure 11. Edited process map fragments (Cohort 3)—trauma service death/discharge/transfer.
A limitation of the edited model was that some of the infrequent pathways (which were of interest
to the researchers and domain experts) were not modelled and appeared then as ‘deviations’ on the
model. As the discovered model also had significant deviations, it was not apparent which were real
deviations and which were artefacts of alignment.
Despite there being only 5 major trauma service facilities in the state, the model shows 40% of all
road traffic crash patients transported by emergency services are handled by major trauma service
hospitals with the 14 regional trauma services accounting for 35% of transported patients and the
200 other hospitals and health facilities handling the remaining 25% of transported patients. Further
investigation is required to determine if this is reflective of population distribution in the state.
5.2. RQ 2 What Is the Range of Patient and Process Outcomes?
We use the endpoint analysis to address RQ 2 based on some coarse measures of patient outcomes
relating to death/discharge. For process outcomes we report on last recorded event and interpret this
in light of process executions. We also consider variations (as shown in the process model).
The emergency services retrieval/transport/pre-hospital care process investigated in this study
differs from many other business processes in that there is no simple measure for success of the process.
If we consider a loan application process, for instance, process outcomes include early termination ofInt. J. Environ. Res. Public Health 2020, 17, 3426 14 of 22
the application, or the process completes with a decision as to the success or failure of the application.
Close analysis of both the automatically discovered and edited process models show the process may
terminate at almost every event (as the models afford the option to ‘skip’ events to process end). Table 3
summarises process outcomes from the point of view of last events per case.
Table 3. Outcome by cohort as given by last recorded event.
Cohort 1 Attend, no transport
Activity (Org) Cases Cohort %
AT_PATIENT (QAS) 8101 64.6%
ON_SCENE (QAS) 4398 35.1%
DISPATCH (QAS) 33 0.3%
Cohort 2 Transport, no hospital
Activity (Org) Cases Cohort %
AT_DEST (QAS) 8058 98.2%
ARR_RECEIVING (RSQ) 99 1.2%
HOSPITAL_ADMIT (QHAPDC) 46 0.6%
Cohort 3 Transport, hospital
Activity (Org) Cases Cohort %
ED_DISCHARGE 13,331 61.1%
HOSPITAL_DISCHARGE 7899 36.2%
HOSPITAL_ADMIT 134 0.6%
TRANSFER 92 0.4%
HOSPITAL_DEATH 53 0.25%
ED_DEATH 8 0.03%
OTHER 319 1.4%
Endpoint analysis for Cohort 1 (dispatches where the patient was not transported by QAS) shows
QAS paramedics recorded ON_SCENE as the final event in 4398 cases. However, as described in
Section 5.1.1, data quality issues impact on the ordering of these two events. In fact, only 533 cases do
not have an AT_PATIENT event recorded in the case.
Reasons for there being no patient transported include: (i) 7222 cases where paramedics directly
recorded that “transport was not required”, (ii) 566 cases where transport occurred by private or other
means, (iii) 357 cases where the ambulance was stand-by only, (iv) 296 cases where the ambulance
was cancelled/recalled, (v) 281 cases where the patient was dead on arrival or died at scene and (vi) a
small number of cases where no patient was found at the scene when the ambulance arrived.
Endpoint analysis for Cohort 2 (patient transport but no hospital records) reveals the possibility
for data extraction or linkage errors with a small number of cases (1.8% of the cohort) recorded as
being transported to a Qld Health facility, but there being no Qld Health ED or hospital records for
the patient.
Endpoint analysis for Cohort 3 shows that all patients were transported to a Qld Health facility
and arrived alive. A small number (61 patients) were recorded as dying within the scope of the
period covered by the event log, with the overwhelming majority (98%) of patients recorded as being
discharged from the hospital system within the scope of the event log.
From a patient outcome perspective, we can use only coarse measures including mortality
(at various stages of the process including 30 day survival), discharge from ED and discharge from
hospital. Figure 12 shows a view of the combined process focusing on the measures of patient outcomes
able to be derived from the recorded event data. It can be observed that apart from 183 cases (out
of 42,603 cases in the log) where patients died at the scene or in transit, patients were delivered to
emergency care alive.Int. J. Environ. Res. Public Health 2020, 17, 3426 15 of 22
Figure 12. Model of patient outcomes by cohort. Nodes represent patient outcomes, i.e., points of exit
from the process. Node numbers show the number of patients with that outcome.
5.3. RQ 3 What Specific Process and Performance Variations Are Observed across Incidents Occurring in
Metro, Regional and Remote Locations?
In this section we report on results of a comparative process and performance analysis
in which Cohort 3 was further sub-divided according to initial transport destination. Cases
were tagged as ‘metro’, ’regional’ or ‘remote’ using the Accessibility Remoteness Index of
Australia (ARIA) (https://www1.health.gov.au/internet/publications/publishing.nsf/Content/
ARIA-Review-Report-2011~ARIA-Review-Report-2011-2~ARIA-Review-Report-2011-2-2-3) data
attribute associated with each Qld Health hospital/facility. The log was re-coded to represent major
transport and care segments:
• Primary transport: dispatch to pick up location (which may be scene of incident or intermediate
point like an aerodrome) Ñ reaching destination (which may be hospital or handover point to
other crew)
• Hospital encounter(s): hospital/ED admit Ñ (optional) inter-hospital transfer Ñ discharge
Activities relating to primary transport in the re-coded log show transport modality (ground or
air ambulance). Inter-hospital transfer (hospital encounters section) were always by air ambulance.
The process model was manually drawn (and visualised in Inductive visual Miner) but allows for
(i) multiple primary transport segments, (ii) multiple hospital encounters (including intra- and
inter-hospital transfers) and shows high (0.974) trace fitness. The model showed that the most
frequently occurring pathway is from scene of incident to hospital with patient retrieval and transport
involving only a single ambulance (20,651 cases out of 21,820 cases). The model also shows that,
most often, patients stay in the first hospital to which they are transported (only 339 patients required
inter-hospital transfer). (Note that this may involve an ED presentation and a subsequent admission to
the same hospital.)
The process model showed that (performance) bottlenecks, i.e., longest duration activities occur for
the events relating to inter-hospital transfer (Request–Depart) and Hospital Transfer-Out. This makes
sense in light of (i) the interleaving (RSQ and hospital processes) with RSQ frequently being advised
(well) in advance of an impending inter-hospital transfer, and (ii) the time required to prepare an
aircraft for flight and activate the medical team required for the flight.
The box-and-whisker plots of sojourn times for transport phases in Figures 13–15 visualise
the performance variations across process phases by quartile of the respective patient cohorts.
In Figure 13 the effect of remoteness is clearly evident on travel times with remote patients
involving longer travel-to/from-scene times (particularly for RSQ (air-ambulance) travel-to-scene
times). Further differences are evident in the comparative on-scene times between ground (QAS) and
air (RSQ) ambulance crews. This is likely reflective of the time taken to stabilise a patient prior to take-offInt. J. Environ. Res. Public Health 2020, 17, 3426 16 of 22
(as some critical interventions are avoided once in the air), and the time required to appropriately
package the patient for air travel.
Figure 13. Comparison (by destination hospital remoteness) of transport segment durations—ground
and air.
Figure 14. Comparison (by incident region) of hospital segment durations.Int. J. Environ. Res. Public Health 2020, 17, 3426 17 of 22
Figure 15. Comparison (by incident region) of inter-hospital transport segments durations.
5.4. Process Improvement Opportunities
Discussion of the study analysis results with process owners resulted in the following process
improvement opportunities:
1. Automated data collection—timestamped information As this study, and others, has shown,
event data quality, particularly relating to timestamps, impacts on the ability to apply process
mining. While this study derived useful insights into the process, much effort was required to
identify and deal with timestamp data quality. It is noted that much of the data is collected by
people whose primary focus is patient welfare and not data entry with the result that there are
many situations where data relating to patient retrieval, transport and pre-hospital care is entered
manually (e.g., no aero-medical data is automatically captured). While some data points are
collected automatically, it is recommended that options for automatic data collection be trialled.
Options such as wearable technology and voice recognition would allow doctors and paramedics
to record waypoints and interventions without interrupting treatment to patients. Options such
as QR codes for equipment and drugs could be used to automatically record times and usage.
2. On-scene patient identifier across attending crews. Currently, each crew attending a patient
completes a separate electronic Accident Report Form (eARF). The eARF records patient attributes
such as gender and age (estimated age if not able to be directly confirmed) but, while each eARF
contains an Incident identifier, there is no attribute that allows multiple eARFs for the same patient
at the same incident to be easily retrospectively matched. In this study, of the 92,420 QAS CAD
records (ground-based ambulances responding to a ‘000’ emergency call) 17,304 (18.7%) included
an eARF that could not be linked to a patient. Further, of the 45,296 separate incidents (road
traffic crashes), 8108 incidents included at least one patient that was retrospectively identified
by the Data Linkage Unit (from data in the eEARF) and, at least one patient that was not able to
be identified by the DLU from data in the eARF. Thus it is possible that information about an
individual patient (observations and care given) recorded by different crews is not ultimately
reconciled. This would be obviated by the use of an on-scene patient identifier.
3. Automated assistance in determining transport destination Currently, the transport destination
for injured persons is usually determined by the on-scene paramedics based on their localInt. J. Environ. Res. Public Health 2020, 17, 3426 18 of 22
knowledge of hospital and health facility locations, road and traffic conditions, etc. It is
recommended to supplement this decision with automated support from systems that are aware
of not only road and traffic conditions, but hospital conditions (e.g., bed availability).
4. AI supported emergency call triage The job of the emergency call centre operators is, on receipt
of a ‘000’ emergency call, to determine an appropriate response. Callers to ‘000’ are rarely
medically trained and often in a state of distress, thus adding to the difficulty and the time
required for the operator to triage the call. For many conditions, e.g., cardiac arrest, response time
is directly related to patient outcome (survival). AI systems such as Corti (https://corti.ai/) have
been reported to be able to identify cardiac arrest from background sounds with 95% accuracy [24],
faster and more accurately than human call takers [25]. It is suggested that such a system be
trialled in the Queensland setting.
6. Discussion
This section synthesises key lessons learned based on the data-driven insights gained from this
process mining study in the healthcare sector combined with the feedback from healthcare stakeholders
throughout the project. These insights are aimed at the process mining research community and the
advocates for process mining techniques within the healthcare sector.
Variants are the norm in any healthcare process. This study further reaffirms the fact that
control-flow variations resulting in spaghetti-like process models are the norm for any healthcare
process, even for a relatively straight-forward pre-hospital transport process. Thus, we should not
rule out infrequent variants without considering underlying reasons for these exceptional behaviours.
The act of simplifying such messy models using frequency-based noise filters may not be the best
approach for healthcare processes. The stakeholder-guided simplification approach used in this study
with the help of the Inductive visual Miner tool may provide a better outcome for healthcare processes.
Stakeholder-guided process discovery techniques are useful for healthcare processes.
This study encountered issues with automatically discovered process models from the point of view
of being readable (by both analysts and process owners). With the assistance of domain experts and
using the Inductive visual Miner tool, we manually edit the underlying structure of the discovered
models to arrive at models agreed on by stakeholders as being useful for analysis. This limitation of
most existing automated discovery tools leads to the notion of tools that support guided discovery in
which expert advice can be incorporated into discovery algorithms.
Timestamps with different granularities can have a severe negative effect on the order of
events. An interesting feature of this case study is that we are looking at a process that has a very
short duration (i.e., less than one hour in most cases) and therefore small differences in the recorded
timestamps can result in incorrect ordering of events as seen in discovered models. In the emergency
pre-hospital settings, things happen at a fast pace and the recording of some activities are optional and
manual. Therefore it is expected that event ordering issues will be present in the log, which in turn,
will lead to complexities in discovered process models.
Multiple potential case notions can result in data correlation challenges. Data correlation
challenges associated with linking data from multiple parties were encountered as expected. The added
complexity of linking multiple patients, multiple responding units and potential multiple transporting
units (for example two transport units attended and one of these transported two patients while the
other did not transport a patient) made the record linkage more complex. Therefore, it is essential that
the preparation of an event log from a data set is closely guided by the key questions of interest, and
thus an appropriate case notion is then determined while taking into account any data quality issues.
New approaches to objectively assess the suitability of data attributes for process mining are required.
Our recent work [26] describes RDB2Log which (i) uses metrics to quantitatively assess the quality of
(relational) source data across 12 different quality dimensions, and (ii) uses the quality assessment to
guide users in the semi-automated creation of event logs.Int. J. Environ. Res. Public Health 2020, 17, 3426 19 of 22
Process mining uncovers the end-to-end patient journey in a healthcare setting. Although a
lot of data is being collected within the healthcare setting, stitching it all together to trace a patient’s
journey through the different areas is generally challenging. This case study demonstrated how data
from different sources can be identified and linked together to enable a ‘journey’ view of the patient
through the healthcare system as well as identify appropriate data points to monitor clinical indicators
and measure patient outcomes across an entire state.
Prescriptive process models are needed to (automatically) generate process improvement
recommendations from process mining insights. Most process mining techniques are descriptive in
nature, that is, they provide insights as to what has happened. They typically do not recommend actions
to take in terms of how to improve these processes. Therefore, process improvement opportunities
are largely generated by process owners in light of these process mining results. The field of
process mining would be to move towards prescriptive (automatically derived) identification of
improvement opportunities.
7. Conclusions
This case study examined some specific questions of interest to Queensland’s emergency services
in relation to pre-hospital care and transport of persons injured in motor vehicle accidents. The study
reported on challenges faced by the analysts in compiling an event log suitable for use in a process
mining analysis from multiple disparate data sources, in particular, challenges in linking the different
data sources to allow analysis at the level of individual patient journeys. Automated process
discovery resulted in complex models, highlighting the variability in the retrieval and transport
process. The discovered models were too complex to be useful requiring domain expert-guided
editing to achieve usable models. Despite these models being deemed readable, representative of the
overall process, and useful for analysis, they did remove many of the deviations, hence obfuscating
potentially interesting process behaviours. Comparative process analysis highlighted performance
differences relating to remoteness. Despite comprehensive analysis, the descriptive nature of process
mining techniques (focusing on what has happened) meant that process improvement strategies were
largely generated in concert with the process owners. This paper has presented methods for deriving
event logs from multiple, disparate data sources, as well as approaches for process discovery and
comparative analysis that are not limited to the pre-hospital setting, but are generalisable to other
contexts. In particular, our approach would be applicable in contexts involving (i) multiple, distinct
processes and data sources (from separate organisations), (ii) which have a somehow shared notion of
case (iii) and which need to be combined to derive an over-arching, end-to-end process for analysis.
Author Contributions: Conceptualization: R.A., M.T.W., K.V., A.H.M.t.H. and E.B.; data curation: R.A., K.V.;
funding acquisition: M.T.W., K.V., A.H.M.t.H. and E.B.; investigation: R.A. and K.V.; methodology: R.A., M.T.W.,
K.V., A.H.M.t.H. and E.B.; writing—original draft: R.A., K.V., M.T.W.; writing—review and editing: M.T.W., K.V.,
A.H.M.t.H. and E.B. All authors have read and agreed to the published version of the manuscript.
Funding: The work in this paper was funded by a grant from the Queensland Motor Accident Insurance
Commission (MAIC).
Acknowledgments: We would like to thank Adam Banham for his contribution in preparing data and log files,
Bayan Bevrani for her contribution to preliminary process mining analyses, and Sander Leemans for sharing his
ProM expertise and adding new features to the Inductive visual Miner to support this work. Most importantly, we
would like to thank Mark Elcock (Retrieval Services Queensland) and Stephen Rashford (Queensland Ambulance
Service) for their immense contributions to the project on which this paper is based. Both Mark and Stephen are
heavily involved in the statewide response to COVID-19 and are unable to act as authors of this work. Our loss,
but the state of Queensland will benefit from their expertise and experience.
Conflicts of Interest: The authors declare no conflicts of interest.You can also read