Levelling Down and the COVID-19 Lockdowns: Uneven Regional Recovery in UK Consumer Spending - arXiv.org
←
→
Page content transcription
If your browser does not render page correctly, please read the page content below
Levelling Down and the COVID-19 Lockdowns:
                                           Uneven Regional Recovery in UK Consumer Spending
                                              John Gathergood∗ Fabian Gunzinger† Benedict Guttman-Kenney‡
                                                           Edika Quispe-Torreblanca§ Neil Stewart¶

                                                                                 December 21, 2020
arXiv:2012.09336v2 [econ.GN] 21 Dec 2020

                                                                                        Abstract
                                                  We show the recovery in consumer spending in the United Kingdom through the
                                                  second half of 2020 is unevenly distributed across regions. We utilise Fable Data: a
                                                  real-time source of consumption data that is a highly correlated, leading indicator
                                                  of Bank of England and Office for National Statistics data. The UK’s recovery is
                                                  heavily weighted towards the “home counties” around outer London and the South.
                                                  We observe a stark contrast between strong online spending growth while offline
                                                  spending contracts. The strongest recovery in spending is seen in online spending
                                                  in the “commuter belt” areas in outer London and the surrounding localities and
                                                  also in areas of high second home ownership, where working from home (including
                                                  working from second homes) has significantly displaced the location of spending.
                                                  Year-on-year spending growth in November 2020 in localities facing the UK’s new
                                                  tighter “Tier 3” restrictions (mostly the midlands and northern areas) was 38.4%
                                                  lower compared with areas facing the less restrictive “Tier 2” (mostly London and the
                                                  South). These patterns had been further exacerbated during November 2020 when a
                                                  second national lockdown was imposed. To prevent such COVID-19-driven regional
                                                  inequalities from becoming persistent we propose governments introduce temporary,
                                                  regionally-targeted interventions in 2021. The availability of real-time, regional
                                                  data enables policymakers to efficiently decide when, where and how to implement
                                                  such regional interventions and to be able to rapidly evaluate their effectiveness to
                                                  consider whether to expand, modify or remove them.
                                                  JEL Classification: D14,E21,E61,E65,G51,H12,H75,R1
                                                  Keywords: Consumption, Coronavirus, COVID-19, Household Finance, Lockdowns,
                                                  Credit Cards, Regional Inequality

                                             ∗
                                                 Department of Economics, Nottingham University. john.gathergood@nottingham.ac.uk
                                              †
                                                 Warwick Business School, University of Warwick. fabian.gunzinger@warwick.ac.uk
                                               ‡
                                                 Chicago Booth School of Business, University of Chicago. benedict@chicagobooth.edu
                                               §
                                                 Saïd Business School, University of Oxford. edika.quispe-torreblanca@sbs.ox.ac.uk
                                              ¶
                                                 Warwick Business School, University of Warwick. neil.stewart@wbs.ac.uk
                                           The views expressed are the authors and do not necessarily reflect the views of Fable Data Limited. We
                                           thank Fable Data Limited for sharing these data for research. We are grateful to Suraj Gohil, Debbie
                                           Mulloy and Fiona Isaac at Fable Data Limited and Lindsey Melynk and Rich Cortez at Chicago Booth
                                           for their help facilitating this research. This work is supported by the UK Economic and Social Research
                                           Council (ESRC) under grant number ES/V004867/1 ‘Real-time evaluation of the effects of Covid-19 and
                                           policy responses on consumer and small business finances’.

                                                                                              1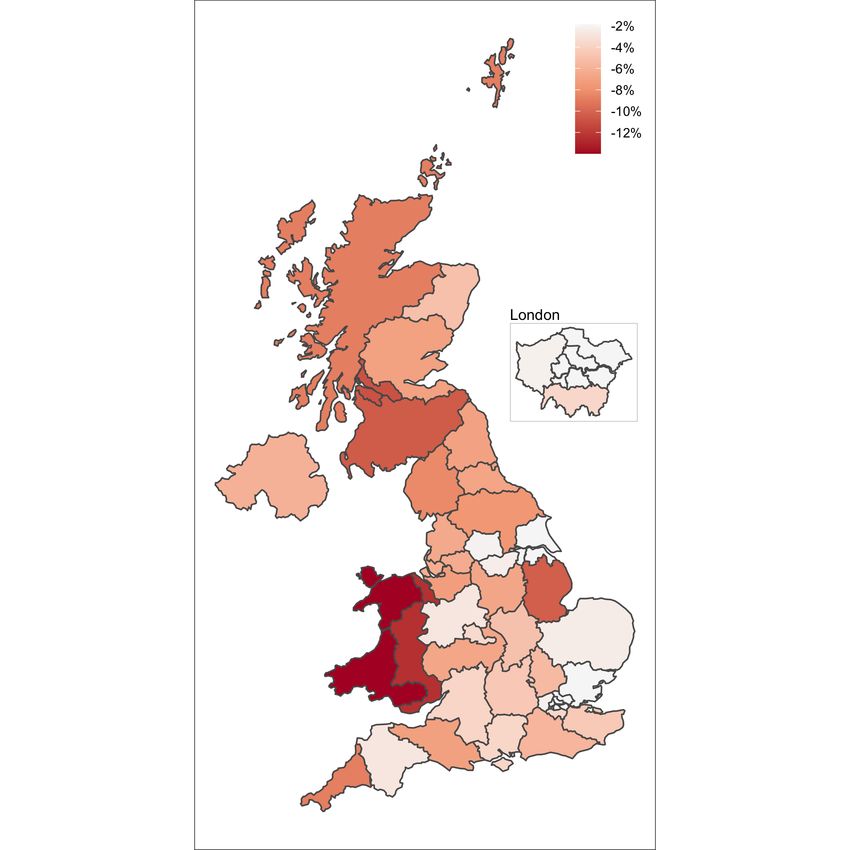
1       Introduction

Over the last few decades, developed countries have experienced inequality in economic
growth at the regional level, with some regions not only experiencing less of the economic
boom, but having longer-lasting pain from economic busts. The UK is one of, if not the
most, geographically unequal developed countries.1 A recent UK government aim is to
address such disparities through policies to ‘level-up’ the regions that historically have
experienced less benefits arising from globalization and national economic growth.
      Yet COVID-19 creates a challenge to such an aim, as both the pandemic and policies
undertaken by governments to slow the transmission of the virus can create uneven effects
across many dimensions including financial and social capital, age, gender, industry, and
locality given differing resilience of individuals and firms to the virus and restrictions.
Understanding these uneven effects is of first order importance for policymakers seeking
to address both the short-term economic and social effects of the pandemic and its
longer-term implications for exacerbating pre-existing regional inequalities.
      In this paper we use granular, real-time data on consumer spending to measure the
uneven geography of recession and recovery across the United Kingdom. The granular
data is provided by Fable Data, as previously used by Gathergood and Guttman-Kenney
(2020) in analysis of the effects of localised lockdowns on local consumer spending.2
Fable Data record hundreds of millions of transactions on consumer and SME spending
across Europe from 2016 onwards and its real-time structure permits research to inform
current policymaking. When aggregated, Fable’s transaction data provides a highly
correlated, leading indicator of official statistics - we find correlation coefficients with
Bank of England and Office for National Statistics data of 0.91 and 0.87 respectively
but, unlike official statistics, Fable Data is available in real-time: our research access to
transactions data is with a one working day lag.
      Using these data, we document the uneven geographic impact of COVID-19 on consumer
spending in the UK during 2020, shown in total spending and in components of online

1
    https://www.ifs.org.uk/uploads/Green-Budget-2020-Levelling-up-where-and-how.pdf
2
    More information on Fable Data is available at www.fabledata.com.

                                             2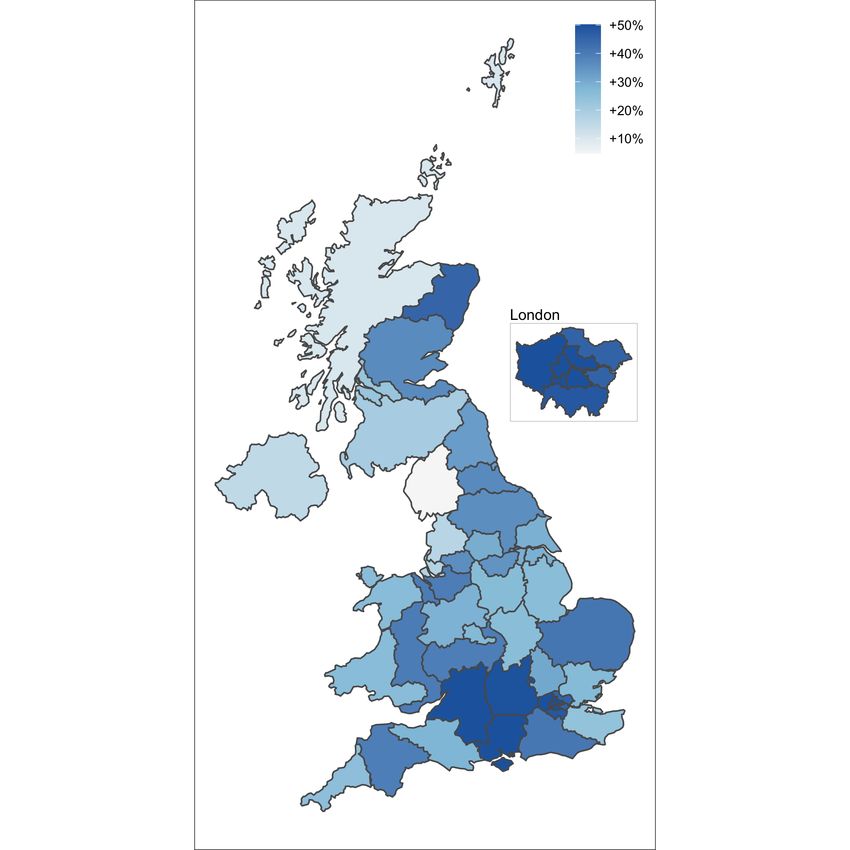
and offline (i.e., in store) spending. Our headline results is that, while there has been an
overall recovery in spending as “pent-up” demand has been realised, there is significant
geographic variation in the recovery. Aggregate spending recovered from a low of a 29%
year-on-year decline in April 2020 to a 12% year-on-year growth in October 2020. Such
pent-up demand may be a combination of the lifting of restrictions, consumers becoming
more confident to spend given less fear of the virus and improved economic prospects
or increased fatigue reducing compliance with restrictions. We show three key results
relating to the geographic variation in recovery.
   First, the recovery in consumer spending has been faster in the South and “home
counties” surrounding London. In contrast, the Midlands, Wales, the North-East and
Scotland show the weakest year-on-year growth, or in the latter two cases close to no
year-on-year growth at all. Moreover, the faster recovery in the South of England and the
Eastern and Western regions is strongly driven by faster growth of online card spending.
Notably, within England the fastest year-on-year growth is in the outer-West area of
London, the South West and Eastern England – areas characterised by highly affluent
communities and high level of second-home ownership. This suggests that, to a degree,
spending growth is strongest in the work from home, or potentially work from second
home, areas of the UK.
   Second, the speed of recovery has been fastest outside large cities, in commuter-towns
and affluent semi-countryside conurbations. We show that the variation in the speed of
recovery can also be characterised as differing by types of urban settlements. In particular,
the recovery has been fastest and strongest in ‘business, education and heritage centres’ –
such areas are popular domestic tourist destinations and thus this is in line with consumers
substituting foreign for domestic holidays. Recovery was less strong in ‘countryside living’
- predominately rural areas but still noticeably stronger than other, more urban, areas.
For more urban areas, London has had a steady recovery whereas ‘affluent England’,
‘services & industrial legacy’, and ‘urban settlements’ are showing weaker recoveries.
   Third, we show that as at the end of November 2020, the point when the second
national lockdown was coming to an end to be replaced by the introduction of a revised

                                             3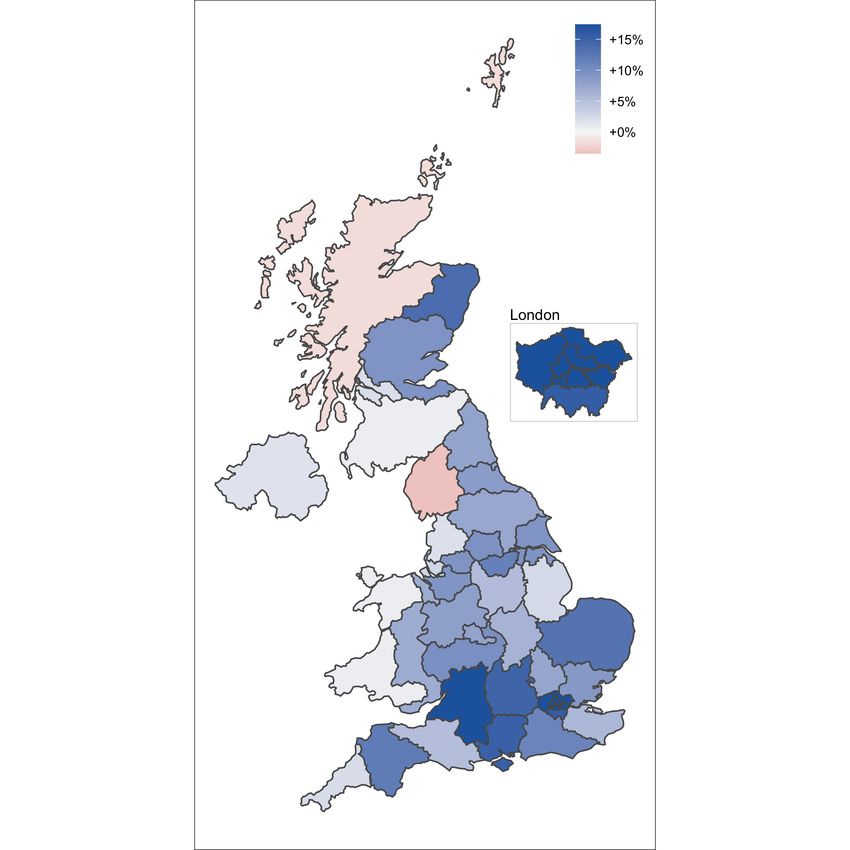
“Tier” system defining levels of restrictions across geographies, the highest Tier areas
(known as “Tier 3”) had experienced a much slower recovery in year-on-year spending,
compared with the mid-Tier areas (“Tier 2”).3 Tier 2 and Tier 3 areas exhibit similar
year-on-year growth rates in card spending in April and July 2020 (the period before
this Tier system came into operation). However, by October this pattern diverges, with
stronger recovering in overall spending in the Tier 2 areas compared with the Tier 3 areas.
This divergence persists through November 2020, with localities facing the UK’s new
tighter “Tier 3” restrictions (mostly the midlands and northern areas) showing 38.4% lower
year-on-year growth in overall spending compared with areas facing the less restrictive
“Tier 2” (mostly London and the South). Our results corroborate recent evidence from
labour market statistics that the pandemic is levelling down economic activity in the UK,
thereby exacerbating regional inequality.
    Our study further contributes to a burgeoning literature understanding the economic
effects of COVID-19. A succession of studies demonstrate how consumer behaviour has
been radically affected by COVID-19 and government policies to mitigate its effects.
The first study to do so was Baker et al. (2020) using US fintech data. Following this,
Opportunity Insights (Chetty et al., 2020a,b) produced a dashboard using multiple data
sources to track regional US consumption behavior alongside other economic indicators.4
Beyond the US similar exercises have been carried out to understand household consumption
in the early stages of the pandemic – showing remarkably consistent results (Andersen
et al., 2020; Bounie et al., 2020b,a; Bourquin et al., 2020; Campos-Vazquez and Esquivel,
2020; Carvalho et al., 2020; Chen et al., 2020; Chronopoulos et al., 2020; Davenport et al.,
2020b; Hodbod et al., 2020; Horvath et al., 2020; Jaravel and O’Connell, 2020; O’Connell
et al., 2020; Surico et al., 2020; Watanabe et al., 2020). Analysis of JP Morgan Chase
data (Cox et al., 2020; Farrell et al., 2020) has described in detail how household balance
sheets have changed as a result of the COVID-19 recession and how households have

3
  There are three Tiers of restrictions applied to geographies in England, Tiers 1-3. We exclude Tier 1
  from the analysis as only very few, rural, localities are classed as Tier 1 as of December 2020 (accounting
  for only 1.3% of the UK adult population). Scotland is under a different but analogous regime while
  Wales and Northern Ireland operating under more different approaches.
4
  https://tracktherecovery.org

                                                     4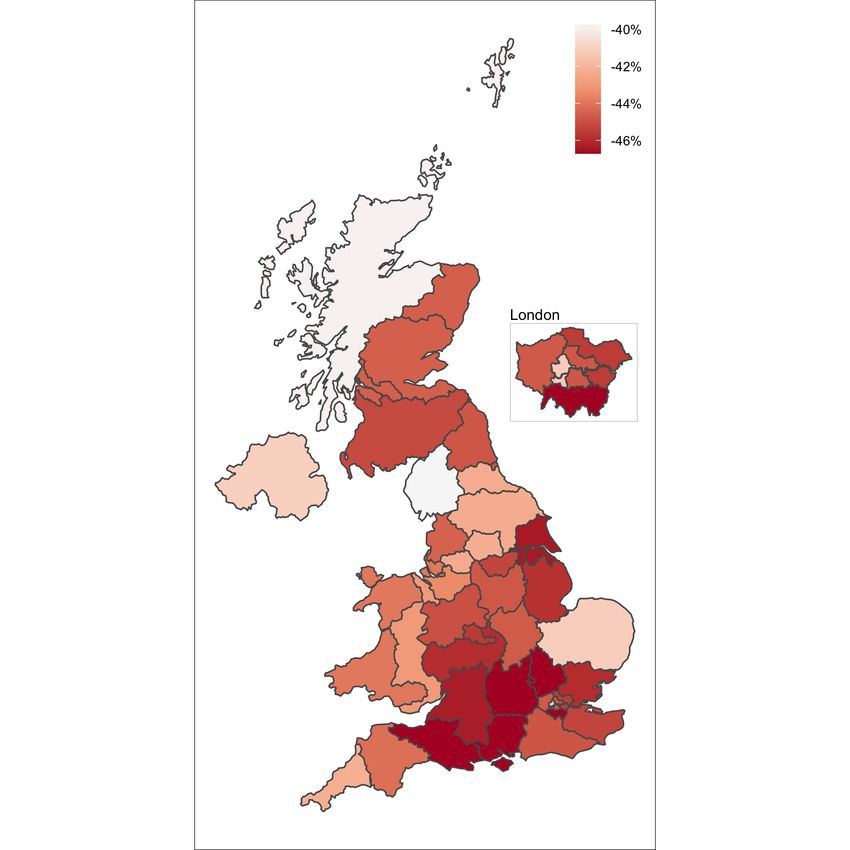
responded to fiscal stimulus. A variety of studies have examined the effects of the first
set of lockdowns on economic behavior and evaluated the degree to which there are
trade-offs between policy interventions attempting to contain the virus and economic
damage (Aum et al., 2020; Beach et al., 2020; Barro et al., 2020; Coibion et al., 2020;
Correia et al., 2020; Cui et al., 2020; Dave et al., 2020; Friedson et al., 2020; Hacioglu
et al., 2020; Glover et al., 2020; Goolsbee et al., 2020; Goolsbee and Syverson, 2020;
Guerrieri et al., 2020; Hall et al., 2020; Lilley et al., 2020; Miles et al., 2020; O’Connell
et al., 2020; Jones et al., 2020; Toxvaerd, 2020; Wang, 2020). A broader literature has
sought to measure regional inequality and understand why it arises and its effects (e.g.
Milanovic, 2005; Glaeser et al., 2008; Chetty and Hendren, 2018a,b; Iammarino et al.,
2019; Carniero et al., 2020) with recent reports by UK think tanks evaluating the UK
government’s policy aim to ‘level-up’ regions.5 New private sector data sources such as
harnessed by Chetty et al. (2020a) in response to COVID-19 have been able to reveal in
real-time how and why they are developing during this economic and health crisis.
      Beyond the topicality and importance of the results, our paper serves to further
demonstrate the value of granular, real-time account-level data for economic research.
Fable Data contain transaction-by-transaction spending data, updated daily, for a large
representative samples of European bank accounts and credit cards, with individual-level
and geocode identifiers. As in our earlier paper, we show that these data remain a
highly correlated, leading indicator of official statistics – data which are only available in
aggregated form and with many months lag - in contrast to Fable Data which are available
in real-time and disaggregated. Moreover, these data are applicable to a broad variety
of questions in the analysis of individual consumption behavior. They further present a
new opportunity for researchers to measure consumption in arguably more reliable ways

5
    Leunig and Overman (2008); Overman et al. (2009); Ludwig et al. (2013); Chetty et al.
    (2016); Geary and Stark (2016); Chetty et al. (2018); Gal and Egeland (2018); Manduca
    (2019); Agrawal and Phillips (2020); Bhattacharjee et al. (2020); Carrascal-Incera et al.
    (2020); Davenport et al. (2020a); Sensier and Devine (2020); Zymek and Jones (2020)
    https://www.ifs.org.uk/uploads/Green-Budget-2020-Levelling-up-where-and-how.pdf
    https://www.resolutionfoundation.org/app/uploads/2019/07/Mapping-Gaps.pdf
    urlhttps://www.smf.co.uk/wp-content/uploads/2020/01/Beyond-levelling-up.pdf
    https://www.centreforcities.org/wp-content/uploads/2020/02/Why-big-cities-are-
    crucial-to-levelling-up.pdf
    https://www.ippr.org/research/publications/state-of-the-north-2020-21

                                               5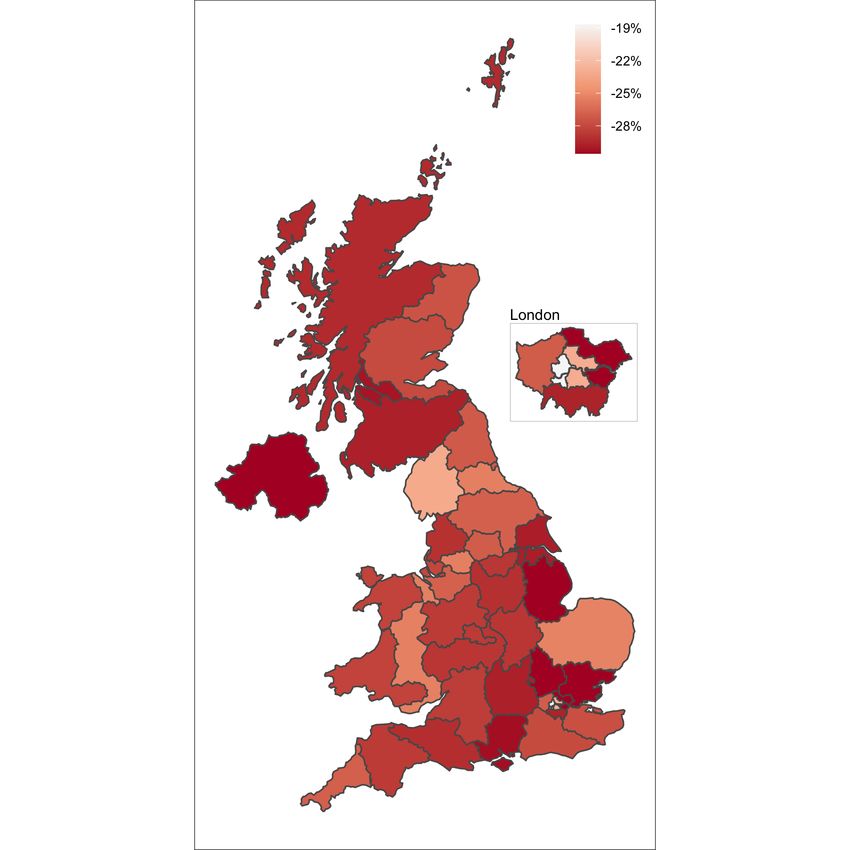
than using data from financial aggregators (a selected sample of consumers), scanner data
(a selected subsample of expenditures) or consumption surveys, which has become less
reliable in recent decades and has prompted a variety of initiatives aimed at improving
the measurement of consumption (see Browning et al., 2014; Landais and Spinnewijn,
2020). In current research we are further exploring the potential of these data to analyze
retail sectoral impacts.
       The ability to measure regional, economic data in real-time using datasets such as
Fable Data offers exciting potential to inform when, where and how to target regional
policy interventions for evidence-based policymaking.6 In particular, the ability to evaluate
the causal effects of interventions across a breadth of economic outcomes in real-time
provides a cost-effective way for governments to trial interventions in selected regions
and quickly consider whether to expand, modify or remove such policies. This is a more
nimble strategy than traditional government approaches of typically applying policies at
a national level with limited abilities to assess their impacts.
       In the context of this paper, the regional inequalities shown indicate that, in order
to ‘level-up’ the historically less productive UK regions longer-term, there is a rationale
for trialling short-term interventions to address the ’levelling-down’ that has occurred
in 2020 as a result of COVID-19. These could occur in 2021 once the virus outbreaks
are under control and vaccinations have been more broadly rolled out. What could such
measures look like? Encouraging spending in businesses located in harder hit areas could
occur through business rate relief or VAT cuts. Other measures (e.g. travel vouchers)
could try to encourage consumers to visit harder-hit parts of the UK. Or a less centralised
approach would be for national governments to make temporary funding available to local
governments in proportion to how adversely they have been impacted by the crisis for
those local authorities to spend as they see fit (e.g. council tax reductions or rebates,
funding local events or services). We hope our paper will prompt public discussion on
other types of measures that could be feasibly implemented and evaluating their merits.

6
    To this end the authors have access to a variety of real-time, high-quality private-sector datasets for
    research to inform policymaking. If you are a data provider interested in joining this collaboration
    please contact the authors for further details on how to potentially partner in this initiative.

                                                      6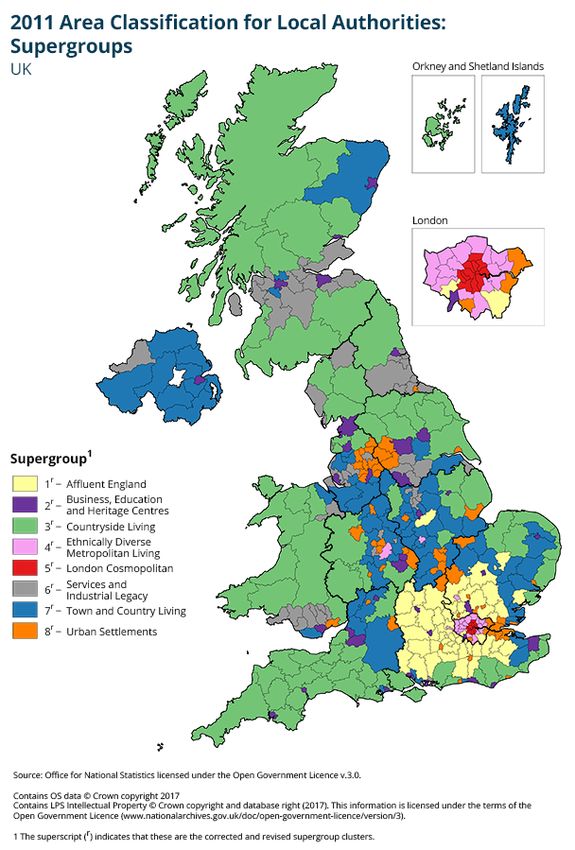
2     Data

2.1     Consumption Data

We use consumption data provided by Fable Data Limited as previously used in Gathergood
and Guttman-Kenney (2020), and summarize again here the key features of the data.7
Fable data record hundreds of millions of transactions on consumer and SME spending
across European countries from 2016 onwards.8 Fable’s transaction data are anonymized
and available in real-time: our research access is with a one working day lag. Fable sources
data from a variety of banks and credit card companies: accounts cover both spending
on credit cards and inflows and outflows on current (checking) accounts. Data is at the
account-level and hence we can follow spending behavior on an individual account over
time.9 Fable data is similar to recently-available data sets from financial aggregators and
service providers, but does not have some of the limitations of other datasets as Fable
Data works solely with anonymised datasets, and has sourced data directly from banks
and credit card issuers, rather than individual subscribers.10
    For each spending transaction we observe a standard classification merchant category
code for the spending type. Fable also produces its own categorizations of spending,
utilizing the more granular information it has available from transaction strings. These
data also differentiate between online and store-based transactions.
    The data has an added feature of containing geo-tags for both the card holder’s
postcode sector and, where applicable, the address of the store or outlet in which a
transaction is made. For each UK account we observe the postcode sector of the cardholder’s
address. In the UK, postcode sectors are very granular geographies: There are over 11,000
postcode sectors in the UK with each sector containing approximately 3,000 addresses.

7
  More information on Fable Data is available at www.fabledata.com.
8
  Commercial sensitivities mean we do not disclose the exact number of accounts and transactions
  available in the data.
9
  In cases where one individual has multiple accounts, we cannot link multiple accounts in the data to
  the individual but can aggregate to a geographic region.
10
   Baker (2018) provides validation and application of US financial aggregator data. Financial aggregator
   data for the UK is widely shared for research purposes by Money Dashboard, a UK-based fintech
   (Chronopoulos et al., 2020; Davenport et al., 2020b; Bourquin et al., 2020; Surico et al., 2020). Bourquin
   et al. (2020) analyse the characteristics of Money Dashboard users.

                                                     7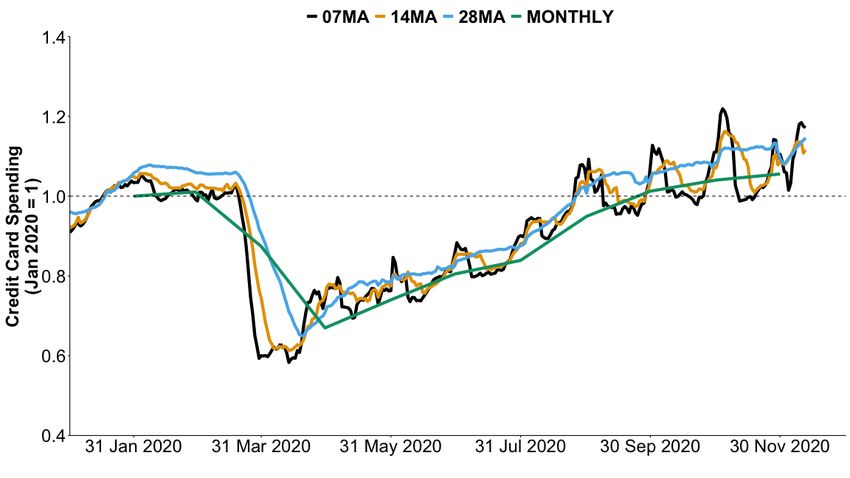
Where a transaction can be linked to a particular store, the full address of that store is
available. Also, where a transaction is of a listed firm, Fable tags merchants to their parent
groups and stock market tickers. For this study we focus on transactions denominated in
British pounds sterling on UK-based credit card accounts held by consumers.
      A feature of transaction-level spending data is that, even in data sets containing large
volumes of transactions, the value and count of transactions tend to be highly volatile.
Volatility arises across days of the week, weeks of the month, public holidays, and to some
extent due to variations in the weather. Hence, to construct daily series for comparison
with official statistics, we follow an approach to smooth the transaction volumes over time
as used by Opportunity Insights on similar US data (Chetty et al., 2020b,a): aggregating
spending by day at the level of geography of interest, taking a seven day moving average
and dividing by the previous year’s value.11 We normalize these series setting an index
to 1 using the mean value 8 - 28 January 2020. We also construct daily series using a 14
and 28 day moving average in an analogous fashion. Finally, for our geographic spending
comparison, we calculate year-on-year monthly growth. We use both year-on-year and
post-January 2020 calculations in our regional analysis.

2.2       Comparison with Official Statistics

One key advantage of Fable Data is the speed with which it can be made available to
researchers and policymakers. This is among many features of the data which make it
attractive for research – the timeliness (it is available the next working day, whereas
official statistics are typically available only with a lag of several months), geographic
granularity (being available at a lower level than official statistics) and, transaction-level
(enabling a more flexible analysis than aggregated official statistics). These data can
therefore potentially be used to construct leading indicators for policymakers and enable
researchers to answer a broader set of research questions than was previously possible
using more traditional data sources.
      However, while these features are potentially valuable, their usefulness depends in part

11
     For 29 February 2020 we divide by an average of 28 February and 1 March 2019.

                                                   8
on how this data series relates to comprehensive, official data. To explore this, Figure
1 Panel A (which updates an earlier version of this figure as shown in Gathergood and
Guttman-Kenney (2020)), compares the time series of Fable Data UK annual changes in
monthly credit card spending to the Bank of England series and shows they are highly
correlated: correlations 0.90 (January 2018 to September 2020), 0.87 (January 2019 to
September 2020) and 0.90 (January 2020 to September 2020). Bank of England data is
only published in aggregated form monthly and with a lag. This figure also compares
to Office for National Statistics data on the value of retail sales (which is available at a
slightly shorter time lag) and similarly shows Fable as a leading indicator of this with
the two series to be highly correlated: correlations 0.87 (January 2018 to October 2020),
0.88 (January 2019 to October 2020) and 0.91 (January 2020 to October 2020).
Figure 1, Panel B shows Fable data measures for 7, 14, 28 day moving averages
– which can be calculated daily in real-time – compared to the monthly series (which
requires waiting until the month end). These daily moving averages show the sharp drop
in consumption in March 2020 far earlier than the monthly series. We thus conclude that
we can use these data as a reliable real-time predictor of official data and as a reasonable
proxy for measuring consumer spending.
On aggregate, we observe a sharp fall in UK credit card spending near the time of
the spike in Covid-19 cases and the national lockdown announcement on 23 March 2020
and then a fairly steady recovery from May to August. Through to the first few weeks
of December 2020, we observe that the recovery in credit card spending has continued,
although not in a sharp “V-shape” but instead in a shape resembling a “tick-shape”. This
indicates that, in aggregate, there has been no evident bounce-back to account for lost
spending through the second and third quarters of 2020. We also note that these patterns
of spending are for UK residents who, without international travel, are spending more
time (and therefore money) domestically but for considering the broader economy and
particular sectors within it such growth in domestic spending is unlikely to be sufficient
to compensate for the lack of spending by tourists to the UK.
93 Results
3.1 Aggregate Card Spending
Table 1 summarises year-on-year changes in overall card spending and then disaggregate
this into offline and online spending for April, July, October, and November 2020. In
April the UK faced the first – and tightest – national lockdown including closure of all
non-essential shops, a requirement or workers to work from home wherever possible, and
limitations on exercise and leisure outside the home. Overall, card spending fell by more
than one-quarter year-on-year, with a drop of over 40% in offline spending. While online
spending increased, the increase year-on-year is a modest 2.4%, partly due to stock-piling
prior to the onset of the first national lockdown and partly due to the limited capacity
of retailers to increase the distribution of goods and services through online channels.
Through the two subsequent quarters of 2020, we see a recovery in card spending,
notably dominated by large year-on-year increases in online spending. Through July,
spending recovered to approximately 10% down year-on-year, but rebounded to approximately
10% up year-on-year as restrictions eased and some “pent-up” demand was realised.
The modest recovery in offline spend, which was still 4% down in October, was greatly
outstripped by a surge in online spend, which was 40% up in October, year-on-year. A
series of local restrictions in the late summer and early autumn did not appear to result in
large declines in spending (Gathergood and Guttman-Kenney, 2020). The second national
lockdown in November (which saw some restrictions on non-essential shops, but not to
the same extent as in April and May 2020) saw a further dip in offline spending, causing
a fall of approximately 12% year-on-year, while online spending continued to grow, at at
year-on-year rate of more than 50%. This contributed to a steady year-on-year increase
in overall spending in November.
3.2 Regional Variation
Our focus in this paper is on the regional variation underlying the national trend. Table 2
repeats Table 1 showing year-on-year changes separately for Northern Ireland, Scotland,
10and Wales. This reveals how total and offline spending in Wales was noticeably lower in
November 2020 than Scotland but both regions had similar online spending growth.
The flexibility of Fable’s transaction-level data enables us to decide the most suitable
level of geography to examine and measures to construct. To illustrate this, we calculate
our two measures of consumer spending (year-on-year changes, and normalised to Jan
2020) at the mid-level geography of the UK, known as the Nomenclature of Territorial
Units for Statistics Second Tier, or NUTS 2.
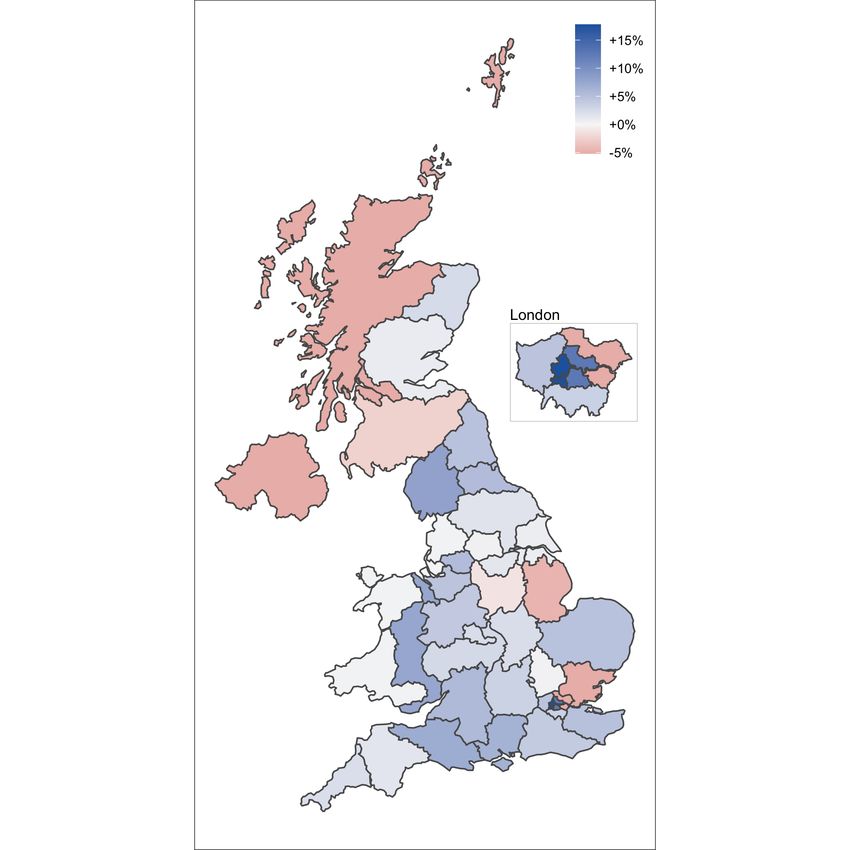
Figure 2 illustrates the year-on-year change in overall card spending (Panel A), offline
spending (Panel B), and Online spending (Panel C). The colour shades have different
scales on each panel but red indicates a decline in year-on-year spending, while the colour
shades in blue indicate a growth in year-on-year spending and whiter shades indicate
being closer to no year-on-year growth. The figures illustrate the aggregate trend in
card spending, with a national decline in overall spending across the United Kingdom,
driven by a particularly strong decline in offline spending and moderate growth in online
spending.
Figure 3 reproduces the same illustrations for October 2020, a point at which the UK
had emerged from the end of first national lockdown and instead briefly instigated three
tiers of restrictions, applied at the local level. The figures show regional heterogeneity in
the speed of recovery in spending. Overall, card spending shows the strongest year-on-year
growth in the South of England and the Eastern and Western regions, while the Midlands,
Wales, the North-East, and Scotland show weak year-on-year growth, or in the latter two
cases close to no year-on-year growth.
Panels B and C demonstrate that the faster recovery in the south of England and the
Eastern and Western regions is strongly driven by faster growth of online card spending.
Notably, within England, the fastest year-on-year growth is in the outer-West area of
London, the South West and Eastern England – areas characterised by highly affluent
communities and high levels of second-home ownership. This suggests that, to a degree,
spending growth is strongest in the work from home, or potentially work from second
home areas of the UK - this is in line with US studies on the implications of COVID-19
11for cities (e.g. Althoff et al., 2020; Bartik et al., 2020; Dingel and Neiman, 2020). In
contrast, online spending shows a much slower recovery in the Midlands, North-East and
Scotland.
A break-down of the fastest and slowest recovering areas is shown in Table 3. The
strongest growth in overall spending year-on-year is seen in those regions of the South,
East and to the West of London - in and around the “home counties” and the affluent
second home ownership belt between London and Bristol. In contrast, the slowest
growth is seen in Scotland, the North East (Cumbria and Lancashire), the East Midlands
(Derbyshire and Nottinghamshire) and West Wales.
3.3 Variation Across Urban Geographies
To understand the potential of these data further, and the heterogeneous impacts of
the COVID-19 crisis, we disaggregate the national series by urban geographies. This
updates earlier analyses presented in Gathergood and Guttman-Kenney (2020). Figure
4 disaggregating by eight urban-rural categories created by the UK national statistics
agency – the Office for National Statistics (ONS).12 The figures illustrate that recovery has
been fastest and strongest in ‘business, education and heritage centres’ – such areas are
popular domestic tourist destinations and thus this is in line with consumers substituting
foreign for domestic holidays. Recovery was less strong in ‘countryside living’ – predominately
rural areas – but still noticeably stronger than other, more rural areas. In more urban
areas, ‘London cosmopolitan’ followed by ‘ethnically diverse metropolitan living’ have had
a steady recovery, whereas ‘affluent England’, ‘services & industrial legacy’, and ‘urban
settlements’ are showing weaker recoveries.
3.4 Variation Across Lockdown “Tiers”
Over 2020, the UK has adopted a variety of “Tier” systems to impose more or less
encroaching limitations on individual movement and social interaction. Following the
12
For maps, methodologies and a detailed description of each category see: https:
//www.ons.gov.uk/methodology/geography/geographicalproducts/areaclassifications/
2011areaclassifications.
12re-opening after the first national lockdown, a process that began in early May and
ended in mid-July, the UK government adopted a policy of “local lockdowns”, initially on
an ad-hoc basis. Particular cities or areas with spikes in positive COVID-19 test rates
were subject to these ad hoc restrictions, such as Leicester in the Midlands and Aberdeen
in North-East Scotland. The effects of this local lockdown strategy on COVID-19 positive
case rates and on card spending are evaluated in Gathergood and Guttman-Kenney
(2020).
In October 2020, the England adopted a formal Tier system, defining three Tiers
of restrictions (a similar system was also introduced in Scotland).13 These tiers were
labelled as “Medium”, “High” and “Very High”. While most of England was placed in
the Tier 1 category, areas around East of London, the Midlands, and areas of the North
were categorised into Tiers 2 or 3. Under the rules, in Tier 3 areas certain types of
business premises were required to close, while nightclubs and hospitality venues saw
their opening hours restricted and their services limited to sit-down meals. Moreover,
no mixing between households was permitted indoors or in outdoor private spaces (e.g.
gardens), with household mixing allowed only in groups of up to 6 in public outdoor
spaces.
By November 2020, the UK government enforced a second national lockdown in
England in the form of a four-week period during which pubs, restaurants, leisure centres
and non-essential shops would close (in addition to the restrictions in place under Tier 3,
as described above).14 The UK government re-introduced the job furlough scheme in a
form closely resembling that offered in the first national lockdown. This second lockdown
ended in early December 2020, with localities being again placed into one of the three
Tiers. The allocation of localities to Tiers through 2020 is highly persistent. Localities
which have been allocated to Tiers 2 or 3 in October 2020 were all placed in Tier 3 in
December 2020. However, a notable difference in the December 2020 classification of
areas to Tiers is that very few areas are classified as Tier 1 (these areas together host less
13
For details, see https://en.wikipedia.org/wiki/First_COVID-19_tier_regulations_in_
England.
14
Northern Ireland, Scotland and Wales also introduced further restrictions with Table 2 showing results
for these areas.
13than 1.5% of the UK population).
To provide an indication of the effects of the distribution of the cumulative effects of
national and local lockdowns across England, in Table 4 we classify NUTS 2 regions
by their Tier status as of the start of December 2020 (London, parts of Essex and
Hertfordshire was later reclassified into Tier 3 in mid-December and then into a new
Tier 4 category on 20 December following an outbreak of a more contagious new, mutant
strain of the virus). The tables provide a breakdown of year-on-year growth in overall,
offline and online spending for April, July, October, and November.
Table 4 shows two main patterns. First, Tier 2 and Tier 3 areas exhibit similar
year-on-year growth rates in card spending in April and July 2020 (the period before
the Tier system came into operation). However, by October this pattern diverges, with
stronger recoveries in overall spending in the Tier 2 areas compared with the Tier 3 areas.
This divergence persists through November 2020, with localities facing the new tighter
“Tier 3” restrictions (mostly the Midlands and Northern Areas) showing 38.4% lower
year-on-year growth in overall spending compared with areas facing the less restrictive
“Tier 2” (mostly London and the South). These findings corroborate recent evidence
from labour market statistics that the pandemic is levelling down economic activity in
the UK, thereby exacerbating regional inequality. Thus far there is little evidence such
lost output of the Tier 3 areas most affected by COVID-19 would naturally recover and so
these areas may fall even further behind regions that entered the pandemic with stronger
regional economies.
4 Real-Time Rebalancing Policies
Addressing regional inequalities that have persisted in the UK and other countries for
decades is a hard problem with no quick fixes. However, the inequalities we document
here are more short-term - having developed in 2020. This offers a potential opportunity
for temporary policy interventions targeted at ‘levelling-up’ the regions worst affected by
the COVID-19 pandemic to prevent such inequalities becoming persistent. Such measures
14could be safely introduced in 2021 once virus outbreaks are deemed to be under control
and vaccinations have been more broadly rolled out.
The ability to measure regional economic data in real-time using datasets such as Fable
Data offers a groundbreaking potential to inform when, where, and how to target such
regional policy interventions.15 Previously, governments would lack sufficiently real-time
data to be able to effectively target interventions in such a rapidly moving crisis. Even
in ‘normal’ times it is extremely difficult to predict the effectiveness of policies but in
volatile economic conditions can become even more so. The ability to evaluate the causal
effects of interventions across a breadth of economic outcomes in real-time provides a
cost-effective way for governments to trial interventions in selected regions at small scale
and quickly consider whether to expand, modify or remove such policies. This is a more
nimble strategy than traditional government approaches of typically applying policies at
a national level with limited (if any) ability to assess their impact until it is too late to
scale up or down such measures to address the original policy aims.
What could such targeted, regional measures look like? We provide a few examples
to stimulate public discussions evaluating their relative merits and feasibility of these
and other proposals. Given the clear impacts of offline retailers in particular locations,
providing relief to such businesses can help to sustain them and enable them to pass
through savings to increase demand for their business. This could take the form of
business rate relief or VAT cuts based on the location of stores.
Given some regions have recovered rather well, providing incentives to encourage
residents in those locations to visit harder-hit parts of the UK could be an effective way
to generate spending in depressed areas. One method for doing so would be providing
vouchers for discounted travel to and spend in particular destinations —potentially
through a lottery system to enable some individuals to have large incentives to do
so. Such initiatives may also yield broader, longer-term benefits for consumers living in
different regions. It may make the labor market more geographically mobile and repair
15
To this end, the authors have access to a variety of real-time, high-quality private-sector datasets for
research to inform policymaking. If you are a data provider interested in joining this collaboration,
please contact the authors for further details on how to potentially partner in this initiative.
15cultural divides. A less centralised approach would be for national governments to make
temporary funding available to local governments. This could be done in proportion to
how adversely such regions have been impacted by the crisis and adjust the duration
and amount of funding to local authorities in response to real-time indicators. Such
funding could be allocated to particular uses, however, it may be more efficient to provide
flexibility to enable local authorities to use their local knowledge and engage with local
residents to use as they consider would be its most productive use. For example, some
areas may decide to use this to provide council tax reductions or rebates to act as a
direct form of redistribution. Other areas may consider forms of spending to be more
efficient, such as funding local events or services or initiatives targeted at providing relief
to socio-economic groups of people most adversely affected by the pandemic.
5 Conclusion
The impact of the COVID-19 pandemic, and the restrictions imposed by the government
to limit infections, is geographically uneven. We use newly-available transaction-level
credit card data provided by Fable Data to examine geographic variation in the recovery
in card spending across the UK. Our analysis shows that the recovery in aggregate
spending in the UK masks significant heterogeneity across regions. The recovery is
heavily weighted towards the “home counties” around outer London and the South, which
have shown strong growth in online spending in particular. The strongest recovery in
spending is seen in online spending in the “commuter belt” areas in outer London and the
surrounding localities, and also in areas of high second home ownership, where working
from home (including working from second homes) has significantly displaced the location
of spending.
We hope by documenting such regional inequalities, our paper helps to provoke
informed discussion on this topic and what policy tools could be harnessed to rebalance
them in 2021. The availability of real-time data offers the potential for governments
to trial a variety of regionally-targeted policies and get real-time feedback on their
16effectiveness in order to nimbly, expand, modify or remove such measures. While this
paper has focused on the regional impacts of COVID-19, a broad range of other unequal
impacts have also developed (e.g. financial and social capital, age, gender, and industry)
where partnerships between governments, private sector data providers and academics can
help to better measure, understand these impacts and develop well-targeted interventions
to attempt to recover lost potential output and rebalance inequalities.
17Figure 1: UK Credit Card Spending 2018 - 2020
A. Fable Monthly Data Compared to Bank of England &
& Office for National Statistics Data, 2018 - 2020
B. Fable Daily Data, 2020
(7, 14, 28 day moving averages and monthly)
Notes: Bank of England monthly data is derived from LPMVZQH (monthly gross credit card
lending to individuals). Office for National Statistics monthly data is derived from value of all
retail sales (average weekly sales for all retailing including automative fuel). Fable Data monthly
series is indexed to January 2020. Fable Data 7,14,28 day moving averages are the daily moving
average de-seasoned by taking ratio of the moving average a year prior. Each daily series is then
indexed to its moving average 8 - 28 January 2020. Fable Data to 12 December 2020.
18Figure 2: April 2020 Card Spend by Geographic Area (Year-on-Year % Change)
19
(a) Overall (b) Offline (c) Online
Notes: Geographic regions are NUTS 2 (Nomenclature of Territorial Units for Statistics) of the United Kingdom.Figure 3: October 2020 Card Spend by Geographic Area (Year-on-Year % Change)
20
(a) Overall (b) Offline (c) Online
Notes: Geographic regions are NUTS 2 (Nomenclature of Territorial Units for Statistics) of the United Kingdom.Figure 4: Credit Card Spending by Urban-rural Classifications
(1 January - 12 December 2020)
A. Affluent England B. Business, Education & Heritage Sectors
C. Countryside Living D. Ethnically Diverse Metropolitan Living
E. London Cosmopolitan F. Services & Industrial Legacy
G. Towns & Country Living H. Urban Settlements
Notes: Credit card spending is 14 day moving average de-seasoned by taking ratio of the
14 day moving average a year prior. The series is then indexed to its moving average
8 - 28 January 2020. Urban areas presented are the UK official statistics agency the
Office for National Statistics (ONS) Super Groups where areas are classified based on the
2011 census. A UK map of these areas can be found in Figure 5 and further details can
be found at: https: // www. ons. gov. uk/ methodology/ geography/ geographicalproducts/
areaclassifications/ 2011areaclassifications
21Figure 5: UK Urban-rural areas (Super Groups)
Source: Office for National Statistics (ONS)
22Table 1: UK Aggregate Card Spending (Year-on-Year % Changes)
Month
April July October November
Overall -28.1% -9.9% +11.8% +12.7%
Offline -44.7% -22.7% -4.2% -12.0%
Online +2.4% +12.7% + 39.7% + 53.1%
Notes: Year-on-year change in monthly credit card spending in the UK, including the estimated
change in offline and online spending.
Table 2: Aggregate Card Spending Across Regions (Year-on-Year % Changes)
(a) Northern Ireland
Month
April July October November
Overall -30.6% -13.6% 1.6% 10.9%
Offline -41.0% -18.2% -6.0% -1.1%
Online -11.6% -5.4% 14.8% 30.3%
(b) Scotland
Month
April July October November
Overall -29.0% -15.3% 5.0% 9.3%
Offline -44.3% -26.6% -8.9% -6.2%
Online -3.1% 3.4% 28.0% 33.0%
(c) Wales
Month
April July October November
Overall -27.2% -16.0% 2.9% 6.0%
Offline -43.6% -26.6% -13.4% -9.1%
Online 2.9% 3.1% 31.0% 30.4%
Notes: Year-on-year change in monthly credit card spending across regions, including the
estimated change in offline and online spending.
Table 3: Top & Bottom 5 UK Geographies by Growth in Overall Card
Spending
(November 2020, Year-on-Year % Changes)
Top 5 % Change Bottom 5 % Change
Outer London - South 16.8% Southern Scotland 3.9%
Outer London - East 15.8% Cumbria 3.9%
Gloucestershire, Wiltshire 14.6% Derbyshire & Nottinghamshire 4.3%
Berkshire, Bucks & Oxfordshire 13.5% West Wales 5.2%
Hampshire & Isle of Wight 12.1% Lancashire 5.3%
Notes: Top and bottom five NUTS 2 areas with the largest annual change in credit card spending
during November.
23Table 4: Aggregate Card Spending in England by Dec 2020 Tiers
(Year-on-Year % Changes)
Tier 2 Month
April July October November
Overall -28.1% -9.1% +15.6% +15.1%
Offline -45.3% -22.6% -3.2% -12.4%
Online +3.6% +17.2% + 47.9% + 60.3%
Tier 3 Month
April July October November
Overall -27.9% -10.1% +8.5% +9.3%
Offline -44.5% -22.4% -4.8% -14.9%
Online +2.3% +9.8% + 31.9% + 49.4%
Notes: Year-on-year change in monthly credit card spending by Tier group.
24References
Agrawal, S. and Phillips, D. (2020). Catching up or falling behind? geographical
inequalities in the uk and how they have changed in recent years. IFS Briefing Note.
Althoff, L., Eckert, F., Ganapati, S., and Walsh, C. (2020). The city paradox: Skilled
services and remote work. CESIfo Working Paper.
Andersen, A. L., Hansen, E. T., Johannesen, N., and Sheridan, A. (2020). Consumer
responses to the covid-19 crisis: Evidence from bank account transaction data. Covid
Economics.
Aum, S., Lee, S. Y. T., and Shin, Y. (2020). Covid-19 doesn’t need lockdowns to destroy
jobs: The effect of local outbreaks in korea. NBER Working Paper.
Baker, S. R. (2018). Debt and the response to household income shocks: Validation
and application of linked financial account data. Journal of Political Economy,
126(4):1504–1557.
Baker, S. R., Farrokhnia, R. A., Meyer, S., Pagel, M., and Yannelis, C. (2020). How does
household spending respond to an epidemic? consumption during the 2020 covid-19
pandemic. Review of Asset Pricing Studies.
Barro, R. J., Ursúa, J. F., and Weng, J. (2020). The coronavirus and the great influenza
pandemic: Lessons from the “spanish flu” for the coronavirus’s potential effects on
mortality and economic activity. NBER Working Paper.
Bartik, A. W., Cullen, Z. B., Glaeser, E. L., Luca, M., and Stanton, C. T. (2020).
What jobs are being done at home during the covid-19 crisis? evidence from firm-level
surveys. NBER Working Paper.
Beach, B., Clay, K., and Saavedra, M. H. (2020). The 1918 influenza pandemic and its
lessons for covid-19. NBER Working Paper.
Bhattacharjee, A., Nguyen, D., and Venables, T. (2020). The prospects for regional
disparities in the uk in times of brexit and covid-19. National Institute Economic
Review, 253:R1–R3.
Bounie, D., Camara, Y., Fize, E., Galbraith, J. W., Landais, C., Lavest, C., Pazem,
T., and Savatier, B. (2020a). Consumers’ mobility, expenditure and online-offline
substitution response to covid-19: Evidence from french transaction data. Covid
Economics.
Bounie, D., Camara, Y., and Galbraith, J. W. (2020b). Consumers’ mobility, expenditure
and online-offline substitution response to covid-19: Evidence from french transaction
data. Working Paper.
Bourquin, P., Delestre, I., Joyce, R., Rasul, I., and Waters, T. (2020). The effects of
coronavirus on household finances and financial distress. IFS Briefing Note.
Browning, M., Crossley, T. F., and Winter, J. (2014). The measurement of household
consumption expenditures. Annu. Rev. Econ., 6(1):475–501.
25Campos-Vazquez, R. and Esquivel, G. (2020). Consumption and geographic mobility in
pandemic times: Evidence from mexico. Covid Economics.
Carniero, P., Cattan, S., Dearden, L., van der Erve, L., Krutikova, S., and Macmillan, L.
(2020). The long shadow of deprivation: Differences in opportunities across england.
Technical report, Technical report.
Carrascal-Incera, A., McCann, P., Ortega-Argilés, R., and Rodríguez-Pose, A. (2020). Uk
interregional inequality in a historical and international comparative context. National
Institute Economic Review, 253:R4–R17.
Carvalho, V. M., Hansen, S., Ortiz, A., Garcia, J. R., Rodrigo, T., Rodriguez Mora,
S., and Ruiz de Aguirre, P. (2020). Tracking the covid-19 crisis with high-resolution
transaction data. CEPR Discussion Paper.
Chen, H., Qian, W., and Wen, Q. (2020). The impact of the covid-19 pandemic on
consumption: Learning from high frequency transaction data. Working Paper.
Chetty, R., Friedman, J. N., Hendren, N., Jones, M. R., and Porter, S. R. (2018). The
opportunity atlas: Mapping the childhood roots of social mobility. NBER Working
Paper.
Chetty, R., Friedman, J. N., Hendren, N., Stepner, M., and "the Opportunity Insights
Team" (2020a). The economic impacts of covid-19: Evidence from a new public
database built from private sector data. NBER Working Paper.
Chetty, R., Friedman, J. N., Hendren, N., Stepner, M., and "the Opportunity Insights
Team" (2020b). Real-time economics: A new platform to track the impacts of covid-19
on people, businesses, and communities using private sector data. NBER Working
Paper.
Chetty, R. and Hendren, N. (2018a). The impacts of neighborhoods on intergenerational
mobility i: Childhood exposure effects. The Quarterly Journal of Economics,
133(3):1107–1162.
Chetty, R. and Hendren, N. (2018b). The impacts of neighborhoods on intergenerational
mobility ii: County-level estimates. The Quarterly Journal of Economics,
133(3):1163–1228.
Chetty, R., Hendren, N., and Katz, L. F. (2016). The effects of exposure to better
neighborhoods on children: New evidence from the moving to opportunity experiment.
American Economic Review, 106(4):855–902.
Chronopoulos, D., Lukas, M., and Wilson, J. (2020). Consumer spending responses to
the covid-19 pandemic: An assessment of Great Britain. Covid Economics.
Coibion, O., Gorodnichenko, Y., and Weber, M. (2020). The cost of the covid-19 crisis:
Lockdowns, macroeconomic expectations, and consumer spending. NBER Working
Paper.
Correia, S., Luck, S., and Verner, E. (2020). Pandemics depress the economy, public
health interventions do not: Evidence from the 1918 flu. Working Paper.
26Cox, N., Ganong, P., Noel, P., Vavra, J., Wong, A., Farrell, D., and Greig, F. (2020).
Initial impacts of the pandemic on consumer behavior: Evidence from linked income,
spending, and savings data. Brookings Papers on Economic Activity.
Cui, Z., Heal, G., and Kunreuther, H. (2020). Covid-19, shelter-in place strategies and
tipping. NBER Working Paper.
Dave, D. M., Friedson, A. I., Matsuzawa, K., Sabia, J. J., and Safford, S. (2020).
Were urban cowboys enough to control covid-19? local shelter-in-place orders and
coronavirus case growth. NBER Working Paper.
Davenport, A., Farquharson, C., Rasul, I., Sibieta, L., and Stoye, G. (2020a). The
geography of the covid-19 crisis in england. Institute for Fiscal Studies.
Davenport, A., Joyce, R., Rasul, I., and Waters, T. (2020b). Spending and saving during
the covid-19 crisis: evidence from bank account data. IFS Briefing Note.
Dingel, J. I. and Neiman, B. (2020). How many jobs can be done at home? Journal of
Public Economics, 189.
Farrell, D., Ganong, P., Greig, F., Liebeskind, M., Noel, P., and Vavra, J. (2020).
Consumption effects of unemployment insurance during the covid-19 pandemic. JP
Morgan Chase Institute.
Friedson, A. I., McNichols, D., Sabia, J. J., and Dave, D. (2020). Did california’s
shelter-in-place order work? early coronavirus-related public health effects. NBER
Working Paper.
Gal, P. and Egeland, J. (2018). Reducing regional disparities in productivity in the united
kingdom. Technical report, OECD.
Gathergood, J. and Guttman-Kenney, B. (2020). The english patient: Evaluating local
lockdowns using real-time covid-19 & consumption data. Working Paper.
Geary, F. and Stark, T. (2016). What happened to regional inequality in b ritain in the
twentieth century? The Economic History Review, 69(1):215–228.
Glaeser, E. L. et al. (2008). Cities, agglomeration, and spatial equilibrium. Oxford
University Press.
Glover, A., Heathcote, J., Krueger, D., and Ríos-Rull, J.-V. (2020). Health versus wealth:
On the distributional effects of controlling a pandemic. NBER Working Paper.
Goolsbee, A., Luo, N. B., Nesbitt, R., and Syverson, C. (2020). Covid-19 lockdown
policies at the state and local level. Working Paper.
Goolsbee, A. and Syverson, C. (2020). Fear, lockdown, and diversion: Comparing drivers
of pandemic economic decline 2020. NBER Working Paper.
Guerrieri, V., Lorenzoni, G., Straub, L., and Werning, I. (2020). Macroeconomic
implications of covid-19: Can negative supply shocks cause demand shortages? NBER
Working Paper.
27Hacioglu, S., Känzig, D., and Surico, P. (2020). The distributional impact of the
pandemic. CEPR Discussion Paper.
Hall, R. E., Jones, C. I., and Klenow, P. J. (2020). Trading off consumption and covid-19
deaths. NBER Working Paper.
Hodbod, A., Hommes, C., Huber, S. J., and Salle, I. (2020). Is covid-19 a consumption
game changer? evidence from a large-scale multi-country survey. Covid Economics.
Horvath, A., Kay, B., and Wix, C. (2020). The covid-19 shock and consumer credit:
Evidence from credit card data. Covid Economics.
Iammarino, S., Rodríguez-Pose, A., and Storper, M. (2019). Regional inequality in
europe: evidence, theory and policy implications. Journal of economic geography,
19(2):273–298.
Jaravel, X. and O’Connell, M. (2020). High-frequency changes in shopping behaviours,
promotions, and the measurement of inflation: evidence from the great lockdown. IFS
Briefing Note.
Jones, C. J., Philippon, T., and Venkateswaran, V. (2020). Optimal mitigation policies
in a pandemic: Social distancing and working from home. NBER Working Paper.
Landais, C. and Spinnewijn, J. (2020). Introduction to the special issue:“new perspectives
on consumption measures”.
Leunig, T. and Overman, H. (2008). Spatial patterns of development and the british
housing market. Oxford Review of Economic Policy, 24(1):59–78.
Lilley, A., Lilley, M., and Rinaldi, G. (2020). Public health interventions and economic
growth: Revisiting the spanish flu evidence. Working Paper.
Ludwig, J., Duncan, G. J., Gennetian, L. A., Katz, L. F., Kessler, R. C., Kling, J. R.,
and Sanbonmatsu, L. (2013). Long-term neighborhood effects on low-income families:
Evidence from moving to opportunity. American economic review, 103(3):226–31.
Manduca, R. A. (2019). The contribution of national income inequality to regional
economic divergence. Social Forces, 98(2):622–648.
Milanovic, B. (2005). Half a World: Regional inequality in five great federations. The
World Bank.
Miles, D., Stedman, M., and Heald, A. (2020). Living with covid-19: balancing
costs against benefits in the face of the virus. National Institute Economic Review,
253:R60–R76.
O’Connell, M., de Paula, A., and Smith, K. (2020). Preparing for a pandemic: spending
dynamics and panic buying during the covid-19 first wave. IFS Briefing Note.
Overman, H. G., Gibbons, S., and Tucci, A. (2009). The case for agglomeration
economies. Technical report, Manchester Independent Economic Review.
28Sensier, M. and Devine, F. (2020). Understanding regional economic performance and
resilience in the uk: trends since the global financial crisis. National Institute Economic
Review, 253:R18–R28.
Surico, P., Känzig, D., and Hacioglu, S. (2020). Consumption in the time of covid-19:
Evidence from uk transaction data. CEPR Discussion Paper.
Toxvaerd, F. (2020). Equilibrium social distancing. Working Paper.
Wang, J. (2020). The financial impact of covid-19 in the united states. Slidepack.
Watanabe, T., Omori, Y., et al. (2020). Online consumption during the covid-19 crisis:
Evidence from japan. Covid Economics.
Zymek, R. and Jones, B. (2020). Uk regional productivity differences: an evidence review.
Report for the Industrial Strategy Council.
29You can also read


