Use of Verified Twitter Accounts During Crisis Events
←
→
Page content transcription
If your browser does not render page correctly, please read the page content below
Utah State University
DigitalCommons@USU
All Graduate Theses and Dissertations                                                                               Graduate Studies

8-2018

Use of Verified Twitter Accounts During Crisis
Events
Kai Anderson
Utah State University

Follow this and additional works at: https://digitalcommons.usu.edu/etd
     Part of the Computer Sciences Commons

Recommended Citation
Anderson, Kai, "Use of Verified Twitter Accounts During Crisis Events" (2018). All Graduate Theses and Dissertations. 7075.
https://digitalcommons.usu.edu/etd/7075

This Thesis is brought to you for free and open access by the Graduate
Studies at DigitalCommons@USU. It has been accepted for inclusion in All
Graduate Theses and Dissertations by an authorized administrator of
DigitalCommons@USU. For more information, please contact
dylan.burns@usu.edu.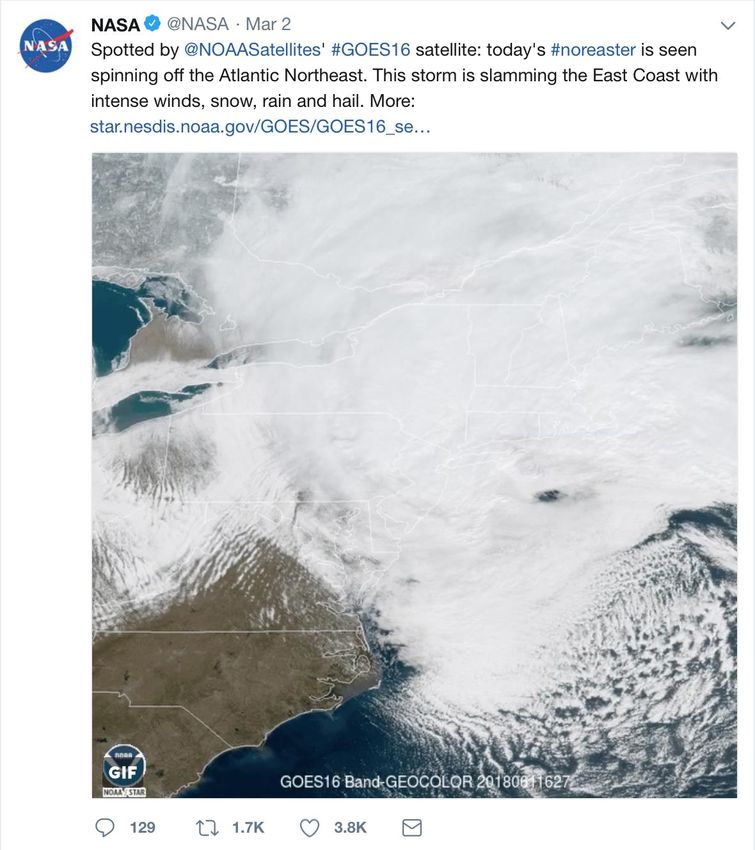
USE OF VERIFIED TWITTER ACCOUNTS DURING CRISIS EVENTS

                                       by

                                 Kai Anderson

                    A thesis submitted in partial fulfillment
                       of the requirements for the degree

                                       of

                           MASTER OF SCIENCE

                                       in

                              Computer Science

Approved:

_____________________________           _______________________________
Amanda Hughes, Ph.D.                    Vladimir Kulyukin, Ph.D.
Major Professor                         Committee Member

_____________________________           _______________________________
Xiaojun Qi, Ph.D.                       Mark R. McLellan, Ph.D.
Committee Member                        Vice President for Research and
                                        Dean of the School of Graduate Studies

                        UTAH STATE UNIVERSITY
                              Logan, Utah

                                     2018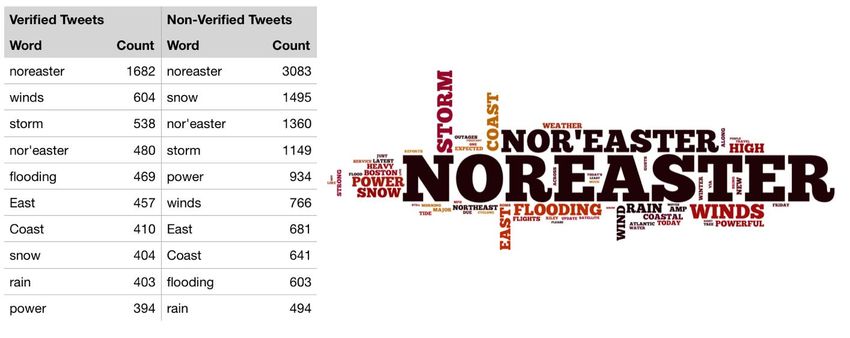
ii

Copyright © Kai Anderson 2018

     All Rights Reserved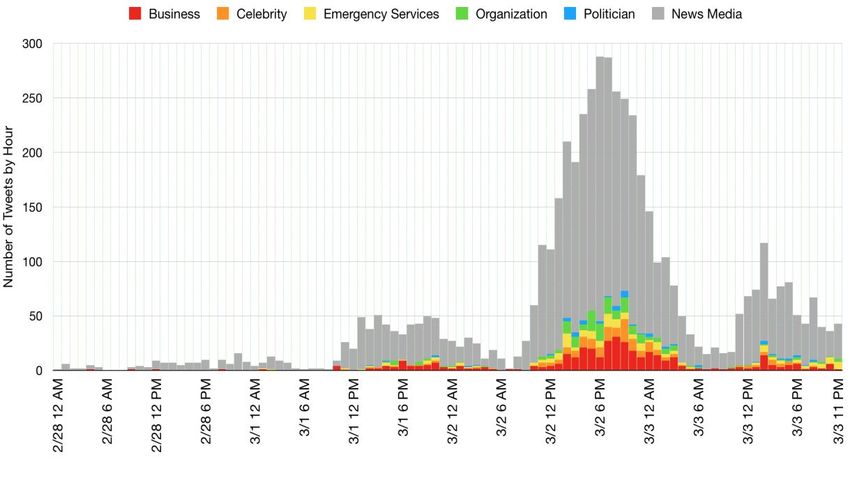
iii
                                         ABSTRACT

                  Use of Verified Twitter Accounts During Crisis Events

                                            by

                             Kai Anderson, Master of Science

                               Utah State University, 2018

Major Professor: Amanda Lee Hughes, Ph.D.
Department: Computer Science

       This thesis reports on the use of verified Twitter accounts during crisis events.

Twitter is a social media platform that allows users to broadcast and exchange public text

messages and it can be used as a communication tool during crisis events. Verified

Twitter accounts are those accounts that Twitter has investigated and found to be

genuinely maintained by the claimed owner. Celebrities, public officials, and other well-

known persons or companies often seek this account status. The owners of these accounts

are likely to provide more accurate or relevant information during a crisis event because

they represent a brand, whether themselves or an organization.

       To study the role verified Twitter accounts play in a crisis event, information was

collected from Twitter’s API (Application Programming Interface) from February 28,

2018 through March 3, 2018 during a powerful storm on the East Coast of the United

States called a Nor’easter. Through data collection and analysis, this thesis describes how

verified Twitter accounts communicated during a crisis event. Three exploratory

questions were proposed to better understand the use of verified Twitter accounts: Who

are the verified Twitter users that tweet about a crisis event? What types of information

do verified Twitter users tweet about a crisis event? When do verified Twitter users tweet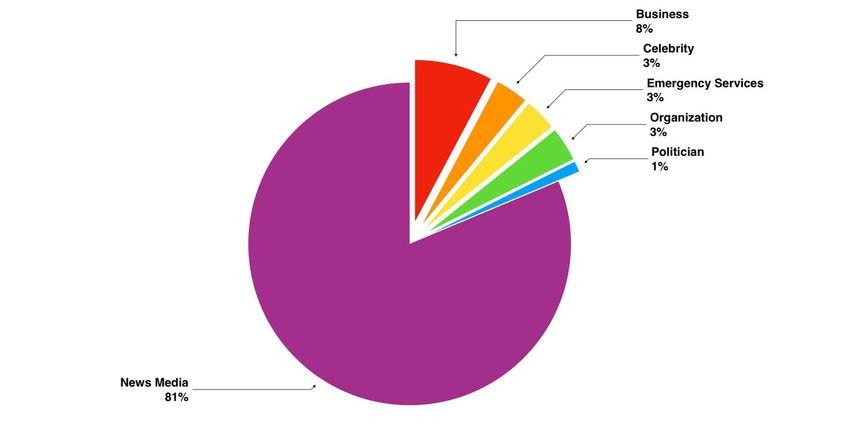
iv
about a crisis event? Results show that verified Twitter accounts create more original

messages, share more informative messages, and spread less spam than their non-verified

counterparts.
v
                                    PUBLIC ABSTRACT

                  Use of Verified Twitter Accounts During Crisis Events

                                      Kai Anderson

       This thesis reports on the use of verified Twitter accounts during crisis events.

Twitter is a social media platform that allows users to broadcast and exchange public text

messages and it can be used as a communication tool during crisis events. Verified

Twitter accounts are those accounts that Twitter has investigated and found to be

genuinely maintained by the claimed owner. Celebrities, public officials, and other well-

known persons or companies often seek this account status. The owners of these accounts

are likely to provide more accurate or relevant information during a crisis event because

they represent a brand, whether themselves or an organization.

       To study the role verified Twitter accounts play in a crisis event, information was

collected from Twitter’s API (Application Programming Interface) from February 28,

2018 through March 3, 2018 during a powerful storm on the East Coast of the United

States called a Nor’easter. Through data collection and analysis, this thesis describes how

verified Twitter accounts communicated during a crisis event. Three exploratory

questions were proposed to better understand the use of verified Twitter accounts: Who

are the verified Twitter users that tweet about a crisis event? What types of information

do verified Twitter users tweet about a crisis event? When do verified Twitter users tweet

about a crisis event? Results show that verified Twitter accounts create more original

messages, share more informative messages, and spread less spam than their non-verified

counterparts.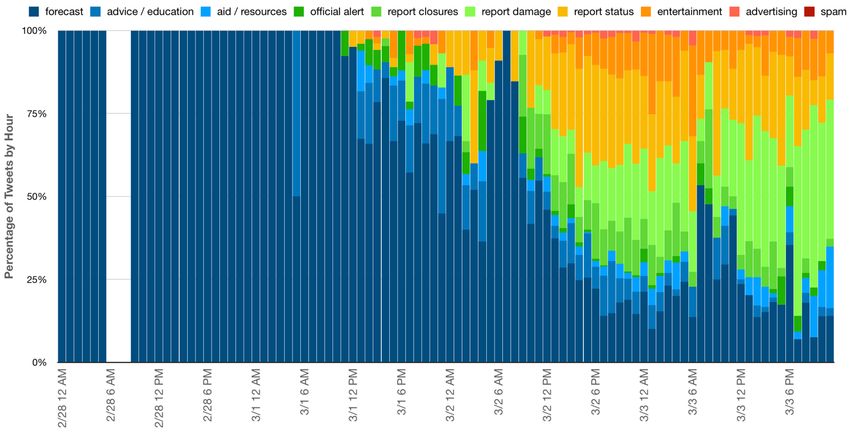
vi
                                  ACKNOWLEDGMENTS

        Firstly, all thanks go to Dr. Amanda Hughes who offered a research opportunity

into a branch of computer science, human-computer interaction, that I could be

passionate about. I am grateful for the many hours of guidance and mentorship she has

given in my behalf and the behalf of this thesis. Her knowledge and expertise were

crucial as I treaded unknown territory: human-computer interaction, research, and

writing.

        I am grateful for my committee members Dr. Vladimir Kulyukin and Dr. Xiaojun

Qi for their support, time, and trust. As well as the guidance from other staff at Utah State

University: Cora Price and Genie Hanson.

        A special thank you to Sandia National Laboratories and Cindi Reyes for helping

support my educational goals and enabling the time I spent at Utah State University.

        I am especially grateful to my family. My wife Emily for supporting me,

encouraging me, and allowing me to focus single-mindedly on my education and work.

My daughters Sophie and Annie deserve some recognition for enriching my life with

their attention.

        Thanks, and acknowledgments to all those who offered encouragement,

camaraderie, and guidance while writing this thesis.

                                                                              Kai Anderson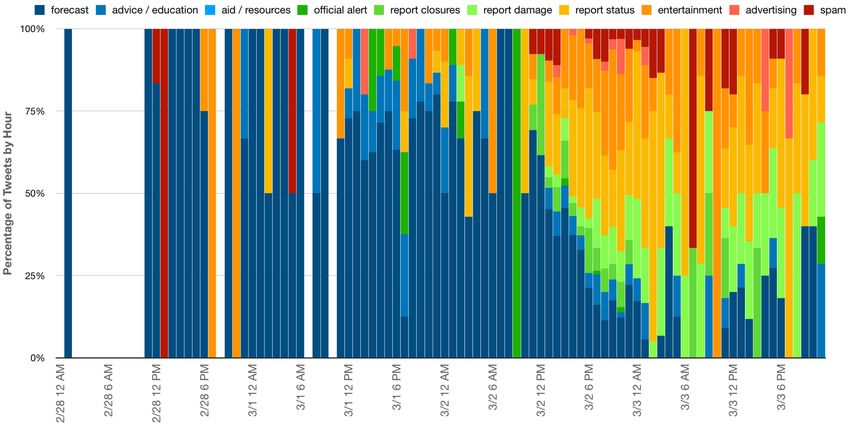
vii
                                                           CONTENTS

                                                                                                                                Page
ABSTRACT ....................................................................................................................... iii
PUBLIC ABSTRACT ..........................................................................................................v
ACKNOWLEDGMENTS ................................................................................................. vi
LIST OF FIGURES ........................................................................................................... ix
CHAPTER
          I. INTRODUCTION ...............................................................................................1
              1.1        Research Questions ................................................................................. 2
              1.2        Research Overview ................................................................................. 2
              1.3        Thesis Overview ..................................................................................... 3
          II. LITERATURE REVIEW ....................................................................................4
              2.1        Crisis Informatics .................................................................................... 4
              2.2        Twitter ..................................................................................................... 4
              2.3        Collecting Crisis Event Communication ................................................ 6
              2.4        Classifying Data ...................................................................................... 6
              2.5        Sentiment Analysis.................................................................................. 7
              2.6        Verified Twitter Accounts ....................................................................... 8
          III. METHODOLOGY ..........................................................................................10
              3.1        Crisis Event of Study: A Nor’easter Storm .......................................... 10
              3.2        Data Collection ..................................................................................... 12
              3.3        Data Analysis ........................................................................................ 14
              3.4        User Categorization .............................................................................. 14
              3.5        Tweet Topic Categorization .................................................................. 14
          IV. DATA ANALYSIS AND RESULTS ................................................................16
              4.1        Who Are The Verified Twitter Users That Tweet About a Crisis
                         Event? ................................................................................................... 16
                  4.1.1      Account Type Categories .................................................................. 16
                  4.1.2      Activity by Account Type ................................................................... 17
                  4.1.3      Account Type Observations .............................................................. 18
              4.2        What Types of Information Do Verified Twitter Users Tweet About a
                         Crisis Event? ......................................................................................... 22
                  4.2.1      Tweet Topic Categories ..................................................................... 22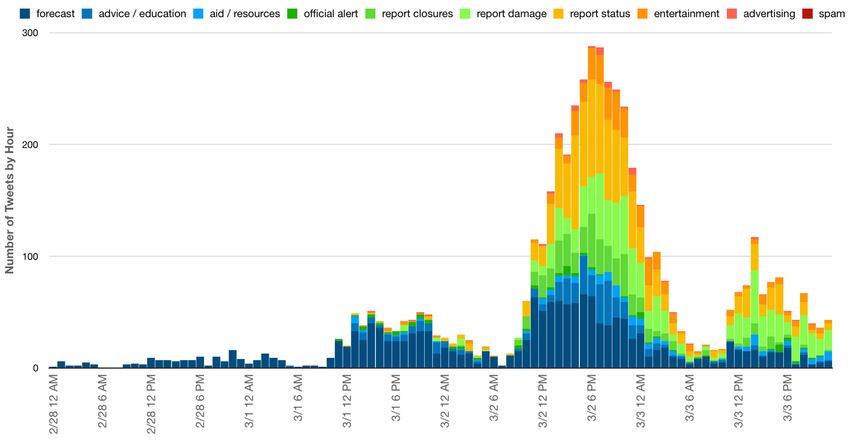
viii
                 4.2.2      Non-verified Account Activity .......................................................... 24
                 4.2.3      Tweet Topic Statistics ........................................................................ 25
                 4.2.4      How Informative is a Topic and Tweet? ........................................... 25
                 4.2.5      Word Count Analysis ......................................................................... 27
                 4.2.6      Retweet Rates and Their Effect on Analysis ..................................... 28
                 4.2.7      Sentiment Analysis Results................................................................ 28
              4.3       When Do Verified Twitter Users Tweet About a Crisis event? ............. 31
                 4.3.1      User Categories Timeline ................................................................. 31
                 4.3.2      Tweet Topic Timelines ....................................................................... 32
          V. CONCLUSIONS ...............................................................................................36
              5.1       Thesis Summary.................................................................................... 36
              5.2       Limitations ............................................................................................ 36
              5.3       Future Work .......................................................................................... 37
                 5.3.1      Further Analysis on Nor’easter Data Collected ............................... 38
                 5.3.2      Analysis on Other Crisis Event Types ............................................... 39
REFERENCES ..................................................................................................................40
APPENDICES ...................................................................................................................44
          APPENDIX A: Verified User Category Activity Timelines ................................. 45
          APPENDIX B: Topic Category Activity Timelines .............................................. 47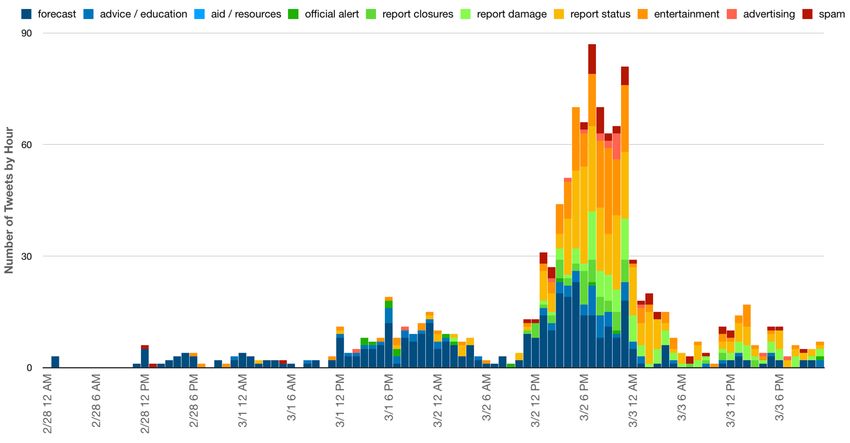
ix
                                             LIST OF FIGURES

Figure                                                                                                       Page
    1     Satellite Image Of The Nor'easter On March 2, 2018 [11]. ................................11
    2     Format Of Twitter API JSON............................................................................. 12
    3     Verified User Account Categories And Statistics ............................................... 17
    4     Number Of Tweets By Account Category ......................................................... 18
    5     Percentage Of Verified Tweets By Category ..................................................... 19
    6     Total Collection Percentages (76,093 Tweets) ................................................... 19
    7     The Most Retweeted Nor'easter Tweet .............................................................. 21
    8     Tweet Topic Categories And Statistics ............................................................... 23
    9     Tweet Topic Percentages By Verified Status...................................................... 24
    10 Verified Vs. Non-Verified Informative Topics Timeline.................................... 26
    11 Tweet Word Count Comparison With Verified Tweet Word Cloud ................... 27
    12 Tweet Polarity And Subjectivity By Topic (Verified) ........................................ 29
    13 Tweet Polarity And Subjectivity By Account Categories (Verified).................. 30
    14 Account Category Activity By Hour .................................................................. 31
    15 Tweet Topic Activity By Hour (Verified)........................................................... 33
    16 Tweet Topic Activity By Hour (Non-Verified) .................................................. 34
    17    Percentage Of Tweet Topic By Hour (Verified) ................................................. 34
    18    Percentage Of Tweet Topic By Hour (Non-Verified) ........................................ 35
CHAPTER 1
INTRODUCTION
Social media have become a growing communication venue in everyday life as
well as during crisis events [1]. For example, Twitter had 200 million messages (tweets) a
day in 2011 [2] and an estimated 500 million messages (tweets) a day in 2017 [3]. During
a crisis event, Twitter often sees topics trending around the event (e.g., messages that
contain relevant hashtags like #hurricane #harvey). Social media can support a crisis -
event response by improving situational awareness and facilitating community or group
communication [4], [5]. However, the proliferation of social media content during a crisis
event also poses the challenge of information overload. With so much data, how can
crisis response groups or affected users find relevant and reliable information from social
media? One method for sifting through this data is to reduce the volume to more
manageable levels by focusing on content from particular types of users [6].
This research is exploratory and investigates the use of verified Twitter accounts
during crisis events. Verified Twitter accounts are those accounts that Twitter has
investigated and found to be genuinely maintained by the claimed owner. Celebrities,
public officials, and other well-known persons or companies often seek this account
status so that others know messages are really coming from them and not a fake account.
Because their owners have high public visibility, verified accounts attract more attention
from Twitter users which typically leads to a larger number of followers. In short, verified
users seem to have more voice on Twitter because on average their tweets reach a much2
larger audience than a non-verified account. The owners of these accounts may also
have greater accountability to provide accurate or relevant information because they
represent a brand, whether themselves or an organization. Thus, verified Twitter accounts
would seem to be sources of information that have high visibility and influence as well as
sources that are perhaps more trustworthy. For these reasons, this thesis aims to
understand the use of verified Twitter accounts surrounding crisis events.
1.1 Research Questions
To better understand the use and influence of verified Twitter accounts during
crisis events, we address several exploratory research questions:
1. Who are the verified Twitter users that tweet about a crisis event?
2. What types of information do verified Twitter users tweet about a crisis
event?
3. When do verified Twitter users tweet about a crisis event?
Answering these questions will help us better understand who these verified Twitter users
are and what kinds of information they share during a crisis event. In turn, a better
understanding of the activity of verified Twitter users will help us to better assess the
usefulness of verified Twitter user activity during a crisis event.
1.2 Research Overview
To study the role verified Twitter accounts play in a crisis event, we used the
Twitter API (Application Programming Interface) to collect tweet data about a crisis
event. The event for observation was a storm that hit the East Coast of the United States
on March 1st through March 3rd, 2018. After the information was collected, the types of3
verified Twitter accounts that posted during the event were classified and analyzed. The
tweets from the verified accounts were also classified and analyzed. Our goal was to
collect the most relevant information and data possible on the use of verified Twitter
accounts social media activity during crisis events. The research is exploratory in nature
and as such the research questions are broad to give an overview of verified account
behavior. The terms account and user are both used to represent the Twitter account and
its screen name, throughout this thesis.
1.3 Thesis Overview
This thesis document contains four additional chapters following this
introduction. Chapter 2 contains the literature review and background information needed
to understand the research. Chapter 3 details the data collection method and includes the
resulting data for analysis. Chapter 4 answers the research questions and displays the
results obtained from the analysis. Chapter 5 concludes the thesis with a summary,
limitations of the research, and possibilities for future work.4
CHAPTER 2
LITERATURE REVIEW ,
Literature guiding this thesis research plan as well as literature providing insight
into the current spectrum of crisis informatics are detailed in this chapter.
2.1 Crisis Informatics
Social media impact disaster and crisis response because they facilitate
communication and information exchange between communities, groups, and individuals
[1]. The research field of crisis informatics has recently emerged to study how people use
information communication technologies (ICTs) like social media during crisis events
[7]. The field of crisis informatics began in the early 2000’s when Internet use became
more commonplace. Through blogs, websites, and eventually social media (e.g.,
Facebook, Flickr, Twitter, etc.) individuals and groups could communicate during crisis
events [8]–[10]. Research shows that using crisis generated social media information can
improve disaster response and recovery efforts [11], [12].
2.2 Twitter
Twitter is a large network for connecting with millions of people simultaneously
which can have a profound impact on communication during crisis or natural disaster.
Users can connect by “following” other users or through trending topics (e.g. SuperBowl
or #flooding). Because of the high volume of tweets, around 500,000,000 a day in 20175
[3], analyzing the information has proven difficult. Research into digesting large data
sets from Twitter is ongoing [13]–[15].
Twitter regularly publishes blogs on topics such as crisis informatics, Twitter’s
growth, and the use of Twitter during popular cultural events. From the official twitter
blog, Twitter teamed up with Oxfam India for a crisis informatics conference:
“While natural disasters can undoubtedly cause widespread humanitarian havoc,
a lot can be done for the victims - even from outside the crisis zone. Through the
#TweetToTransform initiative, Oxfam India’s targeted collaboration with Twitter
is designed specifically to highlight best practices in disaster management and
public communication” [16].
The blog states that using Twitter during crisis events is effective because Twitter is a
robust communication network that can mobilize people in real-time. Mahima Kaul,
Twitter India’s Head of Public Policy stated,
“We saw an incredibly powerful example of this (Twitter’s ability to assist crisis
response) during the Tsunami in Japan in 2011, when Twitter users shared
countless Tweets about the scope of the impact zone, updates about the safety of
friends and family, and conversed moment-by-moment on the status of the disaster
as it unfolded.”
Connecting users during a crisis event is perhaps the most difficult problem when
leveraging Social Media for communication. One solution is to follow a hashtag which
allows users to see other’s public posts relating to a particular topic, which could then
lead people to collaborate and communicate about that topic.6
2.3 Collecting Crisis Event Communication
To understand the use of Twitter and verified accounts during a crisis event, data
needs to be collected from a real event. Twitter data collection is done through an API
(Application Programming Interface) that queries Twitter based on keywords, location,
user, etc. However, finding relevant data can be difficult because of the volume of tweets.
Research shows crisis responders are better able to collect relevant data if they
view users as stakeholders that are interested in the crisis event and connect with
proactive users making reports [17]. For example, vocal Twitter volunteers willing to
report, vet, and pass on important information could use the keyword “#help” in the tweet
text to connect their crisis event with crisis responders. These “Digital Volunteers”
emerge during crisis events through a desire to help and a desire to inform the community
of a crisis event and its details [18]–[20]. In this regard, each Twitter user is a potential
worker in a large distributed data problem where the act of vetting data and reporting
comes from the verified user’s desire to do good. This type of digital volunteering is
similar to the phenomenon that a witness to an accident will call emergency services.
Gaining insights into the use of verified accounts may also show some useful trends in
crisis data reporting and collecting.
2.4 Classifying Data
Classifying data will assist in understanding the use and context of tweets from
verified Twitter accounts. Previous research discusses the automatic classification of
tweets as an ongoing area of research within the space of crisis informatics and machine
learning [15]. One study of the 2010 Haiti earthquake shows how automatic text7
classification has several obstacles that makes it difficult to correctly classify and pass
along text data, like tweets [21]. The issues reside in the fact that the text is short (tweets
can be 140 characters or in the United States as of November 2017 - 280 characters [22]),
topics from gathered messages can often be unrelated, and contextual information may be
missing. Training the algorithms that handle data classification is difficult; information
gathered may be small and variation in crisis events may make an algorithm less effective
for all events [21]. Understanding the use of verified Twitter accounts may assist in
improving the machine learning process of automatic tweet classification by improving
the data relevance.
2.5 Sentiment Analysis
Sentiment analysis is another tool for understanding Twitter data. Sentiment
analysis is the computational analysis and categorization of opinions expressed in a piece
of text. A common categorization might include positive, negative, or neutral words
towards a topic [23]. Sentiment analysis has also been used to understand customer
perception of a product, predict financial performance, understand election outcomes, and
as input for disaster response systems [24]. For example, in 2015 researchers used
sentiment analysis during the MERS (Middle East Respiratory Syndrome) outbreak in
South Korea to successfully record fear, sadness, disgust, happiness, surprise, and anger
in tweets about the outbreak and map it over time [25]. The result gave confidence in
analyzing public opinion through sentiment analysis.8
2.6 Verified Twitter Accounts
Collecting relevant data more efficiently and understanding crisis event
communication led to our research around the behavior of verified users during crisis
events. Motivated by the verified status of the account, tweets may contain more relevant
crisis data that is vetted by the verified account holder.
Twitter’s website states the following about verified Twitter accounts:
“An account may be verified if it is determined to be an account of public interest.
Typically, this includes accounts maintained by users in music, acting, fashion,
government, politics, religion, journalism, media, sports, business, and other key
interest areas. A verified badge does not imply an endorsement by Twitter.”
To identify a verified Twitter account a blue badge will be displayed by tweets from the
account and the Twitter API includes a field indicating the verified status.
Verified Twitter accounts have value because it is not possible to simply create a
verified account. The effort to obtain a verified Twitter account has changed over time
and is at the discretion of Twitter. At the time of writing this thesis, the ability to request
verified status through an online form has been removed, although account verification is
still possible when Twitter proactively sees activity that deems it necessary to provide a
verified account [26]. Verified accounts also have a set of rules (terms of service) that is
strictly enforced because of the representative nature of the accounts. An infraction
against the terms of service from a verified account will result in the loss of the account
or the verified status of the account [27].
Previous research into finding reliable information on Twitter found that that users
with many previous messages, a large number of re-tweets, and a bio that is attached to9 the account are more likely to share reliable information [28]. Those qualities, while not only found in verified accounts, are manifest often in verified Twitter accounts.
10
                                       CHAPTER 3

                                    METHODOLOGY ,

       This chapter describes the methodology used to address the research questions in

this study. First, we identified a crisis event for data collection: a large Nor’easter winter

storm. Next, tweets about the storm event were collected using the Twitter streaming and

search APIs. Analysis began by coding the content of the collected tweets and

categorizing the verified account users who sent tweets during the Nor’easter. The

following sections provide more detail about the methods we used to collect and analyze

our research data.

3.1   Crisis Event of Study: A Nor’easter Storm

       Crisis events vary in duration, area, severity, and number of affected people.

When looking for a crisis event to study, we searched for an event that would generate

significant activity on Twitter (but not too much) so that we would have a large enough

data sample to study. We chose to collect Twitter data during the Nor’easter storm that hit

the north-eastern United States on March 1st, 2018 (see Figure 1 for an image of the

storm). A Nor’easter is a storm on the eastern coast of the United States named for the

wind that comes from the northeast [29]. Some well-known Nor’easters include the

Blizzard of 1888, the “Ash Wednesday” storm of March 1962, the New England Blizzard

of February 1978, the March 1993 “Superstorm,” and the recent Boston snowstorms of

January and February 2015. Past Nor’easters have been responsible for billions of dollars

in damage, disruption of services, and serious coastal flooding. From March 1st until its
11
rd
dissipation on March 3 , this Nor’easter caused over 2 million people to lose power,
thousands of cancelled flights and trains, school closures, at least eight deaths, and
coastal flooding [30]. Most of the storm damage was caused by flooding on the coast at
high tide, 90+ MPH wind gusts, and up to 39” of snow [31].
Figure 1 - Satellite image of the Nor'easter on March 2, 2018 [32].
The Nor’easter caused a worldwide trending hashtag (#noreaster) on Twitter from
late on February 28th, 2018 until March 4th, 2018 (leading up to and during the course of
the storm) [33]. To collect data on the event, some initial searching on Twitter was
required to find keywords, hashtags, and location data. This Nor’easter was beyond the
scope of Twitter’s location-based search API, which is limited to a 25-mile radius. Thus,
we relied on keyword and hashtag searches. The total area hit by the storm included
Canada’s East Coast, Connecticut, Delaware, Maine, Maryland, Massachusetts, New12
Jersey, New York, Pennsylvania, Rhode Island, Virginia, and Washington D.C.; the
storm affected a total of 80 million residents [34].
3.2 Data Collection
Twitter’s API gives a user the ability to search for tweets based on location, time,
user ID, keyword, etc. The result of the call includes the date, tweet text, user info,
location, hashtags, URLs, verified status, etc. The structure shown below in Figure 2 is
the resulting JSON object from a Twitter API query.
Figure 2 - Format of Twitter API JSON.13
Once the crisis event characteristics (location, keywords, etc.) were understood
the collection of data could begin. Data collection was completed with two Python scripts
that directly queried the Twitter API. The first script made calls to the Twitter Search API
and returned search results from past Twitter data. For example, making a query with the
term “noreaster” returned tweets about the recent Nor’easter storm. The Twitter Search
API is not an exhaustive source of tweets. A limitation to the Twitter Search API is that it
only returns tweets sent in the last week when searching by location or keyword
(searching for a specific user’s tweets allows a much longer history). Promptness when
running the search script gave us results from February 25th until after the storm had
dispersed.
The second script collected newly generated tweets using Twitter’s Streaming
API, which collected real-time Twitter data using the same types of queries as the Search
API (i.e., searching by location, keyword, hashtag, user ID, etc.). The API works by
establishing a connection to the Twitter service, making a long-lived HTTP request and
parsing the response incrementally. The response to the HTTP request is near real-time
tweets that have been filtered according to the request parameters [22]. Results from the
streaming API made the total data collection from Feb 25th through March 14th. To ensure
thorough data collection, multiple search queries were executed and the data set is robust
under the limitations the Twitter service imposes.
Leading up to the storm and throughout the duration of the storm, the scripts
using Twitter’s API returned 76,093 tweets discussing the Nor’easter or including the
hashtag “#noreaster.” Tweets from verified users numbered 5,123 in the same period,
comprising 6.7% of the returned results.14
3.3 Data Analysis
Once the data collection was complete, analysis of the results began. We
addressed the research questions through categorizing tweets, automated sentiment
analysis, investigating the type of account the verified user represents, and plotting the
results. These steps are described in more detail below. Results will follow in chapter 4.
3.4 User Categorization
Verified accounts represent a person, company, or organization. To better
understand the research question of “Who are the verified Twitter users that tweet about a
crisis event?”, each user was examined and sorted into categories. The verified users
were categorized by the description given on the account (i.e., CEO of Microsoft, news
anchor, comedian, journalist, etc.). If verified users could not be categorized through their
account description, we looked at their tweet history and/or searched the internet by their
account name to understand the type of person or organization each account represents.
Categories evolved inductively as the users were identified and sorted into groups (e.g.,
news media, celebrity, business, etc.) using content analysis and grounded theory
techniques [35], [36]. The results of this analysis are reported in section 4.1.
3.5 Tweet Topic Categorization
Next, we examined the content of the messages sent by verified accounts to
answer the following question: What types of information do verified Twitter users tweet
about a crisis event? After reading each of the verified account tweets, categories were
derived inductively. The categories evolved as we iteratively revisited our coding scheme.15
Categories coded included forecasts, entertainment, offers of aid, offers of advice,
reporting damage or closures, etc. This categorization of the tweet content let us examine
what types of information verified accounts share to address our research questions.
Using this data and methodology allowed us to compare the types of information sent by
different kinds of verified accounts. Insights from our analysis may indicate the
importance of following verified Twitter accounts during a crisis event.
Another method we used for understanding the content of what verified accounts
tweet is sentiment analysis. To analyze these tweets, we used the TextBlob python library
for Natural Language Processing which includes sentiment analysis using the NLTK
(Natural Language Toolkit) language data and corpus [37]. More details on sentiment
analysis is included in the Literature Review.
Tweet topic categorization is reported and analyzed in section 4.2. Additionally,
we also compared verified account activity with a sample of non-verified account activity
to understand how verified accounts differ or do not differ from non-verified accounts.
This analysis examines differences in tweet topics, how informative tweets are, sentiment
analysis, and word count.16
CHAPTER 4
DATA ANALYSIS AND RESULTS ,
The following chapter answers the research questions based on the results of the
data analysis. Each section includes the original research question, data relevant to the
question (both verified and non-verified tweets), descriptions of the data, observations
relating to the question proposed, and conclusions.
4.1 Who Are The Verified Twitter Users That Tweet About a Crisis Event?
Once categorization was complete we looked to better understand the types of
verified Twitter accounts that tweeted during the Nor’easter. Patterns emerged from the
data and groups logically formed based on the account biography and description.
Because the collection was reviewed in chronological order, the first accounts to appear
were news media accounts (e.g., news publications, anchors, journalists, and
meteorologists). Shortly afterwards, other account types began to appear, starting with
emergency services (fire and police departments) and then followed by businesses.
Timelines of the Twitter activity of all account types involved are included in Appendix A
and detailed later in section 4.3.
4.1.1 Account Type Categories
Account types were narrowed down to six distinct categories with defined
characteristics. The category descriptions, number of accounts per category, and
examples can be found in Figure 3 below.17
Figure 3 - Verified User Account Categories and Statistics
4.1.2 Activity by Account Type
Results show that news media accounts made up the majority of verified accounts
tweeting about the crisis event. The total number of tweets per category will differ from
the number of accounts per category because accounts have varying activity levels. For
example, @NBCNewYork (a news media publication) tweeted the most about the
Nor’easter with a total of 65 tweets between February 28, 2018 and March 3, 2018. The
total number of tweets from each category is detailed in the following figure.18
Figure 4 - Number of Tweets by Account Category
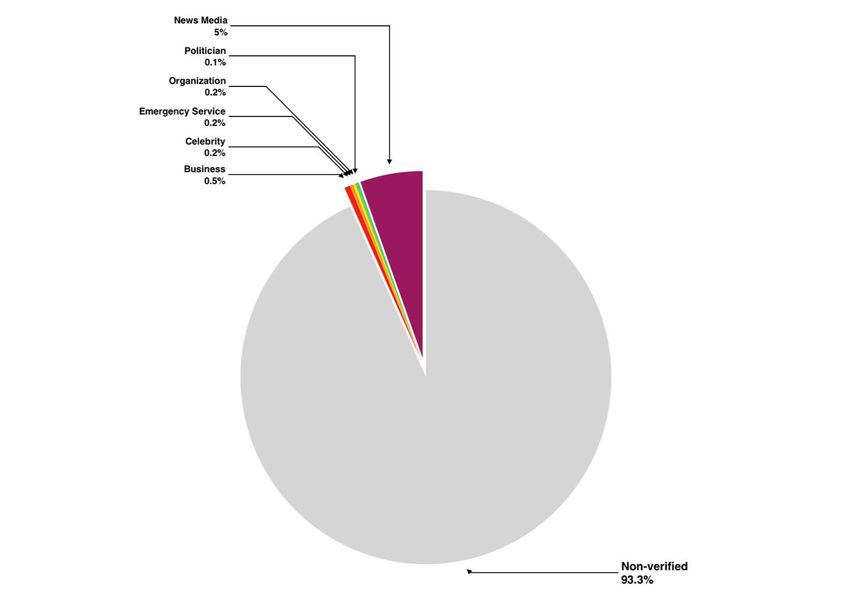
From February 28, 2018 through March 3, 2018, verified Twitter accounts
tweeted about the Nor’easter 5,121 times and 4,165 of those tweets were from accounts
representing news media. When looking at who is tweeting during the Nor’easter, it is
also interesting to look at all the tweets that were collected, not just tweets from verified
accounts. With this perspective, Figure 5 below shows the percentage of each category
compared with all verified tweets. Figure 6 includes all non-verified tweets (70,972) to
help visualize the data set we are interested in compared with the entire data collection
results.
4.1.3 Account Type Observations
When research began, we expected a larger number of celebrities and official
representative accounts like politicians to be tweeting during a crisis event. We expected
news media accounts, but we did not expect the amount of activity or number of accounts
involved with this category. In hindsight, one might expect that news media accounts
would play a significant role in distributing information during a crisis event. Forecasts
began appearing first in conjunction with the possible Nor’easter several days before the
event and these forecasts came almost exclusively from news media accounts.19 Figure 5 - Percentage of Verified Tweets by Category Figure 6 - Total Collection Percentages (76,093 Tweets)
20
       When determining who was tweeting during the event, it became evident that

some accounts almost always retweeted messages (a Twitter feature allowing a user to

share another user’s original content) and rarely provided original content. To understand

this further, we looked at the retweet rates provided by the Twitter API. The field

‘retweets’ in the JSON tweet data gives the number of times the original message was

retweeted. To enhance our view of retweets for visualizing an account’s reach or

visibility on Twitter we instead looked at only the retweet value of original tweets. We

call this value organic retweets. All original tweets (non-retweeted) were analyzed for an

organic retweet value. All verified tweets returned an average organic retweet number of

21.9, meaning every original tweet was retweeted an average of nearly 22 times.

Contrasted with the non-verified organic retweet rate of 0.65.

       The most retweeted message during the crisis event is shown in Figure 7. @NASA

has a total of 28.9 million followers and created the most frequently retweeted tweets.

Other notable retweet statistics showed that organizations and politicians held the most

frequent organic retweet rate among verified accounts with around 32 retweets per

message.

      @nytimes has the highest number of followers totaling 41 million at the time of

data collection. Among verified accounts in our collection, the average number of

followers is 257,348 compared to an average of 3,457 followers for non-verified

accounts. Thus, the average verified user has 74 times as many followers as a non-

verified user. Insight into verified accounts and statistics of those users helps justify

research into this subset of Twitter users. While making up only 6.7% of tweets on the

Nor’easter, tweets from verified users on the Nor’easter are seen 500% more than the
21
non-verified Nor’easter tweets. Further analysis is included in section 4.3 where user
types are analyzed on a timeline.
Figure 7 - The Most Retweeted Nor'easter Tweet22
4.2 What Types of Information Do Verified Twitter Users Tweet About a Crisis
Event?
The content of the tweets we collected were coded in the same way that user
account categories were coded. Topic categories formed inductively as we read tweets.
Themes emerged and we formed similar groupings as the coding scheme and categories
were revisited. Forecast, a topic category, formed from weather warnings, predicted
measurements, and general forecasts was combined into forecast as it became evident
that topics would not require so much granularity.
4.2.1 Tweet Topic Categories
Figure 8 details the eventual topics that tweets were categorized into and
descriptions with examples. For this crisis event, verified accounts began by tweeting
weather forecasts and warnings. Because weather forecasters could predict the storm
would happen a few days in advance, it is not surprising that the initial tweets were
forecasts and weather warnings. Another crisis event (e.g. fire or earthquake) would
likely begin with a different topic being tweeted first.
The following tweet was the first recorded in the timeframe by a verified account:
@NBCNewYork (Feb. 28 1:15 AM): A powerful nor'easter is expected to hit the tri-states
toward the end of the week. Here's what you can expect and when:
With the following reply from a non-verified user:
@Rebecca_Lambo: @NBCNewYork What the hell is a nor’easter I ain’t got time for this #no23 Figure 8 - Tweet Topic Categories and Statistics
24
4.2.2   Non-verified Account Activity

        To best understand what verified users are tweeting about during a crisis event we

need to also consider what non-verified accounts are tweeting during and about the crisis

event. This contrast gave insight into the usefulness of following a verified source for

crisis event information. To make a comparison, we sampled non-verified tweets at the

same rate verified accounts were tweeting (e.g. 2.7% from 2/28, 12.2% from 3/1, etc.).

The total sample of non-verified tweets that we categorized by topic was 1,168 (25% of

the total volume of verified Tweets). Below we compare the rates by topic over the entire

data collection.

                   Figure 9 - Tweet Topic Percentages by Verified Status
25
4.2.3 Tweet Topic Statistics
By looking closely at the data obtained from the Nor’easter data collection,
several trends are observable. The most obvious difference in the data sets of verified vs
non-verified tweets is the rate of spam. It should be noted that advertising and spam are
two closely related categories but differ in a distinct way. Advertising is a business (or
other user type) opportunistically using the storm to move a product or service. We found
that advertising remained relevant to the storm. For example, “here is how our service
can benefit you in this Nor’easter.” Spam is the use of a trending topic, like the
Nor’easter, to push another agenda. The example given in Figure 8 above shows off-topic
tweets given more views by including the trending Nor’easter. Spam was nonexistent in
all 5,123 tweets from verified accounts.
Forecasts received the most attention and reporting a status was the second most
tweeted topic. Advice, aid, official alerts, reporting closures, and reporting damage all
were tweeted at higher rates by verified Accounts than the non-verified Tweet data we
collected.
4.2.4 How informative is a topic and tweet?
In Figure 9 (above) the topics loosely move from informative topics on the left
moving to less informative on the right. This is not a scientific measurement of
usefulness but an observation based on using the Nor’easter subject to share information:
Is the tweet about the Nor’easter? Is it spreading useful information like what to expect
during the event? Does it provide aid or resources? The three topics on the right are found
to be the least informative: entertainment, advertising, and spam. To visualize this26
method of categorization beyond the comparisons in Figure 9 we have grouped the non-
informative topics and informative topics on a timeline in Figure 10.
Informative topics: forecast, advice/education, aid/resources, official alert, report
closures, report damage, and report status.
Not informative topics: entertainment, advertising, and spam.
Figure 10 - Verified vs. Non-verified Informative Topics Timeline27
Looking closely at Figure 10’s two graphs, verified tweets have a trend of almost
all informative topics up until the storm is in force on March 2nd. One explanation for the
drop in informative tweets is the rise of entertaining stories about the storm. Two
examples include some highly-shared images of broken umbrellas in the streets and a
story where an airline pilot is quoted, “pretty much everyone on the plane threw up”,
reported in the early morning on March 2nd. The trends show that verified Twitter
accounts are found to stay informative more consistently and more often than their non-
verified counterparts.
4.2.5 Word Count Analysis
Word count analysis was done on verified and non-verified tweets about the
Nor’easter. The figure below shows the top ten words used for both data sets.
Figure 11 - Tweet Word Count Comparison with Verified Tweet Word Cloud
Both groups have identical top ten used words (although ordered differently).
After filtering words common to sentence structure, we were given a list of the most
counted words in our collection timeframe from both verified and non-verified accounts.28
The popularity and use of similar words by both groups caused us to consider reasons
why that might be the case. First, all the words in the top ten are status descriptions,
adjectives of the Nor’easter, and locations which would likely span all users tweeting
about the storm. The second observation on similar word count rates comes from looking
at retweet rates as was done in section 4.1.
4.2.6 Retweet Rates and Their Effect on Analysis
To understand what may be happening, we look at the rates of original content
(what percentage of tweets are original versus retweets). The rate of original content
among our data set is 62% original content among verified accounts and 37% among
non-verified accounts. That is a significant difference showing that non-verified accounts
are not tweeting original content as often as verified accounts. For example, @NASA’s
most retweeted storm tweet had 1,710 retweets where only 42 of those retweets were by
verified accounts in our collection and 1,456 were non-verified tweets in our collection
(the other 200+ coming after data collection was over). This is one example of why there
is so much overlap in common words, trending tweets that are often retweeted will span
both verified users and non-verified users.
4.2.7 Sentiment Analysis Results
Finally, we look at sentiment analysis of Nor’easter tweets. Sentiment analysis,
described in section 2.5 and section 3.5, uses a polarity score (between negative at -1.0
and positive at 1.0) of each tweet based on the entire tweet which shows emotions:
positive, negative, or neutral. The second measure of sentiment is a subjectivity score: 029
means least subjective and 1.0 means most subjective. Subjectivity is the amount of
opinion expressed in the tweet in the form of feelings, views, or beliefs.
Figure 12 – Tweet Polarity and Subjectivity by Topic (Verified)
Based on Figure 12 and Figure 13 we can make several observations. Figure 12
shows polarity by tweet topic and the values do not differ much. Polarity for reporting
damage, reporting closures, or official alerts are the lowest but all categories have an
overall positive sentiment. Subjectivity among topics (also Figure 12) is very similar
across all topics but with below average in reporting closures and advertising. It is
difficult to make assumptions on causes and results based on this closely related data set.
Although statements of facts in reporting damage, reporting closures, and official alerts
do show a more neutral emotion which matches expectations based on topic categories.30
Figure 13 - Tweet Polarity and Subjectivity by Account Categories (Verified)
Figure 13 shows polarity and subjectivity across account type categories.
Emergency services have the most positive tweets perhaps due to the aid nature of the
account’s tweets. Celebrities have the most negative tweets but all accounts still have an
overall positive sentiment. Subjectivity across account types is nearly identical.
The overall sentiment score for both verified and non-verified tweets is positive:
verified at 0.07 and non-verified at 0.06. It should also be noted that all accounts
contained at least one (-1.0) sentiment score except emergency services which only went
to (-0.33). The same can be observed in topic sentiment scores. All topics had at least one
minimum score of (-1.0) except aid / resources with a low of (-0.43). This further shows
that sentiment scores are less negative for emergency services and aid / resources.31
4.3 When Do Verified Twitter Users Tweet About a Crisis Event?
As stated above, tweets about the Nor’easter began on February 28, 2018 and
continued until the end of the storm on March 3rd. We have considered the accounts that
made up verified tweets as well as the topics that were tweeted from those accounts for
timeline visualization. To continue our understanding of the event and the role verified
accounts have in crisis informatics, we will look at the data spread over the course of the
storm.
4.3.1 User Categories Timeline
The number of tweets sent by each verified account type categories are compiled
by hour over the course of the storm in the figure below.
Figure 14 - Account Category Activity by Hour32
The timeline of tweet activity in Figure 14, Figure 15, and Figure 16 is useful for
visualizing the crisis event. There are several aspects of these figures worth noting. First,
the timeline is mapped with a y-axis of number of tweets by hour which shows the true
Twitter activity levels leading up to and during the storm (about the Nor’easter). The
number of tweets sent is significantly more on March 2nd. The Nor’easter’s low pressure
that caused the most damage and storm activity formed on the night of March 1st and
peaked late in the day of March 2nd.
As discussed in section 4.1, the news media account types acted first to raise
awareness of the oncoming storm. It wasn’t until the storm was active that other account
types began tweeting in significant numbers. Looking at politician accounts we see their
activity comes in the middle of the storm, perhaps reacting to constituents’ needs or
issuing official alerts as seen in section 4.2. Graphs showing individual categories over
time are included in the appendix to this thesis. While emergency services and politicians
did tweet on March 1, by March 2 it was at a much higher rate. All timeline analysis
shows drops in activity levels at night and activity levels increase again in the day time.
4.3.2 Tweet Topic Timelines
The number of tweets sent by topic are compiled by hour over the course of the
storm in the figure below as a stacked bar chart. Both verified (Figure 15) and non-
verified (Figure 16) accounts are represented. Figure 17 and Figure 18 show the same
data as Figure 15 and Figure 16 but in a percentage of topic by hour, instead of the
number of tweets. This is also a useful comparison for visualizing topics over the course
of the storm.33
Figure 15 shows Twitter traffic by verified users surrounding the Nor’easter by
topic. It shows the initial surge of forecasts, followed by various types of status updates
(damages, closures, and other statuses) during the strongest part of the storm on March
2nd. Just like what was shown in Figure 10, the informative tweets are consistent leading
up to the storm when more entertainment and advertisements begin. Figure 17 shows the
data from Figure 15 but in percentages. Each column represents one hour and the
percentages of tweet topics tweeted in that hour. Figure 16 and Figure 18 are identical
representations but the data comes from non-verified accounts. There are less informative
tweets coming from non-verified accounts and the timeline is more chaotic with regards
to expecting certain kinds of data at points in the storm timeline. For example, we see on
the non-verified accounts that spam is used early in the morning on March 1st while
verified tweets are exclusively giving forecasts and warnings.
Figure 15 - Tweet Topic Activity by Hour (Verified)34 Figure 16 - Tweet Topic Activity by Hour (Non-verified) Figure 17 - Percentage of Tweet Topic by Hour (Verified)
35

Figure 18 - Percentage of Tweet Topic by Hour (Non-verified)
36
                                      CHAPTER 5

                                    CONCLUSIONS ,

5.1   Thesis Summary

        By answering our proposed research questions surrounding the use of verified

Twitter accounts during crisis events, we are better able to visualize and understand this

aspect of crisis informatics. Verified accounts represent a personal brand or organization

and are seen to tweet more informative, on-topic information during the crisis event.

Previous research looking critically at information credibility trends on Twitter found

traits that exist in verified accounts lead to more credible information shared and is

relevant to our findings [28]. We show that verified accounts stay on topic more often,

tweet a higher percentage of informative tweets, have more positive sentiment in their

messaging, tweet less spam, and tweet more original content regarding this Nor’easter

crisis event.

5.2   Limitations

        Data collection limitations exist in the Twitter API; whether paying Twitter for

historical data, streaming real time data, or searching near history data, there are

limitations. Twitter has a paid Historical Tweet API that allows the user to retrieve data

all the way back to the first tweet but limits the number of requests made. To make

reasonable observations a lot of data may need to be collected making research

prohibitively expensive. Streaming data and the search API will not return every tweet, as

some tweets are not indexed (distributed database issues) or removed for other reasons.
37
Other tweets may miss collection because of misspelling or lack of location information
as scripts query the Twitter API for those fields.
The severity of the crisis event of study and other characteristics would likely
change the data collection methodology. For the Nor’easter, the location was
geographically too large for a location query using the Twitter API. With a smaller crisis,
it would be possible to catch almost all tweets coming out of an area (if the tweets have
location data). Limitations exist on both sides of the service, Twitter has limitations for
collection and users limit what can be collected by not using trending words or not
including location data in tweets. For example, if a user tweets “I’m freezing to death in
my home,” it will not be found by common keywords like storm, Nor’easter, help, crisis,
etc. It may also not be seen by location queries if they do not tag a location.
Our methodology for data collection was based on the type of crisis event, size of
event, and the trending status surrounding the event. The amount of data we obtained was
sufficient to make observations within the limitations Twitter imposes.
5.3 Future Work
Because of the exploratory nature of this thesis and the proposed research
questions, we expected to also uncover more questions as data was collected and
analyzed. In order to stay on topic and relevant to our proposed questions, we analyzed
data with the intent to answer the research questions directly. There are two avenues of
future work related to this thesis 1) further analysis on our collected data and 2) similar
analysis on other crisis event types.38
5.3.1 Further Analysis on Nor’easter Data Collected
The amount of data returned by the Twitter API can be quite thorough (e.g.,
location data, time, retweet status, account statistics, etc.). While we did our best to
answer the questions proposed, from the data collected there are several other questions
that could be addressed:
What type of content received the most retweets (relevant to the crisis
event)?
What user types and topic categories were favorited the most according to
the Twitter API?
Further breakdown of sub-categories; types of businesses, types of news
media, types of organizations, types of entertainment tweets, etc.
Location based questions. Where are these tweets coming from? Types of
tweets mapped with location data. One limitation we found is very few
tweets contained location data but almost all verified accounts had a
location in the account description (at a higher rate than non-verified
accounts).
Retweet and organic retweet statistics mapped over time to understand
when users are retweeting messages or creating original content in context
of the storm timeline.
There are so many dimensions to the data collected that it would be difficult to
address all questions or possible data comparisons in the space of one thesis. For
example, location comparisons are difficult because only 1% of tweets we collected
included location information and a larger data collection would be needed to see trends.You can also read